

Translate this page into:
Crystallization kinetics study of In-doped and (In-Cr) co-doped TiO2 nanopowders using in-situ high-temperature synchrotron radiation diffraction
⁎Corresponding author at: Tel.: +966 13 827 4155; fax: +966 13 826 9936. halbatran@iau.edu.sa (H.M. Albetran)
-
Received: ,
Accepted: ,
This article was originally published by Elsevier and was migrated to Scientific Scholar after the change of Publisher.
Peer review under responsibility of King Saud University.
Abstract
The influence of TiO2 nanopowder doping with 4 wt% indium and 2 wt% each of indium and chromium on phase transformation was studied. Samples were heated from ambient temperature to 950 °C in sealed quartz capillaries, and in-situ synchrotron radiation diffraction measurements were obtained. Capillary sealing yielded an increase in capillary gas pressure to 0.42 MPa at 950 °C in proportion to absolute temperature by Gay-Lussac’s Law. The initial synthesized samples were amorphous, and crystalline anatase appeared at 200 °C. Crystalline rutile appeared at 850 °C for the nanomaterials that were doped with In and In and Cr. A change in sealed-capillary oxygen partial pressure yielded a decrease and an increase in crystallization temperature, respectively, for the amorphous-to-anatase and anatase-to-rutile transformations. Crystalline titania (anatase and rutile) formed from the amorphous titania by 800 °C and 900 °C, for materials doped with In and In-Cr, respectively. The anatase concentration that was dominant in the In-doped materials up to 950 °C and the higher rutile concentration for the In-Cr doped materials from 900 to 950 °C results from the defect structure that was induced by doping. Cr-ions in the Ti sub-lattice retarded the transformation of anatase to rutile when compared with the retarding effect of mixed In/Cr ions. The transformation results because of the relatively smaller radius of Cr-ions when compared with the In-ions. The differences in phase-transformation kinetics for In, In-Cr and for undoped nanopowders in the literature agree with the calculated transformation activation energies.
Keywords
Rutile
Anatase
TiO2 (titania)
Sol-gel synthesis
Nanopowders
Phase transformation
SRD

1 Introduction
Anatase and rutile are two common crystalline phase of semiconductor oxide material TiO2 (titania) (Hanaor and Sorrell, 2011; Albetran et al., 2014a, 2014b; Albetran et al., 2017). The band gaps for anatase and rutile are 3.20(8) eV and 3.00(5) eV, respectively, with activation by ultraviolet irradiation (Pascual et al., 1978; Tang et al., 1994; Sanjines et al., 1994; Tang et al., 1995; Wang and Lewis, 2006; Albetran et al., 2016a). However, these band gaps limit activation by natural solar or artificial visible light, because only a small ultraviolet fraction of solar light can be utilized (Takeuchi et al., 2000; Yamashita et al., 2003; Ghicov et al., 2006; Wu and Long, 2011; Yu et al., 2013). Thus, novel approaches have been developed to extend TiO2 absorption from the ultraviolet to the visible-light region (Takeuchi et al., 2000; Yamashita et al., 2003; Ghicov et al., 2006).
TiO2 doping has attracted extensive interest as a method to expand optical absorption to the visible spectral region. Recently, the simultaneous doping of two atom types (or co-doping) into TiO2 has attracted attention because it can result in a higher photocatalytic activity than may be observed by single-element doping (Alim et al., 2019). This can be ascribed to a synergistic effect on the TiO2 band gap of two-elements co-doing because of the creating of two internal band gaps, one of which lies above the valence-band (VB) edges, and one that lies below the conduction band (CB).
To convent modified TiO2 to activity under visible-light irradiation, the sol-gel method has been used by doping with metals and non-metals (Alim et al., 2019; Hassan et al., 2019; Shaban, 2019; Sangchay et al., 2012). Sol-gel synthesis is simple and cost-effective for nanomaterial fabrication and their associated industrial applications (Albetran et al., 2015a, 2017; Jantawasu et al., 2009). Nanoscale TiO2 particles from sol-gel synthesis have a large specific surface area. This area increases the photodegradation rate by particle-size-sensitive photocatalytic reactions on the TiO2 photocatalyst surface (Takeuchi et al., 2000; Yu et al., 2013; Gnanasekaran et al., 2015; Reddy et al., 2001; Pan et al., 2012; Albetran et al., 2013).
TiO2 is a transition-metal oxide, and it exists in various crystalline phases (e.g., anatase & rutile). Crystalline anatase that had formed from amorphous TiO2 transforms to crystalline rutile from 400 to 1200 °C. The anatase-to-rutile transformation temperature depends on many factors, such as the surface area, particle size, synthesis method, atmosphere, and dopant (Albetran et al., 2014a, 2014b, 2015b, 2016b, 2018; Albetran and Low, 2016a, 2016b; Low et al., 2012a, 2012b, 2013; Shannon and Pask, 1965; Eppler, 1987; Gennari and Pasquevich, 1998; Gamboa and Pasquevich, 1992; Zhang and Banfield, 2000; Okada et al., 2001; Moamed and Alsanea, 2020; Plugaru et al., 2004).
In this study, pure, indium (In) and indium-chromium (In–Cr) doped TiO2 nanopowders were synthesized by the sol-gel method. In-situ high-temperature synchrotron diffraction (SRD) was used to study the effects of doping on the crystallization kinetics of TiO2 nanopowders in sealed capillaries from 25 °C to 950 °C. Gay–Lussac’s Law indicates that sealed-capillary heating within this temperature range would result in pressure increase from 0.10 to 0.42 MPa (Fig. 1). Samples were also studied by field-emission scanning electron microscopy (FESEM), energy-dispersive X-ray spectroscopy (EDS), electron backscatter diffraction (EBSD), and laboratory X-ray diffraction (XRD).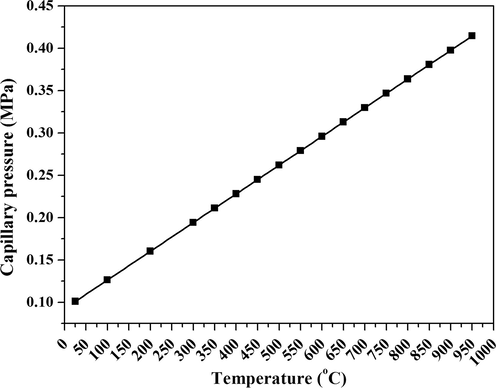
Capillary pressure versus temperature, from Gay-Lussac’s Law.
2 Experimental methodology
2.1 Synthesis of materials
Details of pure/undoped TiO2 nanopowders are given in preliminary studies by the authors (Albetran et al., 2017). Sol-gel synthesis with titanium (IV) isopropoxide material was used (Mw = 284.22 g/mol, Sigma-Aldrich, Castle Hill, NSW, Australia). Organic material evaporation was achieved by mixing the solution magnetically at 100 °C for 60 min. The material was dried at room temperature for 48 h. In and In-Cr co-doped TiO2 nanopowders were synthesized via the same method using titanium (IV) isopropoxide as TiO2 precursor, and indium (III) nitrate nanohydrate (Mw = 300.83 g/mol, Sigma-Aldrich) and chromium (III) nitrate nanohydrate (Mw = 400.15 g/mol, Sigma-Aldrich) as sources for indium and chromium doping (co-doping), respectively, of TiO2 nanopowders.
Indium (III) nitrate nanohydrate (100 mg) or 50 mg each of indium (III) nitrate nanohydrate and chromium (III) nitrate nanohydrate were dissolved in ethanol (1 ml, Mw = 46.07 g/mol, 99.5% purity, Sigma-Aldrich). Titanium (IV) isopropoxide (9 ml, Mw = 284.22 g/mol, Sigma-Aldrich) was added to the indium (In) or indium (In) – chromium (Cr) solution. The calculated chemical doping concentrations were 1 wt% In for In-doping, and 0.5 wt% each for In and Cr co-doping, but these concentrations were increased in the next step. Organic-material evaporation was achieved by magnetic mixing of solutions for 1 h at 100 °C. The materials dried at room temperature for 48 h to obtain 2.4 g per sample. Thus, the approximate dopant concentrations were 4 wt% In-doping and 2 wt% for In and Cr co-doping.
2.2 Materials characterization
2.2.1 Field emission scanning electron microscopy
Field-emission scanning electron microscopy (FESEM, Zeiss, Neon, 40EsB, Germany) was used to study the In and In-Cr doped TiO2 nanoparticle sample morphologies after in-situ high-temperature SRD measurements. A sputter-coated layer of 3 nm of platinum was used prior to the FESEM as this increases the conductivity and improves the image contrast.
2.2.2 Transmission electron microscopy
Small samples (∼5 mg) were ground and suspended in ethanol using ultrasonication for 5 min. Two drops of the resultant suspension were placed on carbon-coated copper grids for transmission electron microscopy (TEM) imaging using JEM2011 TEM (JEOL, Japan) with a LaB6 filament operating at 200 kV. The microscope was equipped with an energy-dispersive X-ray spectroscopy attachment (EDS). EDS was used to determine the sample elemental composition.
2.2.3 Electron backscatter diffraction
For samples heated in air under normal pressure, electron backscatter diffraction (EBSD) analyses were performed by SEM (Tescan, Mira3) with a Nordlys Nano EBSD detector. Samples were prepared using an epoxy resin to encase the powder particles. The specimen surface was polished using a series of successively finer grades of diamond paste. The polishing stage was necessary to expose an unaltered, reasonably flat sample cross section. Specimens were coated with an 8 nm-thick carbon layer and then mounted with conductive carbon sticky tabs onto stubs to avoid charging. Samples were tilted to 70 °C from horizontal using a SEM-protected holder. The operating conditions for EBSD collection were: an acceleration voltage of 20 kV, a spot size of 23 nm, a working distance of 19.7 mm, and a beam current of 842 pA. Amorphous and crystalline areas for the polished cross-sectional TiO2 samples were studied, and phase identification for crystalline titania were determined using EBSD software (AZtec Software, Oxford). An electron beam was directed at a point of interest on tilted samples. An optimization pattern tool was used to identify amorphous and crystalline areas; an image was produced on a phosphor screen by detecting a Kikuchi pattern, which is generated by electron-beam interaction with only the crystal structure in the sample surface. Kikuchi patterns were captured by a high-speed and high-sensitivity charge-coupled device (CCD) camera behind a phosphor screen and transferred to a computer for further processing.
2.3 In-situ high-temperature synchrotron radiation diffraction
Albetran et al. (2017) provides details of the in-situ SRD data-acquisition technique. In brief, samples that were pure/undoped, doped with In, and doped with In- and Cr were ground and loaded into 80-mm long and 1.00-mm diameter quartz capillary (Charles Supper Company, USA) with a sealed and open-ended funnel shaped. The capillaries were filled to one-third with the synthesized TiO2 powder sample and packed in an ultrasonic bath. The capillaries were broken from the open funnel sides, sealed using a nitrogen flame, and inserted into 10-mm brass stub holders for SRD studies at the Australian Synchrotron. The SRD patterns were measured by using Debye-Scherer geometry, a Mythen II microstrip X-ray detector, and 15.0204 keV photon energy (λ = 0.0825 nm) for 2θ = 5–84° with a 3-min acquisition time per SRD pattern.
Fig. 2 shows the non-isothermal in-situ SRD heating protocol. The upper temperature limit was set to 950 °C because no anatase-to-rutile transformation occurred up to 800 °C for pure TiO2 as reported in a previous study by the authors (Albetran et al., 2017). SRD patterns for the In-doped or In-Cr co-doped materials were obtained at room temperature, in 100 °C increments from 100 °C to 300 °C, and then in increments of 50 °C from 350 °C to 950 °C, at 2 °C/min.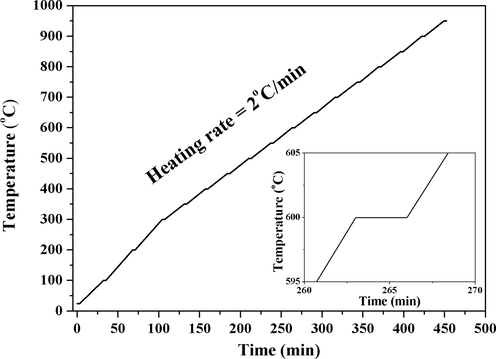
Heating protocol for non-isothermal in-situ SRD with 3-min SRD data-acquisition time indicate by plateaus.
2.4 Ex-situ XRD
Albetran et al. (2017) provides a detailed account of the ex-situ XRD data acquisition. In brief, samples were heated in air at atmospheric pressure and 10 °C/min from room temperature to 700 °C and cooling to ambient temperature before XRD patterns were obtained. The XRD patterns (Bruker D8 Advance diffractometer) of TiO2 powders that had been doped with In- and In and Cr were collected using Cu Kα radiation with λ = 0.15419 nm, 2θ = 7–120°, a sample spinning speed of 30 rpm, scanning speed of 0.0149°/s, and an accelerating voltage of 40 kV.
2.5 Phase identification and quantitative analysis
DIFFRAC. EVA software (Version 3.1, 2012) was used to match peak positions and intensities in the in-situ SRD and ex-situ XRD patterns. Phase identification and using the International Centre for Diffraction Data (ICDD) powder-diffraction file database.
Relative pattern-fitting was used to determine relative phase levels of crystalline TiO2 phases by using TOPAS (Bruker AXS, Version 4.2). Rietveld refinements yielded 2θ0; the pattern background; the peak shape parameters, lattice parameters, and a scale factor to compute the relative crystalline TiO2 phases for the peaks; and temperature-dependent lattice parameters. The Rietveld method was used to calculate the extent of transformation of the anatase to rutile in samples that were doped with TiO2 and calcined between 850 °C and 950 °C and this result was supported by the Spurr and Myers line-ratio approach. Crystal structures for anatase (ICSD 202242) and rutile (ICSD 64987) were used in a refinement, and the method Albetran et al. (2014a) was used to determine the Rietveld phase-abundance ratios.
The amount of amorphous and crystalline TiO2 were determined each temperature by using the anatase and rutile relative phase levels from Rietveld analysis, and the SRD pattern background dependence on temperature was used to determine the levels of amorphous titania by using the novel SRD method (Albetran et al., 2015b, 2016b). In summary, the in-situ SRD background-temperatures were determined by assuming that the amorphous scatter that yields background B(T) at temperature T is given by component BA(T), and component BS results from atomic X-ray scatter (Compton and Rayleigh). Thus, the amorphous titania weight percentage (wtAm%) is:
b, which is the rate of the amorphous transformation was 0.0089 °C−1 and 0.0087 °C−1 for the In and In-Cr co-doping results, respectively.
2.6 Estimation of activation energies
Matusita et al.’s and the Arrhenius equations were modified to estimate activation energies for the phase transformations for the transformations of amorphous material to anatase and that of anatase to rutile from non-isothermal SRD data analysis (Albetran et al., 2015b, 2016b). The modified equation of Matusita et al (1984) is:
A modified version of the Arrhenius equation is:
3 Results and discussion
3.1 Imaging of microstructures
The morphologies and microstructures of samples were characterized by FESEM and TEM. Fig. 3a and b illustrate a typical secondary electron FESEM image with EDS spectra for In, and In-Cr co-doped TiO2 nanopowders, respectively, as characterized following the SRD measurements. The qualitative EDS spectrum of the In-doped and In-Cr co-doped samples showed strong signatures for Ti, O, and Pt, with the Pt content originating from the platinum coating. Small/weak In and In–Cr signatures resulted for the In-doped and co-doped TiO2 nanopowder, respectively. Quantitative EDS was performed on flat samples, which approximated nanopowder samples. Thus, the EDS for the nanopowder was collected from a small square to minimize the effect from the sample not being flat. It was assumed that the Pt peak from the platinum coating was negligible. Quantitative EDS analysis confirmed and provided evidence of titania with a TiO2 chemical formula structure (32.14(20) % Ti Kα and 64.23(20) % O Kα), which was almost the same for pure samples in preliminary studies by the authors (Albetran et al., 2017). The existence of In-doping and In-Cr co-doping was verified by the quantitative EDS analysis that indicates 3.63(50) % In Kα for In-doping and 1.82(50) % In Kα and 1.81(50) % Cr Kα for In-Cr co-doping. A typical secondary electron image of pure TiO2 nanopowders that were heated to 800 °C in a sealed capillary was shown in the preliminary study by the authors (Albetran et al., 2017). Uniform sized 85 ± 31 nm nanopowders were observed for pure/undoped TiO2 nanopowder (Albetran et al., 2017), and this size range increased to 178 ± 44 nm for In-doped TiO2. The In-Cr co-doped TiO2 nanopowder particles become non-homogeneous, diverse in appearance and type, nonspherical, and have a strict shape tolerance of ∼218 ± 64 nm. Fig. 4 shows a typical TEM image of the In-Cr TiO2 nanopowders following the SRD experiment. The nanoparticles were ∼200 nm, which is consistent with the FESEM result in Fig. 3b, with there being nano-agglomeration of ∼40 nm crystallites. This indicates that co-doping had promoted the titania phase transformation and grain growth.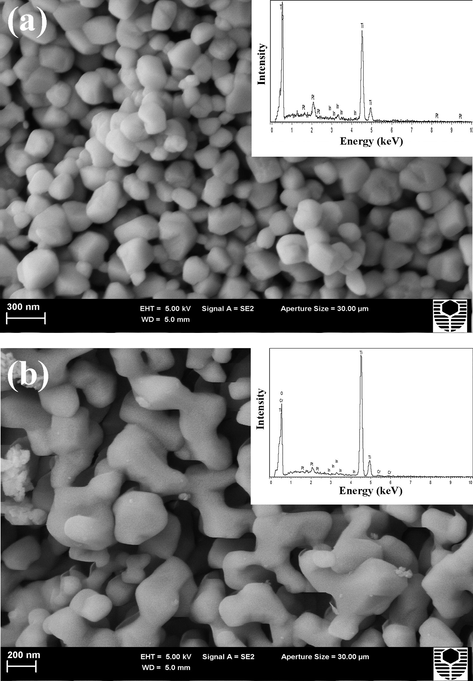
FESEM photomicrographs with EDS spectra for (a) pure, (b) In-doped, and (c) In-Cr co-doped TiO2 nanopowders following SRD experiments.
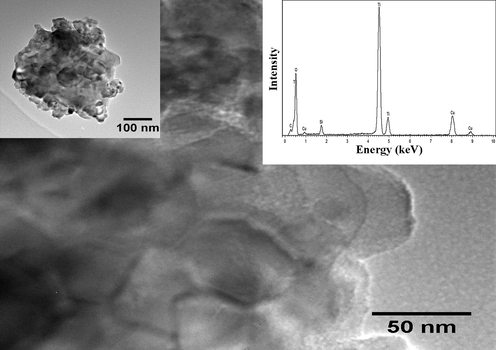
TEM image with EDS of In-Cr co-doped TiO2 nanopowders following SRD experiment.
The TEM-EDS spectrum for In-Cr TiO2 recorded after the SRD measurements is shown in Fig. 4. The spectrum identifies Ti and O, Si, C, and Cu. C and Cu features result from the carbon-coated copper grids and organic solvent, with the Si content resulting from the capillary. The Ti and O lines confirm the presence of TiO2 in the material (see EBSD section (Figs. 5, and 6), SRD patterns, crystalline anatase, and rutile are shown in Fig. 7, and Lab-XRD patterns (Fig. 8)). TEM-EDS does not detect In and Cr signatures because the TEM samples are too thin (no nano-agglomeration) for a focused probe to be contained within the In and co-doped samples, i.e., primary beam transmission occurs because the electron beam can pass through the entire sample. This prevents the beam from scattering in the sample. The FESEM-EDS spectra of In, and In-Cr doped nanopowder after SRD measurement (Fig. 3) show In signatures for In-doping, a strong Ti and O presence in co-doped In and Cr signatures, and Pt signatures from platinum coating for all the samples. FESEM–EDS detected In and Cr because of the greater FESEM sample thickness when compared with the TEM samples.![Low-magnification secondary-electron SEM images show amorphous and crystalline titania areas for (a) In-doped TiO2 nanopowders and (b) In-Cr co-doped TiO2 nanopowders. [Am: amorphous area and Cry: crystalline area (anatase and rutile)].](/content/184/2020/13/2/img/10.1016_j.arabjc.2019.04.003-fig5.png)
Low-magnification secondary-electron SEM images show amorphous and crystalline titania areas for (a) In-doped TiO2 nanopowders and (b) In-Cr co-doped TiO2 nanopowders. [Am: amorphous area and Cry: crystalline area (anatase and rutile)].
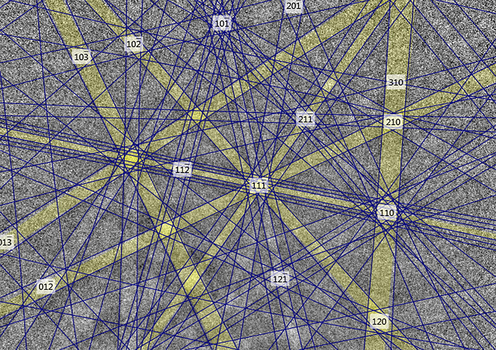
Backscatter Kikuchi pattern (BKP) of crystalline rutile from In-Cr co-doped TiO2 at 20 keV, acquired with CCD camera.
![In-situ high-temperature SRD plots stacked for (a) In-doped TiO2 nanopowders, and (b) In Cr co-doped TiO2 nanopowders that were heated in sealed capillaries from 25 °C to 950 °C. [A: anatase, R: rutile, In: indium titanium oxide (In2TiO5), X: unknown phase].](/content/184/2020/13/2/img/10.1016_j.arabjc.2019.04.003-fig7.png)
In-situ high-temperature SRD plots stacked for (a) In-doped TiO2 nanopowders, and (b) In Cr co-doped TiO2 nanopowders that were heated in sealed capillaries from 25 °C to 950 °C. [A: anatase, R: rutile, In: indium titanium oxide (In2TiO5), X: unknown phase].
![Ex-situ XRD plots showing In and In Cr co-doped TiO2 nanopowders heated in air at 10 °C/min from 25 to 700 °C. [A: anatase, R: rutile, C: corundum (Al2O3), and Y: unknown phase].](/content/184/2020/13/2/img/10.1016_j.arabjc.2019.04.003-fig8.png)
Ex-situ XRD plots showing In and In Cr co-doped TiO2 nanopowders heated in air at 10 °C/min from 25 to 700 °C. [A: anatase, R: rutile, C: corundum (Al2O3), and Y: unknown phase].
3.2 Phase identification using EBSD
Fig. 5 shows the secondary electron SEM images in the amorphous and a crystalline titania area for In and In-Cr co-doped TiO2 nanopowders after they cooled to room temperature from 700 °C following the ex-situ XRD experiment. The amorphous titania areas are softer, more polished and smoother than the crystalline areas. The crystalline areas in the In-Cr doped TiO2 sample appear to be larger than the In-doped TiO2 sample because amorphous-to-crystalline titania transformation was accelerated by the presence of Cr-ions.
A crystalline area for In and In-Cr co-doped TiO2 nanopowder was identified in a Kikuchi pattern acquired at 20 keV from a single point on each of the samples. Identification was conducted against the ICDD-PDF database. Fig. 6 shows the backscatter Kikuchi pattern for crystalline rutile from In-Cr co-doping, which was similar to that for In-doped TiO2 nanopowders.
3.3 SRD patterns from sealed capillary heating In-situ
Fig. 7 compares the stacked SRD plots for In- and In-Cr doped samples during heating in sealed capillaries from 25 to 950 °C. Crystalline anatase formed first at 200 °C for pure (Albetran et al., 2017) and doped samples. This result is in contrast with the literature crystallization temperature of anatase that is lowest at 415 °C for pure TiO2 powders that are heated under normal pressure in air (Okada et al., 2001). The crystallization temperature increased to 438, 475, 496, 554, 577, and 609 °C in the presence of 3, 5, 7.5, 10, 15, and 20 mol% SiO2, respectively (Okada et al., 2001). The presence of foreign elements is one factor that affects titania transformation kinetics at elevated temperature. Partial pressure is another factor that was considered in this study. The formation of anatase at a significantly lower temperature results from the presence of an oxygen-rich environment in sealed capillaries (∼0.16 MPa at 200 °C) – see Fig. 1.
In contrast, with the formation of crystalline anatase at a much lower temperature when compared with heating at atmospheric pressure, crystalline rutile was observed in both doped samples at 850 °C, which is ∼170 °C higher when compared with the formation of pure rutile powder (Okada et al., 2001). Nanopowders of high purity show a transformation of anatase to rutile from ∼600 to 700 °C (Hanaor and Sorrell, 2011). The anatase-to-rutile transformation was affected by the high pressure (∼0.38 MPa at 850 °C) created in sealed capillaries at elevated temperature, which reduced the phase transformation, and then increased the transformation temperatures (Iida and Ozaki, 1961).
Crystalline rutile became unstable at high temperature and pressure (950 °C and 0.42 MPa) and starts transforming to a new phase. For In-doped TiO2 nanoparticles, the rutile transformed partially to indium titanium oxide (In2TiO5) (PDF # 00-030-0640), which can be prepared by heating “TiO2” and “In2O3” in a closed system at 1250 °C for 24 h (Senegas et al., 1975). The two highest intensities In2TiO5 peaks occur at 16.23, and 15.58°, which correspond to the d-spacings of 0.2923, and 0.2861 nm, respectively. For In-Cr co-doped TiO2 nanopowders, rutile started transforming into an unknown phase with two peaks at 15.56° and 16.70°, which correspond to d-spacing of 0.305 nm and 0.284 nm, respectively. This new phase could not be identified using the ICDD–PDF database.
3.4 Effect of capillary pressure in the SRD as determined by ex-situ XRD
Ex-situ XRD patterns are shown in Fig. 8 for In- and In-Cr TiO2 nanopowders after being heated at 10 °C/min in air from 25 to 700 °C and cooling to room temperature. The temperature and heating rate were chosen from literature to observe crystalline anatase and rutile. Literature data indicate that the rutile and anatase crystallization temperatures span 415 °C and 609 °C, and 400 °C and 1200 °C, respectively (Shannon and Pask, 1965; Eppler, 1987; Gennari and Pasquevich, 1998; 1992; Zhang and Banfield, 2000; Okada et al., 2001; Moamed and Alsanea, 2020; Plugaru et al., 2004; Low et al., 2012a, 2012b, 2013). Fig. 9 compares plots of (i) the room-temperature ex-situ XRD patterns of samples that were cooled from 700 °C, and (ii) the in-situ SRD pattern at 700 °C. Crystalline anatase and rutile were observed for both samples following the ex-situ XRD experiment with crystalline rutile comprising 10.60 wt% for In-doping and 8.82 wt% for co-doping and crystalline titania. The phase composition indicates that a sequential transformation of amorphous material to anatase results followed by a transformation of anatase to rutile because anatase after the ex-situ XRD experiment was observed at a lower temperature than 700 °C. The in-situ SRD experiments show that the transformation of anatase to rutile was affected by the high pressure created by sealed capillaries (i.e., closed system), when compared with the ambient oxygen partial pressure in the ex-situ XRD experiments. A high partial pressure decreased crystallization temperatures of the anatase, which may be attributed to an enriched oxygen environment. However, an increase in oxygen partial pressure that resulted from an increase in temperature inside the capillary inhibited the anatase-to-rutile phase transformation because relaxation is prevented in the anatase structure.![Stacked plots of ex-situ XRD after samples were cooled to ambient temperature from 700 °C and in-situ SRD at 700 °C for In and In Cr co-doped TiO2 nanopowders. [A: anatase, R: rutile, C: Corundum (Al2O3), Y: unknown phase].](/content/184/2020/13/2/img/10.1016_j.arabjc.2019.04.003-fig9.png)
Stacked plots of ex-situ XRD after samples were cooled to ambient temperature from 700 °C and in-situ SRD at 700 °C for In and In Cr co-doped TiO2 nanopowders. [A: anatase, R: rutile, C: Corundum (Al2O3), Y: unknown phase].
Fig. 10 shows typical in-situ residual SRD Rietveld plots for In- and co-doped TiO2 nanoparticles at 900 °C. The goodness of fit or quality can be determined from the global values (R-factors), which for In-doped TiO2 nanopowders were Rexp = 4.26%, Rwp = 5.99%, RB (anatase) = 4.26%, and RB (rutile) = 1.91% and Rexp = 3.71%, Rwp = 7.29%, RB (anatase) = 6.18%, and RB (rutile) = 3.36% for the co-doped TiO2 nanopowders. The goodness-of-fit (GOF) was 1.40 for In-doped TiO2, and 1.97 for co-doped TiO2 nanopowders.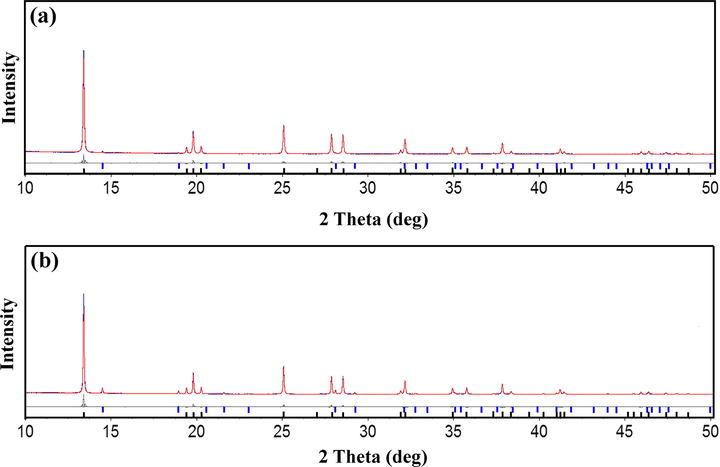
Difference plots for SRD Rietveld data for (a) In-doped and (b) In Cr co-doped TiO2 at 900 °C. Black crosses: measured patterns; solid red lines calculated patterns. Gray residual plot difference between measured and calculated patterns. Black bars: anatase peak positions; blue bars: rutile peak positions. TOPAS (Version 4.2) was used to compute these plots.
The concentration of crystalline anatase to rutile and amorphous titania were used to determine the absolute amorphous titania, crystalline rutile and anatase (Albetran et al., 2015b, 2016b). Fig. 11 shows the variation in absolute titania levels (amorphous, anatase and rutile) for both samples from 100 to 950 °C. The phase-composition results indicate a transformation of amorphous titania to crystalline anatase followed by crystalline anatase to crystalline rutile. The amorphous-to-anatase transformation rate increased significantly between 100 and 400 °C, which was dependent strongly on an oxygen-rich environment. It appears that a high-oxygen atmosphere speeds up the transformation of amorphous phase to anatase phase. However, for both samples, the atmospheric pressure inhibited the transformation of anatase to rutile because it leads to the formation of titanium interstitials. At elevated temperature, the anatase-to-rutile transformation rate increased more rapidly in the In-Cr than in the In-doped sample. In the In-doped TiO2 nanopowders, 15.05(6)% crystalline anatase converted to crystalline rutile by 950 °C, whereas 57.81(9)% of the anatase had transformed in co-doped TiO2 nanopowders at this temperature. This enhanced rate of transformation of anatase to rutile was very dependent on impurities or doping (Iida and Ozaki, 1961), and increased with In and Cr ions in the samples.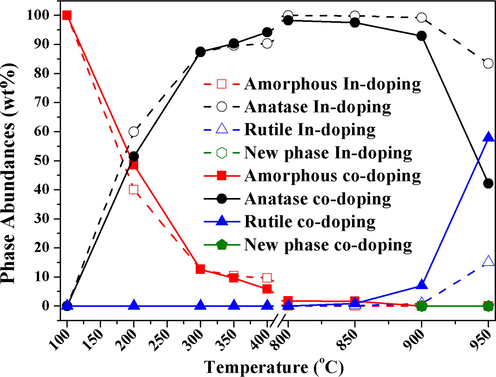
Amorphous titania, crystalline rutile and anatase phase abundances for In and In Cr co-doped TiO2 for 100–950 °C.
3.5 Influence of doping
Deformation of anatase lattice due to the incorporation of In and Cr affects the lattice parameters for both samples with temperature. Anatase of pure/undoped TiO2 nanopowders was compared with doped TiO2 samples. Fig. 12 shows the temperature variations with anatase lattice parameters and volume cell for pure, In-doped, and co-doped TiO2 nanopowders. The determination of anatase lattice parameters from the SRD showed an increase in doped samples relative to the pure sample. The influence of doping on the anatase lattice parameters should be studied at the lowest temperature possible, assuming any or the lowest effect of partial pressure. At 200 °C (∼0.16 MPa), the anatase lattice parameters a for the pure, In, and co-doped sample with In and Cr were 0.37874(16) nm, 0.379205(18) nm, and 0.379180(27) nm, respectively. The anatase lattice parameters c were 0.94978(45) nm, 0.949998(51) nm, and 0.949491(76) nm for the pure, In, and In-Cr samples, respectively. Thus, the volume of cells for both doped samples was higher than for the pure sample, and that for In doping was slightly larger than that for In–Cr doping. The lattice parameter changes suggest that, instead of occupying interstitial sites, the added Cr substitutes for Ti4+, which results in ion incorporation as dopants in the TiO2 lattice. The ionic radii for Cr3+, Cr4+, Cr5+, and In3+ are 0.0615, 0.058, 0.049, and 0.080 nm, respectively. The ionic radius for Cr3+ and Cr4+ does not differ significantly from Ti4+ (r = 0.0605 nm), which can enter the anatase structure (Okada et al., 2001). Changes in anatase lattice parameters have been used to determine the incorporation of foreign ions in the anatase structure (Okada et al., 2001; Akhtar et al., 1992; Yoshinaka et al., 1997). The effect of foreign ions valency is complicated by oxygen vacancy formation (i.e., increases the transformation of anatase to rutile) or interstitial Ti3+ (i.e., decreases the anatase-to-rutile transformation) and lattice deformation because of the incorporation of a foreign ionic radius that differs from Ti4+ (Okada et al., 2001). The ease with which anatase can be transformed to rutile in the co-doped sample arises from a relatively smaller Cr ion radius that occupies the Ti sub-lattice substitutionally when compared with In ions in the In-doped sample, whereby the In concentration was higher. These results imply that doped In ions and Cr ions substitute in the Ti sublattice and inhibit the TiO2 phase transformation for both materials. The difficult transformation of anatase to rutile for In-doped samples when compared with In-Cr co-doped samples is believed to occur because the In3+ radius (0.080 nm) is larger than the Cr3+ radius (0.0615 nm). Part of the Ti4+ (0.061 nm) is reduced, which yields an increase in rigidity of the structure, and does not allow Ti bonding environment to relax. The high capillary gas pressure and the higher temperature (from 0.33 MPa at 700 °C to 0.42 MPa at 950 °C) allows for no relaxation by anatase bond breakage and rutile bond formation. The high oxygen pressure decreased the vibration amplitude, and then decreased the thermal expansion of anatase atoms at elevated temperature. Thus, the thermal expansion coefficients (TECs) of anatase for doped TiO2 nanopowders increased slowly with temperature when compared with the pure sample, and that for In doping was slower than that for In–Cr co-doping. Therefore, the cell volumes of anatase will be smaller for doped samples than for the pure sample (which was heated to 800 °C), and that for In-doped was slightly smaller than that for In–Cr co-doping at elevated temperature.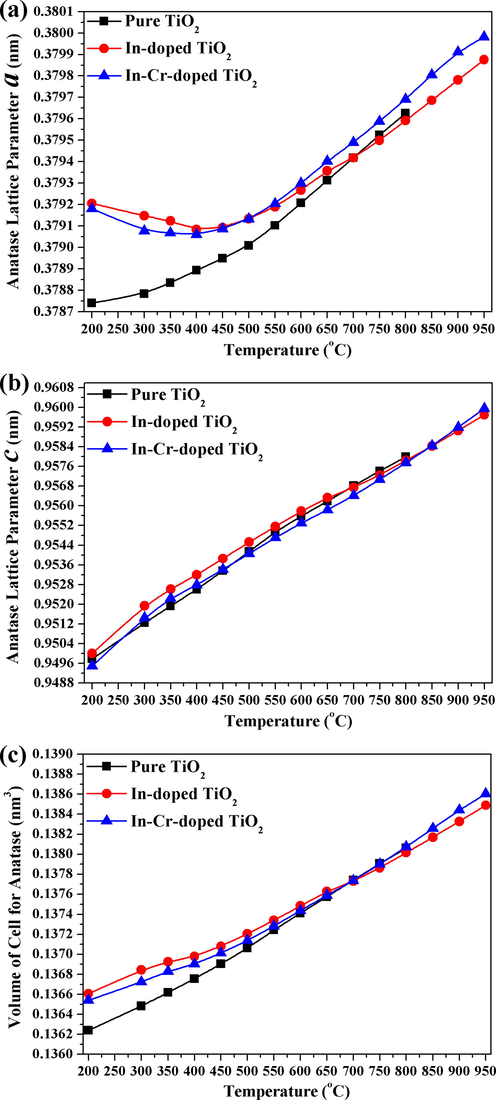
Temperature change with anatase lattice parameters a and c, and cell volume for In-doped TiO2 and In-Cr co-doped TiO2.
3.6 Crystallization kinetics modelling
The Arrhenius-equation average activation energies are shown with those from Matusita et al. in Table 1 (Albetran et al., 2015b, 2016b). The values of amorphous-to-anatase, and anatase-to-rutile activation energy for this study are comparable with literature values of several TiO2 forms/types, atmospheres, and doping elements. The activation energy for transformation of the amorphous phase to the anatase phase in pure, In, and co-doped material was the same at 7(1) kJ/mol, whereas that for the transformation of anatase to rutile was 518(63) kJ/mol for In-doping and 486(19) kJ/mol for co-doping. An estimate of activation energy for transformation of anatase to rutile was higher than that of other pure TiO2 samples and some doped TiO2 samples (Yoganarasimhan and Rao, 1962; Kumar et al., 1993a, 1993b, 1995; Varghese et al., 2003; Barakat et al., 2005), whereas it is similar to values from doped TiO2 powder (Gennari and Pasquevich, 1998). For In and co-doped TiO2 nanopowder, the apparent activation energies were reduced substantially when compared with 377 kJ/mol for a transformation of pure amorphous phase to anatase phase prepared from sulphate hydrolysis (Yoganarasimhan and Rao 1962). Thus, a high oxygen partial pressure decreased the activation energies considerably for the transformation of amorphous to anatase phase because of the oxygen-rich environment, whereas it increased the activation energy for the transformation of anatase to rutile because titanium formed interstitially at elevated temperature. It appears that the high partial pressure arising from a rich atmospheric oxygen accelerated the transformation of amorphous phase to anatase phase. However, the high partial pressure allows no relaxation by anatase bond breakage and rutile bond formation.
TiO2 format
Amorphous to anatase
Anatase to rutile
Note
Reference
Pure
7(1)
NA
This study
In-doping
7(1)
518(63)
In & Cr co-doping
7(1)
486(19)
Nanopowders
NA
423–527
Fe2O3 doping
Gennari and Pasquevich (1998)
Nanofibers
25(3)
16(3)
V implantation
Albetran et al. (2015, 2016)
45(9)
97(7)
Heated in argon
69(17)
129(5)
Heated in air
Powder
377
NA
Pure
Yoganarasimhan and Rao (1962)
418
NA
0.1% sulphate doping
502
NA
1% sulphate doping
Membranes
NA
147, 213
Kumar et al. (1993a, 1993b)
Powder
NA
213
Kumar et al. (1995)
Nanotubes
NA
264
Varghese et al. (2003)
Nanoparticles
NA
195–222
Barakat et al. (2005)
4 Conclusions
In-situ high-temperature SRD experiments of In and co-doped TiO2 nanopowders in a sealed capillary were conducted to ascertain the effects of partial pressure and co-doping on TiO2 phase transformations.
The following main conclusions can be made:
-
Initially, amorphous samples yielded crystalline anatase at 200 °C and rutile at 850 °C for In and co-doped TiO2 nanopowders.
-
The rate of transformation of anatase to rutile was accelerated for co-doped TiO2 nanopowders when compared with In-doped TiO2 because of the substitution of relatively small Cr ions with a low concentration of Ti being substituted by In in the TiO2 crystal structure.
-
The high partial pressure with increasing temperature inside the glass capillary inhibited the transformation of anatase to rutile because of titanium formed interstitially.
It is concluded that the oxygen partial pressure, which increased with increasing temperature inside the sealed capillary accelerated the transformation of amorphous phase to anatase phase, but inhibited the anatase-to-rutile transformation. However, Cr and In in co-doped TiO2 nanopowders altered/accelerated the phase transformation by substitution of Ti by smaller Cr ions in crystalline TiO2 relative to the In ions.
Acknowledgments
The Australian Synchrotron, Australia (AS132/PD/6516) funded this work. The authors would like to thank Emeritus Prof. Brian O’Connor (Department of Physics and Astronomy, Curtin University) for assistance with the analysis of data. Dr. J. Kimpton (Australian Synchrotron) is gratefully acknowledged for his advice on the instrumentation at the Powder Diffraction Beamline. We thank Ms. E. Miller, Dr. A. Halfpenny, and Ms. K. Merigot (John de Laeter Centre, Curtin University) for assistance with the SEM, EBSD, and TEM analysis, respectively.
References
- Dopants in vapor-phase synthesis of Titania powders. J. Am. Ceram. Soc.. 1992;75:3408-3416.
- [Google Scholar]
- X-ray diffraction study on the in-situ crystallisation kinetics in electrospun PVP/TiO2 nanofibers. Nanostruct Mater. Nanotechnol. VII Ceram. Eng. Sci. Proc.. 2013;34:35-49.
- [Google Scholar]
- Phase transformations and crystallization kinetics in electrospun TiO2 nanofibers in air and argon atmospheres. Appl. Phys. A. 2014;116:161-169.
- [Google Scholar]
- Effect of atmosphere on crystallisation kinetics and phase relations in electrospun TiO2 nanofibres. Ceram. Environ. Energy Appl. II Ceram. Trans.. 2014;246:125-133.
- [Google Scholar]
- Characterization and optimization of electrospun TiO2/PVP nanofibers using Taguchi design of experiment method. J. Asian. Ceram. Soc.. 2015;3:292-300.
- [Google Scholar]
- Effect of vanadium ion implantation on the crystallization kinetics and phase transformation of electrospun TiO2 nanofibers. Appl. Phys. A. 2015;120:623-634.
- [Google Scholar]
- Effect of indium ion implantation on crystallization kinetics and phase transformation of anodized titania nanotubes using In-situ high temperature radiation diffraction. J. Mater. Res.. 2016;31:1588-1595.
- [Google Scholar]
- Crystallization kinetics and phase transformations in aluminum ion-implanted electrospun TiO2 nanofibers. Appl. Phys. A. 2016;122:1044-1053.
- [Google Scholar]
- Effect of calcination on band gaps for electrospun titania nanofibers heated in air–argon mixtures. Mater. Des.. 2016;92:480-485.
- [Google Scholar]
- Activation energies for phase transformations in electrospun titania nanofibers: comparing the influence of argon and air atmospheres. Appl. Phys. A. 2016;122:367-376.
- [Google Scholar]
- Effect of pressure on TiO2 crystallization kinetics using in-situ high-temperature synchrotron radiation diffraction. J. Am. Ceram. Soc.. 2017;100:3199-3207.
- [Google Scholar]
- Dynamic diffraction studies on the crystallization, phase transformation, and activation energies in anodized titania nanotubes. Nanomaterials. 2018;8:122-131.
- [Google Scholar]
- Fabrication of visible light driven nano structured Copper, Boron codoped TiO2 for photocatalytic removal of Lissamine Green B. J. Saudi Chem. Soc.. 2019;23:92-103.
- [Google Scholar]
- Effect of cobalt doping on the phase transformation of TiO2 nanoparticles. Nanotechnology. 2005;5:759-765.
- [Google Scholar]
- Effect of antimony oxide on the anatase-rutile transformation in titanium dioxide. J. Am. Ceram. Soc.. 1987;70:64-66.
- [Google Scholar]
- Effect of chlorine atmosphere on the anatase-rutile transformation. J. Am. Ceram. Soc.. 1992;75:2934-2938.
- [Google Scholar]
- Kinetics of the anatase-rutile transformation in TiO2 in the presence of Fe2O3. J. Mater. Sci.. 1998;33:1571-1578.
- [Google Scholar]
- Ion implantation and annealing for an efficient N-doping of TiO2 nanotubes. Nano. Lett.. 2006;6:1080-1082.
- [Google Scholar]
- Synthesis and characterization of TiO2 quantum dots for photocatalytic application. J. Saudi Chem. Soc.. 2015;19:589-594.
- [Google Scholar]
- Review of the anatase to rutile phase transformation. J. Mater. Sci.. 2011;46:855-874.
- [Google Scholar]
- Silver embedded C-TiO2 exhibits improved photocatalytic properties with potential application in waste water treatment. J. Chem. Arab.. 2019;12:1134-1140.
- [CrossRef] [Google Scholar]
- Grain growth and phase transformation of titanium oxide during calcination. J. Am. Ceram. Soc.. 1961;44:120-127.
- [Google Scholar]
- Photocatalytic activity of nanocrystalline mesoporous-assembled TiO2 photocatalyst for degradation of methyl orange monoazo dye in aqueous wastewater. Chem. Eng. J.. 2009;155:223-233.
- [Google Scholar]
- Textural evolution and phase transformation in titania membranes: Part 1. Unsupported membranes. J. Mater. Chem.. 1993;3:1141-1159.
- [Google Scholar]
- Textural stability of titania–alumina composite membranes. J. Mater. Chem.. 1993;3:917-922.
- [Google Scholar]
- Pore-structure stabilization by controlling particle coordination. J. Mater. Sci. Lett.. 1995;14:1784-1788.
- [Google Scholar]
- High temperature diffraction study of in-situ crystallization of nanostructured TiO2 photocatalysts. J. Aust. Ceram. Soc.. 2012;48:198-204.
- [Google Scholar]
- Effect of chromium-doping on the crystallization and phase stability in anodized TiO2 nanotubes. Developments in Strategic. Mater. Comput. Des. 2012:149-158.
- [Google Scholar]
- A comparative study on crystallization behavior, phase stability, and binding energy in pure and Cr-doped TiO2 nanotubes. J. Mater. Res.. 2013;28:304-312.
- [Google Scholar]
- Kinetics of non-isothermal crystallization process and activation energy for crystal growth in amorphous materials. J. Mater. Sci.. 1984;19:291-296.
- [Google Scholar]
- TiO2/carbon dots decorated reduced graphene oxide compsite from waste car bumper and TiO2 nanoparticles foe photocatalytic applications. Arab. J. Chem.. 2020;13:3082-3091.
- [CrossRef] [Google Scholar]
- Effect of silica additive on the anatase-to-rutile phase transition. J. Am. Ceram. Soc.. 2001;84:1591-1596.
- [Google Scholar]
- Comparing graphene-TiO2 nanowire and graphene-TiO2 nanoparticle composite photocatalysts. ACS Appl. Mater. Interfaces. 2012;4:3944-3950.
- [Google Scholar]
- Fine structure in the intrinsic absorption edge of TiO2. Phys. Rev. B. 1978;18:5606-5614.
- [Google Scholar]
- The effect of annealing in different atmospheres on the luminescence of polycrystalline TiO2. J. Phys. Condens. Matter. 2004;16:261-268.
- [Google Scholar]
- Preparation, characterization, and spectral studies on nanocrystalline anatase TiO2. J. Solid. State. Chem.. 2001;158:180-186.
- [Google Scholar]
- Comparison of photocatalytic reaction of commercial P25 and synthetic TiO2-AgCl nanoparticles. Procedia. Eng.. 2012;32:590-596.
- [Google Scholar]
- Sur un nouveau type d'oxydes doubles M+ IVIn2O5 (M= Ti, V): etude cristallochimique. Acta Crystallogr. Sect. B Struct. Crystallogr. Cryst. Chem.. 1975;31:1614-1618.
- [Google Scholar]
- Solar light-induced photodegradation of chrysene in seawater in the presence of carbon-modified n-TiO2 nanoparticles. Arab. J. Chem.. 2019;12:652-663.
- [CrossRef] [Google Scholar]
- Kinetics of the Anatase-Rutile Transformation. J. Am. Ceram. Soc.. 1965;48:391-398.
- [Google Scholar]
- Photocatalytic decomposition of NO under visible light irradiation on the Cr-ion-implanted TiO2 thin film photocatalyst. Catal. Lett.. 2000;67:135-137.
- [Google Scholar]
- Electrical and optical properties of TiO2 anatase thin films. J. Appl. Phys.. 1994;75:2042-2047.
- [Google Scholar]
- Crystallization and high-temperature structural stability of titanium oxide nanotube arrays. J. Mater. Res.. 2003;18:156-165.
- [Google Scholar]
- Second-generation photocatalytic materials: anion-doped TiO2. J. Phys Condens. Matter.. 2006;18:421-434.
- [Google Scholar]
- Realizing visible-light-induced self-cleaning property of cotton through coating N-TiO2 film and loading AgI particles. ACS Appl. Mater. Interfaces. 2011;3:4770-4774.
- [Google Scholar]
- Photocatalytic degradation of organic compounds diluted in water using visible light-responsive metal ion-implanted TiO2 catalysts: Fe ion-implanted TiO2. Catal. Today. 2003;84:191-196.
- [Google Scholar]
- Mechanism of crystal structure transformations. Part 3. Factors affecting the anatase-rutile transformation. Trans. Faraday Soc.. 1962;58:1579-1589.
- [Google Scholar]
- Formation and sintering of TiO2 (Anatase) solid solution in the system TiO2-SiO2. J. Am. Ceram. Soc.. 1997;80:2749-2753.
- [Google Scholar]
- Synthesis and characterization of Ag/TiO2-B nanosquares with high photocatalytic activity under visible light irradiation. Mater. Sci. Eng. B. 2013;178:344-348.
- [Google Scholar]
- Understanding polymorphic phase transformation behavior during growth of nanocrystalline aggregates: insights from TiO2. J. Phys. Chem. B. 2000;104:3481-3487.
- [Google Scholar]


