

Translate this page into:
CuMn2O4/chitosan micro/nanocomposite: Green synthesis, methylene blue removal, and study of kinetic adsorption, adsorption isotherm experiments, mechanism and adsorbent capacity
⁎Corresponding author. sobhani@kub.ac.ir (Azam Sobhani)
-
Received: ,
Accepted: ,
This article was originally published by Elsevier and was migrated to Scientific Scholar after the change of Publisher.
Peer review under responsibility of King Saud University.
Abstract
In this work, we choose a simple, green hydrothermal method for the fabrication of a pure phase of CuMn2O4 nanostructures in the presence of onion as a capping agent, for the first time. In the next step, we synthesized CuMn2O4/chitosan micro/nanocomposite. The structural analysis of nanostructures and composites showed their purity. The results showed that the prepared micro/nanocomposites have very efficient adsorption for removing methylene blue. In order to design and analyze the experiments were used response surface methodology (RSM). In the optimal conditions, the pH value, adsorbent dose, initial concentration, contact time and stirring speed obtained 6.5, 1.25 g/L, 1 mg/L, 5 min and 500 rpm respectively. Kinetic adsorption and adsorption isotherm experiments were used to investigate the process mechanism and adsorption capacity of CuMn2O4/chitosan composites for methylene blue, for the first time. The value of R2 (0.997) and the qe cal which was close to the qe exp, confirmed the pseudo-first-order kinetic model. Langmuir isotherm model with a qmax of 54.05 mg/g described the experimental data well. KL in this model obtained 0.06, which was in the range of 0–1, which means the adsorption process CuMn2O4/chitosan composite for methylene blue was favorable. Moreover, the present adsorbent can be effectively used up to five adsorption/desorption cycles.
Keywords
CuMn2O4
Chitosan
Composite
Adsorbent
Hydrothermal
Methylene blue removal

1 Introduction
Copper manganite (CuMn2O4) is a mixed metal oxide and can incorporate into the spinel structure. The XRD and neutron diffractions show that the CuMn2O4 has a structure of the cubic spinel and is analogous to CuFe2O4 (Sinha et al., 1958; Radhakrishnan and Biswas, 1974; Verwey and Heilmann, 1947; Enhessari et al., 2016; Popescu et al., 2015; Shoemaker et al., 2009). The mixed copper manganese oxides are of considerable industrial interest due to their potential application (Wollner et al., 1993; Hutchings et al., 1996). The synthesis of the pure CuMn2O4 is challenging. This challenge is due to the formation probability of the secondary phases of Mn. Also, the Cu2+ reduction can prepare Cu in the solution as an impurity. Thus choosing a suitable synthesis technique to prepare pure CuMn2O4 is very important. In this research, we have adopted a simple hydrothermal route to prepare the pure CuMn2O4 utilizing onion as a green capping agent for the first time. Allium cepa, commonly known as onion, is a source of various biologically active compounds and has pharmacological activity. It is a rich source of flavonoids, making it an anti-oxidant and anti-inflammatory agent. The Allium cepa is used as a capping agent in this work to prevent the formation of the aggregated structures.
After the synthesis of CuMn2O4, we synthesized nanocomposites with chitosan. For this purpose, chitosan was added to the CuMn2O4 nanostructures dispersed in water to functionalize, modify and improve surface properties. Chitosan is a natural biopolymer composed of randomly distributed b-(1–4)-linked D-glucosamine (deacetylated unit) and N-acetyl-D-glucosamine (acetylated unit). There are many reports regarding the use of chitosan in food industry as additives, in indigestion tablets, in preparation of dental impressions and tissue engineering because of its positive feature with respect to non-toxicity, biocompatibility and bioavailability. Furthermore, chitosan is of pharmaceutical interest, being already used in wound healing, dermatology, anti-itching, drug delivery and tissue engineering (Yao et al., 2010; Kumar, 2000). Also, chitosan can be used as an adsorbent for dye removal from aqueous solutions due to the presence of amino and hydroxyl groups as active adsorption sites. The use of adsorbents composed of natural polymers has attracted significant interest, and polysaccharides such as chitosan and its derivatives have received particular attention (Reddy and Lee, 2013). This is due to the fact that chitosan is a low-cost and effective adsorbent compared with activated carbons and other adsorbents used in treatment organic or inorganic contaminated water (Bhatnagar and Sillanpää, 2009). There is an abundance of citations in the literature describing the performance of chitosan as an adsorbent for pollutants from water and wastewater including metals, dyes, phenols, fluoride, and phthalates (Julinová and Slavík, 2012).
This paper presents the synthesis of CuMn2O4/chitosan micro/nanocomposites (CMO/C NCs). It reports detailed information on the methylene blue (MB) adsorption as dye pollution in water by these composites. There are some researchers have made to synthesize composites of CuMn2O4. In 2019 Chani et al. synthesized CuMn2O4-chitosan nanocomposite and showed that the as-prepared nanocomposite-based sensors can be used as sensing elements in the meters used for environmental monitoring (Chani et al., 2019). In 2021 Sheikhzadeh and Sanjabi synthesized the different compositions of copper manganese oxide films using the electrochemical deposition technique (Sheikhzadeh and Sanjabi, 2021). Sodium citrate was used as a complex agent in this synthesis. Zhang et al. synthesized CuMn2O4- graphene composites as complex agents. They used two methods, including sol–gel and physical grinding, in 2021 (Zhang et al., 2021). The CuMn2O4-graphene composites exhibited better cyclic stability than pure graphene and CuMn2O4. CMO/C NCs prepared in this work help to remove the MB from the aqueous solution. This research is the first report of the MB removal from the aqueous solution by CMO/C NCs as an adsorbent.
The problem of water pollution is a great concern. Dye is one of the polluters of the environment due to its high use in industries such as textile, food, cosmetic and etc. Acidic and cationic dyes are widely used in industries. MB is a cationic dye. Increased heart rate, quadriplegia, cyanosis, jaundice, shock, Heinz body formation, vomiting, and tissue necrosis are unfavorable effects on human health caused by MB (Ahmad and Kumar, 2010). Thus control of the MB contents is necessary because it is biologically dangerous. Several physicochemical technologies, including coagulation–flocculation, membrane separation, ion exchange, chemical oxidation, electrochemical techniques, adsorption and photocatalysis, have been studied for the purpose of removing MB (Allègre et al., 2006; Marrot and Roche, 2002; Holkar et al., 2016). The dye pollution elimination from the solvent phase by adsorption is a necessary research aspect (Khatooni et al., 2023; Rowshanzamir et al., 2015; Safarzadeh et al., 2022; Tehrani-Bagha et al., 2011).
This work reports the effects of contact time, and the initial concentration of MB on the removal efficiency by the adsorbent and investigates the mechanism of process and capacity of theoretical adsorbent by kinetic adsorption and adsorption isotherm experiments. To obtain the optimal conditions of the surface adsorption process, was used the response surface methodology (RSM). The effects of pH, adsorbent dosage, initial concentration of MB, contact time and agitation speed were investigated. In addition, Langmuir, Freundlich, Temkin, Dubinin-Radushkevich isotherm models were used for estimation of the adsorption capacity of CMO/C NCs. Furthermore, the kinetic studies using the pseudo-first-order, pseudo-second-order, Elovich and intraparticle diffusion kinetic models were accomplished to explain the adsorption process and to determine kinetic coefficients.
The development of a simple and economical route for obtaining nanostructures coated with biopolymers is an important topic and represents the purpose of this study. We used chitosan due to its favorable adsorption properties and large surface area to develop an adsorbent. We found it to be very effective. In this work, taking advantage of the various features of chitosan, our purpose was the preparation of an organic–inorganic composite as a novel adsorbent for MB removal. Despite having less stability as compared to inorganic materials the organic materials are very attractive because of their low density, high flexibility, large surface area and simple fabrication. So, the use of organic–inorganic composite for dye pollution removal is very fascinating.
2 Experimental
2.1 Materials and methods
Cu(NO3)2·3H2O, Mn(NO3)2·4H2O, and NH3 (25%) from Merck company were purchased. An X-ray diffractometer, Philips X′pertPro with Ni-filtered Cu Kα radiation and λ = 1.54 Å, was used to study XRD patterns. The morphologies of the products by field emission scanning (SEM) and transmission (TEM) electron microscopes studied, TESCAN Mira3 FE-SEM and Philips EM208 with 200 kV voltage. Nicolet IS 10 and Evolution 300 spectrophotometers made by the American Thermo scientific company were used to investigate FT-IR and UV–Vis spectra. A VSM (vibrating sample magnetometer) Meghnatis Kavir Kashan Co. made in Kashan (Iran) was used to study the magnetic property of the products.
2.2 Synthesis of CuMn2O4 nanostructures
Hydrothermal is a simple, low-cost, and environmentally friendly process (Emadi et al., 2017; Sobhani and Salavati-Niasari, 2021; Salavati-Niasari and Sobhani, 2013; Sobhani et al., 2012; Sobhani and Salavati-Niasari, 2015; Sobhani and Salavati-Niasari, 2014). This route is applied to synthesize the CuMn2O4 nanostructures in this research. First, Cu(NO3)2·3H2O and Mn(NO3)2·4H2O were dissolved in water, with a stoichiometric ratio of 1:2. Then, onion and NH3 were added drop-wise to the above precursor solution under magnetic stirring. After 25 min stirring, the pH was adjusted to 9 by ammonia. Afterward, the obtained solution was transferred into an autoclave and maintained at 180 ˚C for 12 h. Then autoclave cooled at the rate of 1 ˚C/min, and the product was washed with ethanol and distilled water and dried at 60 ˚C.
2.3 Synthesis of CuMn2O4/chitosan micro/nanocomposites
To prepare CMO/C NCs, first, chitosan was dissolved in acetic acid and distilled water. Then CuMn2O4 was dispersed in distilled water and added to the chitosan solution. The weight ratio of Cu: chitosan was selected 1:1. After 24 h stirring and vaporization of the water of the reaction mixture, the product was washed with distilled water and then ethanol. The obtained composites dried at 60 ˚C temperature (under vacuum).
2.4 Adsorption experiments using CCD model
In this study, the optimization of the MB adsorption onto the prepared adsorbent was accomplished by the response surface methodology of central composite design (RSM − CCD). Hence, pH, adsorbent dosage, MB concentration, contact time and agitation speed were investigated as the independent variables at three levels (−1, 0, + 1), and the removal efficiency of MB was considered as the response factor. Table 1 represents the levels of the three independent variables. Data was analyzed using Design-Expert software version 13 (Stat-ease, Inc., Minneapolis, MN, USA).
Variable
Symbol
Low
High
Levels
pH
A
1
12
1,6.5.12
Adsorbent dosage (g/L)
B
1.25
3
1.25,2.15,3
Contact time (min)
C
5
120
5,62,120
Agitation speed (rpm)
D
100
500
100,300,500
MB concentration (mg/L)
E
1
80
1,40,80
2.5 Kinetic adsorption experiments
Adsorption kinetic models, in addition to determining the adsorption rate, have the ability to predict the adsorption process with time. In order to investigate the effect of contact time on the MB removal from aqueous mediums, the experiments done in 8 beakers. 0.05 g of CMO/C Nc, as adsorbent, and 40 mL of the MB solution with a concentration of 1 mg/L were added to each of the beakers. Then pH was adjusted to 6.5. The solutions were placed on a shaker for 5, 10, 30, 60, 60, 90, 120, and 180 min. After the mentioned times, the adsorbent was separated from the solution using filter paper. Then the residual concentration of MB in the solution was measured using a UV–Vis spectroscopy at λmax = 668 nm. In order to study the effect of the initial concentration of MB on the equilibrium time, the above steps were performed on concentrations of 2, 5, 10, 25, 50, and 80 mg/L.
3 Results and discussion
The main reactions relate to the formation of CuMn2O4 and CMO/C NC can be summarized as follows:
It was found from XRD data that the product formed from Cu(NO3)2·3H2O and Mn (NO3)2·4H2O in the presence of onion and NH3, after 12 h hydrothermal reaction at 180 ˚C, is the pure CuMn2O4. Fig. 1a shows the XRD pattern of CuMn2O4 and confirms the formation of the monoclinic phase of CuMn2O4 (JCPDS card No. 00–010 − 0365) and correspond to diffractions from the (0 0 2), ( −2 0 1), ( −1 1 0), ( −1 1 1), (2 0 1), (2 0 2), ( −1 1 3), ( −3 1 1) and (1 1 3) planes at angles 2theta of 31.362, 33.027, 35.308, 36.96, 40.227, 51.784, 57.052, 59.179 and 64.378˚, respectively. Fig. 1b shows the XRD pattern of CMO/C NC. The diffraction peaks of CuMn2O4 in this figure observe at lower thetas after the coating with chitosan and the formation of the composites. XRD studies have shown that raw chitosan itself is amorphous (Zhu et al., 2010). Fig. 1b shows broader peaks and lower intensities than those in Fig. 1a, which are the signs of lower crystallinity of the composites than the nanostructures. The CuMn2O4 is bonded to the chitosan matrix via hydroxyl and amine groups of the chitosan. It causes the three-dimension structure of the composites to be more disordered. Thus the XRD peaks of CuMn2O4, in Fig. 1b, are not identified clearly. Fig. 1c shows the EDS spectrum of sample 6. The peaks of Cu, Mn, and O with atomic percents 12.74, 23.05, and 64.22 % are observed in this figure, and confirms the formation of CuMn2O4.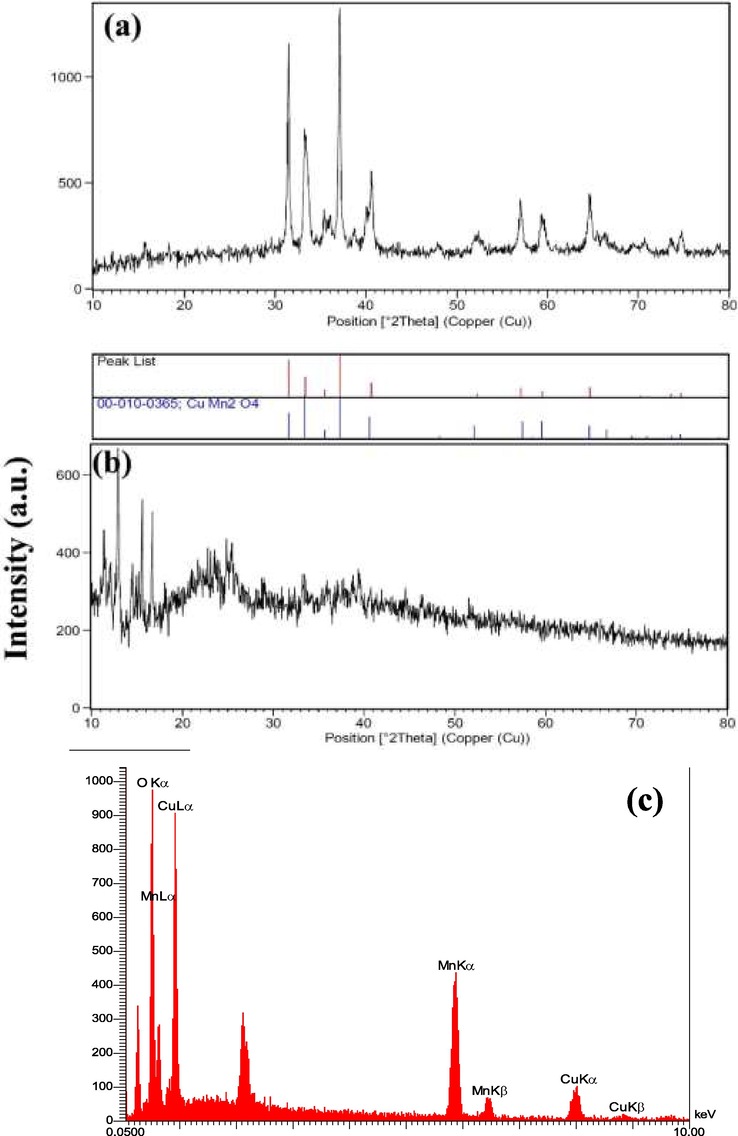
XRD patterns from: (a) the product prepared from Cu(NO3)2·3H2O and Mn(NO3)2·4H2O in the presence of onion and NH3, after 12 h hydrothermal reaction at 180 ˚C (sample 6) and (b) the composite prepared from CuMn2O4 and chitosan, (c) EDS spectrum of sample 6.
The size and morphology of CuMn2O4 and CMO/C NCs examined by SEM microscope. Fig. 2a-c shows SEM images of CuMn2O4 prepared in this work in the different magnifications. The figures illustrate the formation of the microspheres and spherical nanoparticles with diameters of 1–5 µm and 100–300 nm, respectively. SEM image with high magnification in Fig. 2c shows the formation of the agglomerated nanoparticles and microspheres coated by nanoparticles with diameters lower than 10 nm. SEM images of CMO/C NCs in Fig. 2d-f reveal that the chitosan coating does not result in the morphology change. These images show the formation of the microspheres with diameters of 1.5–6 µm and agglomerated nanoparticles with the irregular distribution. Careful observation of the magnified SEM image in Fig. 2f shows that the surfaces of the spheres are not smooth. TEM image was also taken to characterize the morphology of the nanocomposites. This image in Fig. 2g shows the formation of the spheres with diameters ∼ 800 nm.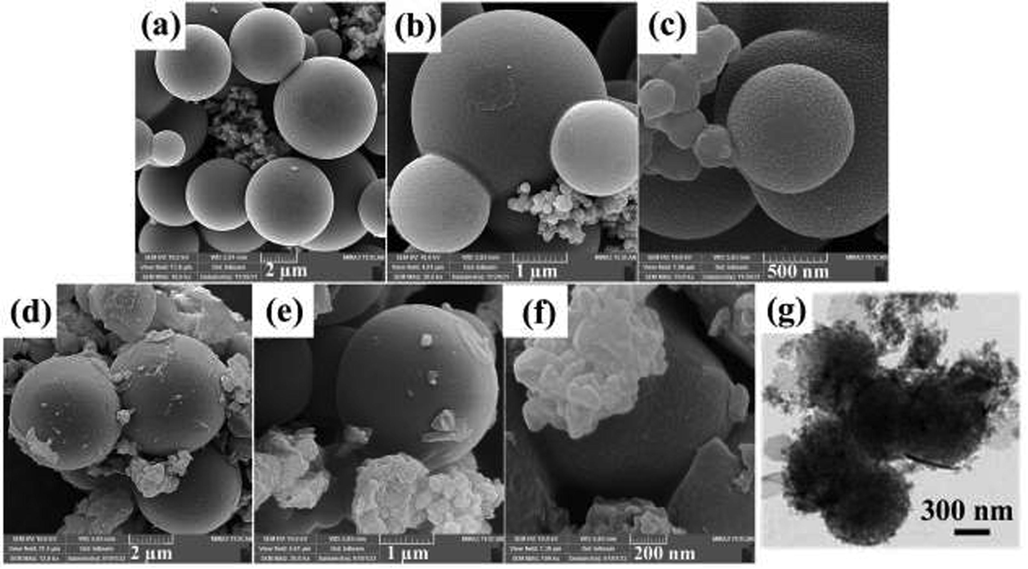
SEM images in the different magnifications of: (a-c) CuMn2O4 nanostructures and (d-f) CMO/C NCs, (g) TEM image of CMO/C NCs.
Fig. 3a shows the hysteresis curve of CMO/C NCs prepared in the present work at room temperature. Superexchange interactions between Mn3+–O2−–Mn4+ (B–B interaction) and Mn3+–O2−–Cu2+ (A–B interaction), and also the orientation of the site of Mn and Cu in copper manganite spinel is the cause of magnetic properties of them (Waskowska et al., 2001; Shoemaker et al., 2009; Buhl, 1969; Vandenberghe et al., 1976). The magnetic measurements carried out by the VSM magnetometer show a pretty weak ferromagnetic behavior in low fields in Fig. 3a. This behavior is because grains in composites may pose uncompensated moments. According to the M−H plot, the coercivity is approximately 179 Oe. In contrast, an antiferromagnetic behavior shows for the composites in high fields. The antiferromagnetic behavior of CMO/C NC can be due to the Mnn+1/Mnn+ redox couple located in the B-sites of the spinels. (Verwey, 1951).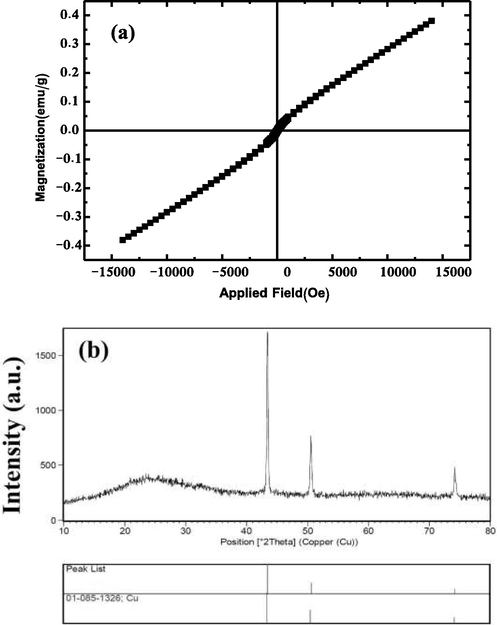
(a) Hysteresis curve of CMO/C NC, (b) XRD pattern from the product prepared from Cu(NO3)2·3H2O and Mn(NO3)2·4H2O after 12 h hydrothermal reaction at 180 ˚C, in the presence of onion and in the absence of NH3.
This work investigates the effect of the capping agent. Details of the capping agent study have been described in the author’s published article (Sobhani, 2022). In the absence of the capping agent, CuMn2O4 and a small amount of CuO impurity are products. Maleic acid, glucose, maltose, and phenylalanine were also used as capping agents. The products prepared with maleic acid were both Cu and MnCO3. The Cu2O, Mn3O4, and Cu were the products formed in the presence of glucose and maltose, respectively. With phenylalanine, the formation of a small percentage of CuMn2O4 and Mn3O4 was observed. Thus maleic acid, glucose, maltose, and phenylalanine were not suitable capping agents to synthesize the copper manganite spinels. Also, the copper manganite formed in the absence of the capping agent was impure. But in this work, we prepared pure CuMn2O4, in the presence of onion as a green capping agent. Thus onion was known as the optimized capping agent in this work. The reaction conditions to synthesize the copper manganites have been listed in Table 2. To prepare CMO/C NCs, the CuMn2O4 prepared in the presence of onion was dispersed in distilled water and added to the chitosan solution. Also, in this study effect of pH on the product type was investigated. The XRD pattern in Fig. 3b shows the formation of the pure Cu with cubic crystal structure and JCPDS card No. 01–085-1326 in the absence of NH3. Thus pH and capping agents are effective agents to synthesize pure copper manganites.
Sample
Cu source
Mn source
NH3
Capping agent
Temperature (˚C)
Time
Product
1
Cu(NO3)2·3H2O
Mn(NO3)2·4H2O
√
−
180
12
CuMn2O4 / CuO
2
Cu(NO3)2·3H2O
Mn(NO3)2·4H2O
√
Maleic acid
180
12
Cu + MnCO3
3
Cu(NO3)2·3H2O
Mn(NO3)2·4H2O
√
Glucose
180
12
Cu2O + Mn3O4
4
Cu(NO3)2·3H2O
Mn(NO3)2·4H2O
√
Maltose
180
12
Cu
5
Cu(NO3)2·3H2O
Mn(NO3)2·4H2O
√
Phenylalanine
120
12
CuMn2O4 + Mn3O4 + Impurity
6
Cu(NO3)2·3H2O
Mn(NO3)2·4H2O
√
Onion
180
12
pure CuMn2O4
7
Cu(NO3)2·3H2O
Mn(NO3)2·4H2O
–
Onion
180
12
Cu
The FT-IR spectrum identified functional groups in the composites and proved MB adsorption on the surface of CMO/C NC. The FT-IR spectra were recorded in the wavelength range 500–4000 cm−1, as shown in Fig. 4. The red curve in Fig. 4 shows the FT-IR spectrum of CMO/C NC. In this curve, the frequencies below 1000 cm-1 belong to the M−O stretching vibrations (Wang et al., 2013). The vibrational bands at about 600–800 cm-1 confirm the formation of Mn-O and Cu–O bands in the as-prepared composite (Abel et al., 2019). The bands centered at 1386 and 1034 cm-1 show the existence of some organic residues in the composites (C-OH groups) (Ma et al., 2016). Also, the two peaks at 1601 and 1558 cm−1 in the red curve correspond to C═O and C-O vibrational modes. The broad peak in the range 2800–3600 cm−1 (including 3368 cm−1) in this curve is related to the stretching vibrations of absorption water on the surface of the composites. The blue and green curves in Fig. 4 are FT-IR spectra of MB and adsorbed MB on the CMO/C NC surface, respectively. The blue curve shows high-intensity peaks of MB. These peaks disappear after the MB adsorption on the CMO/C NC surface. Before and after the adsorption of MB on the surface of the composite, FT-IR spectra of the composite are similar, and only peaks are blue-shifted in the spectrum of the composite after MB absorption. The FT-IR results in Fig. 4 confirm the application of as-prepared CMO/C NC as an effective adsorbent for MB removal from an aqueous solution.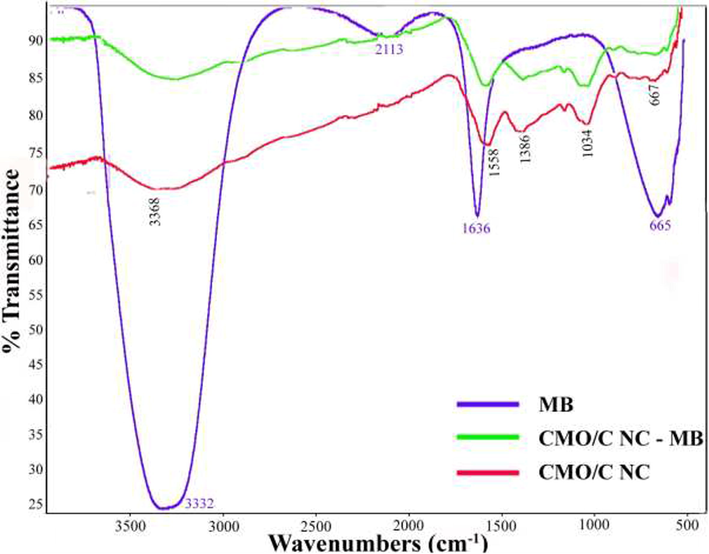
FT-IR spectra of the MB, CMO/C NC, and MB adsorbed on the surface of CMO/C NC.
Fig. 5 shows the UV–Vis absorbance spectra of pure MB solution and MB solution in the presence of CMO/C NC. The spectra are in the 200–800 nm range. The red curve in Fig. 5 is the UV–Vis spectrum of pure MB solution. It is characterized by three bands, one in the visible region (ƛmax ∼ 670 nm) and two in the UV region (ƛmax ∼ 290 nm and ƛmax ∼ 250 nm). The absorbance spectrum of the MB solution displays maximum absorption at about 670 nm. The blue curve in Fig. 5 is related to the absorbance spectrum of MB solution in the presence of CMO/C NC. As seen in this figure, three UV–Vis bands of MB disappear with CMO/C NCs, because of MB adsorption on the surface of the micro/nanocomposites. In other words, after adding CMO/C NC into the MB solution, all dye is adsorbed by CMO/C photocatalyst. The amino and hydroxyl groups in chitosan help MB adsorption and degradation. Therefore, UV–Vis results in Fig. 5 confirm the application of as-prepared CMO/C NC as a very effective adsorbent for MB removal from wastewater. Also, the photo taken from the MB solution before and after adding CMO/C NC as an adsorbent (inserted in Fig. 5) shows that the blue color of MB completely disappeared after adding CMO/C NC. Scheme 1 shows schematic synthesis, characterization, and application of as-prepared CMO/C NCs in MB removal from aqueous solution. The dyes removal from aqueous environments using metal oxide spinels has been investigated by many researchers (Ahmadi et al., 2022). The spinels of metal oxides with the general composition AB2O4, in which A may be magnesium, iron, zinc, manganese, nickel, and so on; B may be aluminum, chromium, manganese, iron, and so on; and O is oxygen have been used to remove dyes (Foroutan et al., 2021).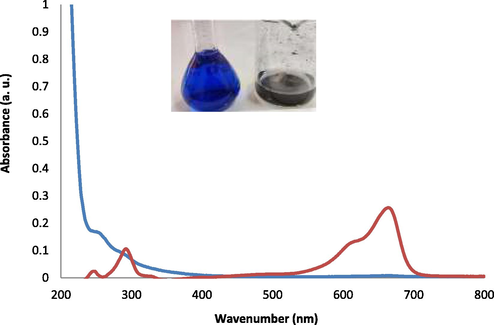
The absorbance spectra of MB (red curve) and MB adsorbed on the surface of CMO/C NC (blue curve).
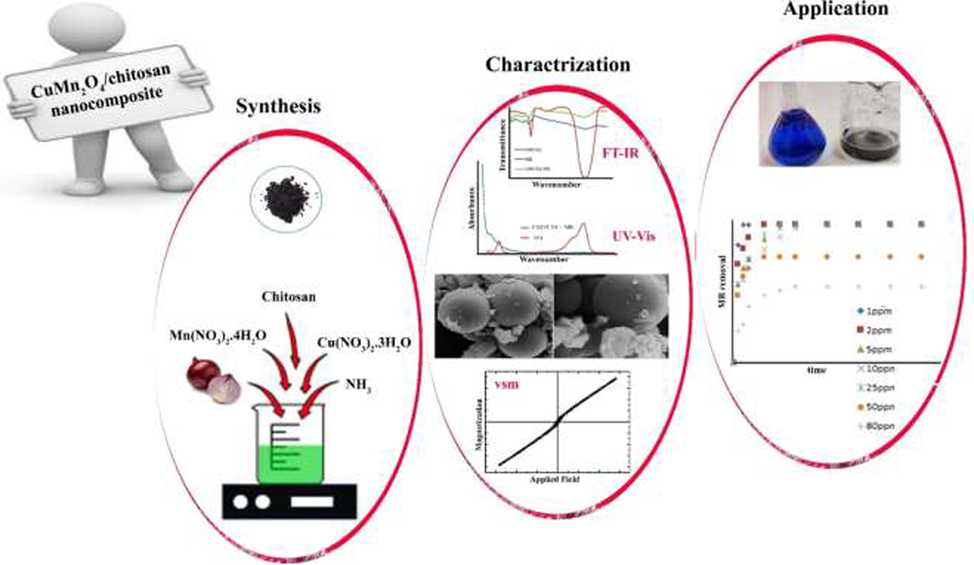
Diagram illustrating the synthesis, characterization, and application of CMO/C NCs for MB removal from aqueous solution.
Variance analysis for MB removal percent is provided based on pH, adsorbent dosage, MB concentration, contact time, and agitation speed in Table 3. P-values more than 0.1 indicate that variables do not affect the process, while P-values lower than 0.05 prove that the parameters are essential. According to Table 3, A, B, E, AE, BC, BE, CE, DE, A2 are significant model terms.
Source
Sum of Squares
df
Mean Square
F-value
p-value
Model
38648.25
20
1932.41
895.66
< 0.0001
significant
A
279.78
1
279.78
129.68
< 0.0001
B
10.80
1
10.80
5.01
0.0469
C
8.92
1
8.92
4.13
0.0669
D
0.2454
1
0.2454
0.1137
0.7423
E
29.50
1
29.50
13.67
0.0035
AB
2.59
1
2.59
1.20
0.2969
AC
0.0379
1
0.0379
0.0176
0.8969
AD
2.44
1
2.44
1.13
0.3103
AE
39.00
1
39.00
18.08
0.0014
BC
14.14
1
14.14
6.55
0.0265
BD
6.38
1
6.38
2.96
0.1135
BE
27.47
1
27.47
12.73
0.0044
CD
3.60
1
3.60
1.67
0.2227
CE
53.83
1
53.83
24.95
0.0004
DE
28.64
1
28.64
13.27
0.0039
A2
11836.30
1
11836.30
5486.03
< 0.0001
B2
1.07
1
1.07
0.4964
0.4957
C2
0.0000
1
0.0000
0.0000
0.9969
D2
0.8951
1
0.8951
0.4149
0.5327
E2
2.59
1
2.59
1.20
0.2963
Residual
23.73
11
2.16
Lack of Fit
17.42
6
2.90
2.30
0.1895
not significant
Pure Error
6.31
5
1.26
Cor Total
38671.98
31
R2: 0.9994
Adjusted R2: 0.9983
Predicted R2: 0.9729
The R2 amount of more than 0.8, refers that the empirical data’s desired agreement with the obtained one by the relevant equations (Fereidonian Dashti et al., 2018). The result show (Table 3), the predicted R2 (0.9729) is close to the adjusted R2 (0.9983). Based on this Table Lack of fit is not significant with the Lack of Fit F-value of 2.30.
The equation for predicting the optimum point was obtained according to the central composite design and input variables, and then the empirical relationship between the response and the independent variables in the coded units was presented on the basis of the experimental results as follows:
MB removal (%) = 98.32 – 4.04A – 0.8885B + 0.8072C – 0.1197D – 1.63E + 0.4134AB –0.0501AC – 0.4543AD – 1.84AE + 1.09 BC + 0.6491BD – 1.71BE – 0.4879CD + 2.40CE + 1.58DE – 68.65A2 + 0.6530B2 – 0.0037C2 – 0.5970D2 – 1.03E2.
In the optimal conditions for the surface absorption process of MB, the pH value, adsorbent dose, initial concentration, contact time and stirring speed obtained 6.5, 1.25 g/L, 1 mg/L, 5 min and 500 rpm respectively. In these conditions, the removal percentage value of 98.98% was obtained with a desirability equal to 1, which indicates the approval of the model for the removal of MB with CMO/C NCs adsorbent.
Three-dimensional response surfaces of MB removal percent versus significant variables are presented in Fig. 6 a-c. As can be seen from Fig. 6a, c, the effect of pH is on the removal percentage more than the adsorbent dose and the initial concentration of MB. In Fig. 6a, the amount of response is plotted versus pH and adsorbent dosage. In acidic mediums, the removal of MB decreases, this decrease may be due to the presence of an additional amount of H+ compared to MB dye (as a cationic dye) for adsorption on the absorbent sites. In high pH the removal percent due to the change in the structure of the adsorbent or MB reduced. Travlou et al. (Travlou et al., 2013) studied the effect of pH on adsorption–desorption of reactive dye by GO-Chm. They reported that reactive dye adsorption decreased from 81% to 35% with the increase of pH from 3 to 12 and desorption occurre under alkaline conditions (pH 12).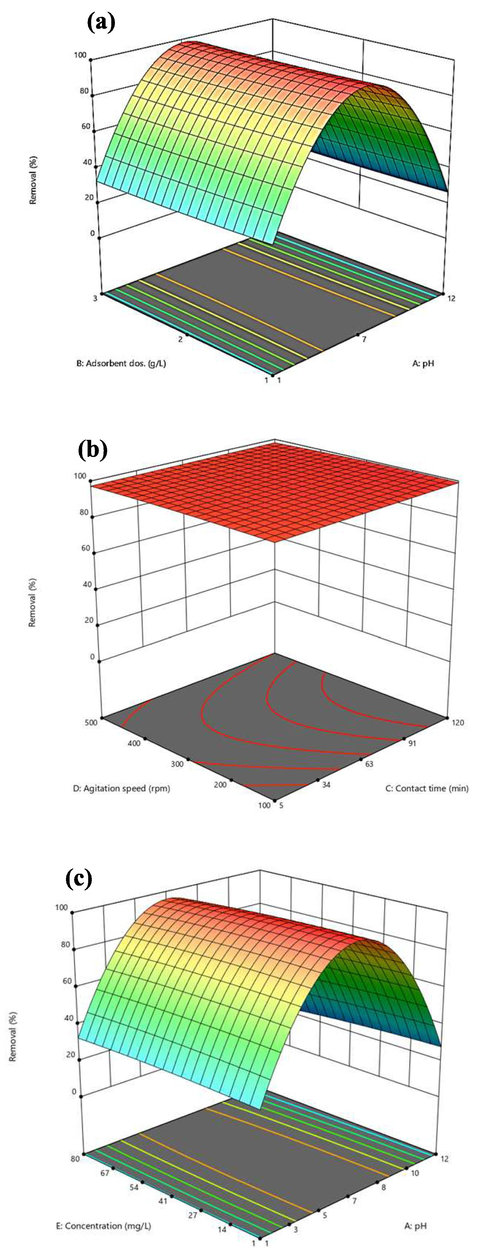
The 3D graph for (a) influence of pH and adsorbent dosage (b) influence of contact time and agitattion speed (c) influence of concentration and pH on phenol removal percent.
The adsorption capacity of MB at the time, t (qt (mg/g)) and equilibrium (qe (mg/g)) was calculated by the following Eqs. (6) and (7) (Far et al., 2020; Gollakota et al., 2021; Khan et al., 2021):
C0, Ce, and Ct (mg/L) are concentrations at the initial, equilibrium, and time t, respectively. m (g) is the adsorbent mass, and V (L) represents the solution volume. The dye removal efficiency as follows is calculated (Guimaraes et al., 2020; Wang et al., 2020):
The kinetic behavior studies of the adsorption process can provide valuable information about the equilibrium state of the operation (Alizadeh et al., 2022; Foroutan et al., 2022). Different models such as pseudo-first-order, pseudo-second-order, and Elovich model can be used to survey the kinetic behavior. Among these models, the pseudo-first-order and pseudo-second-order are extensively used to determine the physical or chemical interactions between the contaminant ions and the adsorbent surface (Foroutan et al., 2022). In this study, the kinetic models of pseudo-second-order, pseudo-second-order, intra-particle diffusion, and Elovich have been used. Their linear formulas are given in equations (9)–(12), respectively (Ahmadijokani et al., 2020; Yin et al., 2020).
qt and qe (mg/g) are the mass of adsorbent at t and the equilibrium times, respectively. The k1 (min− 1), k2 (g mg− 1 min− 1), kid (mg/g min1/2), and A (mg/g. min) and B (g/ mg) are the rate coefficient of pseudo-first-order, pseudo-second-order, intra-particle diffusion, and Elovich models, respectively. The C is the dimensionless constant related to the thickness of the boundary layer.
Isotherms of Langmuir, Freundlich, Temkin, and Dubinin-Radushkevich were applied to investigate the process mechanism of the theoretical adsorbent capacity (Pamukoglu and Kargi, 2006; Pamukoglu and Kargi, 2007). Based on the Langmuir model, the adsorbate species homogeneously cover the surface to form a regular monolayer. Freundlich model assumes the multilayer coverage of adsorbate onto the heterogeneous adsorbent surface. The linear forms of the Langmuir, Freundlich, Temkin, and Dubinin-Radushkevich models have shown below, respectively Zhang et al. (Ahmadipouya et al., 2021), Feng et al. (Zhang et al., 2019), Ahmad and Ansari (Feng et al., 2021):
In which qmax is the maximum adsorption capacity of theoretical (mg/ g). KL (L/ mg) is the Langmuir coefficient and is related to the affinity of the binding site. KF and nF are Freundlich constants and are related to the capacity and strength of adsorption, respectively (Ahmad and Ansari, 2021; Ahmad and Ejaz, 2022). 1/nF is related to the extent of adsorbent surface heterogeneity. The Temkin isotherm assumes that the absorbed heat decreases linearly with the surface coating, which is the reason for the adsorbent-adsorbate interaction. In Eq. (14), is the Temkin constant, which represents the absorption of heat, and is the maximum energy band (L/mg). Also, in the Dubinin-Radushkevich model (Eq. (15),K, qs, and ε are adsorption energy, and the theoretical capacity at saturation state and ε is the Polanyi potential, respectively. T is the absolute temperature (K), and R is the universal gas constant (8.314 J mol−1 K−1).
In continuation, the effect of the initial concentration of MB and contact time on the removal efficiency of the dye by the adsorbent was investigated, as shown in Fig. 7. As seen from this figure, for different concentrations in the early times, the adsorption intensity is very high, but over time the changes slow down until it finally reaches a constant value, which is called the equilibrium time. Equilibrium times obtained 17, 30, 45, 60, 90, 20 and 15 min for concentrations of 1, 2, 5, 10, 25, 50 and 80 mg/L, respectively.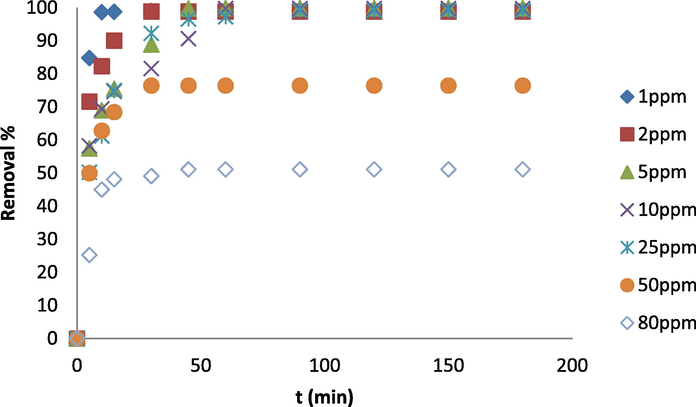
Effect of contact time and initial concentration on the removal efficiency of MB by CMO/C NC at pH = 6.5 and the ambient temperature.
The Kinetic parameters of the studied models for the adsorption of MB by CMO/C NC are shown in Table 4. The pseudo-first-order model fitted the experimental data better with correlation coefficient (R2) values of 0.997 and the qe cal that was close to the qe exp.
Pseudo-first order
)
0.792
0.723
0.335
0.997
Pseudo-second order
0.792
0.634
1.835
0.8981
Intra-particle diffusion
C
o.515
0.075
0.819
Elovich
A (mg/ g min)
B (g/ mg)
0.514
0.108
0.578
The isotherm parameters of MB by CMO/C NC have listed in Table 5. By comparing the value of R2 for different models in Table 5, it is clear that the Langmuir model (0.995) is more consistent with experimental data than other models. In the Langmuir model, it is assumed that the adsorption on the adsorbent surface is monolayer and that the tensile strength of all adsorption centers and sites is the same for MB. Also, the optimal KL value for the adsorption process based on the Langmuir model is in the range of 0–1, which was obtained at 0.06 in this investigation.
Model
Parameter
Langmuir
54.05
0.06
0.995
Freundlich
n
29.87
0.718
0.8317
Temkin
49.86
0.8523
0.8033
Dubinin-Radushkevich
1.51
0.024
0.5742
The qmax of CuMn2O4/chitosan composite for MB was compared to the other adsorbents reported in the literature (Table 6). For instance, the (Algerian) Kaolin applied by Mouni et al. had a significant capacity comparable to that obtained in this study (Mouni et al., 2018). Didodecyldimethylammonium bromide-modified brown clay (DDAB-BC) prepared by Munir et al. (Munir et al., 2020) and the activated carbon/cellulose composite (ACC3) used by Somsesta et al. (Somsesta et al., 2020) showed a strong adsorbent affinity toward MB at higher than ambient temperature with the qmax values of 164 (at 55 ℃) and 110.35 (at 60 ℃) mg/g, respectively. But the chitosan/zeolite composite (Dehghani et al., 2017) and H2SO4 crosslinked magnetic chitosan (Rahmi and Irfan, 2019) showed the qmax lower than CuMn2O4/chitosan composite that used in this work.
Adsorbent
pH
T (K)
qmax
(mg/g)Kinetic model
&
k; R2
Isotherm model
&
KL or KF; R2
Ref
(Algerian) Kaolin (C0 = 80 mg/L)
6
298
52.76
Pseudo-second order0.037(g /mg.min)
;
0.997Langmuir1.04 (L/mg)
;0.97543
Didodecyldimethylammonium Bromide-Modified Brown Clay (DDAB-BC)
7
328
∼ 164
Pseudo-second order
1.128 × 10⁻³ (g /mg. min);
0.999Langmuir0.899 (L/mg)
; 0.99744
Activated carbon/cellulose composite (ACC3)
6.9
333
110.35
Pseudo-second order
8.819 × 10⁻⁵ (g /mg. min);
0.998Langmuir0.239 (L/mg)
;
0.992
45
Chitosan/zeolite composite
9
298
24.5
Pseudo-second order0.021 (g /mg. min)
; 0.997
(100 mg/L of MB)Freundlich8.22
(mg1−1/n L1/n /g);
0.99946
H2SO4 crosslinked magnetic chitosan
nanocomposite beads6
298
20.408
ND
Langmuir0.018 (L/mg)
; 0.99847
(Chit/AILP-Kao) nanocomposite
7
303
99.01
pseudo -second order((g /mg. min)
; 0.99Langmuir0.04 (L/mg)
; 0.99848
(Bent/AgNPs-Alg) bio- Nanocomposite
8
303
242.56
pseudo-second-order
0.961Langmuir
0.98649
CuMn2O4/chitosan nanocomposite
(CMO/C NCs)6.5
298
54.04
Frist-second order0.335(1/ min)
; 0.997
Langmuir0.06 (L/mg)
;: 0.995
This work
To investigation of desorption and regeneration for the studied adsorbent, the solvents including hydrochloric acid (HCl), nitric acid (HNO3), ethanol (C2H5OH), acetone ((CH3)2CO), sodium hydroxide (NaOH) and distilled water (H2O)) were used. HCl solution (0.1 M) was selected as a sutible desorbing agents and the highest dye desorption efficincy (72%) was achieved by HCl solution. The results showed that after 5 cycles, the absorption of MB reached 42%, therefore the adsorbent can be effectively used up to five adsorption/desorption cycles (Fig. 8).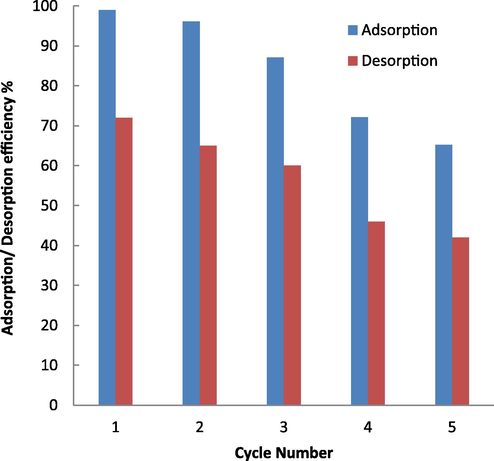
Plot adsorption/desorption of MB versus cycle number (contact time = 5 min, initial dye concentration = 1 mg/L, solvent = HCl, and dosage of adsorbent = 1.25 g/L).
4 Conclusions
The CuMn2O4 nanostructures and micro/nanocomposites were synthesized in the presence of onion as a capping agent, for the first time to our knowledge. The VSM, UV–Vis, and FT-IR results have enabled us to determine the magnetic and optical behaviors of the NCs. The as-prepared CMO/C NCs were efficient absorbents for the MB removal from an aqueous solution. Before and after the adsorption of MB on the surface of the composite, FT-IR spectra of the composite were similar, and only peaks were blue-shifted in the spectrum of the composite after MB absorption. In both UV–Vis and FT-IR spectra, the peaks of MB disappeared after its adsorption on the surface of the CMO.C NCs. The MB removal efficiency increased by decreasing the MB concentration from 80 mg/L to 1 mg/L. The maximum removal efficiency was 99% and obtained at 1 mg/L concentration. The equilibrium time of the adsorption process decreased by increasing the concentration of MB solution. It can be due to the high accumulation of MB around the adsorbent and increase the chance of it colliding with the adsorbent. Therefore, in this case, the determining factor of equilibrium time is the adsorbent capacity. However, at low concentrations, the determining factor of equilibrium time was the MB concentration in the solution. This work is the first report of MB removal by absorption on the surface of CMO/C NCs.
Acknowledgment
Authors are grateful to the Kosar University of Bojnord for supporting this work.
Declaration of Competing Interest
The authors declare that they have no known competing financial interests or personal relationships that could have appeared to influence the work reported in this paper.
References
- Flake-like CuMn2O4 nanoparticles synthesized via co-precipitation method for photocatalytic activity. Phys B (Amsterdam, Neth.). 2019;572:117-124.
- [Google Scholar]
- Comparative study for adsorption of congo red and methylene blue dye on chitosan modified hybrid nanocomposite. Process Biochem.. 2021;108:90-102.
- [Google Scholar]
- Adsorption of methylene blue dye from aqueous solution onto synthesized bentonite/silvernanoparticles-alginate (Bent/AgNPs-Alg) bio-nanocomposite. Biomass Conv. Bioref. 2022
- [Google Scholar]
- Asorption studies of hazardous malachite green onto treated ginger waste. J. Env. Manage.. 2010;01:1032-1038.
- [Google Scholar]
- Montmorillonite clay/starch/CoFe2O4 nanocomposite as a superior functional material for uptake of cationic dye molecules from water and wastewater. Mater. Chem. Phys.. 2022;284:126088
- [Google Scholar]
- Superior chemical stability of UiO-66 metal-organic frameworks (MOFs) for selective dye adsorption. Chem. Eng. J.. 2020;399:125346
- [Google Scholar]
- Magnetic Fe3O4@UiO-66 nanocomposite for rapid adsorption of organic dyes from aqueous solution. J. Mol. Liq.. 2021;322:114910
- [Google Scholar]
- Surface magnetization of hydrolyzed Luffa Cylindrica biowaste with cobalt ferrite nanoparticles for facile Ni2+ removal from wastewater. Environ. Res.. 2022;212:113242
- [Google Scholar]
- Applications of chitin- and chitosan-derivatives for the detoxification of water and wastewater- A short review. Adv. Colloid. Interface.. 2009;152:26-38.
- [Google Scholar]
- Manganites spinelles purs d'elements de transition preparations et structures cristallographiques. J. Phys. Chem. Solids. 1969;30:805-812.
- [Google Scholar]
- Impedimetric humidity and temperature sensing properties of chitosan-CuMn2O4 spinel nanocomposite. Ceram. Int.. 2019;45:10565-10571.
- [Google Scholar]
- Removal of methylene blue dye from aqueous solutions by a new chitosan/zeolite composite from shrimp waste: Kinetic and equilibrium study. Korean J. Chem. Eng.. 2017;34:1699-1707. IITED
- [Google Scholar]
- Synthesis of some transition metal (M: 25Mn, 27Co, 28Ni, 29Cu, 30Zn, 47Ag, 48Cd) sulfide nanostructures by hydrothermal method. Adv. Colloid Interface Sci.. 2017;246:52-74.
- [Google Scholar]
- Synthesis and physicochemical properties of CuMn2O4 nanoparticles; a potential semiconductor for photoelectric devices. Int. J. Bio-Inorg. Hybr. Nanomater.. 2016;5:115-120.
- [Google Scholar]
- PPI-Dendrimer-Functionalized magnetic metal-organic framework Fe3O4@MOF@PPI) with high adsorption capacity for sustainable wastewater treatment. ACS Appl. Mater. Interfaces. 2020;12:25294-25303.
- [Google Scholar]
- Rapid, high-efficient and selective removal of cationic dyes from wastewater using hollow polydopamine microcapsules: isotherm, kinetics, thermodynamics and mechanism. Appl. Surf. Sci.. 2021;542:148633
- [Google Scholar]
- Application of response surface methodology (RSM) for optimization of ammoniacal nitrogen removal from palm oil mill wastewater using limestone roughing filter. J. Appl. Res. Water Wastewater. 2018;5:411-416.
- [Google Scholar]
- Evaluation of two cationic dyes removal from aqueous environments using CNT/MgO/CuFe2O4 magnetic composite powder: A comparative study. J. Env. Chem. Eng.. 2021;9:104752
- [Google Scholar]
- Cadmium ion removal from aqueous media using banana peel biochar/Fe3O4/ZIF-67. Environ. Res.. 2022;211:113020
- [Google Scholar]
- Development of new magnetic adsorbent of walnut shell ash/starch/Fe3O4 for effective copper ions removal: Treatment of groundwater samples. Chemosphere. 2022;296:133978
- [Google Scholar]
- Coal bottom ash derived zeolite (SSZ-13) for the sorption of synthetic anion Alizarin Red S (ARS) dye. J. Hazard Mater.. 2021;416:125925
- [Google Scholar]
- Efficient removal of Cu(II) and Cr(III) contaminants from aqueous solutions using marble waste powder. J. Environ Chem. Eng.. 2020;8:103972
- [Google Scholar]
- A critical review on textile wastewater treatments: possible approaches. J. Environ. Manag.. 2016;182:351-366.
- [Google Scholar]
- Ambient temperature CO oxidation using copper manganese oxide catalysts prepared by co-precipitation: effect of ageing on catalyst performance. Catal. Lett.. 1996;42:21-24.
- [Google Scholar]
- Removal of phthalates from aqueous solution by different adsorbents: A short review. J. Environ. Manage.. 2012;94:13-24.
- [Google Scholar]
- Surface-charge-controlled synthesis of ZnIn2S4 nanosheet-based materials for selective adsorption of organic dyes. ACS Appl. Nano Mater.. 2021;4:4114-4128.
- [Google Scholar]
- Adsorption of methylene blue using sodium carboxymethyl cellulose-g-poly (acrylamide-co-methacrylic acid)/Cloisite 30B nanocomposite hydrogel. J. Polym. Environ.. 2023;31:297-311.
- [Google Scholar]
- Solution combustion of spinel CuMn2O4 ceramic pigments for thickness sensitive spectrally selective (TSSS) paint coatings. Ceram. Int.. 2016;42:11966-11973.
- [Google Scholar]
- Wastewater treatment and reuse in textile industries, A review. Res. Adv. Water Res.. 2002;3:41-53.
- [Google Scholar]
- Removal of Methylene Blue from aqueous solutions by adsorption on Kaolin: Kinetic and equilibrium studies. Appl. Clay Sci.. 2018;153:38-45.
- [Google Scholar]
- Effective Adsorptive Removal of Methylene Blue from Water by Didodecyldimethylammonium Bromide-Modified Brown Clay. ACSO mega. 2020;5:16711-16721.
- [Google Scholar]
- Batch kinetics and isotherms for biosorption of copper(II) ions onto pre-treated powdered waste sludge (PWS) J. Hazard. Mater.. 2006;138:479-484.
- [Google Scholar]
- Effects of operating parameters on kinetics of copper(II) ion biosorption onto pre-treated powdered waste sludge (PWS) Enzyme Microb. Technol.. 2007;42:76-82.
- [Google Scholar]
- Study of the electrical and catalytic properties of spinels with CuFe2−xMnxO4 composition (x = 0, 0.4, 0.8, 1.6 and 2) Appl. Catal. A: Gen.. 2015;504:29-36.
- [Google Scholar]
- Neutron diffraction study of cation distributions in some manganites. J. Indian Chem. Soc.. 1974;51:274-280.
- [Google Scholar]
- Methylene blue removal from water using H2SO4 crosslinked magnetic chitosan nanocomposite beads. Microchem. J.. 2019;144:397-402.
- [Google Scholar]
- Synthesis and characterization of a chitosan ligand for the removal of copper from aqueous media. J. Appl. Polym. Sci.. 2013;130:4542-4550.
- [Google Scholar]
- Effect of Pt-Cs2.5H0.5PW12O40 catalyst addition on durability of self-humidifying nanocomposite membranes based on sulfonated poly (ether ether ketone) for proton exchange membrane fuel cell applications. Int. J. Hydrogen Energy. 2015;40:549-560.
- [Google Scholar]
- Adsorption ability evaluation of the poly(methacrylic acid-co-acrylamide)/cloisite 30B nanocomposite hydrogel as a new adsorbent for cationic dye removal. Environ. Res.. 2022;212:113349
- [Google Scholar]
- Effect of nickel salt precursors on morphology, size, optical property and type of products (NiSe or Se) in hydrothermal method. Opt. Mat.. 2013;35:904-909.
- [Google Scholar]
- Coelectrodeposition of crystalline copper-manganese oxide containing CuMn2O4 spinel for high energy supercapacitor application. Synth. Met.. 2021;278:116802-116804.
- [Google Scholar]
- Unraveling atomic positions in an oxide spinel with two Jahn−Teller Ions: local structure investigation of CuMn2O4. J. Am. Chem. Soc.. 2009;131:11450-11457.
- [Google Scholar]
- Hydrothermal synthesis of CuMn2O4/CuO nanocomposite without capping agent and study its photocatalytic activity for elimination of dye pollution. Int. J. Hydrogen Energy. 2022;47:20138-20152.
- [Google Scholar]
- Synthesis and characterization of a nickel selenide series via a hydrothermal process. Superlattices Microstruct.. 2014;65:79-90.
- [Google Scholar]
- Synthesis and characterization of FeSe2 nanoparticles and FeSe2/FeO (OH) nanocomposites by hydrothermal method. J. Alloys Compd.. 2015;625:26-33.
- [Google Scholar]
- Shape control of nickel selenides synthesized by a simple hydrothermal reduction process. Polyhedron. 2012;31:210-216.
- [Google Scholar]
- Transition metal selenides and diselenides: Hydrothermal fabrication, investigation of morphology, particle size and and their applications in photocatalyst. Adv. Colloid Interface Sci.. 2021;287:102321-102343.
- [Google Scholar]
- Adsorption removal of methylene blue onto activated carbon/cellulose biocomposite films: Equilibrium and kinetic studies. Mater. Chem. Phys.. 2020;240:122221
- [Google Scholar]
- The sorption of cationic dyes onto kaolin: kinetic, isotherm and thermodynamic studies. Desalination. 2011;266:274-280.
- [Google Scholar]
- Functionalization of graphite oxide with magnetic chitosan for the preparation of a nanocomposite dye adsorbent. Langmuir. 2013;29:1657-1668.
- [Google Scholar]
- Structure and ionic configuration of oxidic copper-manganese spinels (CuxMn3−xO4) Phys. Status Solidi A. 1976;34:583-592.
- [Google Scholar]
- Physical properties and cation arrangement of oxides with spinel structures I. Cation arrangement in spinels. J. Chem. Phys.. 1947;15:174-180.
- [Google Scholar]
- Verwey, E.J.W. 1951. Oxidic semiconductors in semi-conducting materials. In: Henisch, H.K., (Ed.), Butterworths Sc, Pub Ltd.: London, UK, p. 151.
- Ag NPs supported on the magnetic Al-MOF/PDA as nanocatalyst for the removal of organic pollutants in water. J. Alloys Compd.. 2020;828:154340
- [Google Scholar]
- Size effect and enhanced photocatalytic activity of CuO sheet-like nanostructures prepared by a room temperature solution phase chemical method. Appl. Surf. Sci.. 2013;271:136-140.
- [Google Scholar]
- CuMn2O4: properties and the high-pressure induced Jahn-Teller phase transition. J. Phys.: Condens. Matter.. 2001;13:2549-2562.
- [Google Scholar]
- Characterization of mixed copper-manganese oxides supported on titania catalysts for selective oxidation of ammonia. Appl. Catal. A: Gen.. 1993;94:181-203.
- [Google Scholar]
- Hydrophobic modification of sodium alginate and its application in drug controlled release. Bioprocess Biosyst. Eng.. 2010;33:457-463.
- [Google Scholar]
- Novel Fe-Mn binary oxide-biochar as an adsorbent for removing Cd (II) from aqueous solutions. Chem. Eng. J.. 2020;389:124465
- [Google Scholar]
- Efficient removal of Alizarin Red S from aqueous solution by polyethyleneimine functionalized magnetic carbon nanotubes. Bioresour. Technol.. 2019;93:122100
- [Google Scholar]
- CuMn2O4 spinel anchored on graphene nanosheets as a novel electrode material for supercapacitor. J. Energy Storage. 2021;34:102181-102183.
- [Google Scholar]
- Preparation, characterization, adsorption kinetics and thermodynamics of novel magnetic chitosan enwrapping nanosized γ-Fe2O3 and multi-walled carbon nanotubes with enhanced adsorption properties for methyl orange. Bioresour. Technol.. 2010;101:5063-5069.
- [Google Scholar]


