

Translate this page into:
D-α-tocopherol polyethylene glycol succinate and Poloxamer 188 modified liposomal chrysin hydrogel for enhanced topical treatment of ultraviolet-induced skin photoaging damage
⁎Corresponding authors. analysisdrug@126.com (Yongtai Zhang), npfeng@shutcm.edu.cn (Nianping Feng)
-
Received: ,
Accepted: ,
This article was originally published by Elsevier and was migrated to Scientific Scholar after the change of Publisher.
Abstract
Chrysin (CHR) has a wide range of pharmacological and physiological activities and low toxicity, however, its clinical application is hampered by its insolubility in water, low intestinal absorption and reduced activity due to rapid carbonylation and metabolism of the hydroxyl groups at positions 5 and 7. Here, we describe a new preparation of CHR-loaded liposomal gel (CHR-Lip-Gel) with good physicochemical stability and efficient antiphotoaging properties. The CHR-loaded liposomes (CHR-Lip) was hybridized with D-α-tocopherol polyethylene glycol succinate and Poloxamer 188, and dispersed in sodium hyaluronate-formed hydrogel to obtain CHR-Lip-Gel. The resulting CHR-Lip in the hydrogel had a complete vesicle structure, with a particle size of 143.50 ± 8.20 nm. CHR-Lip-Gel significantly (p < 0.01) increased skin permeability and skin retention of chrysin compared with CHR aqueous dispersion (CHR group). Cellular uptake in human immortalized keratinocytes (HaCaT) revealed the superiority of the liposomal formulations over the free drug (p < 0.01). CHR-Lip-Gel markedly (p < 0.01) reduced the reactive oxygen species content and showed a dose dependency after UV irradiation on HaCaT cells in vitro. Additionally, both CHR-Lip-Gel and CHR-Lip groups decreased malondialdehyde and increased the contents of superoxide dismutase, hydroxyproline and glutathione peroxidase significantly (p < 0.05) in the UV-treated HaCaT cells in vitro compared with CHR group. Anti-photoaging studies in UV-injured rats showed that CHR-Lip-Gel observably increased the preventive and therapeutic effects compared with CHR-Lip, CHR, or epigallocatechin gallate. All the administration groups inhibited the expression of matrix metalloprotein-1 and promoted the expression of transforming growth factor-β1; however, only CHR-Lip-Gel and epigallocatechin gallate showed statistically significant differences (p < 0.01) in regulating both of these proteins in contrast with the model control group. This newly developed carrier effectively increased the skin permeation of chrysin, thereby significantly enhancing its efficacy. In summary, our study suggests that CHR-Lip-Gel is a superior anti-photoaging system.
Keywords
Transdermal
Liposome
Hyaluronic acid
Nanoparticle
Herb
Photoaging

- BCA
-
bicinchoninic acid
- C6
-
coumarin-6
- CHR
-
chrysin
- CHR-Lip
-
CHR-loaded liposomes
- CHR-Lip-Gel
-
CHR-Lip hydrogel
- DCFH-DA
-
2′,7′-Dichlorodihydrofluorescein diacetate
- DMEM
-
Dulbecco’s Modified Eagle’s Medium
- EE
-
entrapment efficiency
- EGCG
-
epigallocatechin gallate
- FBS
-
foetal bovine serum
- GSH-PX
-
glutathione peroxidase
- HA
-
hyaluronic acid
- HaCaT
-
human immortalized keratinocytes
- HBSS
-
Hank’s balanced salt solution
- H&E
-
haematoxylin-eosin
- HYP
-
hydroxyproline
- MDA
-
malondialdehyde
- MMP-1
-
matrix metalloproteinase 1
- OD
-
optical density
- ROS
-
reactive oxygen species
- SDS-PAGE
-
sodium dodecyl sulfate-polyacrylamide gel electrophoresis
- SOD
-
superoxide dismutase
- TEM
-
transmission electron microscope
- TGF- β1
-
transforming growth factor-β1
- TPGS
-
D-α-tocopherol polyethylene glycol succinate
- UV
-
ultraviolet
Abbreviations
1 Introduction
Ultraviolet radiation can cause skin diseases (Young et al., 2017). The ultraviolet rays produced by solar radiation can be divided into ultraviolet C (UVC) (270–290 nm), ultraviolet B (UVB) (290–320 nm) and ultraviolet A (UVA) (320–400 nm). Due to the absorption of the ozone layer, it is difficult for UVC to reach the Earth’s surface, while UVB and UVA radiation have a great impact on organisms and cause biological hazards. UVB has a skin erythema effect, resulting in DNA damage and sunburning; UVA can penetrate the dermis and produce reactive oxygen species (ROS), which are prominently involved in skin photoaging (Chu et al., 2019; Guo et al., 2020).
Chrysin (CHR), the main active component of the Dai traditional medicine Nanlengga (Oroxylum indicum [Linn.] Kurz), is a flavonoid with a wide range of pharmacological activities and has antiphotoaging effects (Jung et al., 2016; Naz et al., 2019). However, due to its insolubility in water and low oral bioavailability, clinical application of CHR is limited (Maleki et al., 2019). Nanodrug delivery systems can improve the solubility, stability and bioavailability of drugs and change the permeation behaviour of drugs in the skin (Pegoraro et al., 2012).
Liposomes are widely studied transdermal drug delivery nanocarriers that have good biocompatibility, pose little irritation to skin, and can improve the bioavailability of drugs. To enhance the penetration effect of liposomes, surfactants can be added as edge activators to increase the variability of phospholipid vesicles to effectively increase the skin penetration of drugs and achieve the delivery of drugs deep within the skin (Ascenso et al., 2015; Yang et al., 2017). D-α-tocopherol polyethylene glycol succinate (TPGS) is obtained by the esterification of vitamin E succinate and polyethylene glycol. It has good amphiphilic and biocompatibility, and it can increase the solubility of drugs and improve the stability of nanocarriers (Guo et al., 2013; Pescina et al., 2018). Simultaneously, TPGS has a certain transdermal penetration effect, which can improve the transdermal permeability of drugs (Ghosh et al., 2012; Zhao et al., 2018). Of particular importance is that TPGS can hydrolyse and break the ester bond to produce antioxidant vitamin E, which can inhibit the production of oxygen free radicals and reduce the damage caused by oxidative stress, which plays an auxiliary role in the treatment of photoaging (Wan et al., 2017). Poloxamer 188 is a non-ionic surfactant that can improve the stability of nanocarriers (Insan et al., 2019; Elkhoury et al., 2019).
Hyaluronic acid (HA) is used as the gel matrix, and the drug-loaded liposome is made into a gel form, which is convenient for transdermal drug delivery (Subongkot et al., 2014). HA is a kind of high-molecular-weight straight-chain polysaccharide; it is a biodegradable material from natural sources (Aldana et al., 2017). It has high viscoelasticity, plasticity, permeability, unique rheological properties and good biocompatibility. As a gel matrix, it has a strong moisturizing effect and can improve skin hydration and promote permeability (Abbas et al., 2020).
In this study, TPGS and Poloxamer 188 hybrid phospholipid membranes were selected to form liposomes; then, combined with the external treatment theory of traditional Chinese medicine and a transdermal drug delivery system, a new type of CHR liposome gel delivery system was established. Local administration was used to explore the penetration-promoting effect of liposome gel, and photoaging cells and animal models were established to study its antiphotoaging capability.
2 Materials and methods
2.1 Materials
CHR (purity > 98%), epigallocatechin gallate (EGCG; purity > 98%), TPGS, and Cell Counting Kit-8 (CCK-8) were purchased from Meilun Biotechnology Ltd. Co. (Dalian, China). Poloxamer 188 was obtained from BASF AG Ltd. Co. (Mannheim, Germany). Lipoid S-75 (phosphatidylcholine content ≥ 75%) was purchased from Lipoid GmbH Ltd. Co. (Ludwigshafen, Germany). Coumarin-6 (C6; purity > 99%) was obtained from Sigma-Aldrich Ltd. Co. (St. Louis, MO, USA). Foetal bovine serum (FBS), Dulbecco’s Modified Eagle’s Medium (DMEM) and Hank’s balanced salt solution (HBSS) were purchased from Gibco Inc. (Grand Island, NY, USA). Bicinchoninic acid (BCA) protein concentration determination kit was obtained from KeyGEN BioTECH (Nanjing, China). Primary antibodies against matrix metalloproteinase 1 (MMP-1) and transforming growth factor-β1 (TFG-β1) were obtained from Abcam (Cambridge, MA, USA). Assay kit for Hydroxyproline (HYP), Malondialdehyde (MDA), Superoxide Dismutase (SOD) and Glutathione Peroxidase (GSH-PX) were provided by Nanjing Jiancheng Bioengineering Institute (Nanjing, China). Horseradish peroxidase (HRP) conjugated secondary antibody was bought from Boster Biological Technology Ltd. Co. (Shanghai, China). Sodium dodecyl sulfate–polyacrylamide gel electrophoresis (SDS-PAGE) loading buffer and gel were got from Beyotime Biotechnology (Shanghai, China). All other chemicals were purchased from Sinopharm Reagent Ltd. Co. (Shanghai, China) and were of analytical grade.
The human immortalized keratinocytes (HaCaT) was derived from the cell bank of the Chinese Academy of Sciences.
2.2 Animals
Male Sprague Dawley rats, weighing 200 ± 20 g, were provided by Shanghai Slaughter Laboratory Animal Co. (Shanghai, China), and have been approved for use by the Experimental Animal Ethics Committee of Shanghai University of Traditional Chinese Medicine (approval number: PZSHUTCM901009). The animals were housed normally at 25 °C with a 12/12 h light/dark cycle and were allowed to acclimatize for 1 week prior to the start of the study.
2.3 Preparation of CHR-loaded liposomes (CHR-Lip) and CHR-Lip hydrogel (CHR-Lip-Gel)
CHR-Lip was prepared by the thin film dispersion method. CHR, Lipoid S-75, TPGS and Poloxamer 188 were dissolved in anhydrous ethanol (6.25:50:8.33:10 wt ratio). Anhydrous ethanol was recovered by a rotary evaporator under decompression (100 rpm, 40 ℃). Then, 10 mL deionized water was added with hydration at 40 ℃ for 5 min, followed by an ice bath ultrasound for 5 min (20 kHz) and filtration through a 0.45-μm microporous membrane to form CHR-Lip. Blank liposomes without CHR were prepared by the same method. To optimize the prescription of CHR-Lip, a single-factor study was used to determine the dosage of CHR, Lipoid S-75, TPGS and Poloxamer188, which included the following factors: concentration of Lipoid S-75 (5–25 mg/mL), mass ratio of Lipoid S-75 to CHR (16:1–4:1), mass ratio of Lipoid S-75 to TPGS (12:1–4:1) and concentration of Poloxamer188 (0–2 mg/mL). The particle size, CHR entrapment efficiency (EE), appearance and stability of the prepared liposomes were characterized. After screening and comparison, CHR-Lip was finally obtained.
CHR-Lip-Gel was obtained by adding 1% sodium hyaluronate to the prepared CHR-Lip and allowing swelling for 24 h.
The CHR aqueous dispersion (CHR) was prepared by dispersing the CHR powder directly in deionized water to the same final drug concentration as CHR-Lip and CHR-Lip-Gel.
2.4 Characterization of CHR-Lip
The morphology of CHR-Lip was observed using a JEOL-1400 transmission electron microscope (TEM; JEOL, Ltd., Tokyo, Japan). The particle size and zeta potential of CHR-Lip were measured using a Malvern Zetasizer Nano ZS90 particle size analyser (Malvern PANalytical, Malvern, UK).
The EE of CHR in CHR-Lip was calculated according to the following equation (Eq. (1)):
In the equation, C1 is the total dose of CHR, and C2 is the free dose of CHR. CHR-Lip was placed in an ultrafiltration centrifuge tube (Pall Corporation, NY, USA; molecular weight cut-off 30 KDa) and centrifuged at 10,000 rpm for 15 min. The concentration of CHR in the filtrate was determined by using the LC-2010A HT Liquid Chromatograph system (Shimadzu Corporation, Kyoto, Japan) with an Agilent TC-C18 reverse-phase column (particle size, 5 μm; inner diameter, 4.6 mm; length, 25 cm; Agilent Technologies, Inc., Santa Clara, CA, USA), and the amount of free CHR was obtained. In addition, after adding 5 methanol cycles to CHR-Lip and ultrasonic demulsification for 10 min, the concentration of CHR was determined by HPLC, and the total dose of CHR was obtained.
2.5 Morphology and stability of CHR-Lip-Gel
The morphology of CHR-Lip-Gel was observed using a JEM-1400 transmission electron microscope. The prepared CHR-Lip-Gel was stored at 4 ℃. Samples were collected at 0, 1, 2 and 3 months; the pH value, CHR content and particle size of the CHR-Lip were determined; and the EE was calculated.
2.6 Effect of the CHR dose on cell viability
The effect of CHR dose on HaCaT cell viability was determined using a CCK-8 assay (Zhang et al., 2020). HaCaT cells from the logarithmic growth phase were inoculated evenly in 96-well plates at a cell density of 1 × 10⁵/mL. After incubating the cells at 37 ℃ in a 5% CO2 incubator for 12 h, the medium was removed, and different doses of CHR, CHR-Lip and CHR-Lip-Gel were applied, respectively (diluted in incomplete DMEM high-glucose medium in the range from 10 to 80 μM), and the effect of dose on cell viability was investigated. The blank control was treated with incomplete DMEM high-glucose medium. After 24 h at 37 °C, 100 μL CCK-8 cell proliferation detection reagent containing 7% was added to each well. After 3.5 h at 37 °C, the optical density (OD) values of each well were measured at a wavelength of 450 nm with an automatic enzyme labelling instrument (BioTek Synergy HT, VT, USA), and the cell viability of each group was calculated according to the following equation (Eq. (2)):
2.7 Cellular uptake
According to the preparation method for CHR-Lip and CHR-Lip-Gel, C6-Lip and C6-Lip-Gel were prepared by using 5 mg C6 instead of CHR. The mass fraction of C6 in C6-Lip and C6-Lip-Gel is 8.26%.
The uptake behaviour of C6-Lip-Gel by HaCaT cells was evaluated by confocal laser-scanning microscopy and flow cytometry (Zhang et al., 2020). For confocal laser-scanning microscopy, HaCaT cells with a density of 5 × 10⁵/mL were inoculated in laser confocal plates for 12 h, and then the culture medium was discarded, and 1 mL DMEM (containing free C6, C6-Lip and C6-Lip-Gel at a concentration of 5 μg/mL) was added. After incubation at 37 ℃ for 2 h, DMEM was discarded. Hoechst 33,342 (10 μg/mL) was added to the dye for 20 min, followed by fixation with 4% paraformaldehyde. The cells were observed by laser confocal microscopy within 2 h.
For flow cytometry (CYTOFLEX S; Beckman Coulter, CA, USA), HaCaT cells at a density of 5 × 10⁵/mL were inoculated in 6-well plates for 12 h, and then the culture medium was discarded, and 1 mL DMEM (containing free C6, C6-Lip and C6-Lip-Gel at a concentration of 5 μg/mL) was added. After incubation at 37 °C for 2 h, DMEM was discarded and 0.2 mL trypsin was added for digestion. Then, 0.6 mL blank DMEM was added to terminate the digestion, followed by centrifugation (2000 rpm) for 3 min. The supernatant was discarded, followed by the addition of 1 mL PBS, centrifugation, and two washes. Finally, 0.5 mL PBS was added evenly, and the fluorescence intensity was measured by flow cytometry.
2.8 Effect of UV irradiation on cell viability
The effect of UV irradiation on HaCaT cell viability was determined using a CCK-8 assay. Cells in logarithmic growth phase were inoculated evenly in 96-well plates at a density of 1 × 10⁵/mL. They were randomly divided into three groups: UVA group, UVB group and UV group (radiation dose UVA: UVB was 9:1). After incubation in an incubator with 5% CO2 at 37 ℃ for 12 h, the culture medium was discarded. Each group was irradiated with different doses of UVA (UVA-365; 300 W; OSRAM, Munich, Germany), UVB (UV Weathering Test Machine; 100 W; Red samarium Instrument Technology (Shenzhen) Co., Ltd, Shenzhen, China) and UV, which were 30, 60, 90, 120, 150, 180, 210, 240, and 270 mJ/cm2, respectively; then calculated by Eq. (3), which are equivalent to the theoretical energy received by the cells from simulated daylight of 600, 1200, 1800, 2400, 3000, 3600, 4200, 4800, and 5400 mJ, respectively.
An ultraviolet AB photometer TM-213 (DEDU, Changzhou, China) was used to record illuminance (respectively fixed UVA and UVB lamps height 5 cm and 4 cm, counts of 5 and 3 mW/cm2 respectively after voltage stabilisation), and the temperature and humidity at that time were recorded by a temperature and humidity metre (23.5 ℃, 62%). After light intervention, the cells of each group were incubated with 100 μL 7% CCK-8 assay kit for 3.5 h. The OD values of each well were measured at a wavelength of 450 nm and the cell viability of each group was calculated according to the equation mentioned in chapter 2.6.
2.9 Protective and therapeutic effect of preparations on UV intervention
The study was performed using a CCK-8 assay. HaCaT cells were cultured according to 2.6, and the doses were 12.5, 25 and 50 μM (low, medium and high). The blank group and positive control group (EGCG 40 μM) were included in the assay. The protective effect group was incubated for 12 h followed by 180 mJ/cm2 UV irradiation, and the treatment group was treated with 180 mJ/cm2 UV irradiation and then incubated for 12 h. The viability of cells in each group was measured by CCK-8 colorimetry.
2.10 Cellular ROS level
The cellular ROS levels in HaCaT cells were investigated using confocal laser-scanning microscopy. Cells at a density of 1 × 10⁶ mL−1 were inoculated into laser confocal dishes. The blank and UV groups (30 mJ/cm2 UV irradiation) were set up. The dose in the UV-EGCG group was 25 μM, and the doses of low, medium and high UV-CHR-Lip-Gel groups were 12.5, 25 and 50 μM, respectively. After 12 h of administration, 30 mJ/cm2 UV was applied. Then, after incubation in the incubator for 12 h, 1 mL fluorescent probe 2′,7′-Dichlorodihydrofluorescein diacetate (DCFH-DA) (10 μmol·L-1) was added to the cells in the dark and incubated at 37 ℃ for 30 min. After discarding medium containing DCFH-DA, the expression of ROS in the cells was observed under a laser confocal microscope. The fluorescence intensity and area of the cells were semi-quantitatively measured by Image-Pro Plus 6.0. The results are expressed as the fluorescence intensity per unit area of the cells.
2.11 Contents of MDA, SOD, HYP and GSH-PX in cells irradiated by UV
The cells were inoculated in 6-well plates at a concentration of 1 × 10⁶ mL−1. The UV, CHR, CHR-Lip, CHR-Lip-Gel, and EGCG groups were established. After 12 h of incubation, the cells were irradiated with 180 mJ/cm2 UV, the culture medium was discarded, and the cells were lysed. The protein content was measured by enzyme labelling instrument according to the instructions of the BCA protein concentration determination kit, and the MDA content, SOD activity, HYP content and GSH-PX enzyme activity were measured using UV spectrophotometer UV-7504 (Shanghai Xinmao Instrument, Shanghai, China) and calculated according to the instructions supplied with the MDA, SOD, HYP and GSH-PX kits.
2.12 In vitro transdermal penetration
SD rats were anaesthetized by intraperitoneal injection of 10% chloral hydrate (35 mg·kg−1). After anaesthesia, abdominal rat hair was shaved with a razor. After euthanasia, the abdominal skin was removed dissecting away subcutaneous fat and adhesives, rinsed with normal saline and set aside at –20 ℃ in the refrigerator. A modified vertical Franz transdermal diffusion cell was used to fix the treated skin. PEG 400-normal saline solution (40%) was injected into the receiving pool as the receiving solution, and 1 mL CHR suspension containing 100 μg·mL−1 (0.5% CMC-Na suspension), CHR-Lip and CHR-Lip-Gel was injected into the supply pool. A constant temperature water bath at 32 ± 0.5 °C was used. The rotor speed in the receiving pool was 300 r·min−1. One millilitre of receiving solution was removed at 1 h, 2 h, 4 h, 6 h, 8 h, 10 h and 12 h, and the same volume of isothermal blank receiving solution was supplemented simultaneously. The receiver solution was filtered with a 0.45-μm microporous membrane, and the content of CHR was determined by HPLC. The cumulative permeability (Qn), steady-state permeability (Jss) and permeability coefficient (Pm) of CHR were respectively calculated according to the following equations (Eqs. (4)–(6)):
In the equations, A is the effective permeation area (2.8 cm2), V is the volume of the receiving liquid (6.5 mL), Vi is the sampling volume (1 mL), Cn and Ci are the sample concentrations in the nth and ith samplings, and Cd is the drug concentration in the supply pool (μg·mL−1). Finally, the cumulative drug permeability curve was established with the cumulative permeability per unit area as the ordinate and the sampling time as the abscissa. The slope of the obtained curve was calculated as the steady-state drug permeation rate Jss (μg/cm2 · h) by linear regression.
After the transdermal experiment, skin retention was measured. The rat skin was removed along the edge of the diffusion cell, and the residual samples on the skin were washed with normal saline. The skin was shredded and placed in a small beaker, ultrasonically dissolved and extracted with methanol for 1 h. Then it was transferred to a 5-mL capacity flask, fixed with methanol, and filtered through a membrane. The continuous filtrate was used to determine the skin retention by HPLC.
2.13 Investigation of transdermal behaviour using a fluorescence probe
According to “2.11″, the study was conducted with a modified vertical Franz transdermal diffusion cell (RYJ-12B; Huanghai Pharmaceutical Inspection Instrument Ltd. Co, Shanghai, China), and the preparations were changed to free C6, C6-Lip and C6-Lip-Gel. One millilitre of preparation (C6 content of 100 μg·mL−1) was added to each pool, and the skin of each group was removed at 1 h, 2 h and 4 h and fixed in 4% paraformaldehyde solution for 2 h. Subsequently, the skin was cut into small cubes of 0.2 × 0.2 cm and embedded in a tin box of 0.4 × 0.4 cm, which was quickly placed in liquid nitrogen and stored in the refrigerator at −80 ℃ for sectioning. After frozen sectioning, the slices (20 μm) were observed under a laser confocal microscope (Leica Microsystems, Wetzlar, Germany; EX/EM: 415 mm/485 m), and the transdermal behaviour of the preparations was analysed and recorded.
2.14 Skin irritation
Six rats were used for depilation (the hair on both sides of the spine was removed, and the area of each side was approximately 3 × 5 cm2). After depilation, a sterile syringe needle was used to draw a “well” shape on the left and right sides of the depilation site, with slight blood appearing but without damaging the dermis. During the experiment, the depilation area on the left side of the spine was coated with CHR-Lip-Gel, and the right area was coated with normal saline. Sterile gauze was externally applied and fixed with tape. After 24 h, the tape and gauze were removed, and the residue on the skin surface was washed away with normal saline. The tested skin was observed under natural light at 1 h, 24 h, 48 h and 72 h, local erythema and oedema were recorded, and the skin irritation response was evaluated (Niu et al., 2020).
2.15 Local prevention and treatment effect of CHR-Lip-Gel in a UV photoaging model
Local prevention and treatment of UV photoaging by CHR-Lip-Gel was investigated in UV-injured rats. Thirty-six SD rats were randomly divided into 6 groups: blank group, UV group, CHR group, CHR-Lip group, CHR-Lip-Gel group and EGCG group. The back hair was removed from all rats. The blank group was fed under normal conditions. The UV group was irradiated with 250 mJ/cm2 UV every 24 h for 7 days. The CHR group, CHR-Lip group, CHR-Lip-Gel group and EGCG group received the CHR suspension, The effects of CHR-Lip, CHR-Lip-Gel and EGCG suspension on erythema were observed 24 h after 250 mJ/cm2 UV irradiation. After 30 min, they were irradiated with 250 mJ/cm2 UV again, and this process was repeated every other day for 7 days. The changes were recorded before modelling and days 1, 3, 5 and 7 of administration (Song et al., 2017; Prasedya et al., 2019). The rats were then sacrificed, and the affected skin was isolated, fixed with 4% paraformaldehyde, and analysed using haematoxylin-eosin (H&E) staining.
2.16 Determination of MMP-1 and TFG-β1 by western blotting
The skin tissue of rats treated for 7 days under “2.14″ was cut into small fragments. Two hundred microlitres of lysate (Thermo Fisher Scientific, MA, USA) was added to each 20 mg of tissue and ground in a homogenizer (SCIENTZ-48; SCIENTZ, Ningbo, China) until the tissue mass disappeared in the lysate. After complete lysis, the supernatant was obtained by centrifugation at 12000 rpm for 5 min. 20 μL supernatants of each sample were denatured in sodium SDS-PAGE loading buffer and separated in 10% SDS-PAGE gels by electrophoresis. After transferred from the gels to polyvinylidene difluoride membranes, the membranes were blocked with 5% non-fat milk and incubated with primary antibodies against MMP-1 and TFG-β1 overnight at 4 ℃. The membranes were then washed by Tris-Buffered Saline and Tween 20 and incubated with HRP-conjugated goat anti-rabbit for 2 h, and the expression of MMP-1 and TFG-β1 was observed with a HRP chemiluminescence (Boster Biological Technology Ltd. Co, Shanghai, China).
2.17 Immunohistochemical detection of MMP-1 and TFG- β1 expression
The skin tissue sections under “2.15″ were dewaxed with toluene, hydrated in gradient alcohol and washed. Ethylene diamine tetraacetic acid repair solution was used to repair the slices by Paraffin Microtome (UC-7; Leica Microsystems, Wentzler, Germany) under high pressure. After cooling, distilled water was added to the bottom of the cassette, and the sections were washed with PBS and incubated in deionized water containing 3% H2O2. Endogenous catalase was then removed, followed by washing. The sections were placed back in a wet box, and an antibody was added to keep them moist overnight at 4 ℃. After washing with PBS, the secondary antibody was added and incubated for 20 min at room temperature under humidified conditions. After washing with PBS, the tissue was stained with 3,3′-Diaminobenzidine tetrahydrochloride solution, and then neutral gum was used for sealing after re-dyeing, dehydration and natural drying (Booster Biological Technology Ltd. Co, Shanghai, China). The samples were then observed under a light microscope (Zeiss Axiom Scope Al; Zeiss, Overcoached, Germany) and imaged using Image-Pro Plus 6.0. The dark blue and dark brown in the dermis were strongly positive, the blue was moderately positive, the light blue was weakly positive, and the dark brown nucleus was negative. Then, we identified and analysed the strongly positive, moderately positive, weakly positive and negative areas and percentages of the samples at each tissue point and scored them.
2.18 Statistical analysis
Data are expressed as the mean ± SD. GraphPad Prism 7.0 software was used for statistical analysis. Data were analysed by one-way ANOVA to determine differences in means among groups. A value of p < 0.05 indicated that the difference was statistically significant.
3 Results and discussion
3.1 Preparation and characterization of the tested preparations
The dosages of CHR, Lipoid S-75, TPGS and Poloxamer188 were determined to optimize the formulation of CHR-Lip. With the increase in concentration of Lipoid S-75, the particle size and EE of liposomes increased. When the concentration of Lipoid S-75 was 20–25 mg/mL, the liposomes appeared milky white and flocculently precipitated after static placement, while when the concentration of Lipoid S-75 was 5–15 mg/mL, the liposomes were clear, with light yellow opalescent light and the Tyndall effect. The dosage of Lipoid S-75 was determined to be 5 mg/mL. CHR is a lipophilic drug that is encapsulated by embedding in a phospholipid bilayer, so the mass ratio of Lipoid S-75 to CHR has a significant effect on the particle size and EE of liposomes. With the decrease in the mass ratio of Lipoid S-75 to CHR, the particle size and EE of liposomes decreased. When the mass ratio of Lipoid S-75 to CHR was 4:1, liposomes were deposited and precipitated. The mass ratio of Lipoid S-75 to CHR was determined to be 8:1. The particle size of the liposomes decreased when the mass ratio of Lipoid S-75 to TPGS was 12:1–6:1. The mass ratio of Lipoid S-75 to TPGS was 4:1; that is, the ratio of TPGS was too high, and flocculent precipitation occurred after standing for one day. It was speculated that an excessive proportion of TPGS would affect the phospholipid-coated drugs and cause the drugs to precipitate. The mass ratio of Lipoid S-75 to TPGS was determined to be 6:1. With the increase in poloxamer188, the particle size of the liposomes decreased, but when the dose of poloxamer188 reached 2 mg/mL, precipitation occurred after placement. It was speculated that the structure of the liposomes was destroyed when the surfactant exceeded a certain amount. Combined with the effect of dosage on the EE, the amount of Poloxamer188 was determined to be 1 mg/mL. Therefore, the best mass ratio of CHR, Lipoid S-75, TPGS and Poloxamer 188 was 6.25:50:8.33:10. The final optimized CHR-Lip particle size, zeta potential and EE are listed in Table 1.
Preparation
Size (nm)
PDI
Zeta potential (mV)
Entrapment efficiency (%)
CHR-Lip
142.1 ± 9.2
0.180 ± 0.021
−41.6 ± 3.6
98.35 ± 0.47
The liposomes were irregular spherical or spherical vesicles with a diameter of approximately 150 nm (Fig. 1A). The average particle size of the liposome was 142.1 ± 9.2 nm (Fig. 1C), and the PDI was 0.180 ± 0.021, indicating that the particle size distribution of the liposomes was uniform. The zeta potential of the liposome was –41.6 ± 3.6 mV (Fig. 1D), indicating that the liposome was in a stable state. The EE of CHR in CHR-Lip was 98.35 ± 0.47%. The liposomes were encapsulated in the gel matrix with a complete vesicle structure, and the particle size did not change (Fig. 1B).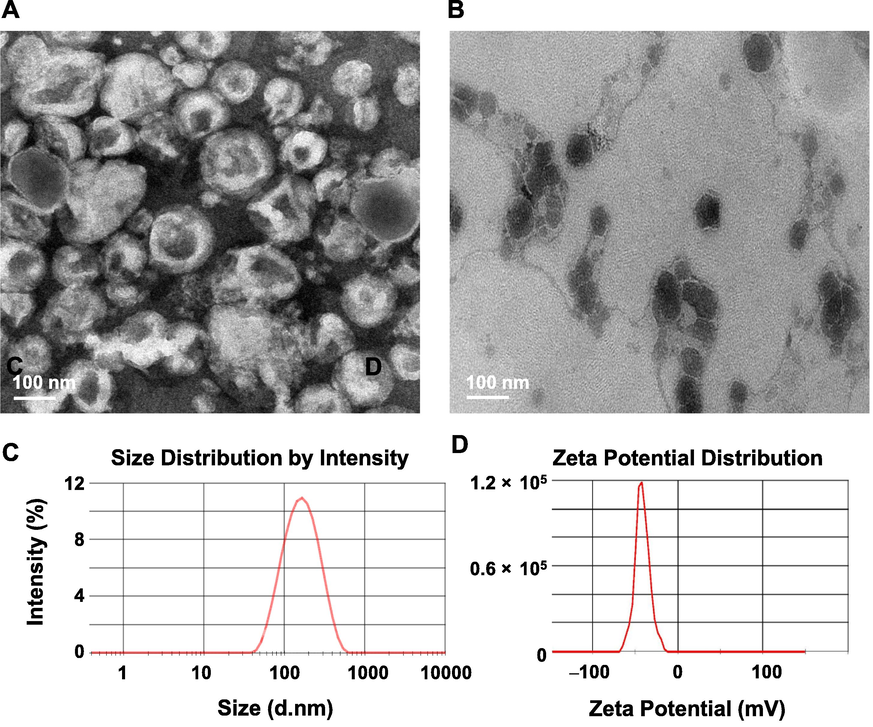
(A) TEM images of CHR-Lip. (B) TEM images of CHR-Lip-Gel. (C) Size distribution and (D) zeta potential of CHR-Lip.
The pH values of the CHR-Lip-Gel measured at 0, 1, 2 and 3 months showed no significant change (Table 2), and the acidity was within the suitable pH range of human skin (4.0–6.5). Within 3 months storage, the drug content of CHR-Lip-Gel and EE of CHR-Lip in CHR-Lip-Gel decreased slightly, while the particle size of CHR-Lip increased slightly, but the changes of all of the above subjects have no statistically differences (p > 0.05).
0
1 month
2 months
3 months
pH
4.95 ± 0.16
4.91 ± 0.37
4.86 ± 0.26
4.81 ± 0.49
CHR Con. (μg·mL-1)
178.32 ± 5.87
176.43 ± 9.72
173.67 ± 7.81
169.23 ± 12.53
Particle Size (nm)
143.50 ± 8.20
147.20 ± 7.60
149.50 ± 11.30
153.30 ± 9.70
EE(%)
98.35 ± 0.47
97.78 ± 0.71
95.73 ± 1.02
95.58 ± 0.96
3.2 Interactions with cells in vitro
The effect of the CHR dose on HaCaT cell viability is shown in Fig. 2A–C. The cell viability of the CHR group increased from 110.60% to 132.55% in the CHR dose range of 10–50 μM and decreased from 120.65% to 105.56% in the 60–80 μM dose range. Cell viability in the CHR-Lip-Gel group increased from 109.92% to 139.88% in the CHR concentration range of 10–50 μM and decreased from 126.75% to 109.27% in the 60–80 μM dose range. The results indicate that the formulation has no toxic effects on cells in the 80 μM range and has cell proliferative potency. Moreover, CHR-Lip and CHR-Lip-Gel were more effective in cell proliferation. CHR-Lip and CHR-Lip-Gel demonstrated better effects on cell proliferation, and it was speculated that the added non-ionic surfactant and HA had good biocompatibility and did not affect the cell viability (Lin et al., 2020; Wen et al., 2020). When the concentration of CHR was 50 μM, the cellular activity was 136.97% (p < 0.05), and the proliferative effect was stable and reproducible. Therefore, the cell administration concentration of CHR was determined to be 50 μM.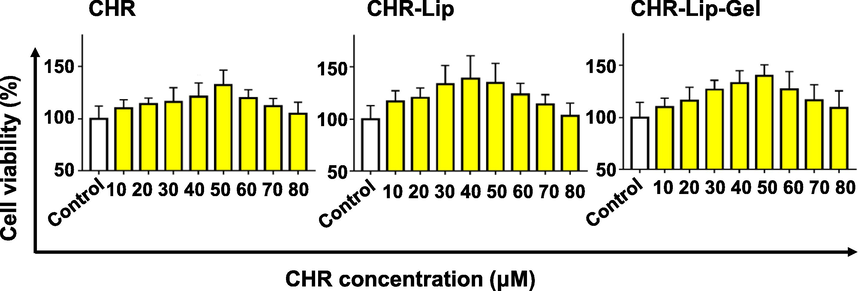
Effect of CHR, CHR-Lip and CHR-Lip-Gel on cell viability (mean ± SD, n = 6).
For confocal laser-scanning microscopy, free C6, C6-Lip and C6-Lip-Gel could be absorbed into HaCaT cells (Fig. 3). The green fluorescence of the C6-Lip and C6-Lip-Gel groups was stronger than that of the free C6 group, perhaps due to liposomes increase biocompatibility and thus improve cellular uptake behaviour (Zaman et al., 2021). However, the presence of HA in the C6-Lip-Gel group increased the affinity of the cell membrane so that more fluorescent dyes could be absorbed into cells and widely distributed on the cell membrane.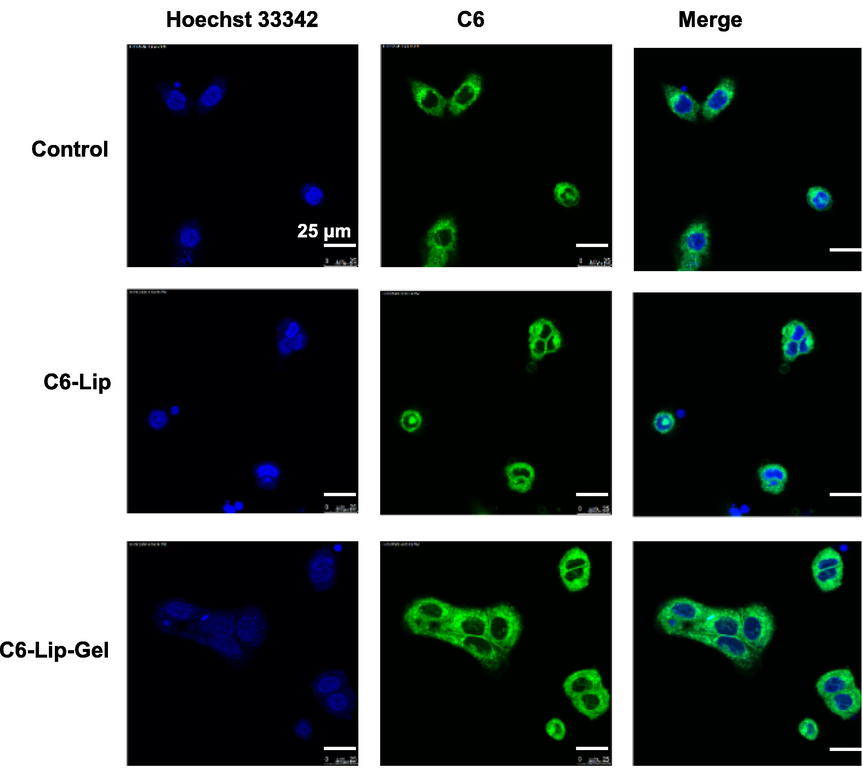
Laser confocal micrographs of HaCaT cell uptake of C6-labelled Lip and Lip-Gel.
For flow cytometry, the fluorescence intensity of the free C6, C6-Lip and C6-Lip-Gel groups increased in turn (Fig. 4A, B). The fluorescence intensity of the C6-Lip group was 2.56 times higher than that of the free C6 group, and that of the C6-Lip-Gel group was 3.41 times higher than that of the free C6 group. The results showed that both liposome and liposome gel enhanced C6 uptake by cells. It is worth discussing that the quenching rate of C6 in liposomes may be reduced when it is loaded into liposomes, while the quenching rate may be further reduced when C6 is encapsulated in gel, resulting in the difference in fluorescence intensity among groups.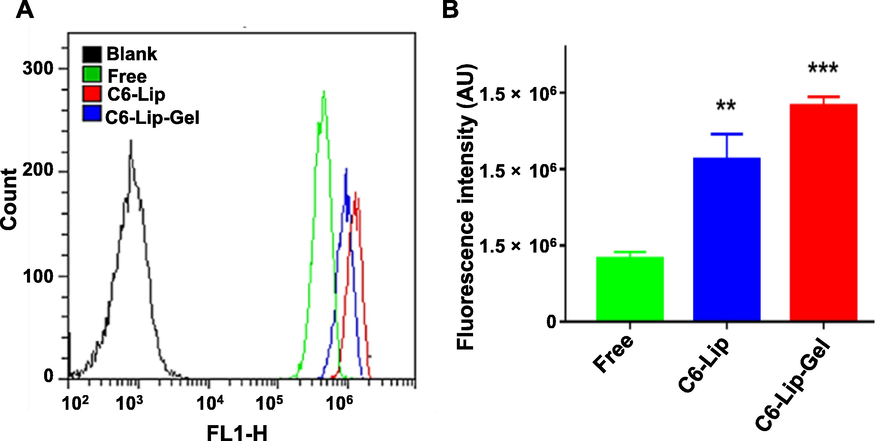
(A) Flow cytometry plots and (B) the corresponding fluorescence intensity analysis (mean ± SD, n = 6). Note: * indicates another group vs. the free C6 (Free) group, (**p < 0.01, ***p < 0.001).
The UV treatment at different radiation levels inhibited cell viability and showed a positive correlation (Fig. 5). The UVA and UV groups showed significant inhibition of cell viability when radiation reached 120–180 mJ/cm2, while a substantial inhibition occurred after reaching 210 mJ/cm2, presumably the short time accumulation of energy burned the cells to death. Therefore, UV irradiation was chosen as the intervention, and the cell viability was 57.07% (p < 0.001) compared to the group without UV irradiation, which was stable and reproducible. The inhibition of cell viability in the UVB group was weaker than in the UVA and UV groups, mainly due to the lower power of the UV lamp, and therefore the long irradiation time did not result in cell death by scorching.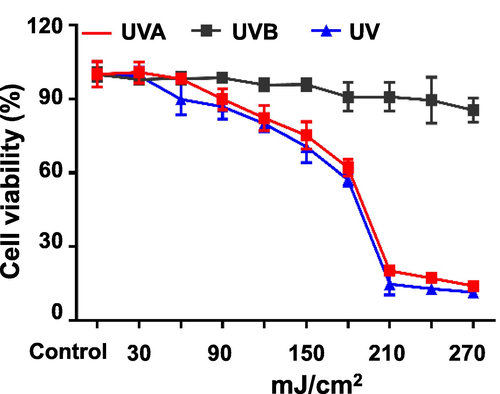
Effects of different doses of UV irradiation on cell viability (mean ± SD, n = 6).
CHR, CHR-Lip and CHR-Lip-Gel effectively prevented UV injury, with increasing impacts in a dose-dependent manner in the range of CHR concentration from 12.5 μM to 50 μM (Fig. 6). The protective effect of CHR-Lip-Gel on UV intervention was stronger than that of CHR-Lip and CHR, indicating that HA had a certain anti-UV effect (Kang et al., 2018; Madan et al., 2018). The protective effect of the CHR-Lip-Gel high-dose (50 μM) group on UV intervention was stronger than that of the EGCG control group, while the protective effect of the CHR and CHR-Lip groups was similar to that of the EGCG control group. Moreover, the tested CHR preparations were effective for the repair of UV damage, showing an increasing trend in the range of concentrations (Fig. 7). These findings suggested that CHR is a potential anti-UV drug.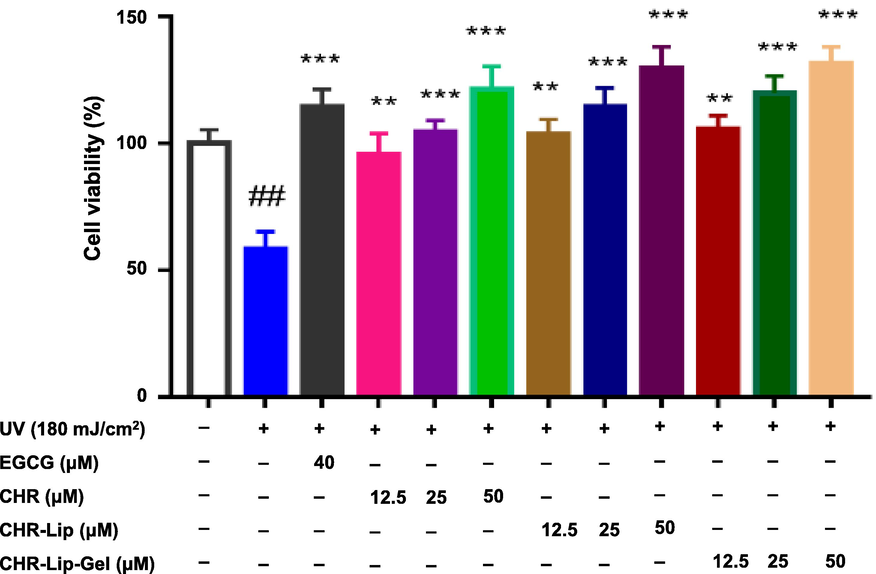
The protective effects of preparations on UV irradiation (mean ± SD, n = 6). Note: # indicates the UV irradiation group (UV) vs. the blank control, (#p < 0.05, ##p < 0.01), * indicates another group vs. the UV group, (*p < 0.05, **p < 0.01, ***p < 0.001).
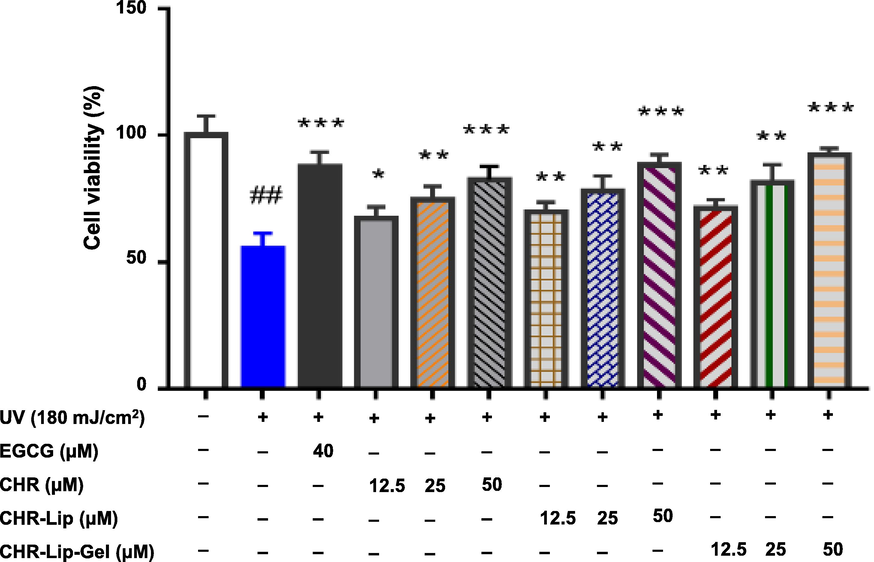
The therapeutic effects of preparations on UV irradiation (mean ± SD, n = 6). Note: # indicates the UV group vs. the blank control group, (#p < 0.05, ##p < 0.01), * indicates another group vs. the UV group, (*p < 0.05, **p < 0.01, ***p < 0.001).
UV irradiation increased cellular ROS, showing that the fluorescence intensity of cells after UV irradiation was significantly (p < 0.01) higher than that of the untreated control group (Fig. 8A, B). Notably, both EGCG and CHR-Lip-Gel markedly (p < 0.01) reduced the content of ROS after UV irradiation, and within a CHR-Lip-Gel dose range from 12.5 to 50 μM, the greater the dose, the stronger was the inhibitory effect.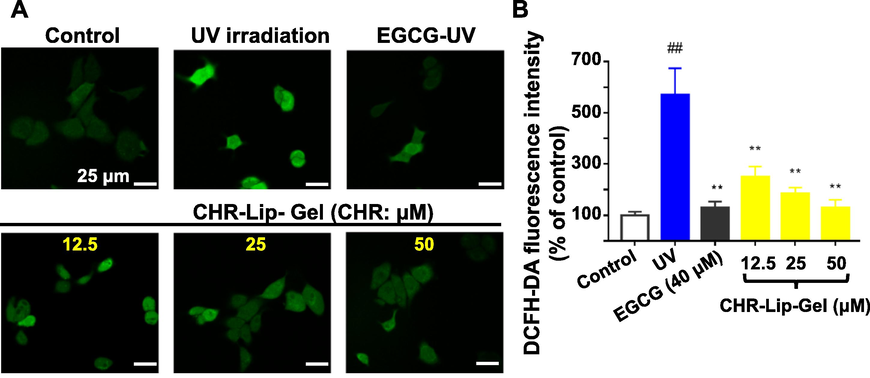
(A) The level of ROS in HaCaT cells (DCFH-DA staining, × 630). (B) The fluorescence intensity of DCFH-DA in HaCaT cells (mean ± SD, n = 6). Note: # indicates the UV group vs. the no treatment group (Control), (##p < 0.01), * indicates another group vs. the UV group, (**p < 0.01).
The MDA in UV-irradiated cells was significantly higher than that in the untreated control group, while the MDA in the CHR-Lip-Gel and EGCG groups decreased significantly (p < 0.01) (Fig. 9), indicating that CHR-Lip-Gel and EGCG had significant anti-UV irradiation effects. Concurrently, SOD, HYP and GSH-PX in cells irradiated with UV were significantly lower than those in the untreated control group (p < 0.01), indicating that UV irradiation reduced these oxidative stress indexes in cells. However, CHR, CHR-Lip, CHR-Lip-Gel and EGCG all increased SOD, HYP and GSH-PX after UV irradiation, and the effect of the CHR-Lip-Gel group was stronger than that of the other groups, indicating that CHR-Lip-Gel had a better anti-UV irradiation effect than the other groups.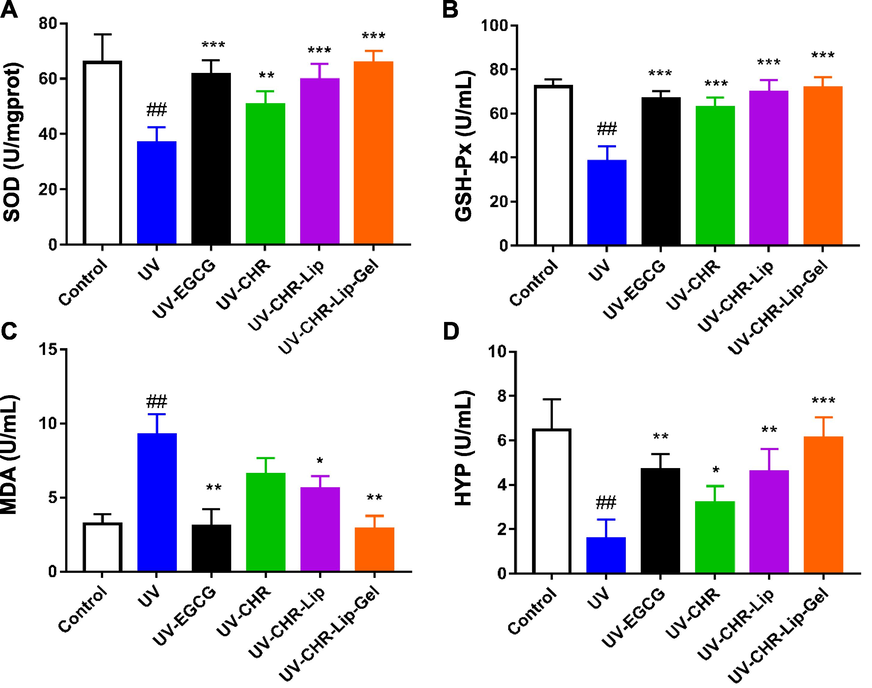
The results of SOD (A), GSH-PX (B), MDA (C) and HYP (D) oxidative stress index (mean ± SD, n = 6). Note: # indicates the UV group vs. the blank control, (##p < 0.01), * indicates another group vs. the UV group, (*p < 0.05, **p < 0.01, ***p < 0.001).
3.3 In vitro transdermal penetration
Compared with CHR group, the cumulative permeability of CHR-Lip and CHR-Lip-Gel increased by 1.8 times and 2.8 times, respectively, and the permeation rate increased by 2.2 times and 3.2 times, respectively (Table 3). From the cumulative release curve, the cumulative permeation amount of CHR-Lip-Gel appeared to be larger than that of CHR-Lip (Fig. 10A), suggesting that by loading CHR into the liposome gel improved its transdermal delivery.
Preparation
Q (μg·cm−2)
Kinetic equations
R2
Jss (μg·cm-2·h−1)
Pm (cm·h−1)
CHR
5.4915
Qn = 0.2521t + 2.7353
0.9529
0.2521 ± 0.0304
0.0025 ± 0.0003
CHR-Lip
9.8343
Qn = 0.5475t + 3.5137
0.9705
0.5475 ± 0.0954
0.0051 ± 0.0009
CHR-Lip-Gel
14.1192
Qn = 0.8047t + 4.8317
0.9508
0.8047 ± 0.0720
0.0078 ± 0.0007
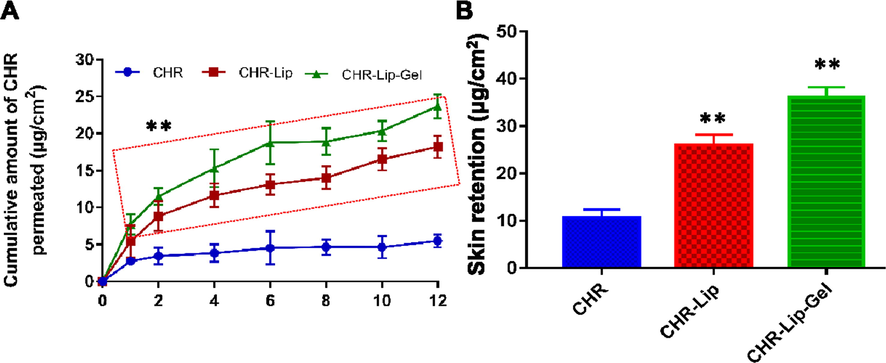
(A) In vitro skin permeation profiles of CHR, CHR-Lip and CHR-Lip-Gel (mean ± SD, n = 6). (B) Skin retention of CHR, CHR-Lip and CHR-Lip-Gel in vitro (mean ± SD, n = 6). Note: * indicates another group vs. the CHR group, (**p < 0.01).
In vitro skin retention of CHR in the CHR-Lip and CHR-Lip-Gel groups was 2.3 times and 3.5 times higher than that in the CHR group, respectively (Fig. 10B), which demonstrated that HA-modified liposomes increased skin permeability and skin retention (How et al., 2020), thereby facilitates concentrating the drug in the skin and increases the local efficacy.
3.4 Investigation of transdermal behaviour using a fluorescent probe
C6, C6-Lip and C6-Lip-Gel gradually spread to the skin over time and generally to the whole skin in 4 h (Fig. 11). Due to the sustained release property of HA-formed hydrogel, the fluorescence range of C6-Lip-Gel permeation in 2 h was significantly weaker than that in the C6 and C6-Lip groups. Among each group over time, it was found that 1 h of fluorescence mainly permeated the stratum corneum and penetrated the skin with the pores and skin appendages.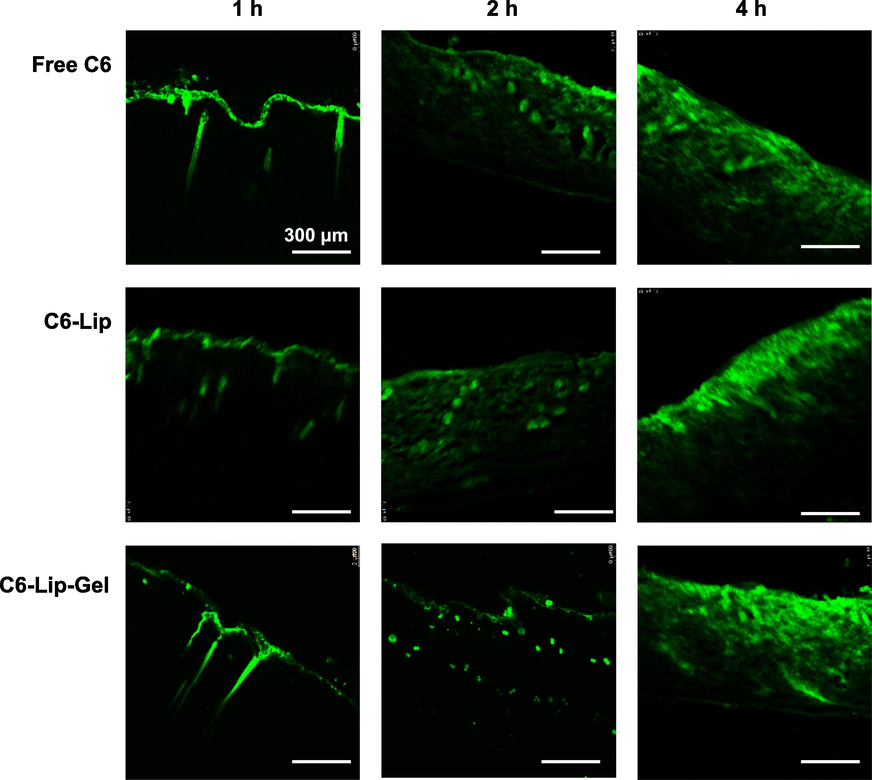
Fluorescence observation of C6, C6-Lip and C6-Lip-Gel in vitro transdermal sections.
3.5 Skin irritation
There was no erythema or oedema at 1 h, 24 h, 48 h and 72 h after CHR-Lip-Gel application, and after 72 h the damaged skin had largely recovered (Fig. 12), which indicated that CHR-Lip-Gel did not irritate the skin.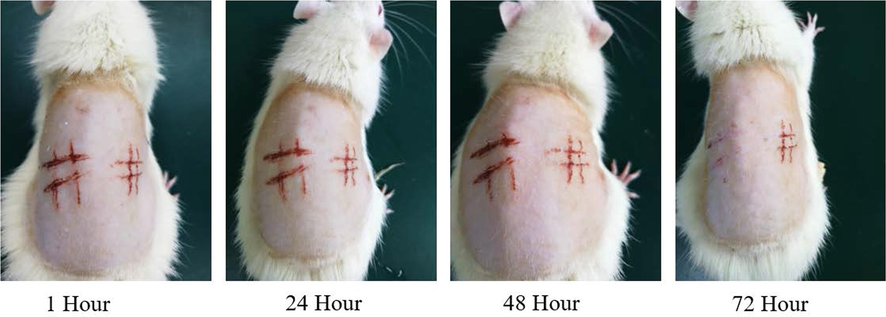
Changes in injured skin of rats treated with CHR-Lip-Gel at different time points (n = 6).
3.6 Local prevention and treatment effect of CHR-Lip-Gel in a UV photoaging model
After UV irradiation of different energy gradients on the dorsal skin of rats, the degree of skin texture roughness, reddening and peeling increased with the increase of irradiation energy (Fig. 13). The entire dorsal skin became red at an irradiation energy of 200–300 mJ/cm2. Considering individual differences, 250 mJ/cm2 was selected for modelling.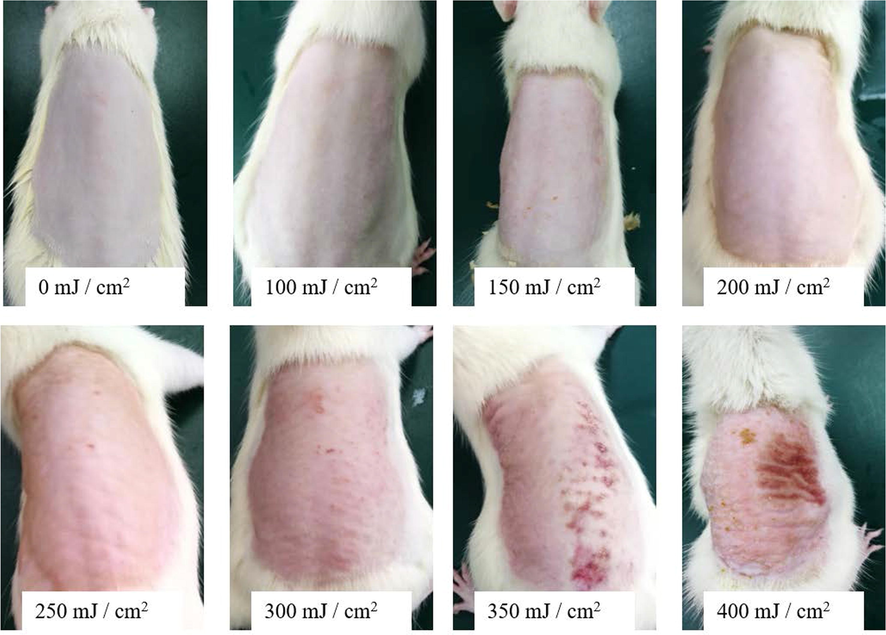
Results of different gradients of UV intensity irradiation on skin (n = 6).
Unlike the normal control group, the back skin of the rats in the UV photoaging model group had rough texture and erythema (Fig. 14). The preventive and therapeutic effects of CHR, CHR-Lip and CHR-Lip-Gel on UV photoaging became stronger in turn, and the protective and therapeutic effects of CHR-Lip-Gel on UV photoaging injury were superior to those of EGCG. The thickened epidermis and disordered tissue structure was observed in H&E-stained sections from the model and normal groups. However, in the CHR, CHR-Lip and CHR-Lip-Gel groups, epidermal thickening was improved, and the disordered tissue structure was alleviated. Concurrently, the protective and therapeutic effects of the CHR-Lip-Gel group on UV photoaging injury were superior to those of the EGCG group (Prasedya et al., 2019; Ying et al., 2019). The above results showed that CHR-Lip-Gel had better protective and therapeutic effects on UV photoaging injury.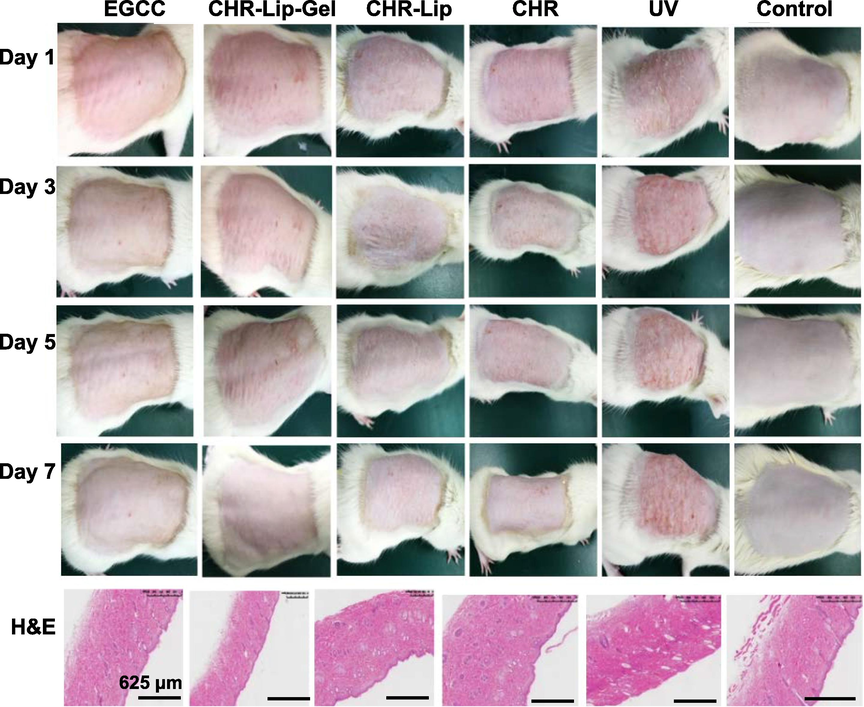
Effects of different preparations on the UV photoaging model and H&E-stained skin sections (n = 6).
Overexpression of matrix metalloproteinase (MMP-1) is one of the important causes of skin ageing, and inhibition of MMP-1 activity can prevent skin ageing, while transforming growth factor β (TGF- β1) inhibits MMP-1 transcription (Kim et al., 2020; Hassan et al., 2021). In this study, the expression of MMP-1 and TGF-β1 was determined to evaluate the preventive and therapeutic effects of the preparations on UV photoaging. Comparison of the control and UV model groups showed that UV photoaging damage promoted MMP-1 and TFG-β1 expression, while the corresponding administration groups inhibited MMP-1 expression and promoted TFG-β1 expression (Fig. 15A). It was speculated that UV photoaging injury might lead to cell necrosis in the skin, so there was no significant difference in the expression of TFG-β1 between the control and UV model groups (Fig. 15B).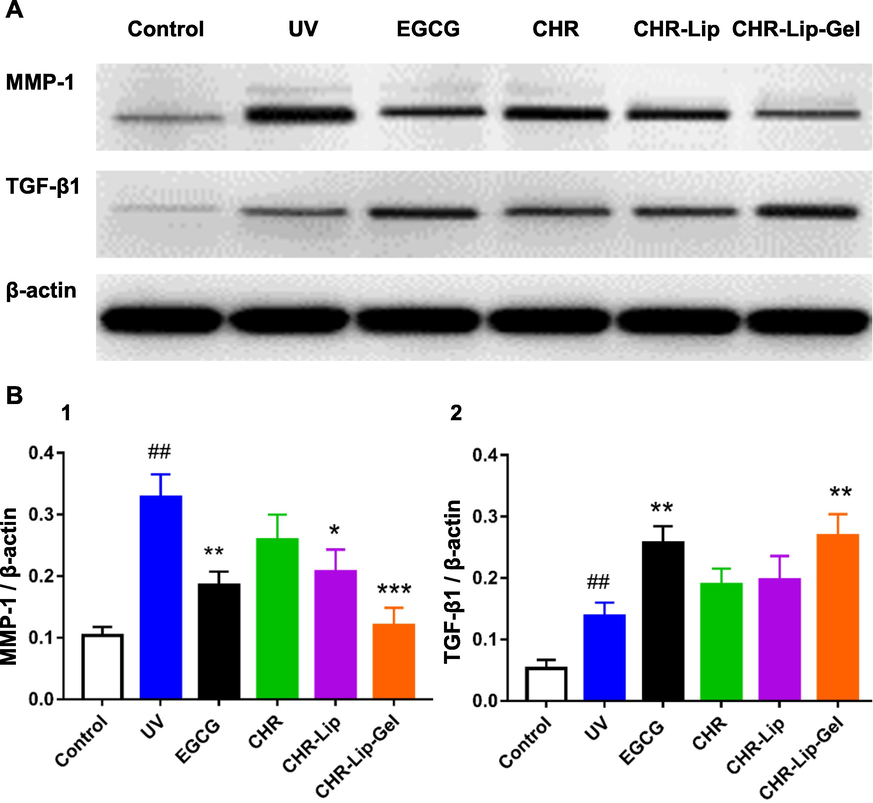
(A) The expression of MMP-1 and TGF-β1 in rat back skin. (B) The expression of (MMP-1 and TGF-β1)/β-actin (mean ± SD, n = 6). Note: # indicates the UV group vs. the no treatment group (Control), (##p < 0.01), * indicates another group vs. the UV group, (*p < 0.05, **p < 0.01, ***p < 0.001).
In addition, comparison of the control and UV groups showed that MMP-1 and TFG-β1 expression in the dermis increased significantly after UV photoaging injury (Fig. 16A). Based on semiquantitative analysis, the positive expression of MMP-1 was found to be regulated by CHR, CHR-Lip and CHR-Lip-Gel, which showed inhibitory effects and increased in turn, while the inhibitory effect of the EGCG group was similar to that of the CHR-Lip-Gel group (Fig. 16B). However, the expression of TFG-β1 increased in turn due to the regulation of CHR, CHR-Lip and CHR-Lip-Gel. Notably, of all the treatment groups, groups EGCG and CHR-Lip-Gel showed the most significant (p < 0.001) modulation of the above proteins compared to the UV group.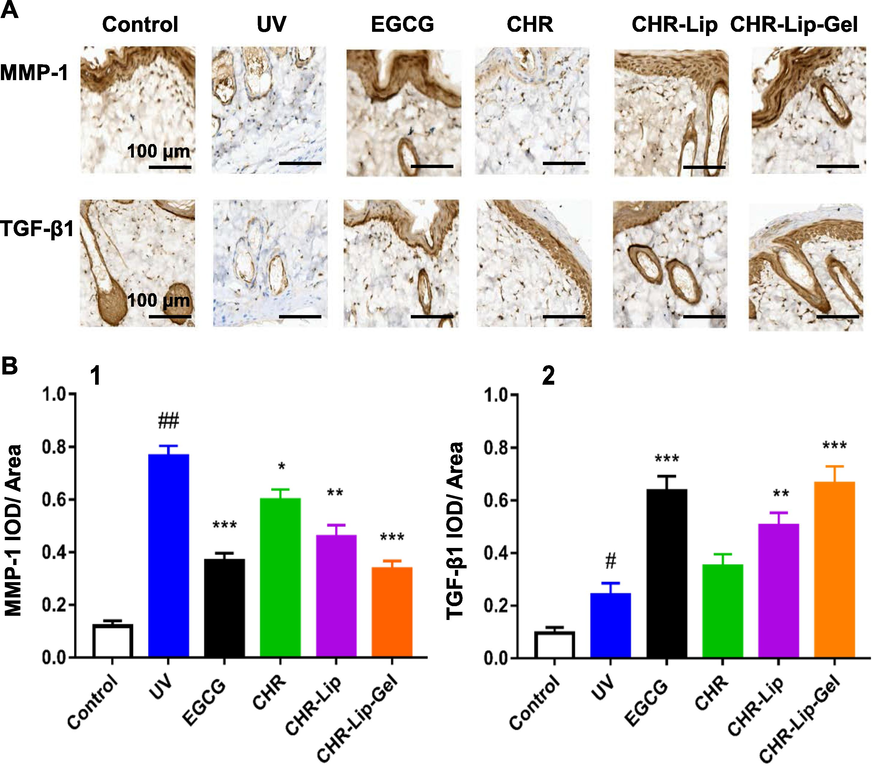
(A) Immunohistochemistry of MMP-1 and TGF-β1 in rat skin. (B) Semiquantitative expression of MMP-1 and TGF-β1 in the IOD/area (mean ± SD, n = 6). Note: # indicates the UV group vs. the no treatment group (Control), (##p < 0.01), * indicates another group vs. the UV group, (*p < 0.05, **p < 0.01, ***p < 0.001).
4 Conclusion
A novel preparation of CHR liposomes was made with mass ratio of CHR, Lipoid S-75, TPGS and Poloxamer 188 was 6.25:50:8.33:10 using thin film dispersion technology. The hyaluronic acid gel matrix encapsulated the CHR liposomes, and the liposomal nanoparticles remained intact with an average particle size of 143.50 ± 8.20 nm and an EE of 98.35% ± 0.47%. The hyaluronic acid gel matrix contributed to a significant improvement in the in vitro and in vivo performance of CHR liposomes, thereby dramatically enhanced the preventive and therapeutic effects of the drug on UV-induced skin ageing. In summary, our study suggests that CHR liposome gel offers a superior delivery system to prevent UV photoaging.
CRediT authorship contribution statement
Xiang Wang: Data curation, Formal analysis, Methodology, Project administration. Xuefeng Hou: Formal analysis, Methodology, Software, Visualization. Yihan Wu: Methodology, Validation, Visualization. Jingwen Guo: Validation, Visualization, Writing – original draft. Haichuan Tai: Resources. Yongtai Zhang: Funding acquisition, Investigation, Supervision, Writing – original draft, Writing – review & editing. Nianping Feng: Conceptualization, Funding acquisition, Investigation, Resources, Supervision, Writing – review & editing.
Acknowledgement
This work was financially supported by the National Natural Science Foundation of China (82074279, 81673612), the Program for Professor of Special Appointment (Eastern Scholar) at Shanghai Institutions of Higher Learning (TP2020054), and Program for Shanghai High-Level Local University Innovation Team (SZY20220315).
Declaration of Competing Interest
The authors declare that they have no known competing financial interests or personal relationships that could have appeared to influence the work reported in this paper.
References
- Potential role of resveratrol-loaded elastic sorbitan monostearate nanovesicles for the prevention of UV-induced skin damage. J. Liposome Res.. 2020;30(1):45-53.
- [Google Scholar]
- Current advances in electrospun gelatin-based scaffolds for tissue engineering applications. Int. J. Pharm.. 2017;523(2):441-453.
- [Google Scholar]
- Development, characterization, and skin delivery studies of related ultradeformable vesicles: transfersomes, ethosomes, and transethosomes. Int. J. Nanomed.. 2015;10:5837-5851.
- [Google Scholar]
- Protective Effects and Mechanisms of -Phenethyl Caffeamide from UVA-Induced Skin Damage in Human Epidermal Keratinocytes through Nrf2/HO-1 Regulation. Int. J. Mol. Sci.. 2019;20(1):164.
- [Google Scholar]
- Soft-Nanoparticle functionalization of natural hydrogels for tissue engineering applications. Adv. Healthc. Mater.. 2019;8(18):e1900506.
- [Google Scholar]
- Design and characterization of submicron formulation for a poorly soluble drug: the effect of Vitamin E TPGS and other solubilizers on skin permeability enhancement. Int. J. Pharm.. 2012;434(1–2):90-98.
- [Google Scholar]
- The applications of Vitamin E TPGS in drug delivery. Eur. J. Pharm. Sci.. 2013;49(2):175-186.
- [Google Scholar]
- ATM-CHK2-Beclin 1 axis promotes autophagy to maintain ROS homeostasis under oxidative stress. EMBO J.. 2020;39(10):e103111.
- [Google Scholar]
- Therapeutic effects of blocking β-catenin against hepatocellular carcinoma-induced activation of inflammation, fibrosis and tumor invasion. Biomed. Pharmacother.. 2021;135:111216
- [Google Scholar]
- Hyaluronic acid-mediated drug delivery system targeting for inflammatory skin diseases: a mini review. Front. Pharmacol.. 2020;11:1105.
- [Google Scholar]
- Physical study of chloramphenicol in situ gel with base hydroxypropyl methylcellulose and Poloxamer 188. J. Pharm. Bioallied Sci.. 2019;11(Suppl 4):S547-S550.
- [Google Scholar]
- The Methoxy flavonoid Isosakuranetin Suppresses UV-B-Induced Matrix Metalloproteinase-1 Expression and Collagen Degradation Relevant for Skin Photoaging. Int. J. Mol. Sci.. 2016;17(9):1449.
- [Google Scholar]
- Oral intake of collagen peptide attenuates ultraviolet b irradiation-induced skin dehydration in vivo by regulating hyaluronic acid synthesis. Int. J. Mol. Sci.. 2018;19(11):3551.
- [Google Scholar]
- Propolis Suppresses UV-Induced Photoaging in Human Skin through Directly Targeting Phosphoinositide 3-Kinase. Nutrients. 2020;12(12):3790.
- [Google Scholar]
- Preparation of Poloxamer188–PCL and study on radioprotection activity of curcumin-loaded nanoparticles. Front. Chem.. 2020;8:212.
- [Google Scholar]
- In-vitro evaluation of antioxidant, anti-elastase, anti-collagenase, anti-hyaluronidase activities of safranal and determination of its sun protection factor in skin photoaging. Bioorg. Chem.. 2018;77:159-167.
- [Google Scholar]
- Berberine-Loaded Thiolated Pluronic F127 Polymeric Micelles for Improving Skin Permeation and Retention. Int. J. Nanomed.. 2020;15:9987-10005.
- [Google Scholar]
- Microemulsions based on TPGS and isostearic acid for imiquimod formulation and skin delivery. Eur. J. Pharm. Sci.. 2018;125:223-231.
- [Google Scholar]
- Sargassum cristafoliumUVA Photoprotective Activity of Brown Macroalgae. Biomedicines. 2019;7(4):77.
- [Google Scholar]
- The effect of collagen hydrolysates from silver carp (Hypophthalmichthys molitrix) skin on UV-induced photoaging in mice: molecular weight affects skin repair. Food Funct.. 2017;8(4):1538-1546.
- [Google Scholar]
- Investigation of the mechanism of enhanced skin penetration by ultradeformable liposomes. Int. J. Nanomed.. 2014;9:3539-3550.
- [Google Scholar]
- Dual roles of TPGS based microemulsion for tacrolimus: Enhancing the percutaneous delivery and anti-psoriatic efficacy. Int. J. Pharm.. 2017;528(1–2):511-523.
- [Google Scholar]
- β-Cyclodextrin-cholic acid-hyaluronic acid polymer coated FeO-graphene oxide nanohybrids as local chemo-photothermal synergistic agents for enhanced liver tumor therapy. Colloids Surf. B Biointerfaces. 2020;199:111510
- [Google Scholar]
- Mechanism of transdermal permeation promotion of lipophilic drugs by ethosomes. Int. J. Nanomed.. 2017;12:3357-3364.
- [Google Scholar]
- Porphyra yezoensiThe Protective Effect of Mycosporine-Like Amino Acids (MAAs) from s in a Mouse Model of UV Irradiation-Induced Photoaging. Mar. Drugs. 2019;17(8):470.
- [Google Scholar]
- Ultraviolet radiation and the skin: Photobiology and sunscreen photoprotection. J. Am. Acad. Dermatol.. 2017;76(3S1):S100-S109.
- [Google Scholar]
- Recent advancements in liposome-based strategies for effective drug delivery to the brain. Curr. Med. Chem.. 2021;28(21):4152-4171.
- [Google Scholar]
- Co-hybridized composite nanovesicles for enhanced transdermal eugenol and cinnamaldehyde delivery and their potential efficacy in ulcerative colitis. Nanomedicine. 2020;28:102212
- [Google Scholar]
- Topical anesthesia therapy using lidocaine-loaded nanostructured lipid carriers: tocopheryl polyethylene glycol 1000 succinate-modified transdermal delivery system. Drug Des. Devel. Ther.. 2018;12:4231-4240.
- [Google Scholar]


