

Translate this page into:
Deciphering the mysteries of Aconitum pendulum: Unique identification of various processed products and characteristic chemical markers
⁎Corresponding authors at: State Key Laboratory of Southwestern Chinese Medicine Resources, Chengdu University of Traditional Chinese Medicine, 1166 Liutai Avenue, Wenjiang District, Chengdu 611137, China. winter9091@163.com (Shaohui Wang), zhangyi@cdutcm.edu.cn (Yi Zhang)
-
Received: ,
Accepted: ,
This article was originally published by Elsevier and was migrated to Scientific Scholar after the change of Publisher.
Abstract
Abstract
Aconitum pendulum, a member of the Aconitum genus within the Ranunculaceae family, is known for its remarkable anti-inflammatory, anti-tumor, and analgesic properties. However, the application of Aconitum pendulum in traditional medicine is often restricted by its inherent toxicity, necessitating specific processing methods to ensure safe usage. Tibetan medicine utilizes distinctive processing techniques such as the barley wine, Hezitang, and zanba frying systems to render the herb safe for medicinal use. Despite the known pharmacological importance, scant research exists on how these processing methods affect the phytochemical profile of Aconitum pendulum, indicating a necessity for comparative analysis of the resulting concoctions. In this study, we employed 1H nuclear magnetic resonance (1H NMR) spectroscopy and ultra-performance liquid chromatography coupled with quadrupole time of flight mass spectrometry (UPLC-Q-TOF-MS) to explore the metabolomic variations among different processed products of Aconitum pendulum. Multivariate data analysis techniques, including pattern recognition, allowed us to investigate the intricacies of the compound profiles. To discover signature chemical markers that can differentiate the various processed products, we conducted paired t-tests and generated heat maps highlighting the detected differences. Our integrated analysis of the 1H NMR and UPLC-Q-TOF-MS data revealed distinct chemical signatures unique to each method of Aconitum pendulum processing. By employing chemometric analysis with variable importance in projection (VIP) scores greater than 1.0, and coupled with the statistical rigor of paired t-tests (P < 0.05), we successfully identified significant chemical markers in various processed products, including ferulic acid (FA), caffeic acid (CA), 3-acetylaconitine (AAC) and benzoylaconitine (BAC). Our findings provide a rapid and robust analysis of the chemical constituencies within raw and processed Aconitum pendulum. The discovery of potential chemical markers through an array of advanced pattern recognition techniques offers a substantial contribution to the pharmaceutical analysis. The results of this research pave the way for future comparative studies and facilitate the recognition of distinctively processed Aconitum pendulum products in traditional medicine.
Keywords
Aconitum pendulum
Chemical composition
1H NMR
UPLC-Q-TOF-MS
Chemometric analysis

- 1H NMR
-
Proton nuclear magnetic resonance
- ANOVA
-
Analysis of variance
- BMRB
-
Biological magnetic reasonance data bank
- HMDB
-
The human metabolome database
- HZT
-
Hezitang products of Aconitum pendulum
- OPLS-DA
-
Orthogonal Partial Least Squares Discriminant Analysis
- PCA
-
Principal Component Analysis
- PLS-DA
-
Partial Least Squares Discriminant Analysis
- QKJ
-
Barley wine products of Aconitum pendulum
- SDBS
-
Spectral database for organic compounds
- SP
-
Raw products of Aconitum pendulum
- tR
-
Retention time
- TSP
-
3-(Trimethylsilyl)-2,2,3,3-tetradeutero-propionic acid sodium salt
- UPLC-Q-TOF-MS
-
Ultra-performance liquid chromatography coupled with quadrupole time of flight mass spectrometry
- ZB
-
Zanba products of Aconitum pendulum
- FA
-
Ferulic acid
- CA
-
caffeic acid
- AAC
-
3-acetylaconitine
- BAC
-
benzoylaconitine
Abbreviations
1 Introduction
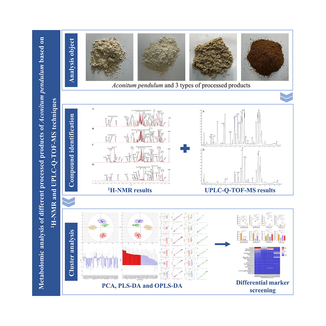
Aconitum pendulum Busch, a perennial herb from the Aconitum genus of the Ranunculaceae family, is well-known in Chinese and Tibetan medicinal circles for its diverse pharmacological capabilities. These include antitumor, anti-inflammatory, local anaesthesia, analgesia, and immunomodulation effects (Qin et al., 2002; Wada and Yamashita, 2019; Wang et al., 2022). It has gained recognition in clinical settings for its effectiveness in treating various conditions such as cancer (Fan et al., 2016; Yu et al., 2021), rheumatoid arthritis (Yu et al., 2022), neuralgia (Xie et al., 2018), and psoriasis (Karpova et al., 2002), among other diseases. Currently, research on Aconitum pendulum has become more extensive, particularly focusing on the “toxicity and effectiveness” of aconitine alkaloids. Aconitine, hypaconitine, neoconitine, and other alkaloids have shown beneficial pharmacological activities, but they are also highly toxic. Aconitine, for example, has been reported to have a potentially toxic oral dose of 0.2 mg, with 2–5 mg being a lethal dose (Sun et al., 2018), Furthermore, aconitine can cause cardiotoxicity (Zhou et al., 2013), neurotoxicity (An et al., 2022; Zhang et al., 2023), and embryotoxicity (Xiao et al., 2007). Therefore, specific preparations of Aconitum pendulum are necessary prior to its use. These preparations involve a wide range of methods, including non-heating methods (such as dipping, soaking, and bleaching in other liquid auxiliaries) and heating methods (such as baking, simmering, frying, steaming, boiling, or adding auxiliaries for steaming and boiling). Tibetan medicine prepares Aconitum pendulum in two distinct ways: heated (zanba frying) and unheated (barley wine infusion and Hezitang infusion). These two methods have different effects on the herb's chemical composition and toxicity (Fig. 1). While traditional processing methods have been documented in relevant literature and standards, they currently lack controllable indicators and standardized processing methods. Therefore, it is crucial to establish quality control measures for Aconitum pendulum products processed using different methods.
Aconitum pendulum products and different processed products. (A1) Aconitum pendulum Busch plant. (B1) Hordeum vulgare var. coeleste Linnaeus. (C1) Terminalia chebula Retz. (D1) Zanba. (A2) SP powder. (B2) QKJ product powder. (C2) HZT product powder. (D2) ZB product powder.
The quality control of different processed products from Aconitum pendulum is currently limited to studying individual products. Content determination or fingerprinting of aconitum alkaloids is primarily done using mass spectrometry or HPLC. While the processing technology of Aconitum pendulum has been clarified in the early stage, there is still a lack of research comparing the pharmacological components of different processed Aconitum pendulum. 1H NMR offers advantages such as comprehensive detection of chemical constituents, simultaneous detection of primary and secondary metabolites, rapid and accurate determination, and high exclusivity (Emwas, 2015; Ludwig and Viant, 2010). Whereas, UPLC-Q-TOF-MS provides advantages like high sensitivity, high resolution, high throughput, wide dynamic range, and ultra-fast separation and identification (Kim et al., 2011). Both methodologies have unique strengths in analyzing Aconitum pendulum and can complement each other to provide a more detailed understanding.
This study investigated the metabolic compositions of raw products of Aconitum pendulum (SP), barley wine products (QKJ), Hezitang products (HZT), and zanba products (ZB) using metabolomics techniques such as 1H NMR and UPLC-Q-TOF-MS. The metabolite differences between different processed products of Aconitum pendulum were established by combining chemometrics methods including Principal Component Analysis (PCA), Partial Least Squares Discriminant Analysis (PLS-DA), and Orthogonal Partial Least Squares Discriminant Analysis (OPLS-DA). This multidimensional perspective allows for the investigation of the quality effects of Aconitum pendulum with different processed products, and provides insights for follow-up quality control, rational use of the medication in clinic, and its modernization, development, and utilization.
2 Material and method
2.1 Sample sources and chemical reagents
Aconitum pendulum raw products, barley wine products, Hezitang products, and zanba products were provided the College of Ethnomedicine Laboratory of Chengdu University of TCM. The concoction process for barley wine products involved cutting Aconitum pendulum into 1.5 cm thickness and adding 5 times the amount of barley wine for soaking and fermentation. After 24 h, the mixture was taken out, dried, and powdered through a No. 4 sieve. Similarly, for Hezitang products, Aconitum pendulum was cut into 1 cm thickness and soaked in 3 times the amount of Hezitang for 24 h. The mixture was then taken out, dried, and powdered through a No. 4 sieve. As for Zanba products, Aconitum pendulum was cut into 2 cm thickness and stir-fried with 3 times the amount of zanba powder at 140 °C for 60 min. The mixture was then sun-dried, powdered through a No. 4 sieve, and subjected to the same stir-frying process at 140 °C for 60 min. All the raw products from the same batch were used for each concoction, resulting in a total of 6 batches for each kind of concoction. Approximately 10 g of each batch sample was processed and stored in a refrigerator at −4 °C until analysis was required.
D2O (purity: 99.9 %, Batch No.: E090001) and CD3OD (purity: 99.7 %, Batch No.: E090029) were purchased from Anhui Zesheng Science and Technology Co. Ltd.; TSP, Batch No.: RH392646) was purchased from Shanghai Eon Chemical Technology Co; KH2PO4 (Lot No. 05.001.1872) was purchased from Chengdu Cologne Chemical Co; the controls aconitine (Batch No.: MUST-22041410), hypaconitine (Batch No.: MUST-22032312) and carotenoside (Batch No.: MUST-22060904) were purchased from Chengdu Must Bio-technology Co. Ltd; benzoylaconitine (Batch No: B01011908014), 3-Deoxyaconitine (Batch No.: T04311812016), 3-Acetylaconitine (Batch No.: Y02502204029), songoramine (Batch No.: Y13511804026), neoline (Batch No.: N01902209015), montaflorin (Batch No.: M00902006015), β-sitosterol (Batch No.: G00202005008) and hesperidin (Batch No.: C00601910011) were purchased from Chengdu Ruifensidan Biotechnology Co., Ltd.
2.2 Sample handling for 1H NMR and UPLC-Q-TOF-MS
Precisely 0.20 g of the raw product and the three artillery products were weighed, placed in a stoppered conical flask, Then, 1.0 mL of CD3OD solution and 0.2 mL of D2O solution (containing 0.4 mg/mL TSP and 12.32 mg/mL KH2PO4) were added. The mixture was shaken well, tightly plugged, and subjected to ultrasonication for 30 min (300 W, 40 kHz). After cooling down, the mixture was filtered using a 0.22 μm microporous filtration membrane. From the filtrate, 600 μL was taken and transferred into a standard 5 mm NMR tube for 1H NMR determination.
For UPLC-Q-TOF-MS analysis, 0.25 g of the raw Aconitum pendulum and three types of artillery products (passed through a No. 4 sieve) were precisely weighed. Each type of artillery product was prepared in 6 parallel samples. The samples were placed in stoppered conical flasks and 25 mL of methanol solution was added. The flasks were tightly stoppered and subjected to ultrasonication at a temperature below 25 °C for 30 min (300 W, 40 kHz). After cooling down, the flasks were weighed and the weight was adjusted to the full weight with the methanol solution. The mixture was shaken well and filtered. The filtrate was then centrifuged at high speed for 5 min, followed by passing the supernatant through a 0.22 μm microporous membrane.
2.3 1H NMR spectroscopy
A QCI inverse quadruple resonance ultralow temperature probe was utilized for detection on an XEO 700 MHz model 24-bit autosampler nuclear magnetic resonance spectrometer (Bruker BioSpin GmbH, Germany). To suppress residual water peak signals, a Carr-Purcell-Meiboom-Gill pulse sequence was employed. The measurement temperature was set at 25 °C, with a spectral width of 11462.8 Hz, pulse delay time of 4.0 s, sampling time of 1.5008 s, 64 acquisitions, and a pulse width of 10.89 µs.
2.4 UPLC conditions
UPLC-Q-TOF-MS profiles were obtained using an ACQUITF UPLC I-Class (Waters, USA) equipped with an ultra-high liquid chromatograph. Chromatographic separation was performed on an Agilent SB-C18RRHD column (2.1 mm × 50 mm, 1.7 μm). The mobile phases consisted of 0.1 % formic acid in water as solvent A and acetonitrile as solvent B. The flow rate was set at 0.3 mL/min, the column temperature was maintained at 30 °C, and the injection volume was 0.2 μL. Gradient elution was employed for separation as follows: 0–1 min, 98–93 % A; 1–3 min, 93–89 % A; 3–8 min, 89–85 % A; 8–13 min, 85–70 % A; 13–16 min, 85–70 % A; 16–20 min, 70–64 % A; 20–26 min, 64–30 % A; 26–27 min, 30–15 % A).
2.5 MS conditions
A Xevo G2-XS TOF mass spectrometer (Waters, USA) was used in this study. It was equipped with an electrospray ionization (ESI) source for accurate mass detection and MS/MS fragmentation analysis. The instrument was operated under both positive and negative ion modes. The experimental conditions included a capillary voltage of 2000 V, a cone-well voltage of 40 V, a desolventization temperature of 450 °C, an ion source temperature of 150 °C, a desolventization gas flow rate of 600 L/h, a cone gas flow rate of 50 L/h, a scanning time of 0.3 s, a scanning interval of 30 s, a scanning range of m/z of 50–1200 Da, and a scanning mode of MSe.
2.6 1H NMR data analysis
The measured 1H NMR free induction decay (FID) signals were used to obtain the Fourier transform (FT) in the MestReNova 14.3.0 software. The phase was adjusted and the baseline was corrected. Chemical shift values for all samples were corrected using TSP peaks (0.0 ppm) as a reference. Attribution of 1H NMR signals of 10 secondary metabolites, including aconitine, hypaconitine, benzoylaconitine (BAC), 3-Acetylaconitine (AAC), β-sitosterol, hesperidin, linarin, neoline, songoramine, and daucosterol, was determined using the 'standard addition characterization' test. This involved adding 2 mg of each control into the test solution, dissolving them by sonication for 2 min, and then subjecting them to 1H NMR determination (Bai et al., 1995; Fan et al., 2022; Sun et al., 2009). The signal attribution was determined by comparing the differences in the 1H NMR spectra before and after the addition of the control using the MestReNova 14.0 software. Additionally, the signals were cross-referenced with the SDBS (https://sdbs.db.aist.go.jp), BMRB (https://bmrb.io), HMDB (https://hmdb.ca) databases, and relevant literature for primary metabolites such as amino acids and sugars.
The spectra in the range of 0.00–10.0 ppm were segmented and integrated using MestReNova14.3.0 software. The integration was performed in units of 0.04 ppm and normalization was done with the total peak area to eliminate concentration deviation of the chemical constituents among different artillery products of the Aconitum pendulum. The normalized integral data were output in ASCII format, and the corresponding signal peak area values of each chemical shift segment were obtained. The signals from the CD3OD solvent (3.30–3.35 ppm) were subtracted to eliminate the effect of the solvent peaks on the surrounding peaks. The final data matrix obtained was imported into SIMCA 14.1 software for multivariate data analysis, specifically PCA, to examine the intrinsic variations in the dataset and provide an overview of the variations between the sample groups. Subsequently, the 1H NMR data underwent PLS and OPLS for discrimination between different sample groups. Metabolites relevant to motif isolation are represented by the corresponding S-Plot plots, where each point represents a fragment of the 1H NMR spectral region. Alignment tests were then performed to validate the OPLS-DA model.
2.7 UPLC-Q-TOF-MS data analysis
Gross ion flow diagrams of all the samples were obtained by analyzing and determining the UPLC-Q-TOF-MS of Aconitum pendulum and its three artillery products. Three parallel determinations were performed for each group. The mass spectrometry data were processed and analyzed, comparing, and analyzing the retention time, primary and secondary mass spectral information of the target compounds with relevant literature for structural identification (such as tR, fragmentation ion peaks, and fragmentation cleavage pattern). Data preprocessing was conducted using Sever software, and the processed data were imported into SIMCA 14.1 software for PCA, PLS-DA, and OPLS-DA analyses. The VIP value >1 was used as the reference standard to screen the different components between the raw product of Aconitum pendulum and the three kinds of artillery products. The relative contents of the different components were compared using GraphPad Prism 9.0.0 software.
2.8 Statistical methods
GraphPad Prism 9.0 software was utilized to perform a one-way ANOVA for testing the significance of differences in metabolite levels among various processed products of Aconitum pendulum. Paired t-tests were conducted to examine the differences between the raw product and the three groups of processed products, and all statistical analyses considered differences to be significant at a P < 0.05.
2.9 1H NMR methodological investigation
2.9.1 Precision inspection
To assess the precision of the Aconitum pendulum artillery products test solution, five consecutive 1H NMR measurements were performed. The obtained spectra were processed using 1H NMR data processing methods, resulting in five groups of relative peak area integral values. The first group of measurement data was taken as a reference, and the correlation coefficients between the five groups of data were calculated using Excel software. The calculated correlation coefficients were 0.996, 0.995, 0.996, 0.997, and 0.993, respectively. These values indicate that the instrument precision is excellent, as all of them are greater than 0.99.
2.9.2 Repeatability study
Five portions of Aconitum pendulum artillery products powder were taken to prepare the test solution using the 1H NMR method. Separate 1H NMR determination and data processing were conducted, resulting in five sets of relative peak area integral value data. Using the Excel software, the correlation coefficients between these data sets were calculated, with the first group of determination data serving as the reference. The calculated correlation coefficients were 0.993, 0.992, 0.995, 0.995, 0.995, and 0.994, all of which were above 0.99, indicating excellent reproducibility of the method.
3 Results
3.1 1H NMR analysis
The typical 1H NMR spectra of the raw product and its three artifacts are displayed in Fig. 2. Through 1H NMR analysis of different artillery products of Aconitum pendulum, a total of 24 chemical compositions were identified from SP, 21 chemical compositions from QKJ, 25 chemical compositions from HZT, and 19 chemical compositions from ZB.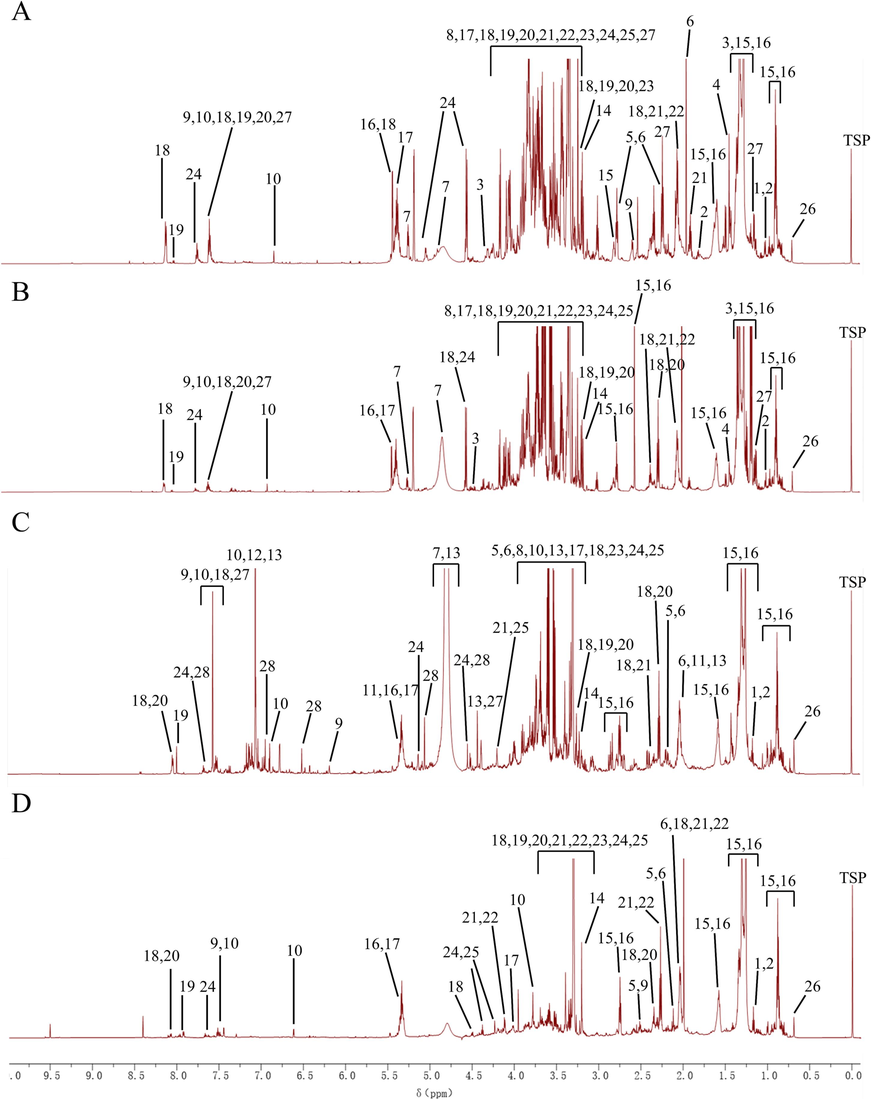
Representative 1H NMR spectra of Aconitum pendulum and three processed products. (A) SP product powder; (B) QKJ product powder; (C) HZT product powder; (D) ZB product powder. 1, Isoleucine; 2, Valine; 3, Threonine; 4, Alanine; 5, Proline; 6, Glutamate; 7, Cystine; 8, Glycine; 9, Caffeic acid (CA); 10, Ferulic acid (FA); 11, Quinic acid; 12, Gallic acid; 13, Chebulic acid; 14, Choline; 15, Saturated fatty acids; 16, Unsaturated fatty acids; 17, Sucrose; 18, 3-Acetylaconitine (AAC); 19, Aconitine; 20, Hypaconitine; 21, Neoline; 22, 14-O-acetylneoline; 23, Talatisamine; 24, Benzoylaconitine (BAC); 25, Fuziline; 26, Sterols; 27, Diisobutyl phthalate; 28, Rutin.
The 1H NMR pattern can be roughly categorized into three regions. The high-field region (3.1–0.0 ppm) mainly includes isoleucine, valine, alanine, proline, glutamic acid, saturated fatty acids, unsaturated fatty acids, sterols, and chebulinic acid. The middle-field region (5.5–3.1 ppm) consists of threonine, cystine, glycine, quinic acid, ferulic acid (FA), saturated fatty acids, unsaturated fatty acids, choline, sucrose, dibutyl phthalate, 14-O-acetylneoline, talatisamine, fuziline, and BAC. The low-field region (10.00–5.5 ppm) contains caffeic acid (CA), rutin, AAC, aconitine, hypaconitine, neoline, BAC, and other components. The information about the metabolites identified by 1H NMR is shown in Table 1.
No.
Compound
Molecular formula
δH (ppm)
S
Q
H
Z
Ref.
1
C6H13NO2
Isoleucine
0.96 (t), 1.01 (d)
√
√
√
(Kerfah et al., 2015)
2
C5H11NO2
Valine
1.01 (d), 1.06 (d)
√
√
√
√
(Kerfah et al., 2015)
3
C4H9NO3
Threonine
1.35 (d), 4.29 (m)
√
√
(Wang et al., 2015)
4
C3H7NO2
Alanine
1.48 (d)
√
√
(An et al., 2015)
5
C5H9NO2
Proline
2.15 (m), 2.51 (m), 3.73 (m)
√
√
√
(Roberts et al., 2016)
6
C5H9NO4
Glutamate
2.03 (m), 2.15 (m), 2.51 (m)
√
√
√
(Giessen et al., 2017)
7
C6H12N2O4S2
Cystine
4.80 (s)
√
√
√
(Key et al., 2015)
8
C2H5NO2
Glycine
3.54 (m)
√
√
√
(Ryu et al., 2018)
9
C9H8O4
Caffeic Acid (CA)
6.25 (s), 7.55 (t)
√
√
√
√
(Pariyani et al., 2017)
10
C10H10O4
Ferulic Acid (FA)
3.82 (m), 6.78 (dt), 7.55 (t)
√
√
√
√
(Ikeda et al., 2020)
11
C7H12O6
Quinic Acid
1.90 (p), 5.40 (m)
√
(Huang et al., 2018)
12
C7H6O5
Gallic Acid
7.05 (m)
√
(Etienne et al., 2021)
13
C14H12O11
Chebulic Acid
2.04 (tt), 3.67 (m), 4.41(m), 4.80 (m), 7.07 (m)
√
(Lee et al., 2007)
14
C5H14ON+
Choline
3.20 (s)
√
√
√
√
(Ryu et al., 2018)
15
——
Saturated Fatty Acids
0.89 (m), 1.35–1.27 (m), 1.57 (m), 2.50 (t)
√
√
√
√
(Ellis et al., 2019)
16
——
Unsaturated Fatty Acids
0.89 (m), 1.35–1.27 (m), 1.57 (m), 2.34 (m), 2.50 (t), 5.36 (m)
√
√
√
√
(Ellis et al., 2019)
17
C12H22O11
Sucrose
4.13 (d), 5.36 (d)
√
√
√
√
(Karel et al., 2020)
18
C36H49NO12
3-Acetylaconitine (AAC)
1.39–1.33 (m), 2.05–1.97 (m), 2.22 (m), 2.34 (m), 2.78 (dt), 3.17 (m), 3.21 (m), 3.75 (td), 3.82–3.76 (m), 4.09–3.95 (m), 4.88 (dd), 7.55 (t), 8.07 (d)
√
√
√
√
(He et al., 2011)
19
C34H47NO11
Aconitine
1.38 (m), 3.11 (m), 3.16 (m), 3.28 (m), 3.75 (m), 4.88 (dd), 7.44–8.06 (m)
√
√
√
√
(Qi et al., 2016)
20
C33H45NO10
Hypaconitine
1.35 (m), 2.34 (m), 3.16 (m), 3.26 (m), 3.28 (m), 3.75 (m), 4.88 (dd), 7.44–8.06 (m)
√
√
√
√
(Qi et al., 2016)
21
C24H39NO6
Neoline
1.13 (t), 1.94 (s), 2.06 (m), 2.25–2.17 (m), 2.34 (m), 2.76 (t), 3.34 (m), 3.44 (m), 3.75 (m), 4.13 (d)
√
√
√
√
(Xiong et al., 2012)
22
C26H41NO7
14-O-acetylneoline
1.13 (t), 2.06 (m), 2.34 (m), 3.34 (m), 3.43 (m), 3.64 (m), 4.13 (d)
√
√
√
(Shim et al., 2003)
23
C24H39NO5
Talatisamine
1.06 (d), 2.99 (t), 3.11 (m), 3.22 (m), 3.28 (m), 3.29–3.14 (m), 3.34 (m), 3.62 (d), 4.86 (d)
√
√
√
√
(Zhao et al., 2018)
24
C32H45NO10
Benzoylaconitine (BAC)
1.13 (t), 3.28 (m), 3.31 (m), 3.34 (m), 3.75 (m), 4.53 (t), 5.01 (d), 7.55 (t), 8.07 (d)
√
√
√
√
(Huang et al., 2007)
25
C24H39NO7
Fuziline
1.13 (t), 3.31 (m), 3.34 (m), 3.43 (m), 4.06 (d), 4.13 (d)
√
√
√
√
(Xiong et al., 2012)
26
——
Sterols
0.69 (s)
√
√
√
√
(Sun et al., 2021)
27
C16H22O4
Diisobutyl Phthalate
1.06 (d), 2.06 (m), 4.13 (d), 7.44–8.06 (m)
√
√
√
(Glowinkowski et al., 1997)
28
C27H30O16
Rutin
4.55 (s), 5.01 (m), 6.52 (s), 6.98 (m), 7.69 (m)
√
(Sharma et al., 2022)
3.2 UPLC-Q-TOF-MS analysis
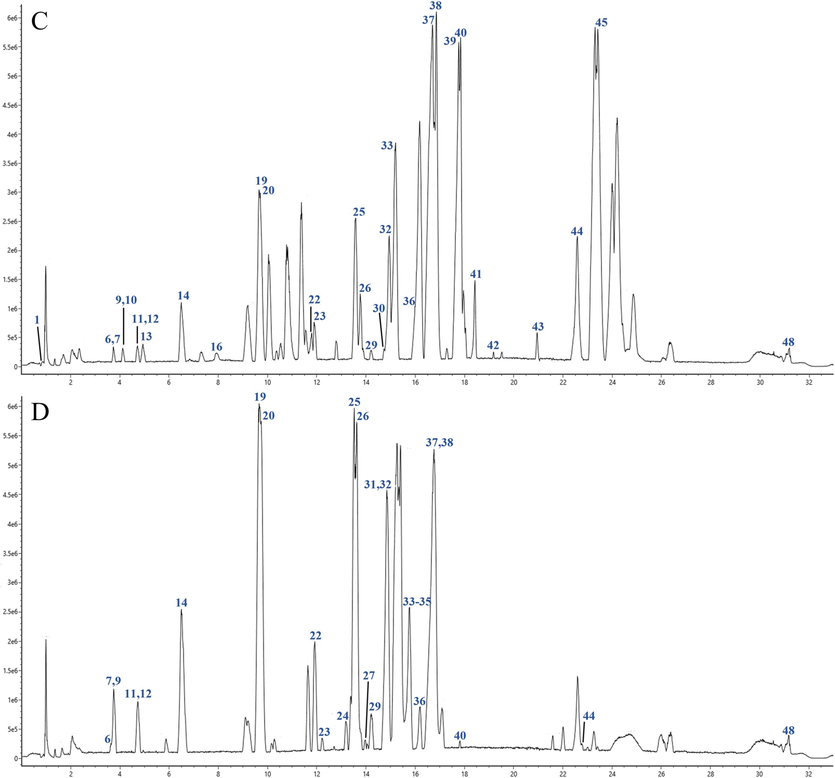
UPLC-Q-TOF-MS is a rapid and sensitive analytical method used for determining compounds in various artillery products of Aconitum pendulum. The ion flow chromatograms of raw Aconitum pendulum and three artillery products in positive ion mode are shown in Figs. 3-1 and 3-2. Based on mass spectrometry data and retention time, a total of 43 compounds were identified by SP, 40 compounds were identified by QKJ, 45 compounds were identified by HZT, and 45 compounds were identified by ZB. Table 2 provides information on the chemical compositions found in the raw Aconitum pendulum and its three artillery products. This study aimed to examine the accurate m/z and retention time of each constituent in the raw and three artillery products of Aconitum pendulum. Both positive and negative ion modes were used, and it was found that the positive ion mode provided better sensitivity and higher ionization efficiency for the aconitum alkaloids. A more typical ESI-MS/MS cleavage spectrum of the three aconitum alkaloids is shown in Fig. 4. Note: “√”: the component is present in the concoction; “*”: use the control to compare the components.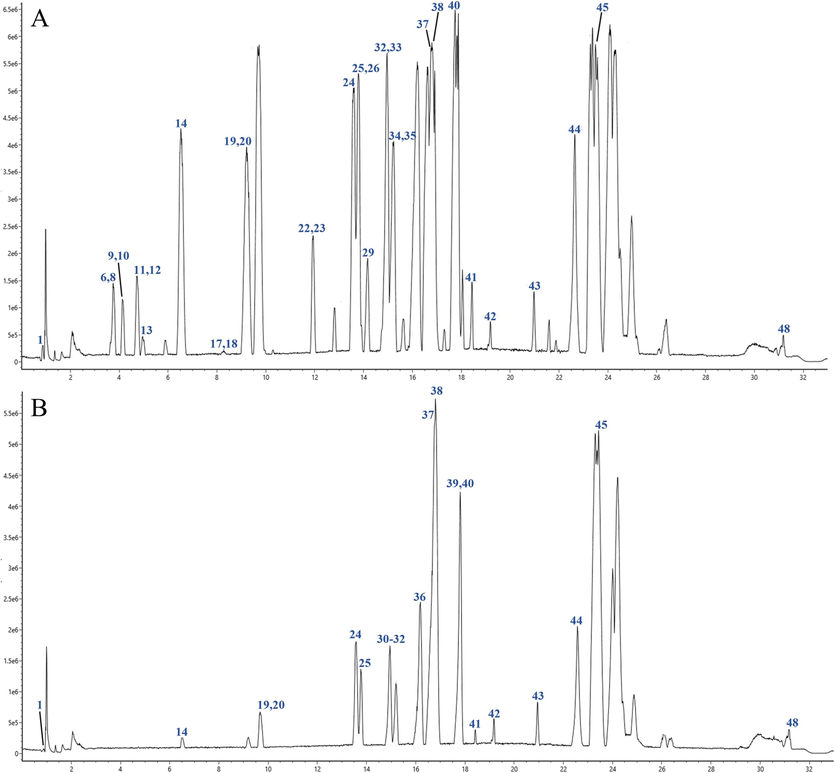
Total ion current diagram of positive ion modes of test sample of different processed products of Aconitum pendulum. (A) SP product powder; (B) QKJ product powder; (C) HZT product powder; (D) ZB product powder. The numbering sequence is the same as Table 2.
Total ion current diagram of positive ion modes of test sample of different processed products of Aconitum pendulum. (A) SP product powder; (B) QKJ product powder; (C) HZT product powder; (D) ZB product powder. The numbering sequence is the same as Table 2.
NO.
tR/min
Formula
Name
Ion
Measured value
ppm
MS2
S
Q
H
Z
Ref.
1
0.84
C6H12O6
D-glucose
[M + H]+
181.0636
1
109.02841
√
√
√
√
(Ullah et al., 2009)
2
0.92
C7H12O6
Quinic acid
[M − H]−
191.0624
−4.2
101.0244, 113.0244
√
√
√
√
(Silinsin and Bursal, 2018)
3
2.06
C9H8O4
Caffeic acid (CA)
[M − H]−
179.0422
−0.4
163.0392, 135.0137, 107.0217
√
√
√
√
(Gong et al., 2020)
4
3.13
C12H8O4
Bergapten
[M + H]+
217.0425
1.1
203.0339
√
(Li et al., 2014)
5
3.14
C7H6O2
Benzoic acid
[M − H]−
121.0367
−0.7
107.0491
√
√
√
(Zhang et al., 2010)
6
3.76
C23H37NO6
Lappaconine
[M + H]+
424.2623
0.5
374.2326
√
√
√
√
(Zhang et al., 2020)
7
3.76
C14H14O4
Marmesin
[M + H]+
247.0902
3.7
161.0961
√
√
(Kim et al., 2011)
8
3.9
C22H29NO3
Songoramine*
[M + H]+
356.2134
−3.8
192.1383
√
(Ye et al., 2021)
9
4.07
C24H39NO9
Mesaconine
[M + H]+
486.2633
1.6
454.2799, 436.2772
√
√
√
√
(Liu et al., 2017)
10
4.15
C24H39NO7
Fuziline
[M + H]+
454.2732
1.2
436.2694
√
√
√
√
(Chen et al., 2014)
11
4.74
C25H41NO9
Aconine
[M + H]+
500.2788
1.3
482.2748, 450.2486
√
√
√
√
(Liu et al., 2017)
12
4.76
C10H10O4
Ferulic acid (FA)
[M + H]+
195.0577
−1
149.0744, 134.0362
√
√
√
√
(He et al., 2012)
13
5.13
C24H39NO8
Hypaconine
[M + H]+
470.2674
−0.4
438.2486, 406.2350
√
√
√
√
(Liu et al., 2017)
14
6.54
C24H39NO6
Neoline*
[M + H]+
438.2784
1.5
420.2745, 388.2482
√
√
√
√
(Liu et al., 2017)
15
7.94
C27H24O18
1,3,6-tri-o-galloyl-β-D-glucose
[M − H]−
635.0988
3.9
169.0137
√
√
√
√
(Gong et al., 2020)
16
7.94
C7H6O5
Gallic acid
[M + H]+
171.0217
1.1
127.0390, 109.0284
√
√
(Sun et al., 2014)
17
8.22
C24H39NO5
Talatisamine
[M + H]+
422.2826
−0.6
358.2377
√
√
√
(Liu et al., 2017)
18
8.3
C22H33NO2
Atisine
[M + H]+
344.2508
−0.8
326.2478, 282.1852
√
√
√
√
(Chen et al., 2021)
19
9.7
C26H41NO7
Delcorine
[M + H]+
480.2888
1
462.2850, 430.2588
√
√
√
√
(Song et al., 2007)
20
9.94
C20H24N2O2
Quinine
[M + H]+
325.1841
1
278.1414
√
√
√
√
(Marcsisin et al., 2013)
21
10.86
C14H6O8
Ellagic acid
[M − H]−
301.0061
−0.7
166.9986, 123.0067
√
√
√
√
(Ferreres et al., 2013)
22
11.86
C27H41NO8
Deltaline
[M + H]+
508.2853
4.2
494.3112, 462.2850
√
√
√
√
(Chen et al., 2019)
23
12.17
C24H38NO5
Szechenyianine F
[M + H]+
421.2744
−1.5
404.2432, 154.1226
√
√
√
√
(Shen et al., 2018)
24
13.46
C33H45NO12
Beiwutine
[M + H]+
648.2965
3.6
586.3011
√
√
√
√
(Liu et al., 2017)
25
13.7
C32H44N2O9
Ranaconitine
[M + H]+
601.3050
0.5
584.2728, 551.3116, 372.1806
√
√
√
√
(Zhang et al., 2020)
26
13.78
C32H45NO10
Benzoylaconitine (BAC)
[M + H]+
604.2695
2.5
586.2825, 554.2521, 522.2450, 105.0337
√
√
√
√
(Xu et al., 2020)
27
14.00
C31H43NO7
14-O-acetylneoline
[M + H]+
542.3024
−2.8
135.0441, 118.0413
√
√
(Wangchuk et al., 2015)
28
14.03
C31H43NO7
14-Benzoylneoline
[M + H]+
542.3037
−0.4
460.2694, 432.2381, 135.0441, 107.0491
√
√
√
(Chen et al., 2014)
29
14.15
C32H43NO9
16-epi-pyroaconitine
[M + H]+
586.2940
0.4
554.2748, 522.2486
√
√
√
√
(Shao and Kong, 2019)
30
14.60
C36H51N3O10
Avadharidine
[M + H]+
686.3580
0.8
669.3256
√
√
√
√
(Shamma et al., 1979)
31
14.64
C33H45NO11
Mesaconitine
[M + H]+
632.2991
−0.3
572.2854, 540.2805
√
√
√
√
(Liu et al., 2017)
32
14.86
C32H45NO9
Benzoyldeoxyaconine
[M + H]+
588.3084
−1.8
558.2905
√
√
√
√
(Liu et al., 2017)
33
15.65
C37H51NO13
3-O-Acetyljesaconitine
[M + H]+
718.3372
1.6
658.3221, 626.2232
√
√
√
√
(Mori et al., 1991)
34
15.71
C33H45NO10
Hypaconitine*
[M + H]+
616.3041
−0.4
584.2991, 556.1848, 524.2173
√
√
√
√
(Chen et al., 2014)
35
15.83
C36H49NO12
3-Acetylaconitine* (AAC)
[M + H]+
688.3253
−0.2
107.0491
√
√
√
√
(Wei et al., 2015)
36
16.05
C31H43NO10
Benzoylmesaconine*
[M + H]+
590.2913
4.3
558.2698
√
√
√
√
(Zhang et al., 2008)
37
16.91
C35H49NO11
3-Deoxyjesaconitine
[M + H]+
660.3310
0.7
508.2694, 135.0441
√
√
√
√
(Mori et al., 1991)
38
16.92
C34H47NO11
Aconitine*
[M + H]+
646.3151
0.3
614.2960, 586.4011, 554.27484, 522.24863, 368.18602
√
√
√
√
(Zhang et al., 2008)
39
17.59
C30H37NO8
Flavumoline B
[M + H]+
540.2517
−0.4
107.0491
√
√
(Zhang et al., 2021)
40
17.76
C34H47NO10
3-Deoxyaconitine*
[M + H]+
630.3201
0.1
598.3011, 538.2799, 510.2486
√
√
√
√
(Mori et al., 1991)
41
18.48
C36H51NO11
Szechenyine
[M + H]+
674.3450
−1.8
644.3229
√
√
√
√
(Shen et al., 2018)
42
19.21
C8H10O2
p-tyrosol
[M + H]+
139.0680
−0.3
105.0699
√
√
√
√
(Guo et al., 2014)
43
20.81
C19H28O2
Dehydroepiandrosterone
[M − H]−
287.2102
4.3
271.2056
√
√
(Yoo and Napoli, 2019)
44
22.77
C16H22O4
Dibutyl phthalate
[M + H]+
279.1520
0.6
149.05971
√
√
√
√
(Chang et al., 2013)
45
23.67
C39H55NO11
Szechenyianine E
[M + H]+
714.3790
2.2
586.30101, 570.3061, 107.0491
√
√
√
√
(Song et al., 2018)
46
28.4
C18H34O2
Oleic acid
[M + H]+
283.2555
−1.4
109.1012
√
√
√
√
(Zhao et al., 2021)
47
30.06
C37H50N2O10
Methyllycaconitine
[M − H]−
681.3457
−1.1
107.0491
√
√
√
√
(Nirogi et al., 2011)
48
31.26
C9H8O3
p-coumaric acid
[M + H]+
165.0480
3.7
119.0491
√
√
√
√
(Li et al., 2012)
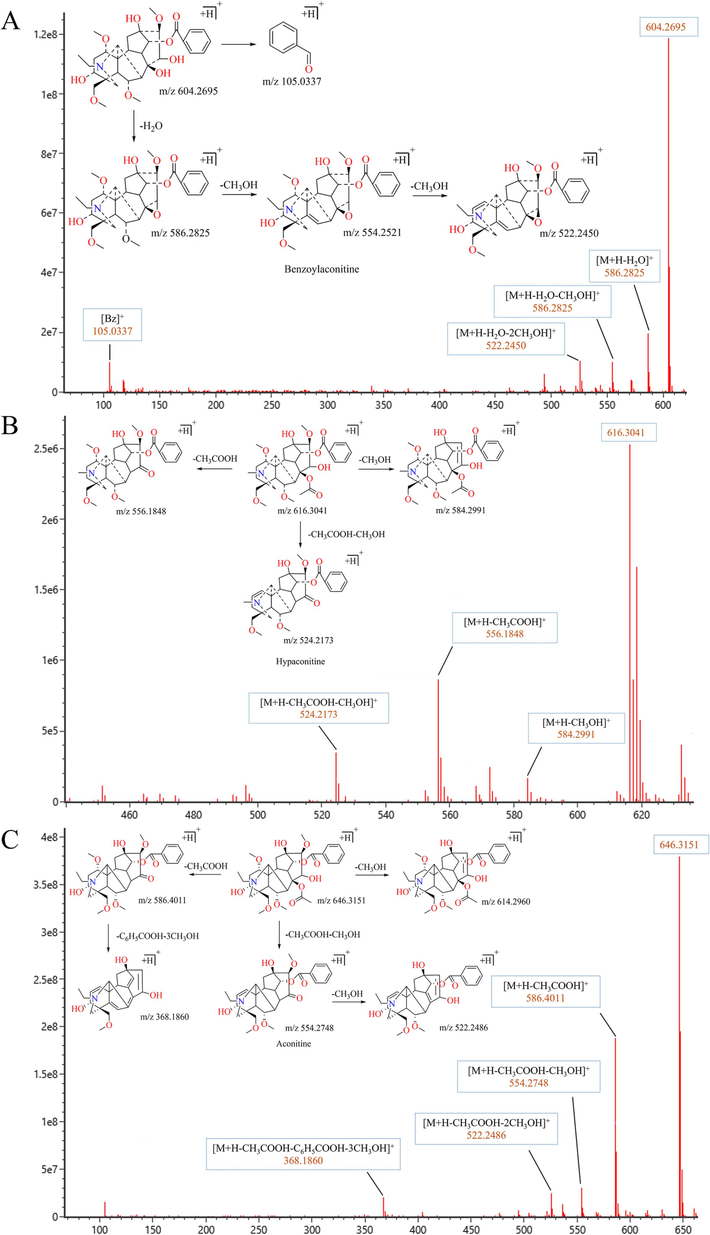
Secondary mass spectrogram and pyrolysis pathway of Aconitum Alkaloids. (A) Benzoylaconitine (BAC); (B) Hypaconitine; (C) Aconitine.
BAC (C32H45NO10, Fig. 4A) had a retention time of 13.78 min, a quasi-ionic peak [M + H]+ of 604.2695, and the highest abundance of fragment ions in the secondary fragments was m/z 586.2825 [M + H-H2O]+, followed by the loss of one molecule of methyl m/z 554.2521 [M + H-CH3OH-H2O]+ and loss of another molecule of methyl to gain m/z 522.2450 [M + H-2CH3OH-H2O]+. While benzoyl side chain cleavage produces side chain benzoyl fragment ion m/z 105.0337 (C7H5O+). Retention time of hypaconitine (C33H45NO10, Fig. 4B) was 15.71 min with a quasi-ion peak [M + H]+ of 616.3041, with fragment ions m/z 584.2991 [M + H-CH3OH]+ and m/z 556.1848 [M + H-CH3COOH]+ gained in the secondary mass spectra and loss of one molecule of methyl and one molecule of acetic acid gained fragments m/z 524.2173 [M + H-CH3OH-CH3COOH]+.With a retention time of 16.92 min and a quasi-ionic peak [M + H]+ of 646.3151, aconitine (C34H47NO11, Fig. 4C) lost one molecule of CH3COOH to gain the fragmentation ion m/z 586.4011 [M + H-CH3COOH]+, and went on to lose one molecule of C6H5COOH and three molecules of CH3OH to gain the fragmentation ion m/z 368.1860 [M + H-CH3COOH-C6H5COOH-3CH3OH]+. Or loss of one molecule of CH3OH gains the fragment ion m/z 614.2960 [M + H-CH3OH]+. When the parent ion loses one molecule of CH3COOH and one molecule of CH3OH to gain the fragment ion m/z 554.2748 [M + H-CH3COOH-CH3OH]+, and continues to lose one molecule of CH3OH to gain the fragment ion m/z 522.2486 [M + H-CH3COOH-2CH3OH]+.
3.3 Chemometric data analysis
3.3.1 PCA analysis
PCA is a statistical method used for unsupervised dimensionality reduction in multivariate data. It measures the variability of the data using variance or sum of squared deviations, which simplifies the data structure and reduces the dimensions of the raw data with high variability. This is helpful in observing the distribution characteristics of different sample data. Aconitum pendulum spectrogram data from different batches and concoctions are often complex with many variables. PCA analysis can effectively reduce the complexity of the data and characterize it with a few representative main variables. The most commonly used tools in PCA analysis are the PCA principal component cumulative contribution plots and score plots. These plots help determine if the metabolic fingerprints of each Aconitum pendulum sample are unique enough to distinguish the raw Aconitum pendulum product from the three artillery products and to identify biomarkers for each artillery product. The score plot, where each point represents a separate sample, groups together those with comparable variance.1H NMR (Fig. 5A) and UPLC-Q-TOF-MS (Fig. 5B) obtained PCA score plots show a clear separation between the raw product of Aconitum pendulum and the three artillery products. The R2X and Q2 values for 1H NMR are 0.985 and 0.972, respectively, while for UPLC-Q-TOF-MS, they are 0.739 and 0.607. To investigate the underlying causes for the classification of different artifacts of Aconitum pendulum and identify potential metabolic markers for identification, a further load map analysis was conducted (Fig. 5C and D). In this analysis, primary components were identified as variables that contribute significantly, with a larger absolute value indicating higher importance (Chen, 2009). The results suggest that isoleucine, threonine, glycine, CA, FA, AAC, BAC, and choline may be the major differential metabolites in the 1H NMR results. Additionally, the UPLC-Q-TOF-MS results provided further confirmation that CA, FA, AAC, and BAC could be the main differential metabolites responsible for the different processed products of Aconitum pendulum.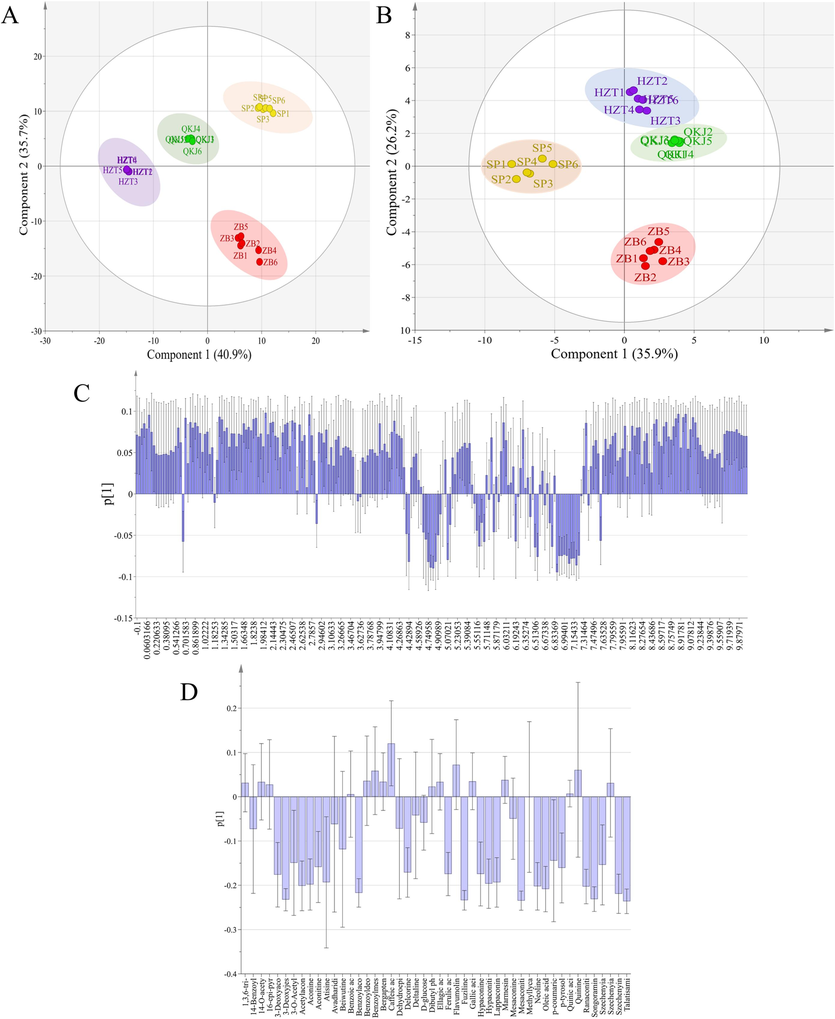
PCA analysis score chart and load chart of different processed products of Aconitum pendulum. (A) PCA score map of 1H NMR; (B) PCA score chart of UPLC-Q-TOF-MS; (C) PCA load diagram of 1H NMR; (D) PCA load diagram of UPLC-Q-TOF-MS.
3.3.2 PLS-DA analysis and OPLS-DA analysis
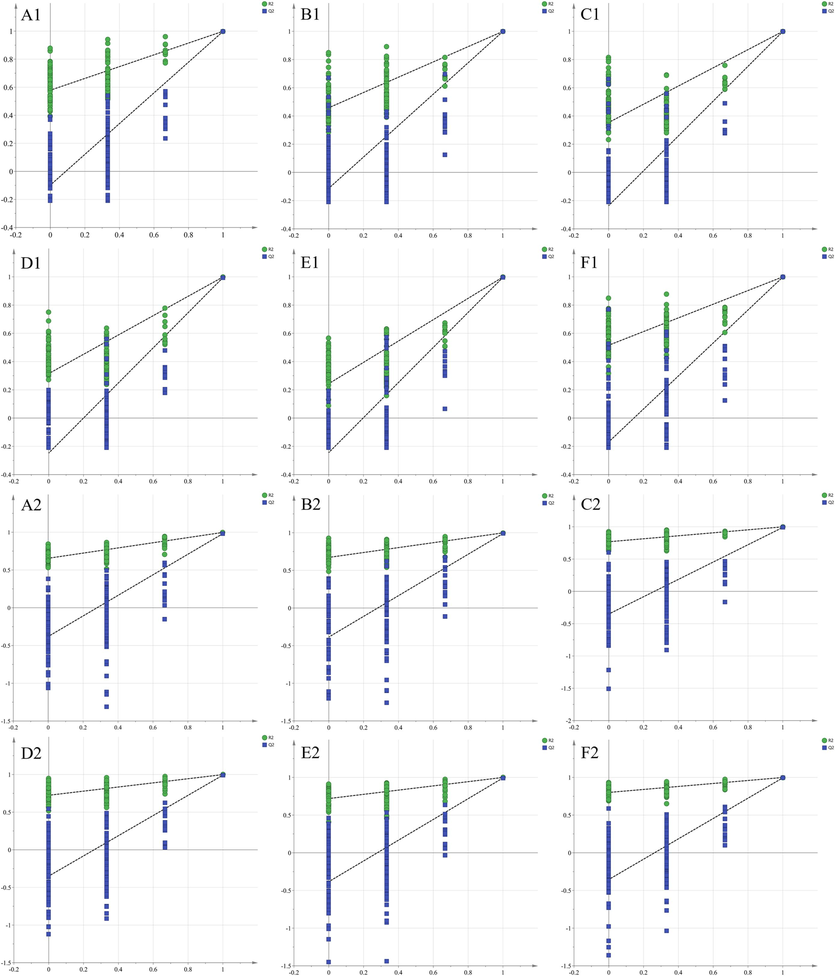
Partial Least Squares (PLS) is a relatively new analytical method used for multivariate statistical data analysis. PLS-DA (PLS-discriminant analysis) is a commonly employed supervised pattern recognition method that is particularly sensitive to variables with small correlations. It focuses on identifying inter-group differences while minimizing random differences within groups. This approach is beneficial for studying differences between different groups and identifying the main components responsible for these differences. PLS-DA has been found to be more effective than PCA analysis (Ruiz-Perez et al., 2020). On the other hand, OPLS-DA (Orthogonal Projections to Latent Structures Discriminant Analysis) is another supervised pattern recognition method commonly used for analyzing a single dependent variable, especially in metabolomic screening of differential metabolites. OPLS-DA combines orthogonal signaling and PLS-DA to identify differential variables, model the relationship between metabolite expression and sample categories, and enable sample category prediction (Boccard and Rutledge, 2013). PLS-DA score plot results obtained by 1H NMR (Fig. 6A) and UPLC-Q-TOF-MS (Fig. 6B) were generally consistent with the PCA results (R2X = 0.933, Q2 = 0.992, R2Y = 0.993 for 1H NMR; R2X = 0.781, Q2 = 0.976, R2Y = 0.990 for UPLC-Q-TOF-MS). The correlation information between 1H NMR and OPLS-DA of UPLC-Q-TOF-MS is displayed in Table 3. A total of 25 differential constituents were identified among the four concocted samples of SP, QKJ product group, HZT product group, and ZB product group using VIP > 1 as the screening principle (Fig. 6C). These constituents include benzoic acid, 1,3,6-tri-o-galloyl-β-D-glucose, gallic acid, ellagic acid, bergapten, benzoyldeoxyaconine, benzoylmesaconine, 16-epi-pyroaconitine, FA, flavumoline B, CA, hypaconine, BAC, szechenyianine E, aconine, 3-Deoxyaconitine, ranaconitine, hypaconitine, lappaconine, aconine, neoline, songoramine, AAC, 3-Deoxyjesaconitine, and szechenyine. For validation of each OPLS-DA model within the PLS-DA models, a random permutation test was performed (Fig. 7). The values of Q2 and R2 in the permutation tests were higher than those in the actual models, indicating a high level of portability and superior fit.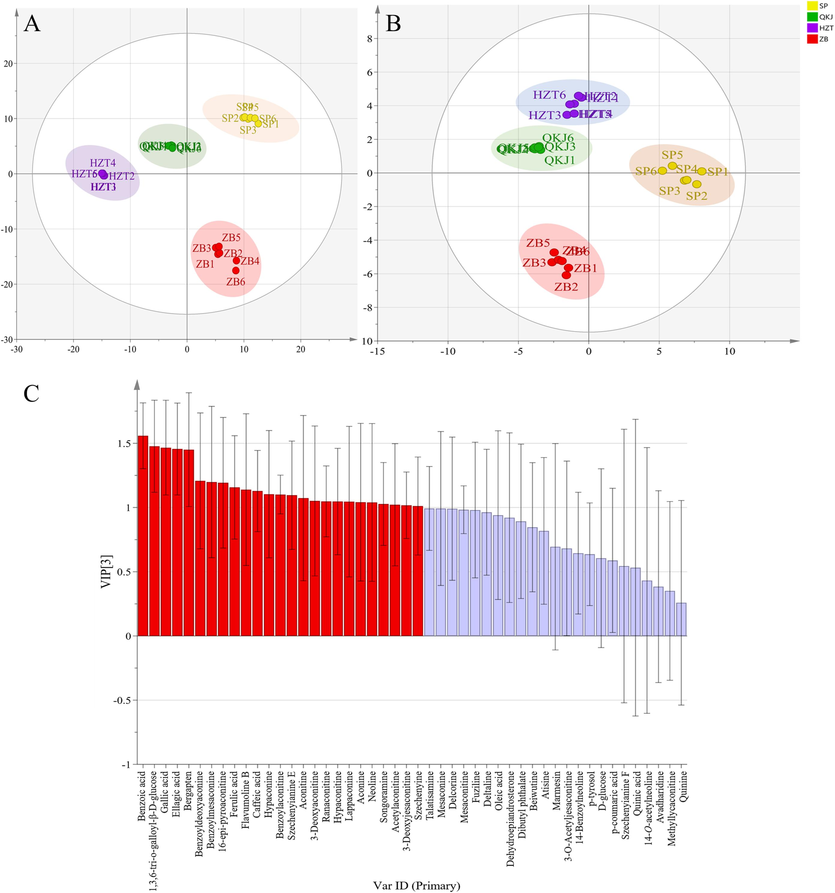
PCA analysis score chart and load chart of different processed products of Aconitum pendulum. (A) PLS-DA score map of 1H NMR; (B) PLS-DA score chart of UPLC-Q-TOF-MS; (C) VIP diagram of UPLC-Q-TOF-MS, the horizontal axis is in order from left to right 1: Benzoic acid; 2: 1,3,6-tri-o-galloyl-β-D-glucose; 3: Gallic acid; 4: Ellagic acid; 5: Bergapten; 6: Benzoyldeoxyaconine; 7: Benzoylmesaconine; 8: 16-epi-pyroaconitine; 9: Ferulic acid (FA); 10: Flavumoline B; 11: Caffeic acid (CA); 12: Hypaconine; 13: Benzoylaconitine (BAC); 14: Szechenyianine E; 15: Aconitine; 16: 3-Deoxyaconitine; 17: Ranaconitine; 18: Hypaconitine; 19: Lappaconine; 20: Aconine; 21:Neoline; 22: Songoramine; 23: 3-Acetylaconitine (AAC); 24: 3-Deoxyjesaconitine; 25: Szechenyine; 26: Talatisamine; 27: Mesaconine; 28: Delcorine; 29: Mesaconitine; 30: Fuziline; 31: Deltaline; 32: Oleic acid; 33: Dehydroepiandrosterone; 34: Dibutyl phthalate; 35: Beiwutine; 36: Atisine; 37: Marmesin; 38: 3-O-Acetyljesaconitine; 39: 14-Benzoylneoline; 40: p-tyrosol; 41: D-glucose; 42: p-coumaric acid; 43: Szechenyianine F; 44: Quinic acid; 45: 14-O-acetylneoline; 46: Avadharidine; 47: Methyllycaconitine; 48: Quinine.
Detection
Index
SP vs QKJ
SP vs HZT
SP vs ZB
ZB vs QKJ
ZB vs HZT
QKJ vs HZT
1H NMR
R2X[1]
0.785
0.885
0.784
0.788
0.829
0.864
R2X
0.862
0.935
0.886
0.867
0.910
0.899
Q2
0.998
0.998
0.998
0.993
0.994
0.998
R2Y
0.999
0.999
0.999
0.998
0.998
0.999
UPLC-Q-TOF-MS
R2X[1]
0.662
0.672
0.587
0.628
0.658
0.639
R2X
0.739
0.748
0.684
0.701
0.712
0.710
Q2
0.981
0.998
0.990
0.992
0.993
0.994
R2Y
0.997
0.989
0.999
0.999
0.999
0.999
200 random permutation tests based on 1H NMR and UPLC-Q-TOF-MS results. (A) SP vs QKJ; (B) SP vs HZT; (C) SP vs ZB; (D) ZB vs QKJ; (E) ZB vs HZT; (F) QKJ vs HZT; Number 1 is the 1H NMR result, and number 2 is the UPLC-Q-TOF-MS result.
Among the OPLS-DA score plots, the horizontal coordinate represents the score value of the main component (Tp), allowing us to observe the difference between groups based on the direction of the horizontal coordinate. On the other hand, the vertical coordinate represents the score value of the orthogonal component (TO), enabling us to observe the difference between groups (or within a group) based on the vertical coordinate. In the S-plot, the vertical coordinates represent the co-correlation of major components with metabolites, while the vertical coordinates denote the correlation coefficients of key components with metabolites. The closer the coordinates are to the two corners, the more important the metabolites are (Triba et al., 2015; Worley and Powers, 2016). The OPLS-DA scoring plots of raw and artillery products in the 1H NMR data reveal distinct clustering between samples in the SP group and the artillery products group. The samples in the SP and QKJ products groups (Fig. 8A1), the SP and HZT products groups (Fig. 8B1), and the SP and ZB products groups (Fig. 8C1) are clearly separated. The results of S-Plot plots for the SP and QKJ product groups (Fig. 8A2) show that the SP group has higher levels of aconitine, hypaconitine, BAC, AAC, and CA, whereas the QKJ group has higher levels of glycine. Fig. 8B2 displays the comparison between SP and HZT samples, with higher contents of aconitine alkaloids, FA, CA, glycine, and threonine in the SP group, and higher contents of quinic acid, chebulic acid, gallic acid, cystine, and rutin in the HZT samples. In Fig. 8C2, most of the characterized metabolites in the SP group have higher levels compared to the ZB group, while the contents of a few compounds do not show significant differences from the ZB group.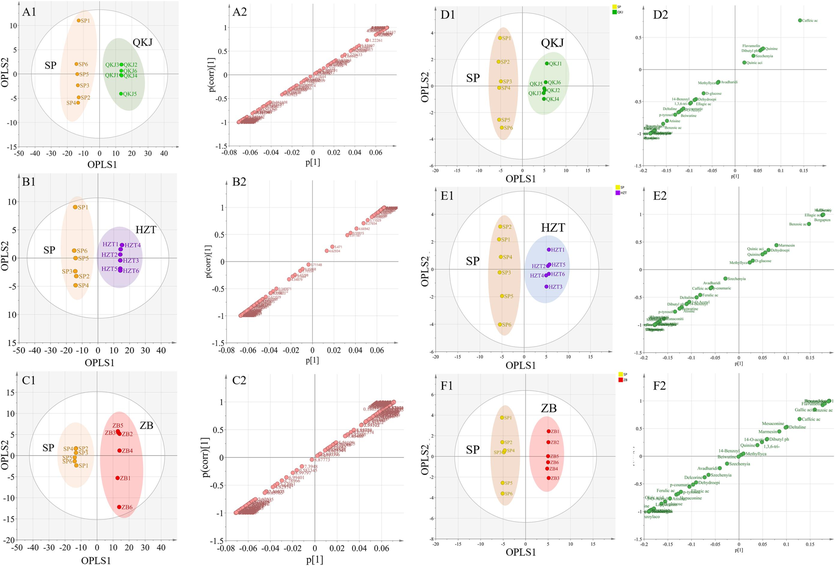
OPLS-DA analysis score chart and S-Plot chart of Aconitum pendulum raw and processed products based on 1H NMR (A, B, C) and UPLC-Q-TOF-MS (D, E, F) method. Number 1 is the OPLS-DA analysis score chart, and number 2 is the S-Plot chart.
Meanwhile, the analysis of the artillery product groups revealed clear clustering between different products. The Heated ZB and unheated QKJ product groups (Fig. 9A1), ZB and HZT product groups (Fig. 9B1), as well as samples in the QKJ and HZT product groups (Fig. 9C1) were clearly separated based on unheated artifacts. The S-Plot of ZB and QKJ product groups (Fig. 9A2) showed that the QKJ group had higher content of cystine, glycine, BAC, AAC, etc., while the ZB group had higher content of proline, glutamic acid, ferulic acid, etc., and similar levels of valine and alanine for both concoctions. Fig. 9B2 illustrated a comparison between the ZB and HZT product groups, where the HZT group had higher levels of AAC, FA, and glycine, while the ZB group had higher levels of BAC, choline, threonine, and isoleucine. In Fig. 9C2, the QKJ group had higher levels of BAC, choline, glycine, threonine, and isoleucine, whereas the HZT group had higher levels of AAC, FA, CA, quinic acid, and gallic acid.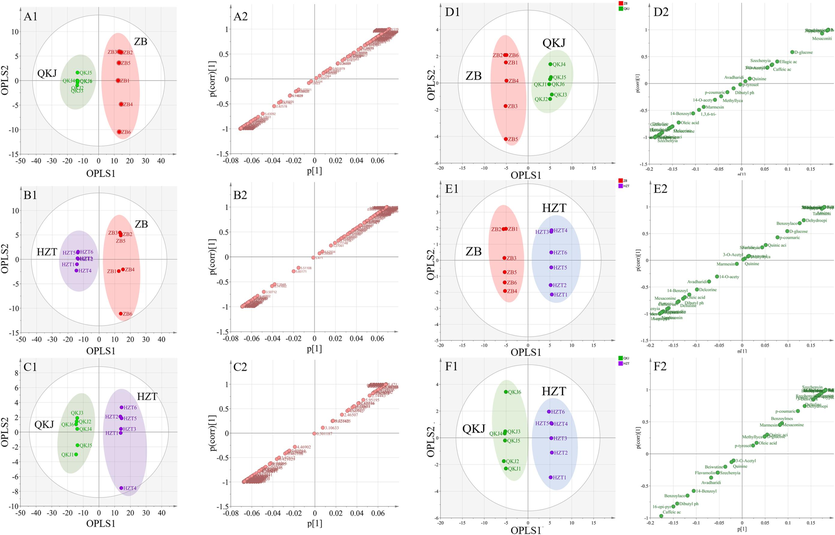
OPLS-DA analysis score chart and S-Plot chart of Aconitum pendulum processed products based on 1H NMR (A, B, C) and UPLC-Q-TOF-MS (D, E, F) method. Number 1 is the OPLS-DA analysis score chart, and number 2 is the S-Plot chart.
UPLC-Q-TOF-MS results (Fig. 8D1, E1, F1) further confirmed the differential metabolites mentioned earlier (compounds with VIP > 1 in the OPLS-DA results). For example, songoramine was not detected in any of the concoctions. Comparing the SP and QKJ product groups (Fig. 8D2), most of the alkaloids such as 16-epi-pyroaconitine, 3-Deoxyaconitine, AAC, aconitine, fuziline, and hypaconitine showed decreased levels in the QKJ group after concoction. Additionally, two alkaloids, songoramine and talatisamine, were not found in the QKJ group. In the HZT samples, new constituents like 14-O-acetylneoline, bergapten, and gallic acid appeared compared to SP. The levels of 1,3,6-tri-o-galloyl-β-D-glucose, benzoic acid, and ellagic acid increased, while the levels of other compounds decreased (Fig. 8E2). Fig. 8F2 shows that group ZB had two additional components, flavumoline B and gallic acid. Furthermore, group ZB had increased levels of benzoic acid, benzoyldeoxyaconine, benzoylmesaconine, and quinic acid, while the levels of other compounds decreased. Within the concoctions, the QKJ group in ZB had higher levels of aconitine, BAC, and AAC compared to QKJ, while aconine, neoline, 16-epi-pyroaconitine, and lappaconine were more abundant in the ZB group. The levels of 3-Deoxyaconitine were similar in both concoctions (Fig. 9D2). Comparing the ZB and HZT product groups, the HZT group had higher levels of AAC, FA, aconitine, and 3-Deoxyaconitine, whereas the ZB group had higher levels of lappaconine, neoline, and 16-epi-pyroaconitine (Fig. 9E2). In the non-heated concoctions, the QKJ group had higher contents of BAC and 16-epi-pyroaconitine, while the contents of 3-Deoxyaconitine, AAC, neoline, ellagic acid, and gallic acid were higher (Fig. 9F2).
3.4 Screening of characteristic chemical markers
3.4.1 Paired t-test
To identify the chemical markers for the raw and three artillery products of Aconitum pendulum, this study examined the differences in the levels of components using 1H NMR and UPLC-Q-TOF-MS. The signal intensities of the 1H NMR signals and the peak areas of the chromatograms in UPLC-Q-TOF-MS were directly proportional to the molar concentrations of the compounds, allowing the peak areas to represent the contents of the compounds. The normalized peak areas of the components in the raw product and the three artillery products of Aconitum pendulum were used as an index for evaluating the significant differences in the metabolic fractions through paired t-test analysis (Fig. 10).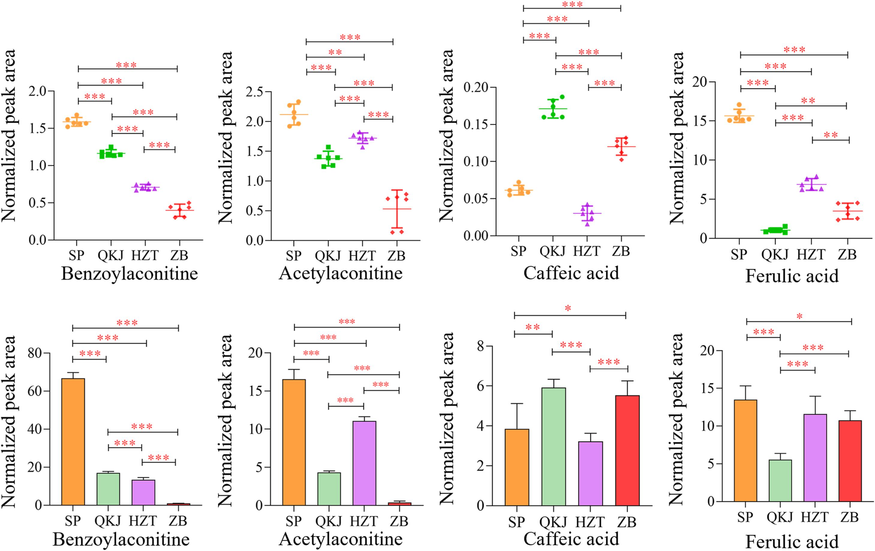
Comparison of expression levels of main differential components in four kinds of processed products of Aconitum pendulum.
The 1H NMR results showed a significant decrease in the contents of BAC, AAC, choline, FA, threonine, and isoleucine in Aconitum pendulum after concoction (P < 0.01 or P < 0.001). However, the contents of CA were significantly increased in the concoctions, except for the HZT group (P < 0.001). On the other hand, glycine showed a significant decrease, except for the QKJ group (P < 0.001). The content of the remaining 20 components did not show a statistically significant difference (P > 0.05). The results of 1H NMR and UPLC-Q-TOF-MS consistently showed a similar trend in the chemical markers with significant differences. However, there were significant differences when comparing different groups, which could be attributed to the difference in detection sensitivity between 1H NMR and UPLC-Q-TOF-MS. Based on the screening criteria of VIP > 1 and P < 0.05, 20 compounds were identified as potential chemical markers using the UPLC-Q-TOF-MS technique. These compounds include 1,3,6-tri-o-galloyl-β-D-glucose, ellagic acid, benzoyldeoxyaconine, benzoylmesaconine, 16-epi-pyroaconitine, FA, CA, hypaconine, BAC, szechenyianine E, aconitine, 3-deoxyaconitine, ranaconitine, hypaconitine, lappaconine, aconitine, neoline, AAC, 3-Deoxyjesaconitine, and szechenyine.
Compared to the traditional HPLC method, the 1H NMR metabolomics technique addresses the limitations of detecting primary metabolites such as sugar, fatty acid, and choline that cannot be detected by traditional chromatographic methods. Additionally, the 1H NMR profiles of Aconitum pendulum show significant changes after concoctions, and their simplicity and reproducibility make them suitable for rapidly differentiating between different processed products. However, for compounds with lower content, more sophisticated instruments are required for analysis due to graph resolution and detection method precision. In this regard, UPLC-Q-TOF-MS can better assist in identifying and supplementing the required results. By supplementing the 1H NMR results more accurately, UPLC-Q-TOF-MS improves the accuracy of the study's conclusion. Consequently, BAC, AAC, CA, and FA were identified as differential markers for distinguishing between raw and concocted products of Aconitum pendulum using the combined results of 1H NMR and UPLC-Q-TOF-MS.
3.4.2 Differential component heat map analysis
To analyze the distribution of the 20 differential constituents obtained from the UPLC-Q-TOF-MS results in the raw and three artillery products of Aconitum pendulum, GraphPad Prism 9.0.0 was utilized. The distribution of 1,3,6-tri-o-galloyl-β-D-glucose, FA, ellagic acid, CA, benzoyldeoxyaconine, and benzoylmesaconine as differential constituents was analyzed using a heat map (Fig. 11). The color shades in the heat map represent the levels of differential compounds, with red indicating high levels and blue indicating low levels. The analysis revealed that the SP group had a high content of aconitine compounds, particularly aconitine, 3-Deoxyaconitine, BAC, and neoline, compared to the concocted product group. The differences between heated concoctions (the zanba system) and unheated concoctions (the QKJ system and the HZT system) were significant, with a significant increase in the contents of 16-epi-pyroaconitine and benzoyldeoxyaconine in the heated concoctions. The differences in components between the QKJ system and the HZT system were relatively smaller, but the HZT group showed higher content differences in aconitine, 3-Deoxyaconitine, and ellagic acid, which resulted in significant component differences with the other artillery product groups.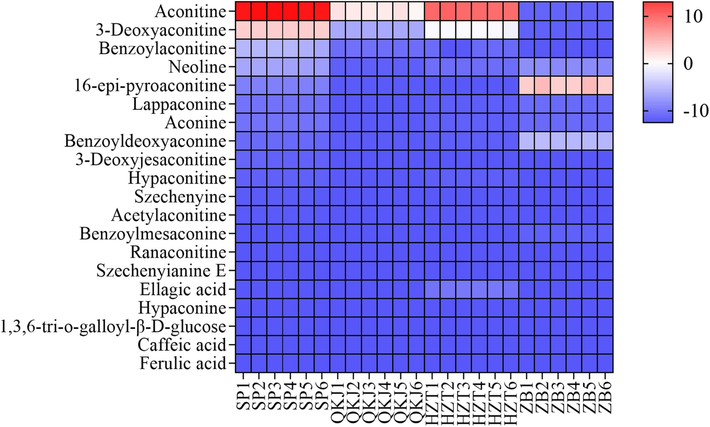
Heat map of differences in composition between different processed products of Aconitum pendulum.
4 Discussion
Using 1H NMR and UPLC-Q-TOF-MS metabolomics techniques, this study was the first to simultaneously examine and characterize the overall chemical composition of the raw product of Aconitum pendulum and three different products of the concoction. A total of 28 compounds, including primary and secondary metabolites of aconite alkaloids, saccharides, acids, sterols, flavonoids, amino acids and fatty acids, were identified by 1H NMR, offering a new technical means for the identification of the raw and the concocted products of Aconitum pendulum. Additionally, 48 compounds, including 33 alkaloids, 8 organic acids, 2 sugars and 5 other compounds, were detected and identified more accurately by combining with UPLC-Q-TOF-MS metabolomics method. Furthermore, the combination of PCA, PLS-DA, OPLS-DA, paired t-test, and difference heat map analysis methods revealed that the primary metabolites (sugar and amino acid components) and secondary metabolites (aconitine alkaloid components and organic acid components) of the raw Aconitum pendulum products were changed after concoction. CA, FA, AAC and BAC were identified as chemical markers for the objective identification of the raw and three processed products of Aconitum pendulum. The validity of the identified chemical markers is crucial for the practical application of our findings. To ensure their reproducibility and reliability, we implemented rigorous method validation. In our study, samples were analyzed in triplicate, and the resulting data exhibited minimal variance, demonstrating consistent reproducibility of the measurement techniques employed. This repeatability is further supported by the low standard deviation among technical replicates. Additionally, stability assessments were conducted to verify that the identified markers, such as 3-Acetylaconitine and benzoylaconitine, remained stable under the analytical conditions used.
Among the four selected chemical markers, AAC and BAC are the main active ingredients of the herb Aconitum pendulum. According to modern pharmacology, AAC has obvious analgesic (Lu et al., 1988; Zhu, 1991), anti-inflammatory (Tang et al., 1984), and anti-arrhythmic (Wang et al., 2023) activities. BAC also has anti-inflammatory (Zhou et al., 2021), anti-myocardial injury (Chen et al., 2022), and treatment of mitochondrial dysfunction-related disorders (Deng et al., 2019), which are basically the same pharmacological activities as those of the Aconitum pendulum herbs. CA and FA are abundant natural phenolic compounds in nature. They have antioxidant, anti-inflammatory, anti-cancer and other pharmacological activities (Costa et al., 2017; Sitarek et al., 2018; Zhou and Weng, 2019), and plays an important role in the treatment of rheumatoid arthritis, diabetes, cardiovascular disease, cancer and other diseases (Al-Ishaq et al., 2020; Sri et al., 2003; Zhang et al., 2018). These four chemical markers share pharmacological activities with the anti-inflammatory and analgesic, anti-tumor, and antioxidant pharmacological activities of Aconitum pendulum themselves, but they still have some toxicity while acting as pharmacological components. Yet, AAC and BAC are both toxic and can cause heart failure (Liu et al., 2017). The present study found that the content of AAC and BAC was considerably reduced after the concoction of Aconitum pendulum, indicating that its content in the herb was significantly reduced after concoction, which may affect its clinical efficacy, although the reduction in the compound content also represents that concocting reduces the toxicity of Aconitum pendulum herbs. According to relevant literature research, different processing methods may analyze the alkaloid chemical components in Aconitum pendulum through the principles of ester hydrolysis and high-temperature thermal decomposition, leading to a decrease in the content of toxic components (Wang et al., 2010). For example, Li's research has shown that after being processed with Hezitang or barley wine, the alkaloid components of Aconitum pendulum are mainly decomposed into low toxicity benzoylaconine through ester bond hydrolysis, and then further converted into aconine. After the Aconitum pendulum is fried in zanba, in addition to the above hydrolysis pathway, it is also transformed into MDAs (such as 16-epi-pyroaconitine) through pyrolysis, which significantly reduces the content of toxic ingredients (Li et al., 2022).
The present study found that, apart from the aconitine alkaloid constituents, the primary metabolites (amino acid components) also changed after the concoction of Aconitum pendulum. The 1H NMR results showed a significant decrease in the content of threonine and isoleucine in the processed Aconitum pendulum compared to the raw Aconitum pendulum. Additionally, the content of glycine decreased in the HZT and ZB products, but increased significantly in the QKJ product. This may be attributed to the process of Aconitum pendulum with barley wine. The UPLC-Q-TOF-MS analysis identified some additional constituents, such as bergapten, 14-O-acetylneoline, flavumoline B, and gallic acid, which might have been introduced during the concoction process or using concoction auxiliaries. Further studies are needed to understand the reasons to produce these additional constituents.
As an herb with dual toxicity and potency, Aconitum pendulum requires a specific concocting method when used in traditional medicine. However, the concocting method of Aconitum pendulum varies across different regions, resulting in differences in the constituents and medicinal effects of the herb. So far, research on Aconitum pendulum artillery products has been limited to studying the chemical composition of individual products, without considering different artillery products. Therefore, it is important to screen the chemical markers of the raw product and its three different concoctions to understand the variations in medicinal constituents of Aconitum pendulum. These screened chemical markers can be used in future pharmacological studies and pharmacodynamic evaluations to compare the differences in pharmacodynamic effects among different concoctions. By combining in vitro and in vivo compositional analyses, pharmacology, pharmacodynamic studies, and other fields, the changes in chemical composition and pharmacodynamic effects of different concoctions on Aconitum pendulum can be comprehensively evaluated. This will provide a theoretical basis for the clinical use of Aconitum pendulum.
5 Conclusion
In conclusion, through the utilization of 1H NMR and UPLC-Q-TOF-MS metabolomics techniques, we have investigated the variations in the overall chemical compositions of raw and three differently processed Aconitum pendulum products. Our findings revealed that the concoction process significantly altered the chemical composition of the plant. Specifically, we observed significant reductions in the levels of FA, AAC, and BAC, while there was a remarkable increase in the content of CA. These four components can serve as chemical markers for the targeted identification of both raw and concocted Aconitum pendulum products.
Acknowledgments
This study was funded by the National Natural Science Foundation of China (82130113).
Declaration of competing interest
The authors declare that they have no known competing financial interests or personal relationships that could have appeared to influence the work reported in this paper.
References
- Phytochemicals and gastrointestinal cancer: cellular mechanisms and effects to change cancer progression. Biomolecules. 2020;10
- [Google Scholar]
- An NMR metabolomics approach for the diagnosis of leptomeningeal carcinomatosis in lung adenocarcinoma cancer patients. Int. J. Cancer. 2015;136:162-171.
- [Google Scholar]
- Exploring the mechanisms of neurotoxicity caused by fuzi using network pharmacology and molecular docking. Front. Pharmacol.. 2022;13:961012
- [Google Scholar]
- A consensus orthogonal partial least squares discriminant analysis (OPLS-DA) strategy for multiblock Omics data fusion. Anal. Chim. Acta. 2013;769:30-39.
- [Google Scholar]
- Pharmacokinetics of dibutyl phthalate (DBP) in the rat determined by UPLC-MS/MS. Int. J. Mol. Sci.. 2013;14:836-849.
- [Google Scholar]
- Study on 1H-NMR Fingerprint of Coptis chinensis and Its in Vitro Antiendotoxin Activity. Chengdu University of Traditional Chinese Medicine; 2009. p. :88.
- Comparative normal/failing rat myocardium cell membrane chromatographic analysis system for screening specific components that counteract doxorubicin-induced heart failure from Acontium carmichaeli. Anal. Chem.. 2014;86:4748-4757.
- [Google Scholar]
- Quantitative determination of talatisamine and its pharmacokinetics and bioavailability in mouse plasma by UPLC-MS/MS. J. Chromatogr. B. 2019;1124:180-187.
- [Google Scholar]
- Chemical constituents in different parts of seven species of Aconitum based on UHPLC-Q-TOF/MS. J. Pharmaceut. Biomed.. 2021;193:113713
- [Google Scholar]
- Benzoylaconine improves mitochondrial function in oxygen-glucose deprivation and reperfusion-induced cardiomyocyte injury by activation of the AMPK/PGC-1 axis. Korean J Physiol. Pha.. 2022;26:325-333.
- [Google Scholar]
- Physical evidence that the variations in the efficiency of homologous series of antioxidants in emulsions are a result of differences in their distribution. J. Sci. Food Agr.. 2017;97:564-571.
- [Google Scholar]
- Benzoylaconine induces mitochondrial biogenesis in mice via activating AMPK signaling cascade. Acta Pharmacol. Sin.. 2019;40:658-665.
- [Google Scholar]
- Oral supplementation with beta-hydroxy-beta-methylbutyrate, arginine, and glutamine improves lean body mass in healthy older adults. J. Diet Suppl.. 2019;16:281-293.
- [Google Scholar]
- The strengths and weaknesses of NMR spectroscopy and mass spectrometry with particular focus on metabolomics research. Methods Mol. Biol.. 2015;1277:161-193.
- [Google Scholar]
- Chemical characterization, antioxidant and enzyme inhibitory effects of Mitracarpus hirtus extracts. J. Pharmaceut. Biomed.. 2021;194:113799
- [Google Scholar]
- The anti-tumor activity and mechanism of alkaloids from Aconitum szechenyianum Gay. Bioorg. Med. Chem. Lett.. 2016;26:380-387.
- [Google Scholar]
- Inter-component synergetic corrosion inhibition mechanism of Passiflora edulia Sims shell extract for mild steel in pickling solution: Experimental, DFT and reactive dynamics investigations. Sustain. Chem. Pharm.. 2022;29
- [Google Scholar]
- Ellagic acid and derivatives from Cochlospermum angolensis Welw. Extracts: HPLC-DAD-ESI/MS(n) profiling, quantification and in vitro anti-depressant, anti-cholinesterase and anti-oxidant activities. Phytochem. Anal.. 2013;24:534-540.
- [Google Scholar]
- Deficits in striatal dopamine release in cannabis dependence. Mol. Psychiatr.. 2017;22:68-75.
- [Google Scholar]
- Local and global dynamics in the glass-forming di-isobutyl phthalate as studied by 1H NMR. Solid State Nucl. Mag.. 1997;7:313-317.
- [Google Scholar]
- Simultaneous determination of gallic acid, methyl gallate, and 1,3,6-tri-O-galloyl-beta-d-glucose from Turkish galls in rat plasma using liquid chromatography-tandem mass spectrometry and its application to pharmacokinetics study. Biomed. Chromatogr.. 2020;34:e4916.
- [Google Scholar]
- An LC-MS/MS method for the determination of salidroside and its metabolite p-tyrosol in rat liver tissues. Pharm. Biol.. 2014;52:637-645.
- [Google Scholar]
- A UFLC-MS/MS method for simultaneous quantitation of spinosin, mangiferin and ferulic acid in rat plasma: application to a comparative pharmacokinetic study in normal and insomnic rats. J. Mass Spectrom.. 2012;47:1333-1340.
- [Google Scholar]
- Diterpenoid alkaloids from a Tibetan medicinal plant Aconitum richardsonianum var. pseudosessiliflorum and their cytotoxic activity. J. Pharm. Anal.. 2011;1:57-59.
- [Google Scholar]
- Hypoglycemic activity and constituents analysis of blueberry (Vaccinium corymbosum) fruit extracts. Diabet. Metab. Synd. Ob.. 2018;11:357-366.
- [Google Scholar]
- Improvement of the solubility and evaluation of the physical properties of an inclusion complex formed by a new ferulic acid derivative and gamma-cyclodextrin. ACS Omega. 2020;5:12073-12080.
- [Google Scholar]
- Ultrahigh-resolution MRI reveals structural brain differences in serotonin transporter knockout rats after sucrose and cocaine self-administration. Addict. Biol.. 2020;25:e12722.
- [Google Scholar]
- Preclinical toxicologic study of a Baikal aconite tincture (bayacon) Eksp. Klin. Farmakol.. 2002;65:62-65.
- [Google Scholar]
- Scrambling free combinatorial labeling of alanine-beta, isoleucine-delta1, leucine-proS and valine-proS methyl groups for the detection of long range NOEs. J. Biomol. NMR. 2015;61:73-82.
- [Google Scholar]
- The p10 FAST protein fusion peptide functions as a cystine noose to induce cholesterol-dependent liposome fusion without liposome tubulation. BBA. 2015;1848:408-416.
- [Google Scholar]
- Metabolite profiling of Angelica gigas from different geographical origins using 1H NMR and UPLC-MS analyses. J. Agr. Food Chem.. 2011;59:8806-8815.
- [Google Scholar]
- Isolation of chebulic acid from Terminalia chebula Retz. and its antioxidant effect in isolated rat hepatocytes. Arch. Toxicol.. 2007;81:211-218.
- [Google Scholar]
- Simultaneous determination of oleanolic acid, p-coumaric acid, ferulic acid, kaemperol and quercetin in rat plasma by LC-MS-MS and application to a pharmacokinetic study of Oldenlandia diffusa extract in rats. J. Chromatogr. Sci.. 2012;50:885-892.
- [Google Scholar]
- Simultaneous determination of osthole, bergapten and isopimpinellin in rat plasma and tissues by liquid chromatography-tandem mass spectrometry. J. Chromatogr. B. 2014;970:77-85.
- [Google Scholar]
- Aconitum pendulum and Aconitum flavum: A narrative review on traditional uses, phytochemistry, bioactivities and processing methods. J. Ethnopharmacol.. 2022;292:115216
- [Google Scholar]
- Effect of processing on the alkaloids in Aconitum tubers by HPLC-TOF/MS. J. Pharm. Anal.. 2017;7:170-175.
- [Google Scholar]
- Effect of monoamine transmitters on 3-acetylaconitine analgesia. Zhongguo Yao Li Xue Bao. 1988;9:216-220.
- [Google Scholar]
- Two-dimensional J-resolved NMR spectroscopy: review of a key methodology in the metabolomics toolbox. Phytochem. Anal.. 2010;21:22-32.
- [Google Scholar]
- CYP450 phenotyping and metabolite identification of quinine by accurate mass UPLC-MS analysis: a possible metabolic link to blackwater fever. Malaria J.. 2013;12:214.
- [Google Scholar]
- Studies on the constituents of Aconitum species. XII. Syntheses of jesaconitine derivatives and their analgesic and toxic activities. Chem. Pharm. Bull.. 1991;39:379-383.
- [Google Scholar]
- Quantification of methyllycaconitine, selective alpha7 nicotinic receptor antagonist, in rodent plasma and brain tissue by liquid chromatography tandem mass spectrometry–application to neuropharmacokinetics of methyllycaconitine in rats. Biomed. Chromatogr.. 2011;25:1273-1282.
- [Google Scholar]
- Urinary metabolic profiling of cisplatin nephrotoxicity and nephroprotective effects of Orthosiphon stamineus leaves elucidated by (1)H NMR spectroscopy. J. Pharmaceut. Biomed.. 2017;135:20-30.
- [Google Scholar]
- Two new C19-diterpenoid alkaloids from Aconitum straminiflorum. J. Asian Nat. Prod. Res.. 2016;18:366-370.
- [Google Scholar]
- Studies on immunoregulating effect of monkshood root and peony root used singly and in combination. Zhongguo Zhong Yao Za Zhi. 2002;27:541-544.
- [Google Scholar]
- Purpurolic acid: A new natural alkaloid from Claviceps purpurea (Fr.) Tul. Fungal Biol.-UK. 2016;120:104-110.
- [Google Scholar]
- Serum and urine toxicometabolomics following gentamicin-induced nephrotoxicity in male Sprague-Dawley rats. J. Toxicol. Env. Heal. A. 2018;81:408-420.
- [Google Scholar]
- Study on the chemical composition of aconitum pendulum. Med. Diet Health 2019:63-66.
- [Google Scholar]
- Berberis lycium fruit extract and its phytoconstituents berberine and rutin mitigate collagen-CFA-induced arthritis (CIA) via improving GSK3beta/STAT/Akt/MAPKs/NF-kappaB signaling axis mediated oxi-inflammation and joint articular damage in murine model. Inflammopharmacology. 2022;30:655-666.
- [Google Scholar]
- Quantitative and discriminative evaluation of contents of phenolic and flavonoid and antioxidant competence for Chinese honeys from different botanical origins. Molecules. 2018;23
- [Google Scholar]
- Norditerpenoid alkaloids from the processed tubers of Aconitum carmichaeli. Chem. Pharm. Bull.. 2003;51:999-1002.
- [Google Scholar]
- UHPLC-MS/MS phenolic profiling and in vitro antioxidant activities of Inula graveolens (L.) Desf. Nat. Prod. Res.. 2018;32:1467-1471.
- [Google Scholar]
- Over-expression of AtPAP1 transcriptional factor enhances phenolic acid production in transgenic roots of Leonurus sibiricus L. and their biological activities. Mol. Biotechnol.. 2018;60:74-82.
- [Google Scholar]
- New C18-diterpenoid alkaloids from Delphinium anthriscifolium var. savatieri. Chem. Pharm. Bull.. 2007;55:918-921.
- [Google Scholar]
- Protective effects of ferulic acid on hyperlipidemic diabetic rats. Acta Diabetol.. 2003;40:118-122.
- [Google Scholar]
- Two new physalin derivatives from Physalis alkekengi L. var. franchetii (Mast.) Makino. Nat. Prod. Res.. 2021;35:203-206.
- [Google Scholar]
- Metabolomic analysis of biofluids from rats treated with Aconitum alkaloids using nuclear magnetic resonance and gas chromatography/time-of-flight mass spectrometry. Anal. Biochem.. 2009;395:125-133.
- [Google Scholar]
- In vivo acute toxicity of detoxified Fuzi (lateral root of Aconitum carmichaeli) after a traditional detoxification process. Excli. J.. 2018;17:889-899.
- [Google Scholar]
- A UHPLC-MS/MS method for simultaneous determination of six flavonoids, gallic acid and 5,8-dihydroxy-1,4-naphthoquinone in rat plasma and its application to a pharmacokinetic study of Cortex Juglandis Mandshuricae extract. J. Chromatogr. B. 2014;958:55-62.
- [Google Scholar]
- Anti-inflammatory effect of 3-acetylaconitine. Zhongguo Yao Li Xue Bao. 1984;5:85-89.
- [Google Scholar]
- PLS/OPLS models in metabolomics: the impact of permutation of dataset rows on the K-fold cross-validation quality parameters. Mol. Biosyst.. 2015;11:13-19.
- [Google Scholar]
- Precise determination of glucose-d(2)/glucose ratio in human serum and plasma by APCI LC-MS/MS. Scand. J. Clin. Lab Inv.. 2009;69:837-842.
- [Google Scholar]
- Cytotoxic effects of diterpenoid alkaloids against human cancer cells. Molecules. 2019;24
- [Google Scholar]
- Elucidation of the interaction loci of the human pyruvate dehydrogenase complex E2.E3BP core with pyruvate dehydrogenase kinase 1 and kinase 2 by H/D exchange mass spectrometry and nuclear magnetic resonance. Biochemistry-US. 2015;54:69-82.
- [Google Scholar]
- Profiling alkaloids in Aconitum pendulum N. Busch collected from different elevations of Qinghai province using widely targeted metabolomics. Phytochemistry. 2022;195:113047
- [Google Scholar]
- Structural characterization, in vivo toxicity and biological activity of two new pyro-type diterpenoid alkaloids derived from 3-acetylaconitine. J. Integr. Med.-JIM 2023
- [Google Scholar]
- Study on processing principle of Aconitum pendulum. Zhongguo Zhong Yao Za Zhi. 2010;35:588-592.
- [Google Scholar]
- Diterpenoid alkaloids of Aconitum laciniatum and mitigation of inflammation by 14-O-acetylneoline in a murine model of ulcerative colitis. Sci. Rep.-UK. 2015;5:12845.
- [Google Scholar]
- Diterpenoid Alkaloids and Their Biological Activities in Aconitum Pendulum. Chin. J. Exp. Tradit. Med. Formulae. 2015;21:48-52.
- [Google Scholar]
- PCA as a practical indicator of OPLS-DA model reliability. Curr. Metabolomics. 2016;4:97-103.
- [Google Scholar]
- Study of aconitine toxicity in rat embryos in vitro. Birth Defects Res. B. 2007;80:208-212.
- [Google Scholar]
- Mechanisms for therapeutic effect of bulleyaconitine A on chronic pain. Mol. Pain. 2018;14:2070366277.
- [Google Scholar]
- Alkaloids isolated from the lateral root of Aconitum carmichaelii. Molecules. 2012;17:9939-9946.
- [Google Scholar]
- Pharmacokinetic effects of ginsenoside Rg1 on aconitine, benzoylaconine and aconine by UHPLC-MS/MS. Biomed. Chromatogr.. 2020;34:e4793.
- [Google Scholar]
- How aconiti radix cocta can treat gouty arthritis based on systematic pharmacology and UPLC-QTOF-MS/MS. Front. Pharmacol.. 2021;12:618844
- [Google Scholar]
- Quantification of dehydroepiandrosterone, 17beta-estradiol, testosterone, and their sulfates in mouse tissues by LC-MS/MS. Anal. Chem.. 2019;91:14624-14630.
- [Google Scholar]
- Traditional Tibetan medicine: therapeutic potential in rheumatoid arthritis. Front. Pharmacol.. 2022;13:938915
- [Google Scholar]
- Structurally diverse diterpenoid alkaloids from the lateral roots of Aconitum carmichaelii Debx. and their anti-tumor activities based on in vitro systematic evaluation and network pharmacology analysis. RSC Adv.. 2021;11:26594-26606.
- [Google Scholar]
- Neurotoxicity mechanism of aconitine in HT22 cells studied by microfluidic chip-mass spectrometry. J. Pharm. Anal.. 2023;13:88-98.
- [Google Scholar]
- Toxic and active material basis of Aconitum sinomontanum Nakai based on biological activity guidance and UPLC-Q/TOF-MS technology. J. Pharmaceut. Biomed.. 2020;188:113374
- [Google Scholar]
- Simultaneous quantitation of aconitine, mesaconitine, hypaconitine, benzoylaconine, benzoylmesaconine and benzoylhypaconine in human plasma by liquid chromatography-tandem mass spectrometry and pharmacokinetics evaluation of “SHEN-FU” injectable powder. J. Chromatogr. B. 2008;873:173-179.
- [Google Scholar]
- Pretreatment of ferulic acid attenuates inflammation and oxidative stress in a rat model of lipopolysaccharide-induced acute respiratory distress syndrome. Int. J. Immunopath. Ph.. 2018;32:1832659446.
- [Google Scholar]
- Diterpenoid alkaloids from the aerial parts of aconitum flavum Hand.-Mazz. Nat. Product. Bioprosp.. 2021;11:421-429.
- [Google Scholar]
- Determination of benzoic acid in liquid milk by LC-MS/MS. Chin. J. Health Lab Technol.. 2010;20:1034-1035.
- [Google Scholar]
- Identification and direct determination of fatty acids profile in oleic acid by HPLC-CAD and MS-IT-TOF. J. Pharmaceut. Biomed.. 2021;204:114238
- [Google Scholar]
- Identification of Potential biomarkers from Aconitum carmichaelii, a traditional Chinese medicine, using a metabolomic approach. Planta Med.. 2018;84:434-441.
- [Google Scholar]
- Benzoylaconine modulates LPS-induced responses through inhibition of toll-like receptor-mediated NF-kappaB and MAPK signaling in RAW264.7 cells. Inflammation. 2021;44:2018-2032.
- [Google Scholar]
- Arrhythmogenesis toxicity of aconitine is related to intracellular ca(2+) signals. Int. J. Med. Sci.. 2013;10:1242-1249.
- [Google Scholar]
- A novel butylated caffeic acid derivative protects HaCaT keratinocytes from squalene peroxidation-induced stress. Skin Pharmacol. Phys.. 2019;32:307-317.
- [Google Scholar]
- Development of natural products as drugs acting on central nervous system. Mem. I Oswaldo Cruz. 1991;86(Suppl 2):173-175.
- [Google Scholar]


