

Translate this page into:
Degradation kinetics of fluvoxamine in buffer solutions: In silico ADMET profiling and identification of degradation products by LC-MS/ESI
-
Received: ,
Accepted: ,
This article was originally published by Elsevier and was migrated to Scientific Scholar after the change of Publisher.
Peer review under responsibility of King Saud University.
Abstract
Abstract
The kinetics of hydrolysis of fluvoxamine maleate (FLV) has been investigated over the pH range 1.0–12.0 at 40, 60 and 80 °C. FLV degradation follows pseudo-first-order kinetics which is consistent with the kinetics of drugs that are not readily dissolved in aqueous medium. The hydrolytic degradation rate constant (kobs) range from 0.92 (pH 6.0) to 13.8 × 10⁻⁴ min−1 (pH 1.0). The kobs represents the sum of six different degradation rate constants; the kH has been found to be higher than kOH. The FLV exhibits a typical rate- pH profile with a flat bottom over the pH range 3.0–6.0 which indicates its maximum stability at pH 6.0. Ten FLV degradants have been predicted by Zeneth software and among them four degradation products (D1, D2, D3 and D4) have been identified in degraded samples. The in-silico pharmacokinetics and toxicity of degradation products have been determined using Swiss ADME and admetSAR software. The toxicity profile reveals that D2 is both AMES toxic and carcinogenic while the rest of the products are non-AMES toxic and non-carcinogenic. All of the degradation products are high in causing fish toxicity thus their presence in pharmaceutical waste is alarming for environmental safety.
Keywords
Fluvoxamine
Degradation kinetics
In-silico correlation
Pharmacokinetic
Toxicity profile

1 Introduction
Fluvoxamine maleate (FLV), 2-aminoethoxy) ({5-methoxy-1-[4-(trifluoromethyl)phenyl]pentylidene}) amine (Fig. 1), is an antidepressant, classified as selective serotonin reuptake inhibitor (SSRI) and approved for use in obsessive-compulsive disorder (OCD) (Goodman et al., 1996) in both pediatric (Riddle et al., 2001) and adult patients. Besides OCD, it is widely used for many psychological conditions such as social phobia (Stein et al., 1999), panic disorder (de Beurs et al., 1995) and posttraumatic stress disorder (De Boer et al., 1992). It is metabolized to fluvoxamine acid along with its N-acetylated analog by CYP2D6 by oxidative demethylation and deamination in liver (Van Harten, 1995). It is excreted via kidneys in urine. Since FLV is used in pediatric population as well, its degradation behavior in aqueous solution may help to develop a liquid dosage form, more conformable for use by children.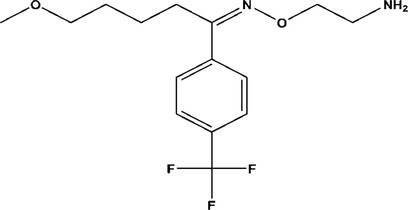
Chemical structure of fluvoxamine.
Chemically, FLV is 2-aminoethyl oxime ether of aralkylketones and the molecular formula is C15H21F3N2O2. It belongs to the chemical class of compounds containing a benzene ring with one or more trifluoromethyl substitutions. It contains an oxime group which makes it likely to degrade by hydrolysis. Similarly, other groups are also present in the compound which may indicate what type of degradation expected from the molecule. Stress degradation studies of FLV under oxidative and hydrolytic conditions have been carried out in acidic, basic and neutral medium (Pawar and Dhaneshwar, 2012; Hemke, 2015; Souri and Donyayi, 2015), however, there is no study detailing the effect of pH and temperature on the degradation kinetics of FLV in aqueous solution. The degradation products of FLV have not been characterized or studied in detail for their possible toxicities.
Computational tools and software have successfully taken over most of the scientific research and are being increasingly employed for this purpose in pharmaceutical industries as well. Softwares are available for predicting the degradation of active pharmaceutical ingredients (APIs) and their interactions with excipients. Some of the developed databases and software include programs developed by LHASA at Harvard (Corey et al., 1985), ORAC by Peter Johnson’s group (Johnson, 1985), Munich by Ivar Ugi’s group (Ugi et al., 1992), and CAMEO by Jorgenen’s group (Jorgensen et al., 1990). Zeneth is commercially available for predicting the degradation pathways and products at various temperature, pH and light conditions (Parenty et al., 2013). Pharmacokinetics and toxicity profiling of degradation products has been made easier by in-silico tools such as TOPKAT (Enslein et al., 1994), Derek Nexus (Segall and Barber, 2014); ToxTree (Enoch et al., 2008) and admetSAR (Cheng et al., 2012). Such software has been designed to predict toxicities based on correlation of experimental data and computational modeling of a large number of studies (Dearden et al., 1997; Combes, 2012). These tools have greatly reduced the use of animal models for toxicity testing and proved to be beneficial in limiting the drug development expenses for potentially toxic drugs.
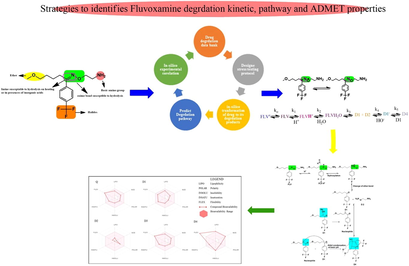
The present investigation is based on a study of the degradation behavior of FLV over a wide pH range using RP-HPLC and LC-MS techniques. It involves identification of the degradation products, kinetics of degradation reactions and evaluation of pH and temperature effects. It also includes insilico experimental correlation of degradation products and insilico pharmacokinetic profile and toxicity profiling of degraded products.
2 Experimental
2.1 Materials and methods
2.1.1 Chemicals
A pure sample of API fluvoxamine maleate (FLV) was obtained from PharmEvo Pvt. Ltd., Karachi Pakistan. All chemicals were of analytical grade purchased from reputable vendors. Buffers were prepared from deionized and distilled water, obtained from C114 cartridge of Elga Labwater. All chemicals and water used in HPLC and LC-MS analysis (acetonitrile, methanol, ammonium acetate, ortho-phosphoric acid, and triethylamine) were highly pure and HPLC grade.
2.1.2 Buffer preparation
The buffers of pH1.0 and pH2.0 were prepared by mixing appropriate quantities of 0.2 M potassium chloride and 0.2 M hydrochloric acid.
pH1.0
pH2.0
The buffers of pH3.0 to pH8.0 were prepared from mixing 0.2 M monopotassium phosphate and 0.2 M sodium hydroxide. The buffers of pH3.0, 4.0 and 5.0 were obtained by adjusting the pH6 buffer with ortho-phosphoric acid while the pH7.0 and 8.0 were obtained by increasing the ratio of 0.2 M sodium hydroxide.
pH6.0
pH7.0
pH8.0
Buffer of pH9.0 was prepared by dissolving 17.4 g monopotassium phosphate in 800 ml of water and pH was adjusted using 1 M potassium hydroxide and volume was made up to 1000 ml. The buffer of pH10.0 was prepared from 0.025 M sodium tetraborate decahydrate and 0.1 M sodium hydroxide. The composition of pH11.0 buffers includes 0.05 M disodium hydrogen phosphate and 0.1 M sodium hydroxide. The pH12.0 buffer was prepared from mixing 0.2 M potassium chloride with 0.2 M sodium hydroxide.
pH10.0
pH11.0
pH12.0
All buffers were prepared in 1000 ml quantity and stored in refrigerator in amber glass containers. The buffer solutions were in workable condition for ten days which was verified by physical appearance and pH stability.
2.1.3 Instrumentation
2.1.3.1 HPLC system and chromatographic conditions
Shimadzu LC-10AT solvent delivery unit had been used along with SPD-20A UV detector for HPLC analysis. Thermo Scientific Hypersil C18 ODS-HPLC column of 4.6 × 250 mm length with 5 µm particle size and 120 Å pore size was used for determination of FLV in different samples. Detector wavelength was set at 250 nm considering UV absorption of FLV and cut-off wavelengths of mobile phase solvents. Mobile phase contains methanol, acetonitrile and 0.05 M ammonium acetate solution in 70:10:20 v/v ratio. The pH of mobile phase was adjusted to 6.5 using ortho-phosphoric acid and triethylamine. Mobile phase was filtered through a pore size of 0.45 µm filter paper using Millipore filtration assembly and then degassed by sonicating on Elma Ultrasonic Cleaner LC30H.
2.1.4 Preparation samples for of degradation
The fresh solution of standard drug was prepared by dissolving 100 mg FLV in 100 ml methanol. The drug solution which was exposed to degradation conditions was freshly prepared on the day of performing degradation study. The calibration curve was obtained by making ten serial dilutions of 1 mg/ml stock solution with each buffer of pH1.0–12.0. Degradation samples were prepared by adding 5 ml of 1 mg/ml FLV stock solution to 95 ml of each buffer, obtaining a final concentration of 50 µg/ml. The degradation samples were stored in freezer at −18 °C.
2.1.5 Hydrolysis
The FLV solution (50 µg/ml) was allowed to degrade in a water baths maintained at 40 °C. The samples were collected at 15 min intervals up to 180 min which were immediately frozen to quench the degradation reaction. The process was repeated using each buffer in the pH range 1.0–12.0 at 60 and 80 °C. The filtered samples if needed were diluted and injected to HPLC system for analysis.
2.1.6 Order of reaction
The order of reaction is determined by plotting a graph of concentration or function of concentration versus time. The slope of straight line indicates the order of reaction. The rate constant ko is used to calculate half-life (t1/2) and shelf-life (t90) of FLV in solution which are given by following formulae for a first-order reactions.
2.1.7 Effect of temperature
The effect of temperature on degradation of FLV has been studied using the Arrhenius equation. The Arrhenius plot is constructed between natural logarithm of rate constant and inverse absolute temperature. The straight-line plot is used to calculate activation energy by the following formula:
The integrated form of Arrhenius equation can be used to find activation energy algebraically using reaction temperature and rate constants.
2.1.8 In-silico study
The degradation products of FLV and its pathways under studied conditions was predicted using Zeneth software (Parenty et al., 2013). The predictive data obtained from the software are compared to already established libraries or database which is continually updated by Lhasa Limited. In-silico ADME and toxicity predictions were performed using Swiss ADME tool and admetSAR. The basis of prediction software is the relationship of physicochemical properties such as log P and solubility with those of pharmacokinetics of the compound. The tools calculate physicochemical properties and predict the pharmacological and toxic properties of the identified degradation products.
2.1.9 Identification of degradation products by LC-MS
A 1 mg/ml quantity of FLV solution in buffers of pH 1.0 and 12.0 was allowed to degrade for 240 min and the maximum degradation was observed at 80 °C. The samples were then analyzed by ESI-LC/MS technique. Identification of degradation products was carried out by LC-MS preceded by positive mode electron spray ionization (ESI) by Agilent 6400 triple quadrupole LC-MS system. The instrument uses Agilent Mass-Hunter Workstation software. The data acquisition was operated at gradient scan mode. The degradation products were separated on a ZORBAX Eclipse Plus C18 column (4.6 × 100 mm, 5 μm) with a pore size of 95 Å. The column temperature was maintained at 25 °C, flow rate at 1 ml/min and injection size of 20 µl. The mobile phase composition was methanol and water in a 70:30 v/v ratio. The MS scans were recorded in the range of 50–1000 m/z. The structures of the degradation products of FLV were calculated from the mass spectra.
3 Results and discussion
3.1 Method validation
Analytical method validation is an important part of quantification of any analyte for its accurate and precise determination. Therefore, the validation of the RP-HPLC was performed before its application in the present study. The validation is reported in Table 1. The validation’s results showed that the newly developed method fulfill all the requirements of method validation (Guideline, 2005). Method was linear in the range of 1.5 to 100 ug/ml with correlation coefficient r2 of > 0.999 as given in Table 1.
Statistical Parameter
Fluvoxamine
Linearity range (µg/ml)
1.5–100
Intra-day
Recovery range (%)
99.6–101.4
Precision (% RSD)
0.4–0.9
Inter-day
Accuracy (%)
98.5–100.6
Precision (% RSD)
0.5–1.3
Slope
24.0 × 10³
standard error of the slope
106
correlation coefficient R2
0.999
Intercept
12.9 × 10³
standard error of the intercept
247
standard error of the regression
793
LOD (µg/ml)
0.34
LOQ (µg/ml)
1.03
The linearity of the proposed method was performed by generating calibration curves from serially diluted stock solution and calculation of the values of coefficient of correlation, slope and intercept values. Intra-day and Inter-day accuracy and precision were also performed as given in Table 1. System suitability of the method was evaluated by performing replicate analysis of the drug. The symmetry of the standard peaks, theoretical plates of the column and % relative standard deviation among the five replicate were evaluated.
Various parameters including system suitability, specificity, linearity, accuracy, intra-day and inter-day precision, limit of detection, limit of quantification and robustness were studied according to ICH guideline (Guideline, 2005). To establish robustness, the samples were analyzed after making deliberate alternation in the method parameters. Small changes were also made in the chromatographic conditions like mobile phase composition, flow rate, etc.
3.2 Hydrolysis
The degradation behavior of FLV at various temperatures, i.e. 40, 60 and 80 °C in buffers of pH1.0–12.0. The degraded samples was quantified using a validated RP-HPLC method and the order and rate of degradation was determined. The effect of pH and temperature on degradation kinetics of FLV have been studied using Arrhenius equation and pH-rate profile. The degraded samples were also subjected to ESI-LC-MS analysis to determine the chemical structure of degradants. This study incorporates computational tools with that of experimental results, in order to evaluate the degradation pathway to form products. Degradation prediction software, Zeneth, predicted formation of ten degradation products of FLV under hydrolytic conditions, however, the chromatographic assay confirms the formation of four of these products. The in-silico tools such as admetSAR have been further utilized to evaluate toxicity of the degradation products.
Many researchers have investigated the stress degradation behavior of FLV, however, the structure elucidation of its degradation products and its effect on human subjects have gone uninvestigated as present. Pawar has developed a simple and precise method for quantitative analysis of FLV in the presence of its degradation products using thin layer chromatography (Pawar and Dhaneshwar, 2012). This study subjected FLV to acid and alkali hydrolysis, oxidation, and photodegradation. This method can separate FLV from its degradation products but has its limitation in quantitative analysis. Hemke performed stress degradation for both the solid and solution state of FLV. The solution-state analysis was carried out in 0.1 N HCl, 0.1 N NaOH, distilled water and 3% H2O2 (Hemke, 2015; Souri and Donyayi, 2015). The RP-HPLC method has been used for the quantitative analysis of FLV in degradation samples and pharmaceutical dosage form. The proposed method has good resolution for the separation of FLV from its degradation products. Hemke observed two degradation products during hydrolytic degradation but these were not characterized (Hemke, 2015). Souri et al. exposed FLV to 0.5 M HCl, 2 M NaOH and 10% H2O2 at 80 °C and showed that the rate and extent of degradation was higher in acidic medium compared, to those of alkaline medium, however, no degradation products were separated or characterized (Souri and Donyayi, 2015). It was also found that the major amount of administered FLV undergoes metabolism in human body and the metabolites were generally inactive for antipsychotic activity (Overmars et al., 1983). Since the main route of metabolism was oxidation and an abundant amount of oxygen is also available to the drug during manufacturing and storage, it is possible that the drug undergoes similar changes which would render it ineffective due to degradation process.
3.2.1 Kinetics of thermal hydrolytic degradation
The thermal degradation of data showed that FLV underwent first order kinetics in the pH range 1–12. The rate of degradation of molecule is affected by pH, temperature, ionic state and functional group present. The observed rate constant (kobs) of FLV depends on six rate constants ko, k, k1, k2, k3, k4 and k5 as given in following equation.
The apparent first-order rate constants (kobs) for the thermal hydrolytic degradation of FLV (Table 2) at pH 1.0–12.0 range from 0.92 (pH 6.0) to 13.8 × 10⁻⁴ min−1 (pH 1.0). The most rapid apparent first order rate constant (k) was found to be 13.8 × 10⁻⁴ min−1 at pH 1.0 (Fig. 2).
pH
Rate Constant (k) × 10−4 (min−1)
Correlation Coefficient (R2)
Shelf life t90 (min)
1
13.8
0.990
76.0
2
46.0
0.992
228.2
3
1.15
0.991
913.0
4
0.92
0.989
777.8
5
0.92
0.989
1141.3
6
1.80
0.993
1141.3
7
4.60
0.984
583.3
s8
6.70
0.982
288.2
9
6.70
0.998
156.7
10
6.70
0.990
156.7
11
6.70
0.992
156.7
12
6.70
0.997
156.7
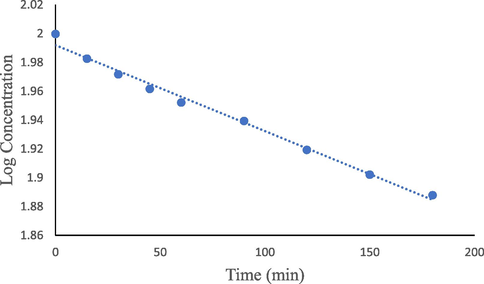
The apparent-first-order degradation of FLV at pH 1 at 80 °C.
3.2.2 pH-rate profile
A plot of rate constant versus pH is used to show the pH-dependence of a hydrolytic reaction. The pH-rate profile of FLV at 80 °C is shown in the Fig. 3, which indicates that the rate of reaction increases with a decrease in pH in the acidic region and increases with an increase in basic pH in the alkaline region. The pH of maximum stability is 3.0–6.0 with maximum stability at around 6.0. The kobs at pH 6.0 is found to be 0.92 × 10⁻⁴ min−1. The rate-pH profile of FLV is a typical shaped curve with inflections similar to that of diazepam in the acid and alkaline range (Han et al., 1977). The plateau in the pH range of 3–6 indicates that the zwitterionic species of the molecule are least susceptible to hydrolytic degradation. This region is suitable for the formulation of FLV extemporaneous or pharmaceutical product. Moreover, the phosphate buffer species used during the degradation reactions are also known to exert a stabilizing effect in this region like those of amphotericin (Hamilton-Miller, 1973), meperidine (Hor et al., 1997), warfarin (Hiskey et al., 1962) and benzyl penicillin (Finholt et al., 1965).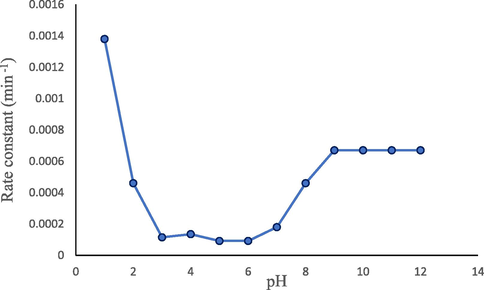
pH-rate profile of thermal hydrolytic degradation of FLV at 80 °C.
It is known that drug products are mostly found stable (Souri and Donyayi, 2015) under slightly acidic conditions as the catalysis rates at alkaline pH are higher than those of the acidic pH. If the rate of reaction is unaffected by the buffer and is significantly high, the rate-pH profile shows a flat region of maximum stability from slightly acidic to slightly basic pH. When there are acidic or basic moieties in a drug, the ionization of a particular functional group affects the rate in the pH-region of hydrolysis. It is commonly due to a change in electrophilicity of the hydrolyzing functional group as a result of ionization (Waterman et al., 2002). Ionizable drugs tend to show a characteristic inflection in the rate-pH profile (Fig. 3) when pH of the solution becomes equal to their pKa.
3.3 In-silico prediction by Zeneth and experimental correlation of degradation of FLV
Zeneth software has predicted the formation of ten degradation products (Fig. 4) if the compound is allowed to react with itself, degradation products and the degradation products with each other; the reaction is restricted to three steps. The LC-MS results verify the formation of four of these products, which include D1 (MW = 260.255), D2 (MW = 76.099), D3 (MW = 318.155) and D4 (MW = 520.51). The D4 peak is very small which is due to its very low concentration in the solution. D1 is found as the most abundant product both at pH1 and pH12, which makes D2 as equally abundant since it is formed as a result of fragmentation of FLV into D1. The possible transformations and structures of the degradation products as predicted by Zeneth and confirmed by LC-MS results are shown in Fig. 5 and Table 3. D1 (C13H15F3O2) and D2 (C2H8N2O) are formed at pH1 and pH12 as a result of hydrolysis of oxime or hydrazone, the intermediate formed as a result of hydrolysis is unstable and breaks into two fragments. The LC-ESI–MS/MS spectrum of [M+H]+ ions (m/z 261) of D1(Rt = 4.39 min) formed in both acidic and basic hydrolysis, shows the product ions of m/z 229.08 (loss of OCH3 from the parent ion at m/z 261), m/z 215.068 (loss of CH2 from the ion at m/z 261), and m/z 105 (loss of C4H5F3 from the ion at m/z 261). D3 (C15H21F3N2O2) is formed as result of photochemical isomerization of query molecule. The LC-ESI–MS/MS spectrum of [M+H]+ions (m/z 319) of D3 (Rt = 5.409 min) was formed in samples at all pH, shows the product ions of m/z 258 (loss of two fragments CH4N and CH3O from the parent ion at m/z 319). D1 undergoes further degradation by intermolecular aldol reaction and forms D4 (C26H30F6O4) (Fig. 6).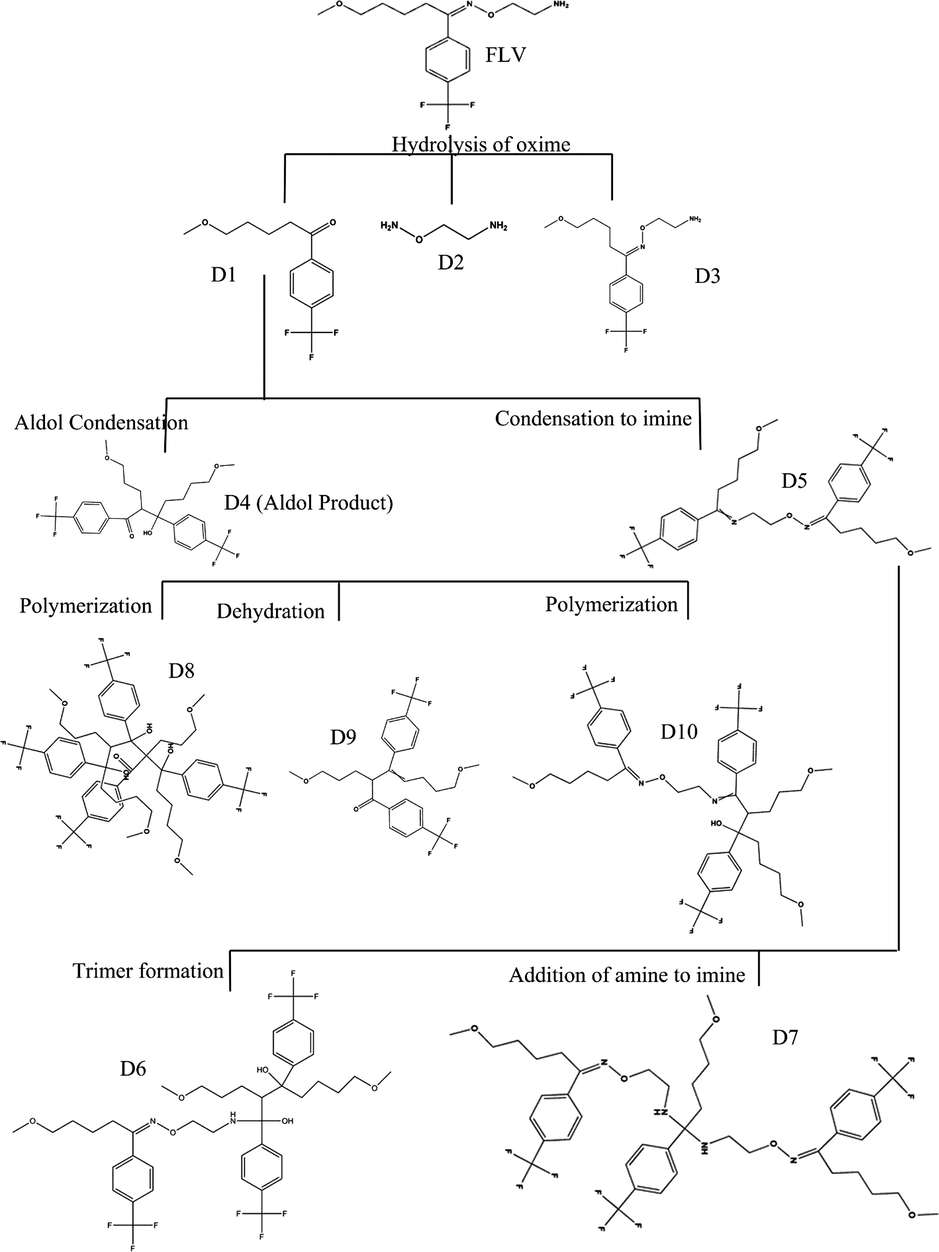
Degradation pathway of FLV as predicted by Zeneth Software.
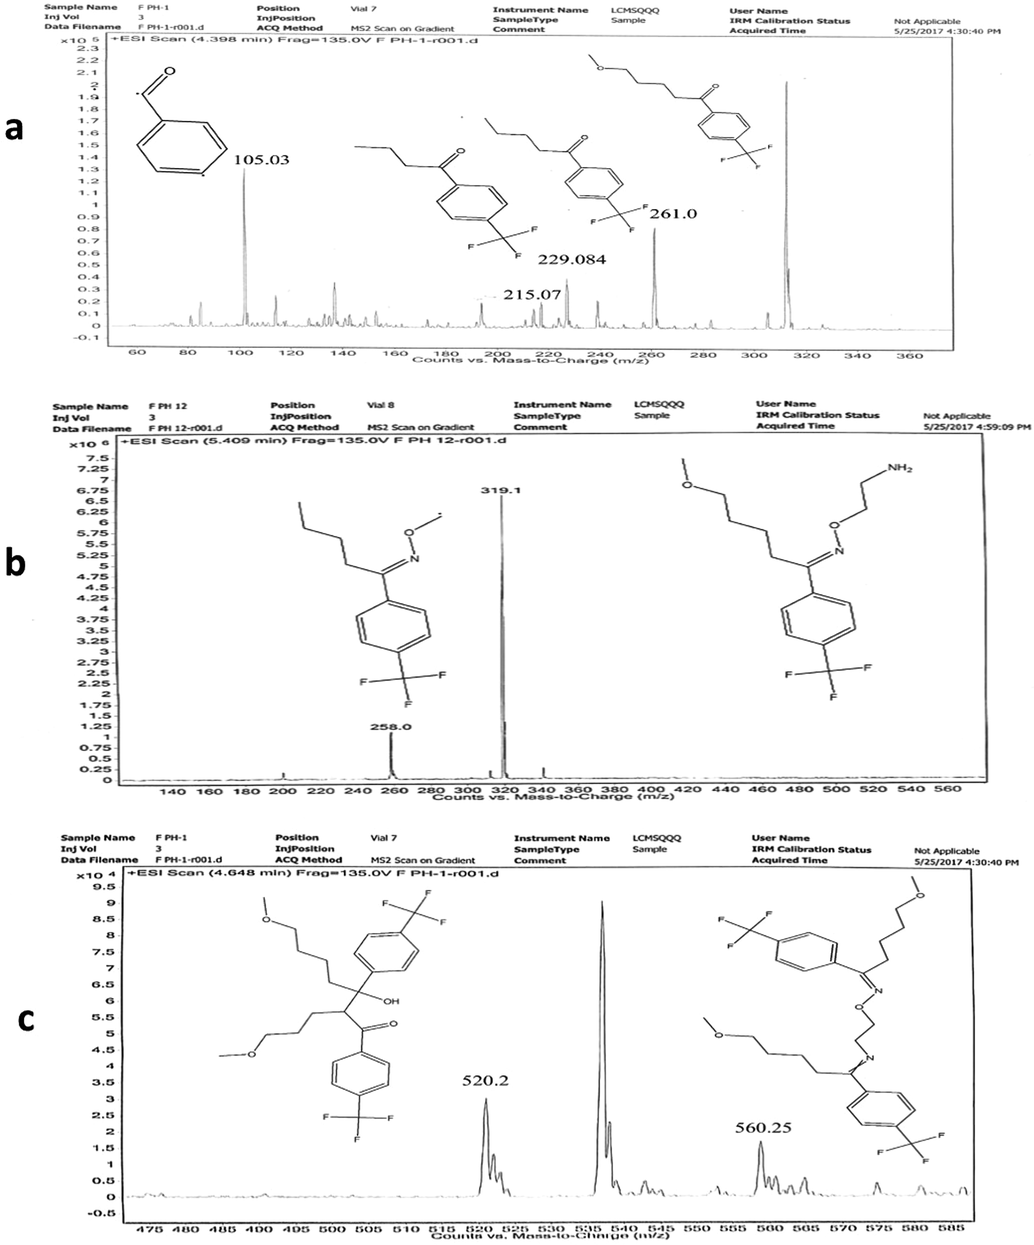
LC-MS Spectrum of FLV degradation product at pH1 D1 (a), D3 (b), D4 (c).
Product ID
Proposed Formula
Predicted Mass by Zeneth
Calculated Mass
Observed Mass
Error (ppm)
Proposed Structure
(a) observed calculated
(b) observed predicted
FLV (Q)
C15H21F3N2O2
318.155
318.33
318.339
0.009
0.183

D1
C13H15F3O2
260.102
260.25
260.255
0.005
0.153

D2
C2H8N2O
76.063
76.1
76.099
−0.001
0.035

D3
C15H21F3N2O2
318.155
318.33
318.339
0.009
0.183

D4
C26H30F6O4
520.204
520.5
520.51
0.01
0.305
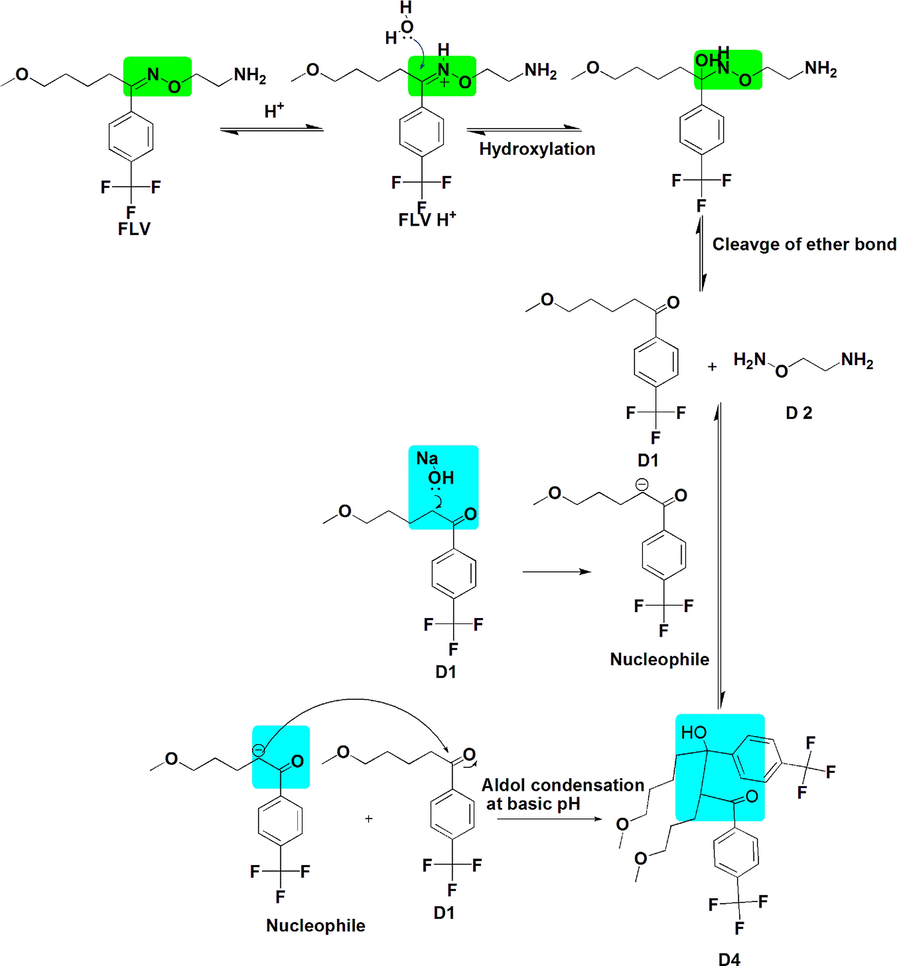
Mechanism of hydrolysis of FLV in acid-base solution.
3.4 Arrhenius plot of fluvoxamine degradation
FLV has a higher rate of degradation in acidic pH as compared to that of basic pH and little or no degradation at neutral pH. The rate-pH profile shows that the drug is found most stable at pH 6.0 and has the highest rate of degradation at pH 1.0. In this study, the temperature dependency of the rate of degradation is shown at pH 1.0 (maximum degradation point) and pH6.0 (minimum degradation point). The rate of degradation increases with an increase in temperature. The values of kobs for the reaction of FLV at pH 1 were found to be 2.3, 6.9 and 13.8 × 10⁻⁴ min−1 at 40, 60 and 80 °C respectively while the kobs at pH 6 were 0.46 (40 °C) and 0.92 10−4 min−1 (60 and 80 °C). The effect of temperature on the rate of a reaction is explained by Arrhenius equation
. This equation is based on collision theory; the particles must collide in proper orientation and with enough energy to form a new molecule. The Arrhenius plot (lnk vs 1/T) for the degradation of FLV at 40, 60 and 80 °C at pH 1.0 is a straight line and can be used to calculate activation energy using equation (6).
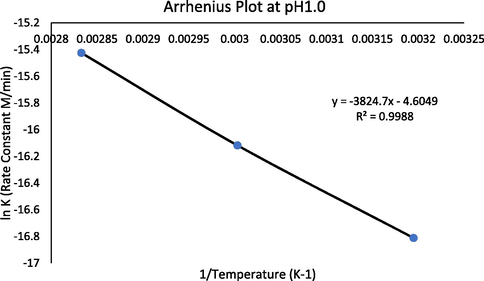
Arrhenius plot of FLV degradation at 40, 60 and 80 °C in buffer of pH1.0.
3.5 Degradation products and pathway prediction
Computational chemistry software can be used to predict hydrolytic degradation and products, and rationalize its pathways. The importance of understanding the degradation pathways lies in ensuring the safety of the drug during its manufacturing, storage and until final consumption by the end-user. A number of modeling software are commercially available which are able to predict the synthetic outcome of a reactions as indicated in introduction. In the present study Zeneth-7 has been used to predict the hydrolysis pathway and thermal hydrolytic products.
The software has a database of commonly used excipients. The query compound (FLV) was individually tested at varying temperatures, i.e. 40 °C and 80 °C, pH 1.0, pH 7.0 and pH 12.0, in the presence of light and peroxides. It also allows to limit the extent of reaction whether the query compound and the degradation products are allowed to react with each other or not. The conditions for the degradation predictions were set as the query compound was allowed to react with itself (Q, Q + Q). The compound was also allowed to react with degradants (Q + D) and the degradants were allowed to react with query compound and with each other (D + Q, D + D). The maximum number of allowed steps in a reaction were restricted to 3 and the number of maximum possible degradation products was 400. The software uses a built-in knowledge based prediction system, which is dependent on expert knowledge and literature review from Lhasa to identify potential degradation pathways (Jorgensen et al., 1990; Parenty et al., 2013). The results show the sites of potential degradation, structural changes in the degradation products and the mechanism of reaction.
3.6 FLV thermal degradants prediction at pH 1.0 and 12.0
The FLV molecule was allowed to degrade at 80 °C in presence of water, oxygen and light in a buffer of pH 1 and pH 12. Based on the functional groups in FLV and set reaction conditions, Zeneth predicted eight transformations that may be possible during stress degradation of FLV. Seven of these transformations were same for both pH 1 and pH 12 with the only difference in alcohol based reactions which was dehydration reaction at pH 1 and retro-aldol reaction at pH 12. Other transformations that were same for both pH includes; hydrolysis of oxime or related compound, photochemical isomerization of oxime or hydrazone, intermolecular condensation to imine, intermolecular aldol reaction, hydrolysis of acyclic imine, addition of amine to imine, and elimination to alpha, beta-unsaturated compound (Alsante and Baertschi, 2005). These transformations predict formation of three major degradation products at the first step; D1, D2 and D3. D1 which undergo further degradation to form two degradation products i.e. D4 and D5, that are subsequently degraded to form five more products making a total of 10 expected degradation products (Fig. 4).
3.7 Identification of degradation products by LC-MS/ESI
The hydrolytic degradation products of FLV under acidic and alkaline conditions (pH 1.0–12.0) obtained after 3 h of thermal treatment were identified by LC–ESI–QQQ–MS and MS/MS analysis. ESI–QQQ–MS (positive mode) scan of FLV and its degradation products in acidic and alkaline solutions showed peak [M+H]+ at m/z 319.0 (FLV), 261.0 (D1), 76.0 (D2), 319.1 (D3) and 520.2 (D4), corresponding to the molecular formulae C15H23F3N2O2+ (calc. 319.155), C13H16F3O2+ (calc. 261.0), C2HFN2Ȯ (calc. 76.063), C15H22F3N2O2+ (calc. 319.1) and C26H30F6N3Ȯ4 (calc. 520.2), respectively.
D1 and D2 degradants are formed under both acidic and basic (pH 1.0 and pH 12.0) at 80 °C. LC-MS-ESI spectra of major degraded products of FLV are shown in Figs. 4 and 5. The D3 degradant is previously known (41), however, D1, D2 and D4 are first time identified in this study. Proposed structure and molecular formula of all thermal degraded products are summarized in Table 3. Extracted-ion chromatograms (EIC) of FLV and its thermal degraded products are shown in Fig. 8. The results of this study show that FLV on heating in acid/base solution leads to the formation of four thermal degraded products (D1 to D4).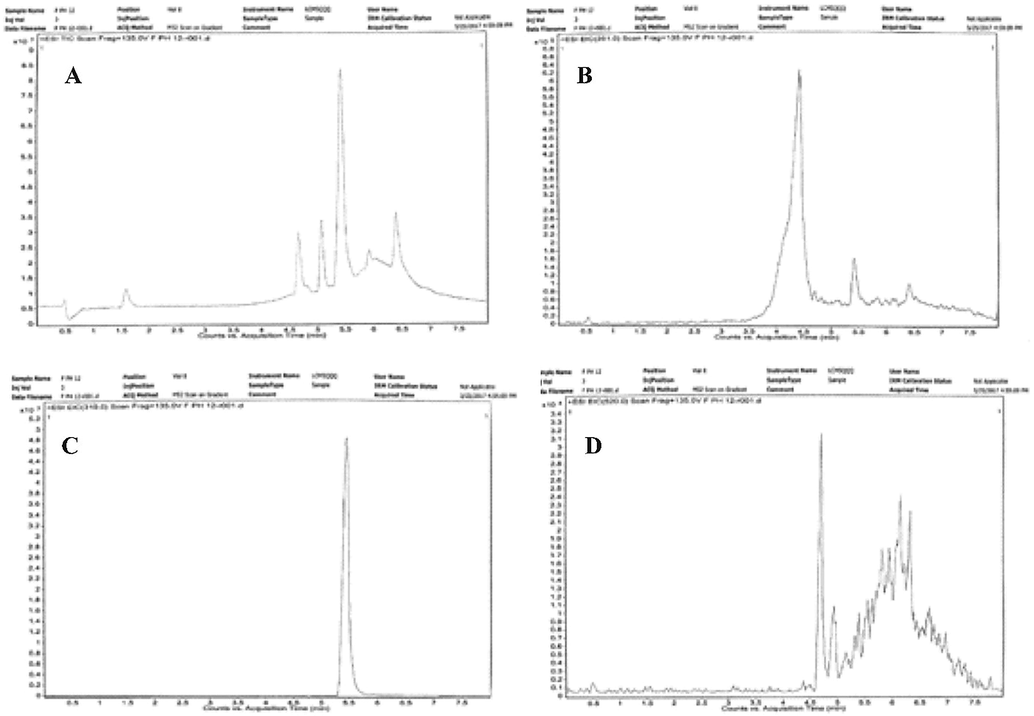
EIC of FLV and its degraded products at pH 12.0 (A) TIC Scan (B) EIC scan of D1(Rt = 4.39 min) (C) EIC scan of D3 (Rt = 5.409 min) (D) EIC scan of D4 (Rt = 4.648).
3.8 In-silico ADMET toxicity screening of degradation products
The SwissADME (Daina et al., 2017) and admetSAR (Cheng et al., 2012) were used for insilico study of ADMET (absorption, distribution, metabolism, elimination and toxicity), drug likeness of FLV and its degradants. The predicted pharmacokinetics (Table 4) and drug likeness properties of FLV and its degradation products are given in Table 5 and Fig. 9. These in-silico tools predict likely degradation products of drug using Lipinski (Lipinski, 2004; Muegge, 2003); Ghose (Ghose et al., 1999; Nisha et al., 2016); Veber, Egan (Bhal et al., 2007; Brown et al., 2016); Muegge (Muegge, 2003) criteria.
Pharmacokinetics
Q
D1
D2
D3
D4
GI absorption
High
High
High
High
Low
BBB permeant
Yes
Yes
No
Yes
No
P-gp substrate
No
No
No
No
Yes
CYP1A2 inhibitor
No
Yes
No
No
No
CYP2C19 inhibitor
Yes
Yes
No
Yes
No
CYP2C9 inhibitor
No
No
No
No
No
CYP2D6 inhibitor
Yes
Yes
No
Yes
Yes
CYP3A4 inhibitor
No
No
No
No
Yes
Log Kp (skin permeation)
−6.37 cm/s
−5.76 cm/s
−7.91 cm/s
−6.37 cm/s
−5.57 cm/s
Drug-likeness
Q
D1
D2
D3
D4
Lipinski
Yes; 0 violation
Yes; 0 violation
Yes; 0 violation
Yes; 0 violation
No; 2 violations: MW > 500, MLOGP > 4.15
Ghose
Yes
Yes
No; 4 violations: MW < 160, WLOGP < -0.4, MR < 40, #atoms < 20
Yes
No; 2 violations: MW > 480, WLOGP > 5.6
Veber
Yes
Yes
Yes
Yes
No; 1 violation: Rotors > 10
Egan
Yes
Yes
Yes
Yes
No; 1 violation: WLOGP > 5.88
Muegge
Yes
Yes
No; 2 violations: MW < 200, #C < 5
Yes
No; 1 violation: XLOGP3 > 5
Bioavailability Score
0.55
0.55
0.55
0.55
0.17
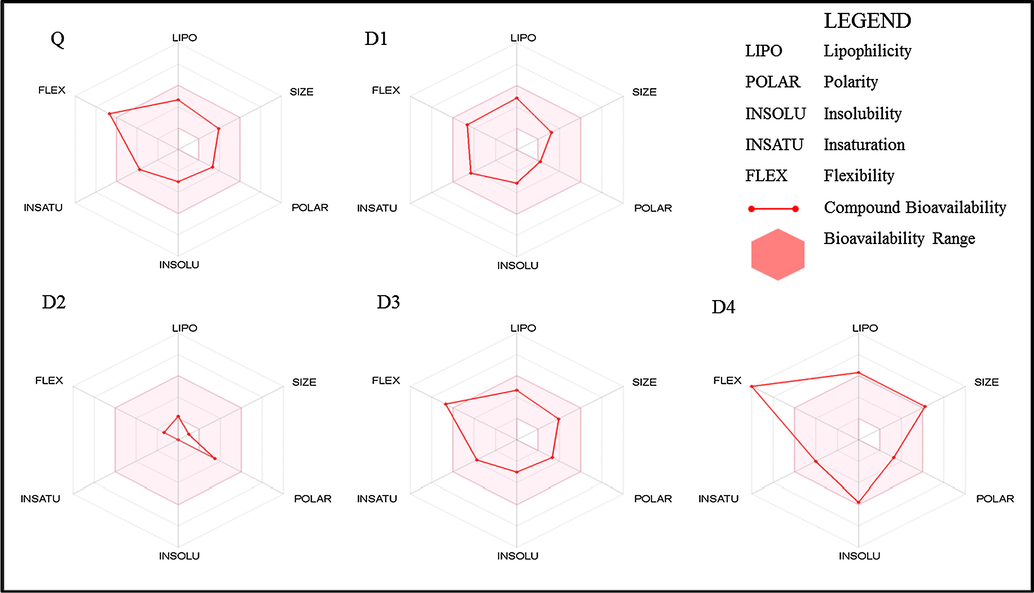
Oral bioavailability parameters of FLV and its degradation products.
The drug-likeness parameters of FLV and its degradation products. The pink area represents the optimal range for each properties (lipophilicity: XLOGP3 between −0.7 and +5.0, size: MW between 150 and 500 g/mol, polarity: TPSA between 20 and 130 Å2, solubility: log S not higher than 6, saturation: fraction of carbons in the sp3 hybridization not less than 0.25, and flexibility: no more than 9 rotatable bonds. The D4 has least likeness for oral absorption, because of too flexibility while D1 falls within good bioavailability region.
The GI absorption for D1, D2 and D3 is high and can cause adverse effects by entering the blood stream through gastrointestinal tract (Nisha et al., 2016). The ability to penetrate blood-brain barrier (BBB) was 0.97 for FLV; D1 and D4 have significantly higher scores for this phenomenon and are likely to enter central nervous system more rapidly than the parent compound. FLV is mainly metabolized in the liver by P450 1A2 enzyme, admetSAR predicts the inhibition of this enzyme by D1 and D3 which may affect the metabolism thus increasing half-life of the active drug. FLV degradation product D2 shows a high log kp value (permeability coefficient) (Brown et al., 2016) which is alarming as D2 is the most toxic among identified degradants.
AMES toxicity test was used to determine the mutagenicity of a compound. The D2 product which is formed in all degradation processes is found to be both MES-toxic and carcinogenic. Since D2 is the most abundant degradation product, it is important to have a regulatory check on the percentage of D2 in a drug container. The comparison of LD50 values for FLV and its degradation products reveal that all of the degradation products have lower LD50 values than the parent compound making the degradation products more lethal in rats. Fish toxicity of all degradation products of FLV are high causing an environmental threat as well (Table 6).
Compound
HIA
BBB
AMES Toxicity
Carcinogenicity
Fish Toxicity
LD50 in rat (mol/kg)
Fluvoxamine
1
0.9775
Non-AMES toxic
Non-carcinogenic
High
2.69
D1
1
0.9956
Non-AMES toxic
Non-carcinogenic
High
2.63
D2
0.9644
0.8913
AMES toxic
carcinogen
Low
2.34
D3
1
0.9775
Non-AMES toxic
Non-carcinogenic
High
2.69
D4
1
0.9885
Non-AMES toxic
Non-carcinogenic
High
2.58
4 Conclusion
Fluvoxamine (FLV) is used as a single agent or in combination with risperidone for the treatment of obsessive-compulsive disorder. It is degraded by hydrolysis, thermolysis and photolysis. The presence of oxime ether in FLV makes it susceptible to hydrolysis. The protonation of FLV is critical and is the rate-limiting step in its hydrolysis in acidic region. The drug follows apparent first-order degradation kinetics under the conditions employed. The degradation takes place in acidic, neutral and basic environment but the rate of reaction is higher in acidic solutions. The activation energy is calculated to be 41.27 KJ/mol (10 Kcal/mol) which indicates that the drug molecule is moderately susceptible to temperature changes.
A typical rate-pH profile is observed for thermal degradation of FLV showing a flat bottom (pH 3.0–6.0) with maximum stability at pH 6.0. The shelf-life (t90) has been found to be 1.26 h at pH 1.0 and 19 h at pH 6.0. These results may be used as a reference for expiration dating of extemporaneous aqueous preparation of FLV. The aqueous solutions of FLV should be kept below room temperature. During manufacturing processes such as wet granulation the pH of aqueous medium should be maintained at 6.0 with phosphate buffer to avoid loss of potency and utilize an added benefit of stabilizing effect of phosphate buffer.
In-silico experimental correlation reveals that FLV undergoes degradation through different routes; acid-base catalysed hydrolysis, epimerization, and aldol condensation. The D2 (hydroxyl amine derivative) product which is formed in all degradation processes is found to be both AMES-toxic and carcinogenic. It is absorbed in the gastrointestinal tract but does not cross blood-brain barrier.
Acknowledgment
We especially thank Prof. Dr. Iqbal Ahmed (Baqai Institute of Pharmaceutical Sciences) for his valuable assistance in manuscript writing and HEC Pakistan training grant for Rabia and HEC instrument access funding for LCMS analysis.
Declaration of Competing Interest
All authors have no conflict of interest
References
- Stress testing: the chemistry of drug degradation. In: Pharmaceutical Stress Testing. CRC Press; 2005. p. :73-162.
- [Google Scholar]
- The Rule of Five revisited: applying log D in place of log P in drug-likeness filters. Mol. Pharm.. 2007;4(4):556-560.
- [Google Scholar]
- Dermal permeation data and models for the prioritization and screening-level exposure assessment of organic chemicals. Environ. Int.. 2016;94:424-435.
- [Google Scholar]
- admetSAR: A Comprehensive Source and Free Tool for Assessment of Chemical ADMET Properties. ACS Publications; 2012.
- In silico methods for toxicity prediction. In: New Technologies for Toxicity Testing. Springer; 2012. p. :96-116.
- [Google Scholar]
- Computer-assisted synthetic analysis: selection of protective groups for multistep organic syntheses. J. Org. Chem.. 1985;50(11):1920-1927.
- [Google Scholar]
- SwissADME: a free web tool to evaluate pharmacokinetics, drug-likeness and medicinal chemistry friendliness of small molecules. Sci. Rep.. 2017;7:42717.
- [Google Scholar]
- Treatment of panic disorder with agoraphobia: comparison of fluvoxamine, placebo, and psychological panic management combined with exposure and of exposure in vivo alone. Am. J. Psychiatry. 1995;152(5):683.
- [Google Scholar]
- Fluvoxamine treatment for chronic PTSD: a pilot study. Psychother. Psychosom.. 1992;57(4):158-163.
- [Google Scholar]
- Dearden, J.C., Barratt, M.D., Benigni, R., Bristol, D.W., Combes, R.D., Cronin, M., et al., 1997. The development and validation of expert systems for predicting toxicity. In: Workshop (ECVAM Workshop 24).
- Classification of chemicals according to mechanism of aquatic toxicity: an evaluation of the implementation of the Verhaar scheme in Toxtree. Chemosphere. 2008;73(3):243-248.
- [Google Scholar]
- Use of SAR in computer-assisted prediction of carcinogenicity and mutagenicity of chemicals by the TOPKAT program. Mutat. Res.. 1994;305(1):47-61.
- [Google Scholar]
- Catalytic effect of buffers on degradation of penicillin G in aqueous solution. J. Pharm. Sci.. 1965;54(3):387-393.
- [Google Scholar]
- A knowledge-based approach in designing combinatorial or medicinal chemistry libraries for drug discovery. 1. A qualitative and quantitative characterization of known drug databases. J. Comb. Chem.. 1999;1(1):55-68.
- [Google Scholar]
- Treatment of obsessive-compulsive disorder with fluvoxamine: a multicentre, double-blind, placebo-controlled trial. Int. Clin. Psychopharmacol.. 1996;11(1):21-30.
- [Google Scholar]
- Guideline, I.H.T., 2005. Validation of analytical procedures: text and methodology Q2 (R1). In: International Conference on Harmonization, Geneva, Switzerland.
- The effect of pH and of temperature on the stability and bioactivity of nystatin and amphotericin B. J. Pharm. Pharmacol.. 1973;25(5):401-407.
- [Google Scholar]
- Kinetics and mechanisms of hydrolysis of 1, 4-benzodiazepines II: oxazepam and diazepam. J. Pharm. Sci.. 1977;66(4):573-577.
- [Google Scholar]
- Force degradation study and RP-HPLC method development for estimation of fluvoxamine maleate in tablet. Int. J. Pharmacy Pharmaceut. Sci.. 2015;7(6):196-202.
- [Google Scholar]
- Torque rheology of zircon feedstocks for powder injection moulding. J. Eur. Ceram. Soc.. 2012;32(16):4063-4072.
- [Google Scholar]
- Spectrophotometric study of aqueous solutions of warfarin sodium. J. Pharm. Sci.. 1962;51(1):43-46.
- [Google Scholar]
- Stability of admixtures of pethidine and metoclopramide in aqueous solution, 5% dextrose and 0.9% sodium chloride. J. Clin. Pharm. Ther.. 1997;22(5):339-345.
- [Google Scholar]
- The hydrolysis of acetylsalicylic acid from aqueous suspension. J. Pharm. Pharmacol.. 1958;10(1):363-369.
- [Google Scholar]
- CAMEO: a program for the logical prediction of the products of organic reactions. Pure Appl. Chem.. 1990;62(10):1921-1932.
- [Google Scholar]
- Lead-and drug-like compounds: the rule-of-five revolution. Drug Discovery Today: Technol.. 2004;1(4):337-341.
- [Google Scholar]
- Molecular Docking and in-silico ADMET study reveals acylguanidine 7a as a potential inhibitor of β-secretase. Adv. Bioinform.. 2016;20:1-6.
- [Google Scholar]
- Fluvoxamine maleate: metabolism in man. Eur. J. Drug Metab. Pharmacokinet.. 1983;8(3):269-280.
- [Google Scholar]
- An expert system to predict the forced degradation of organic molecules. Mol. Pharm.. 2013;10(8):2962-2974.
- [Google Scholar]
- Validated high-performance thin-layer chromatographic method for quantitation of fluvoxamine in the presence of degradation products formed under ICH recommended stress conditions. J. Planar Chromatogr.-Modern TLC. 2012;25(4):338-343.
- [Google Scholar]
- Fluvoxamine for children and adolescents with obsessive-compulsive disorder: a randomized, controlled, multicenter trial. J. Am. Acad. Child Adolesc. Psychiatry. 2001;40(2):222-229.
- [Google Scholar]
- Addressing toxicity risk when designing and selecting compounds in early drug discovery. Drug Discovery Today. 2014;19(5):688-693.
- [Google Scholar]
- A stability indicating HPLC method for the determination of fluvoxamine in pharmaceutical dosage forms. Iranian J. Pharmaceut. Res.: IJPR. 2015;14(4):1059-1065.
- [Google Scholar]
- Fluvoxamine treatment of social phobia (social anxiety disorder): a double-blind, placebo-controlled study. Am. J. Psychiatry. 1999;156(5):756-760.
- [Google Scholar]
- Computer-supported chemical calculating, thinking, and inventing. ChemInform. 1992;23(38)
- [Google Scholar]
- Overview of the pharmacokinetics of fluvoxamine. Clin. Pharmacokinet.. 1995;29(1):1-9.
- [Google Scholar]
- Hydrolysis in pharmaceutical formulations. Pharm. Dev. Technol.. 2002;7(2):113-146.
- [Google Scholar]


