

Translate this page into:
Degradation of chitosan with self-resonating cavitation
⁎Corresponding author at: Guangxi Key Laboratory of Green Processing of Sugar Resources (Guangxi University of Science and Technology), Liuzhou 545006, Guangxi, PR China. huangyc@yeah.net (Yongchun Huang)
-
Received: ,
Accepted: ,
This article was originally published by Elsevier and was migrated to Scientific Scholar after the change of Publisher.
Peer review under responsibility of King Saud University.
Abstract
For the degradation of chitosan, a novel physical method of self-resonating cavitation with strong cavitation effects was investigated in this paper. The effects of initial concentration, pH, temperature, inlet pressure and cavitation time on the degradation efficiency of chitosan were evaluated. It was found that the degradation efficiency was positively correlated with temperature and cavitation time, but was negatively correlated with the solution concentration. The degradation efficiency was maximized at pH of 4.4 and inlet pressure of 0.4 MPa. Under the experimental conditions, the intrinsic viscosity of chitosan solution was reduced by 92.2%, which was twice as high as the degradation efficiency where a Venturi tube cavitator was used. The viscosity-average molecular weights of initial and degraded chitosan were 651 and 104 kD, respectively. The deacetylation degree of chitosan slightly decreased from 89.34% to 88.05%. Structures and polydispersity of initial and degraded chitosan were measured by Fourier-transform infrared spectroscopy (FT-IR), nuclear magnetic resonance hydrogen spectroscopy (1H NMR), X-ray diffraction (XRD) and gel permeation chromatography (GPC). The results showed that the degradation process did not change the natural structure of chitosan. XRD peaks of the original chitosan were observed at 2θ of 9.59° and 20.00°, and the one at 2θ of 20.00° was obviously weakened after the degradation process, which indicated that the crystallinity of chitosan decreased significantly after the degradation. The polydispersity index of chitosan samples decreased from 3.17 to 2.75, indicating that the molecular-weight distribution of products after the degradation was more concentrated. The results proved that self-resonating cavitation prompted the degradation of chitosan and could reduce the polydispersity of the products for the production of oligochitosan with homogeneous molecular weights.
Keywords
Chitosan
Self-resonating cavitation
Degradation

1 Introduction
Chitosan, the deacetylated derivative of chitin, is a linear polysaccharide of β-(1,4)-2-amino-2-deoxy-D-glucopyranose (Ma et al., 2008) and the second most abundant polysaccharide in the nature (Zawadzki and Kaczmarek, 2010). The water soluble oligochitosan and its derivatives have many physiological activities and can serve as antifungal (Mei et al., 2015), antitumor (Han et al., 2015), antimicrobial (Khan et al., 2019; Ramos et al., 2008; Sánchez et al., 2017), anti-inflammatory (Liang et al., 2016.) and adsorbents (Kausar et al., 2018). Based on its physical and chemical properties, chitosan is an attractive biomaterial utilized in a number of fields (Ali and Ahmed, 2018; Divya and Jisha, 2018; Yu et al., 2019; Zhang et al., 2019), including adsorption materials (Ali et al., 2020; Bhatti et al., 2017; Kausar et al., 2018; Khan et al., 2019; Noreen et al., 2020; Tahir et al., 2016), medical materials (Abbas et al., 2019; Bilal et al., 2019; Iqbal et al., 2019), catalytic materials (Asgher et al., 2017, 2016), and so on. However, chitosan is normally insoluble in aqueous solutions at pH ≥ 7, which limits its applications (Ma et al., 2009). The properties of chitosan are dependent on the chemical structure and molecular weight, and the latter affects solubility, solution viscosity, and bioactivity (Yan et al., 2009). Therefore, reducing the molecular weight of chitosan without changing its chemical structure and degree of deacetylation is of great interest.
Chitosan can be degraded by chemical, enzymatic and physical methods. In the chemical methods, chemical substances are used and waste is generated, which increases the duty of separation and purification. The enzymatic methods are usually effective, but the cost is high, limiting its applications in industry. In the process of ultrasonic cavitation degradation of chitosan, the distribution of cavitation field is not uniform, causing the loss of a large amount of energy in the form of heat energy and lowering the degradation efficiency, so the large-scale application of ultrasonic cavitation is difficult (Huang et al., 2013; Yan et al., 2020). Wang et al. (2019) utilized hydrodynamic and ultrasonic cavitation methods to treat soybean globulin and found that the intensity of cavitation yield of the hydrodynamic cavitation was 7 times higher than that of the ultrasonic cavitation yield under the conditions of same input power, processing time and system volume. In our previously work, chitosan degradation experiments by hydrodynamic cavitation with an orifice plate (Huang et al., 2013), turbine (Wu et al., 2014), and Venturi tube (Xu et al., 2016) were investigated. The results showed that degradation of chitosan by hydrodynamic cavitation had the advantages of no chemical pollution, low cost, simple equipment, stable degradation effect, high cavitation intensity, uniform cavitation fields and high energy utilization rate (Huang et al., 2013; Wang et al., 2019).
It was reported that the degradation of polymers by cavitation mainly depended on the chemical and mechanical effects during the collapse of bubbles (Bose and Git, 2004; Koda et al., 2011; McKenzie et al., 2019; Portenlänger and Heusinger, 1997). As a new high-efficiency hydrodynamic cavitation type, self-resonating cavitation, established on hydroacoustics, transient flow and fluid mechanics theories, has the characteristics of jet cavitation and pulse jet. Therefore, the cavitation effects can be significantly improved. When a fluid flows through a particular structure (organ-pipe cavitator), self-excited oscillation can be produced, changing continuous jet into self-resonating jet. Meanwhile, because of the high-frequency pressure oscillation and large structure separation vortex generated in the self-resonating jet, a large number of effective cavitation jets can be formed, and thus the cavitation effect will be enhanced by shock waves and micro-jet generated from the collapse of bubbles. Therefore, the energy utilization rate will be improved (Han et al., 2017). These effects can be applied in deep-hole drilling, cleaning, cutting, underwater sound generation, petroleum engineering, etc. (Chahine et al., 1995, 1985; Gensheng et al., 2005; Yanaida et al., 1985).
The cavitation effect of self-resonating cavitation is stronger than those of ordinary hydrodynamic cavitation processes because of the self-excited pressure oscillation. At the same time, a greater mechanical shear force can be produced due to the violent pressure oscillation. Therefore, self-resonating cavitation has potential advantages in the fields of chitosan and polymer degradation. In this paper, a self-resonating cavitation organ-pipe reactor with strong cavitation effects was used to investigate the degradation of chitosan. The effects of initial concentration, pH, solution temperature, inlet pressure and cavitation time were studied for evaluating the degradation of chitosan. The degradation products were also analyzed.
2 Experimental
2.1 Materials
Chitosan was purchased from Kabo Industrial Co., Ltd (Shanghai, China). The degree of deacetylation and viscosity average molecular weight of the chitosan were determined. CH3COOH (AR) was purchased from Kelong Chemical Reagent Factory (Chengdu, China). CH3COONa·3H2O (AR) was purchased from Yueqiao Reagent Co., Ltd (Taishan, China).
2.2 Equipment
Home-made devices and pipe fittings were used to fabricate the self-resonating cavitation reactor. As shown in Fig. 1, the reactor was a closed-loop system that consisted of a centrifugal pump (1/2DW-750, rated voltage: 200 V, power: 750 W, Zhejiang Aolong Technology Development Co., Ltd. China), pressure gauges (0.6 MPa, Hangzhou Guanshan Instrument Co., Ltd. China), a tank (10 L), a cavitator, valves, and pipe fittings. The inside diameter of pipes was 6.5 mm.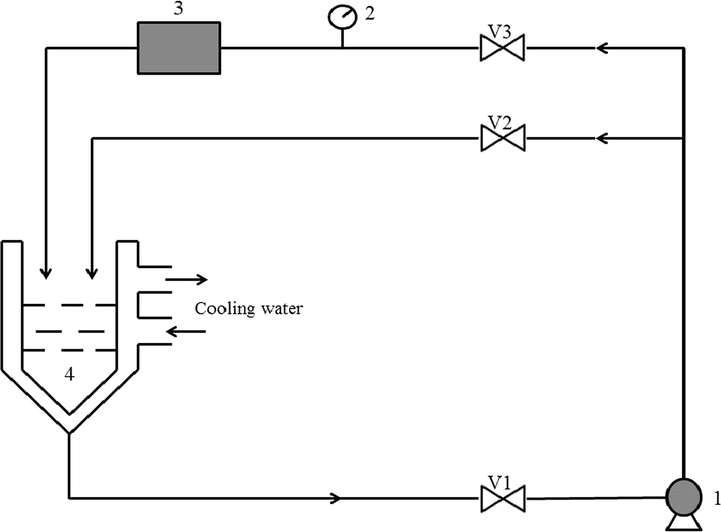
Schematic of the cavitation equipment (1. centrifugal pump; 2. pressure gauge; 3. cavitator; 4. tank; V1, V2 and V3 are valves).
The detailed structure of the self-resonating (organ-pipe) cavitator is shown in Fig. 2. The organ-pipe cavitator was designed following the literature (Li and Shen, 1992). The important parameters of the self-resonating chamber included upstream contraction (D1/D2)2 and nozzle contraction (D2/D3)2. The organ-pipe resonant cavity with a length of L2 served as the oscillation amplifier. When a stable fluid passed through the nozzle contraction section, the contraction surface can not only cause the initial pressure excitation of the fluid, but also feed the pressure excitation back to the resonant cavity, forming the feedback pressure oscillation. If the frequency of pressure excited matches the natural frequency of the resonant cavity, the feedback pressure oscillation can be amplified to generate fluid resonance in the resonant cavity and to form standing waves. The vortex in the shear layer of the jet is converted into a large structure-separating vortex circulation that can enhance cavitation effects. In this experiment, the detailed parameters of the self-resonating cavitator are shown in Table 1.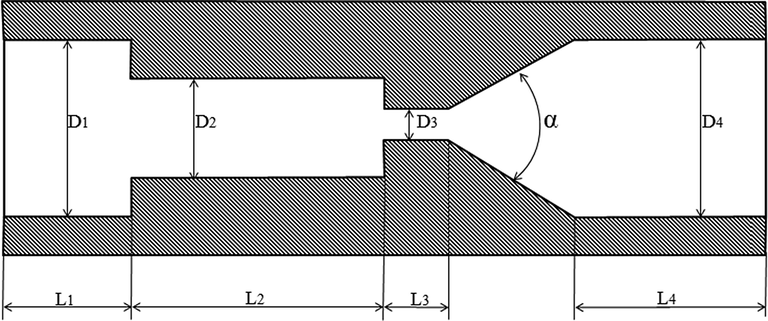
Inner structure of the self-resonating (organ-pipe) cavitator.
Parameters
D1
D2
D3
D4
L1
L2
L3
L4
α
Length/mm
26
12
4
26
20
38
4
35
60o
In a typical degradation experiment, chitosan was dissolved in a 0.2 mol·L−1 CH3COOH/0.1 mol·L−1 CH3COONa buffer solution, and the pH was adjusted after the chitosan solution was dissolved completely. 3 L of a chitosan solution with a certain concentration was poured into the tank before the centrifugal pump was started. The inlet pressure was adjusted with the bypass valve V2. The operating temperature was kept constant with a water bath jacket. During the degradation process, the samples were withdrawn for determination under the different conditions of chitosan initial concentration, solution temperature, pH, inlet pressure, and treatment time.
2.3 Measurement of intrinsic viscosity reduction rate
The intrinsic viscosity reduction rate was assessed by the one-point method (Fan et al., 2002). Chitosan samples were prepared in 0.2 mol·L−1 CH3COOH/0.1 mol·L−1 CH3COONa aqueous solutions. The efflux timesof samples (ts) and efflux time of the solvent (t0) were measured with a Ubbelohde capillary viscometer at 30 ± 0.1 °C. The intrinsic viscosity [ƞ] was calculated according to formula:
The effect on the degradation of chitosan was characterized by the intrinsic viscosity reduction rate [ƞ]r.
2.4 Measurement of degree of deacetylation (DD)
The degree of deacetylation was determined by an acid-base titration method (Ding and Gong, 2009). Chitosan (0.1 g) was dissolved in an excess of 0.1 mol·L−1 HCl (v1 = 30 mL). According to the titration result of this solution with 0.1 mol·L−1 NaOH, the DD of chitosan can be expressed as follows:
2.5 Measurement of viscosity-average molecular weight
The viscosity-average molecular weight was determined with a viscometric method (Chen and Hwa, 1996). The chitosan samples were prepared in a 0.2 mol·L−1 CH3COOH/0.1 mol·L−1 CH3COONa aqueous solution. The relative viscosity of a chitosan sample was measured by using a Ubbelohde capillary viscometer at 30 ± 0.1 °C. The viscosity-average molecular weight was calculated based on the Mark–Houwink equation:
Intrinsic viscosity [ƞ]* is defined as the reduced viscosity, and ƞred is the assumed viscosity corresponding to the chitosan concentration of zero, obtained by extrapolation:
2.6 Determination of degradation rate constant
Assuming that the self-resonating cavitation degradation reaction of chitosan agreed with the first-order reaction kinetics, and degradation rate constant
can be determined by the following equation (Wang et al., 1991; Ma, 2013).
2.7 Data analysis
The SPSS 19.0 software was used for data analysis, and the experimental results were expressed as mean ± standard deviation. The LSD software was used to evaluate the significance of the difference.
3 Characterizations of chitosan degradation products
3.1 Fourier-transform infrared spectroscopic analysis
FT-IR spectra of samples mixed with KBr were recorded with a Nicolet 6700 FT-IR spectrophotometer (America) in the range of 4000–400 cm−1.
3.2 X-ray diffraction analysis
XRD patterns of samples were determined in the 2θ range from 5° to 60° with a D/Max-3A apparatus (Japan) equipped with a Cu Kα radiation source at 40 kV and 40 mA.
3.3 Nuclear magnetic resonance hydrogen spectrum analysis
1H NMR spectra of samples solutions in D2O at 333 K were recorded with a Fourier transform Bruker Avance III HD 600 spectrometer.
3.4 Polydispersity analysis
The polydispersity of samples was measured with a GPC (Waters, USA) equipped with an Ultrahydrogel column (Milford, Massachusetts, USA), 2414 refractive index detector and 1515 pump. The mobile phase was a buffer solution (0.2 mol·L−1 CH3COOH/0.1 mol·L−1 CH3COONa), with a flow rate of 0.6 mL/min. 50 μL of the sample was injected and detected with the sensitivity of 32 at detector and column temperatures of 30 °C.
4 Results and discussion
4.1 Effects on the degradation of chitosan
4.1.1 Effect of chitosan initial concentration
The effect of initial concentration on chitosan degradation was investigated by self-resonating cavitation. The experiments were performed under the conditions of initial concentrations of 1–10 g·L−1, an inlet pressure of 0.4 MPa, pH of 4.4, temperature of 60 °C, and treatment time of 180 min. The degraded samples were withdrawn every 30 min. Then, the intrinsic viscosity of degraded chitosan solutions was measured, and the intrinsic viscosity reduction rate was calculated. The results are shown in Figs. 3 and 4. The kinetic rate constants k″ and the determination coefficient R2 (Eq. (6)) are shown in Table 2.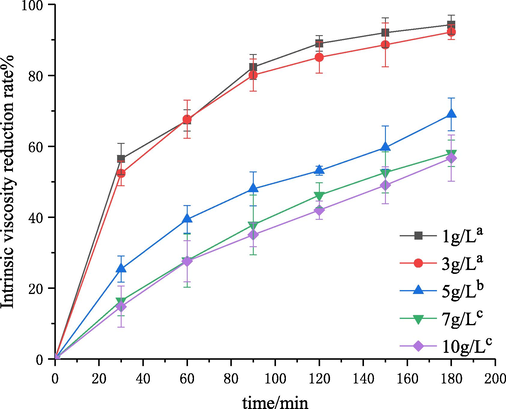
Effect of initial concentration on the degradation of chitosan. Note: The symbols (a–c) stand for the significance difference values. Curves with the same symbols are not different significantly (P > 0.05), the same as Figs. 5, 7, 9 and 11.
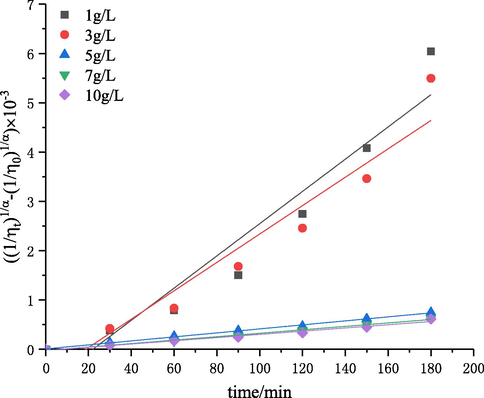
The plots of
versus degradation time under the conditions of different initial chitosan concentrations.
C0 (g/L)
R2
1
3.27
0.9234
3
2.88
0.9287
5
0.41
0.9975
7
0.35
0.9929
10
0.33
0.9800
As shown in Fig. 3, the initial concentration of chitosan had a great effect on the degradation efficiency. With the initial concentration increasing from 1 to 10 g·L−1, the intrinsic viscosity reduction rate was decreased from 94% to 56%. This phenomenon suggested that the degradation efficiency decreased with the increase of initial concentration of chitosan and a lower initial concentration promoted the degradation of chitosan through self-resonating cavitation. According to the results of Table 2 and Fig. 4, the R2 values in all the fitting results under the condition of different initial chitosan concentrations were greater than 0.9. The great linearity indicated that the degradation reaction caused by self-resonating cavitation was a random first-order reaction. The results of kinetic studies (Table 2) showed that the first-order rate constant decreased from 3.27 × 10⁻⁵ to 0.33 × 10⁻⁵ with the increase of initial concentration from 1 to 10 g·L−1, which is consistent with the tendencies in the cavitation degradation of chitosan with a turbine, orifice plate and Venturi tube (Huang et al., 2013; Wu et al., 2014; Xu et al., 2016). This is because the hydroxyl radicals of system provided was certain under the same cavitation conditions, so the degradation efficiency decreased with the increase of concentration. The stretching degrees of chitosan molecular chains decreased with the increase of solution concentration, and intramolecular and intermolecular hydrogen bonds were further strengthened. The probability of hydroxyl radicals attacking chitosan and the number of glycosidic bonds cleavaged were decreased (Huang et al., 2004). In addition, the viscosity and surface tension of the solutions increased with the increase of solution concentration, and cavitation bubbles had to overcome greater intermolecular forces for expansion, so the formation and transportation of cavitation bubbles were impeded. Thus, for improving the effect of chitosan degradation, the solution concentration should be lower. Considering the economy of the process, the initial concentration of 3 g·L−1 could be better.
4.1.2 Effect of solution temperature
Temperature is an important factor for chitosan degradation caused by self-resonating cavitation. The effect of temperature on chitosan degradation was investigated under the conditions of an initial solution concentration of 3 g·L−1, inlet pressure of 0.4 MPa, pH of 4.4, and treatment time of 180 min. Then, the intrinsic viscosity values of degraded chitosan solutions at 30, 40, 50, 60 and 70 °C were measured, and the intrinsic viscosity reduction rates were calculated. The results are shown in Figs. 5 and 6. The kinetic rate constants k″ and the determination coefficient R2 following Eq. (6) are shown in Table 3.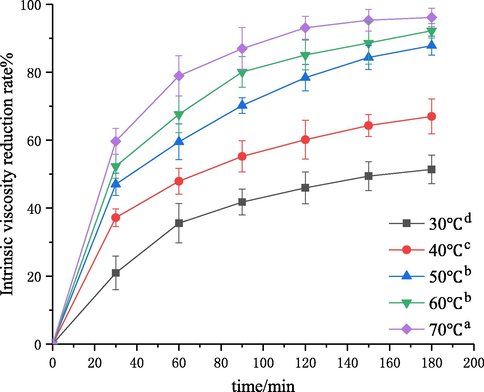
Effect of solution temperature on the degradation of chitosan.
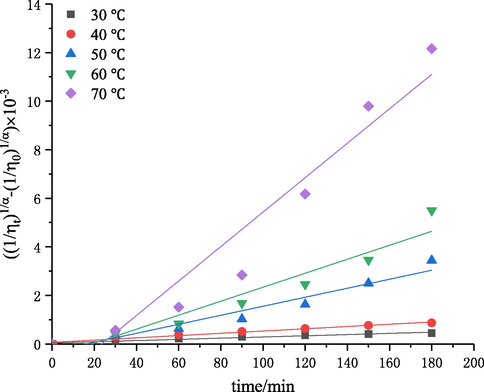
The plots of
versus degradation time at different temperatures.
T (°C)
R2
30
0.25
0.9606
40
0.47
0.9842
50
1.86
0.9447
60
2.88
0.9287
70
7.09
0.9290
Fig. 5 showed that the temperature had a great influence on chitosan degradation. Under the same conditions, as the temperature increased from 30 to 70 °C, the intrinsic viscosity reduction rate was increased from 52% to 96%. Fig. 6 and Table 3 showed the results of kinetic studies. The first-order rate constant increased from 0.25 × 10⁻⁵ to 7.09 × 10⁻⁵ with the increase of temperature from 30 to 70 °C. The results indicated that a higher temperature facilitated the degradation process, which is consistent with the trends in the cavitation degradation of chitosan with a turbine and Venturi tube (Wu et al., 2014; Xu et al., 2016). This may be due to the fact that the solution viscosity and surface tension decreased and molecules moved faster with the increase of temperature, which led to an increase of intermolecular collision probability, promoting the degradation reaction. On the other hand, the hydrogen bonds and salt linkages were gradually destroyed and steric hindrance disappeared with the increase of temperature, and the glycosidic bonds in chitosan became fragile and subject to degradation. In addition, water vapor pressure increased with increase of temperature, thus reducing the difference between vapor pressure and atmospheric pressure, which was conducive to the formation of cavitation bubbles and enhanced the cavitation effect. Fig. 5 showed that the intrinsic viscosity reduction rate leveled off at above 50 °C. This is probably because most salt linkages had been destroyed and the fracture of glycosidic bonds in molecular chains was not obvious at above a certain temperature (Chen and Han, 2006). Another reason may be that the vapor pressure increased faster than the solution temperature with the increase of temperature. Therefore, the transient high temperature and high pressure generated by cavitation collapse decreased, and the cavitation intensity decreased, thus lowering the degradation rate (Huang et al., 2015). It should be noted that the effect cannot be generalized because the increase of temperature also led to an increase in the vapor pressure of medium. This result implies that vaporous cavities would be generated in the system, leading to lower intensity of cavitation (Dhanke and Wagh, 2020; Mishra and Gogate, 2010). Similar results regarding the effect of operating temperature were reported in the literatures. Wang et al. (Wang and Zhang, 2009) investigated the effect of temperature on the extent of degradation of alachlor using hydrodynamic cavitation and reported that the temperature increased from 30 to 40 °C resulted in an increase in the extent of degradation, but the rates of degradation decreased when the temperature increased to 60 °C. Dhanke et al. (Dhanke and Wagh, 2020) studied the degradation of Acid RED-18 by hydrodynamic cavitation and found similar results.
4.1.3 Effect of pH on the degradation of chitosan
The effect of initial pH on chitosan degradation was investigated by using the self-resonating cavitatior. The experiments were performed at different pH values (3.2, 3.6, 4.0, 4.4 and 4.8) under the conditions of a solution concentration of 3 g·L−1, inlet pressure of 0.4 MPa, temperature of 60 °C, and treatment time of 180 min. Then, the intrinsic viscosity values of degraded chitosan solutions were measured, and the corresponding intrinsic viscosity reduction rates were calculated. The results are shown in Figs. 7 and 8. The kinetic rate constants
and R2 values are shown in Table 4.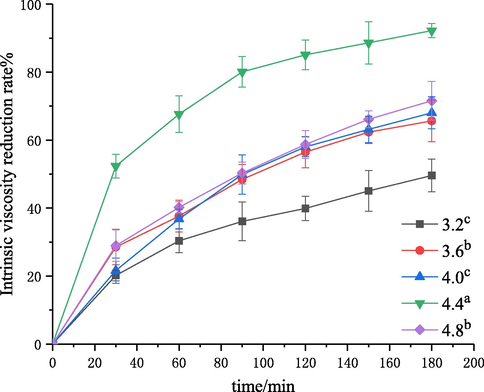
Effect of pH on the degradation of chitosan.
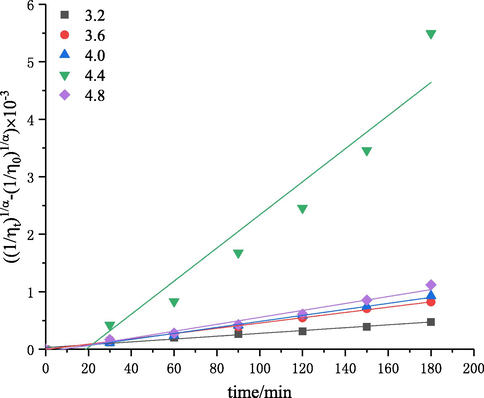
The plots of
versus degradation time at different pH values.
pH
R2
3.2
0.25
0.9862
3.6
0.46
0.9959
4.0
0.52
0.9946
4.4
2.88
0.9287
4.8
0.60
0.9786
As shown in Figs. 7, 8 and Table 4, the intrinsic viscosity reduction rate was increased and first-order rate constant was increased from 0.25 × 10⁻⁵ to 2.88 × 10⁻⁵ with the increase of pH from 3.2 to 4.4. This may be because the concentration of protons increased with the decrease of pH, and the concentration of the anions in the acidic solution would be also increased, forming more salt linkages in chitosan molecules and thus increasing the steric hindrance of the glycosidic bonds to be cleavaged and reducing the rate of chitosan degradation (Zhang et al., 2006). The intrinsic viscosity reduction rate decreased when the pH was greater than 4.4. This is due to the degradation of chitosan is an acid-catalyzed reaction in the first place, and the reaction should be carried out under acidic conditions. The optimal pH obtained in this study should be chosen to be 4.4.
4.1.4 Effect of inlet pressure
The effect of inlet pressure, in the range of 0.1–0.5 MPa, on the degree of degradation was investigated. The experiment was performed with the initial solution concentration of 3 g·L−−1, pH of 4.4, 60 °C, and treatment time of 180 min. Then, the intrinsic viscosity values of degraded chitosan solutions were measured, and the corresponding intrinsic viscosity reduction rate was calculated. The results are shown in Figs. 9 and 10. The kinetic rate constants
and R2 values are shown in Table 5.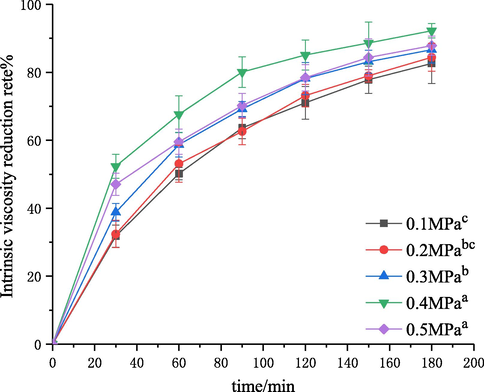
Effect of the inlet pressure on the degradation of chitosan.
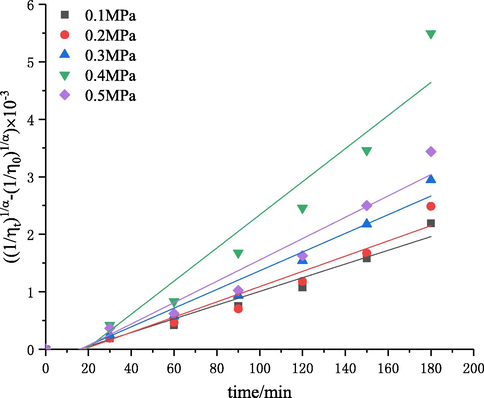
The plot of
versus the time at different inlet pressures.
P (MPa)
R2
0.1
1.19
0.9601
0.2
1.33
0.9405
0.3
1.62
0.9625
0.4
2.88
0.9287
0.5
1.87
0.9450
It was found that the intrinsic viscosity reduction rate increased first and then decreased with the increase of inlet pressure (Fig. 9). The intrinsic viscosity reduction rate was increased from 82.5% to 92.2% with the increase in pressure from 0.1 to 0.4 MPa. Fig. 10 and Table 5 showed the results of kinetic studies. The first-order rate constant was increased from 1.19 × 10⁻⁵ to 2.88 × 10⁻⁵ with the increase in pressure from 0.1 to 0.4 MPa. This could be explained by the fact that the flowing velocity of liquid increased with the increase of inlet pressure, thereby (i) decreasing the number of cavities which were beneficial for the formation of cavitation; (ii) increasing the frequency of cavitation in per volume of solution; and (iii) enhancing the resonant frequency and the resonant amplitude of jet leading to the increase of the velocity gradient of liquid in the resonant cavity, which could strengthen the mechanical shearing force of fluid (Ma et al., 2016). Thus, the effect of degradation was improved. However, the reduction rate of intrinsic viscosity was decreased when the pressure was higher than 0.4 MPa, which was caused by a super cavitation phenomenon at high pressures. Moreover, the decrease in the intrinsic viscosity reduction rate at a higher inlet pressure (0.5 MPa) can be attributed to choked cavitation, and the entire downstream area of the cavitation device was completely filled with a large number of cavities. These cavities would be integrated into larger bubbles, thus reducing the cavitational intensity because of the incomplete or cushioned collapse of these cavities (Saharan et al., 2011). Therefore, the parameter 0.4 MPa was chosen as the optimal inlet pressure in this study. When chitosan was degraded by cavitation with a turbine and orifice plate, the degradation efficiency increased with the increase of pressure in a certain range. These results are different from the trend in self-resonationg cavitation, which should be attributed to the different cavitation mechanisms (Huang et al., 2013; Wu et al., 2014). Cavitation with a turbine is the cavitation effect caused by cavitation bubbles generated during the rotation process of turbine. Higher pressures led to a faster injection speed in the swirl chamber, resulting in a higher pressure drop in the center of vortex, so more cavitation bubbles could be formed and the influence of cavitation intensity was stronger. For the cavitation with an orifice plate, the increase of pressure could increase the velocity of jets and the pressure difference around the center of orifice plate, thus promoting the degradation. The self-resonating cavitation process is a type of cavitation mode to strengthen the hydrodynamic cavitation through the self-excited oscillation produced by the resonant cavity, in which the influence of pressure change on the fluids in the resonant cavity (such as the influence on the frequency and amplitude of the oscillation) is complex (Ma et al., 2016). Therefore, the trend is different and the specific reasons need to be further studied.
4.1.5 Effect of treatment time
The effect of treatment time on chitosan degradation was studied. The experiment was performed under the conditions of initial solution concentration of 3 g·L−1, pH of 4.4, 60 °C, and treatment time of 180 min. Then, the intrinsic viscosity of degraded chitosan solutions was measured, and the intrinsic viscosity reduction rate was calculated. The results are shown in Fig. 11.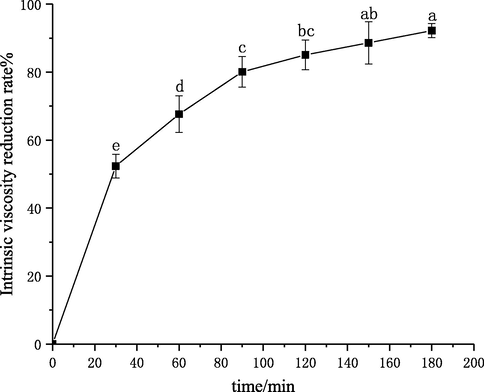
Effect of time on the degradation of chitosan.
The intrinsic viscosity reduction rate increased with the increase of treatment time and reached 92.2% at 180 min in Fig. 11. It was also observed that the intrinsic viscosity reduction rate increased rapidly in the range of 0–90 min. 90 min later, the intrinsic viscosity reduction rate leveled off. This was probably because the breakage of the glycosidic bonds took place during the degradation of chitosan. At the beginning of the treatment, the molecular chains of chitosan were long and contained glycosidic bonds, and the degradation rate was high. With the continuous treatment, the molecular chains became shorter, and the number of glycosidic bonds became smaller, which slowed the degradation rate. In addition, in the early stage of cavitation, more oxygen was dissolved in the solution, which made cavitation more obvious. After a period of cavitation treatment, the oxygen content in the solution was gradually decreased, weakening the effect of cavitation. Thus, the treatment time should not be too long.
4.2 Analysis of products
4.2.1 Measurement of viscosity-average molecular weight
The experiment was performed under the conditions as follows: a solution concentration of 3 g·L−1, pH 4.4, at pressure 0.4 MPa and temperature 60 °C, for cavitation time 60 min. Based on a viscometric method (Fan et al., 2002), the specific viscosity of initial and degraded chitosan was measured under the conditions of different solution concentrations, and the intrinsic viscosity values of initial and degraded chitosan were calculated to be 649.19 and 116.94 cm3·g−1, respectively, according to Eq. (5). On the other hand, based on an acid–base titration method, the DD values of initial and degraded chitosan were measured to be 89.34% and 88.05%, respectively. Then, the viscosity-average molecular weights of initial and degraded chitosan were calculated to be 651 and 104 kD, respectively, according to Eq. (4). The data indicated that after degradation, the DD value of chitosan was slightly changed and the degradation of chitosan by self-resonating cavitation was highly efficient.
4.2.2 FT-IR spectral analysis
FT-IR is a powerful tool for the study of physicochemical properties of polysaccharides. The FT-IR spectra of original and degraded chitosan are shown in Fig. 12. The main bands in the spectrum of original chitosan could be assigned as follows: the bands in the range of 3600–3200 cm−1 were attributed to the stretching vibration of O-H and N-H (Huang et al., 2008); the signals at 1646 and 1346 cm−1 were assigned to amide I and III bands, respectively; the band at 1570 cm−1 could be attributed to amide II band (Wang et al., 2008); the bands at 1151 and 1093 cm−1 were assigned to C-O-C and C-O groups (Gu et al., 2010); the band at 929 cm−1 was assigned to the β-(1,4)-glycosidic bonds in chitosan (Yue et al., 2009). No bands between 1660 and 1900 cm−1 were observed, indicating that carboxyl or carbonyl groups (Xu et al., 2016) were absent in the degradation products. Compared with the spectrum of original chitosan, the intensity of bands in the spectrum of degradation chitosan was changed, but the wavenumber values did not change, which showed that no side reactions occurred in the degradation process of chitosan by self-resonating cavitation, and the functional groups and main-chain structures of the products were not damaged except for the breaking of glycosidic bonds on the molecular chains. This may be because the free radicals and mechanical effects, produced by self-resonating cavitation, did not cause the changes in the backbone structures and only broke the β-(1,4) glycosidic bonds of chitosan molecules (Zhou, 2008). These results are also consistent with the findings of degradation of chitosan with a turbine, orifice plate and Venturi tube (Huang et al., 2013; Wu et al., 2014; Xu et al., 2016).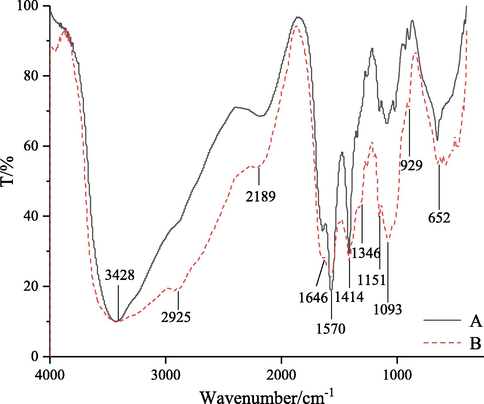
FT-IR spectra of original (A) and degraded chitosan (B).
4.2.3 XRD spectral analysis
The X-ray diffraction patterns of initial and degraded chitosan are shown in Fig. 13. The XRD pattern of the former exhibited two characteristic peaks at 2θ of 9.59° and 20.00°, assigned to the crystal forms I and II (Jiang et al., 2011; Wang et al., 2007). In contrast, the intensity of peak at 2θ of 20.24° was decreased after the degradation and the other peak disappeared, indicating that the number of intermolecular hydrogen bonds in chitosan was reduced after the degradation. Thus, the degradation of chitosan by self-resonating cavitation destroyed a proportion of crystals in the chitosan matrix, and the destruction could occur in both the amorphous and crystalline regions. In other words, the chitosan in the amorphous region was firstly degraded into water-soluble molecules, and was then dissolved in the water. With the proceeding of degradation, the crystalline structure was destroyed and the crystallinity decreased (Qin et al., 2002). In contrast, the chitosan degraded with an orifice plate and Venturi tube cavitator only showed weakened characteristic XRD signals, while after the degradation of chitosan by self-resonating cavitation, one of the two characteristic peaks disappeared and the weakened extent of the other was greater than the former cavitator, which indicated that the degradation effect of self-resonating cavitation on chitosan was stronger (Huang et al., 2013; Xu et al., 2016).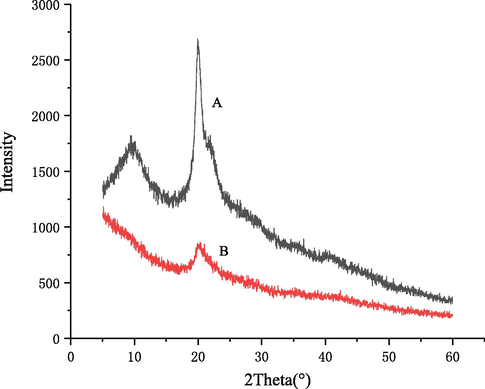
X-ray diffraction spectrum of original (A) and degraded chitosan (B).
4.2.4 1H NMR spectral analysis
The 1H NMR spectra of original and degraded chitosan samples are shown in Fig. 14. Assignments of initial chitosan are shown in Fig. 14A. The signals can be identified as follows: the small signal at 4.82 ppm is attributed to H1 (Qin et al., 2012). Multiplets at 3.85–3.70 ppm correspond to H3, H4, H5 and H6 of the glucosamine molecules (Kumar et al., 2012). The singlet at 3.11 ppm is assigned to H2 and the signal at 2.01 ppm is assigned to —CH3 (Ma et al., 2009). Assignments of degraded chitosan are shown in Fig. 14B. Signals at 3.69–3.95 ppm attributed to H3, H4, H5 and H6 protons of the polysaccharide are significantly enhanced. Other signals at 4.30 and 4.63 ppm are assigned to H1, and these signals are overlapped with those of the solvent. The signal at about 2.06 ppm is assigned to —NH(CO)—CH3. The 1H NMR results indicated that degradation process did not affect the main-chain structure of chitosan, which is consistent with the FT-IR results.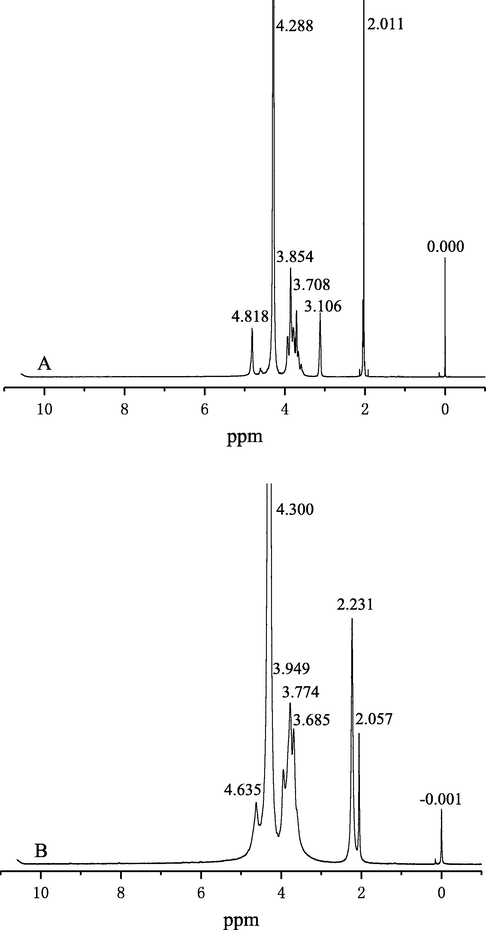
1H NMR spectra of original (A) and degraded chitosan (B).
4.2.5 Polydispersity analysis
As shown in Fig. 15, the polydispersity indices of products became lower and decreased from 3.17 at 0 min to 2.75 at 180 min, which indicated that the molecular-weight distribution of products was more concentrated after degradation by self-resonating cavitation. This may be because of the strong mechanical effect in the process of self-resonating cavitation. Chitosan is a linear polymer and the mechanical degradation effect usually occurs in the center of the backbone (Bose and Git, 2004). And, the greater the molecular weight is, the higher the degradation degree by mechanical effect is. Therefore, in the system containing polydisperse chitosan materials, macromolecules were degraded into molecules with medium molecular weights through the mechanical effect, and the molecular weights of products would be more concentrated, thus reducing the polydispersity index of products.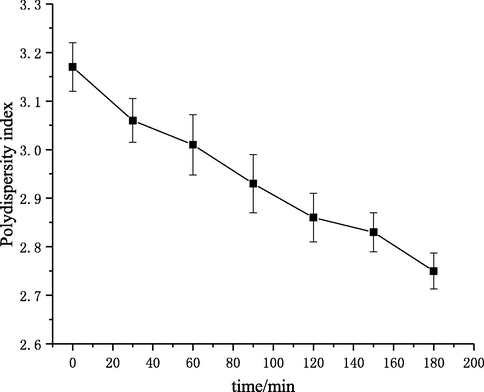
Polydispersity indices of products at different degradation times.
5 Conclusions
The degradation of chitosan by self-resonating cavitation could be effectively promoted under the conditions of lower solution concentrations, higher temperatures, pH of 4.4 and upstream pressure of 0.4 MPa. Under the experimental conditions, the intrinsic viscosity reduction rate of chitosan solution reached 92.2%. Compared with the previous studies (Huang et al., 2013; Wu et al., 2014; Xu et al., 2016), the degradation efficiency of chitosan was significantly improved by self-resonating cavitation, which is twice as high as the degradation efficiency of chitosan with a Venturi tube cavitator. The analysis results of products showed that chitosan could be effectively degraded without the changes in the natural structures of chitosan byself-resonating cavitation, and the viscosity-average molecular weight, crystallinity and polydispersity index of chitosan were decreased after the degradation process. This paper provides a new method for the preparation of oligochitosan with relatively concentrated degrees of polymerization.
Compared with the traditional cavitation methods, the self-resonating cavitation process has advantages of high energy utilization rate, strong mechanical effect, and better cavitation effect. The degradation efficiency in the self-resonating cavitation process is high, so self-resonating cavitation is expected to be applied in more fields in the future.
Acknowledgements
This work was supported by the National Natural Science Foundation of China (No. 31660472).
Declaration of Competing Interest
The authors declare no conflict of interest.
References
- International Journal of Biological Macromolecules Wound healing potential of curcumin cross-linked chitosan/polyvinyl alcohol. Int. J. Biol. Macromol.. 2019;140:871-876.
- [CrossRef] [Google Scholar]
- A review on chitosan and its nanocomposites in drug delivery. Int. J. Biol. Macromol.. 2018;109:273-286.
- [CrossRef] [Google Scholar]
- Chitosan-Based bio-composite modified with thiocarbamate moiety for decontamination of cations from the aqueous media. Molecules. 2020;25:226.
- [CrossRef] [Google Scholar]
- Enhancing catalytic functionality of trametes versicolor IBL-04 laccase by immobilization on chitosan microspheres a monomeric 64-kDa laccase from trametes versicolor IBL-04 was immobilized onto. Chem. Eng. Res. Des.. 2016;119:1-11.
- [CrossRef] [Google Scholar]
- Delignification of lignocellulose biomasses by alginate – chitosan immobilized laccase produced from trametes versicolor IBL-04. Waste Biomass Valoriz.. 2017;9:2071-2079.
- [CrossRef] [Google Scholar]
- Adsorptive behavior of rice bran-based composites for malachite green dye: Isotherm, kinetic and thermodynamic studies. J. Mol. Liq.. 2017;237:322-333.
- [CrossRef] [Google Scholar]
- Biogenic nanoparticle-chitosan conjugates with antimicrobial, antibiofilm, and anticancer potentialities: development and characterization. Int. J. Environ. Res. Public Health. 2019;16:598.
- [CrossRef] [Google Scholar]
- Mathematical modelling and computer simulation of linear polymer degradation: simple scissions. Macromol. Theory Simul.. 2004;13:453-473.
- [CrossRef] [Google Scholar]
- The use of self-resonating cavitating water jets for underwater sound generation. J. Acoust. Soc. Am.. 1985;77:113-126.
- [CrossRef] [Google Scholar]
- Chahine, G.L., Kalumuck, K.M., Frederick, G.S., 1995. The use of self resonating cavitating water jets for rock cutting. In: 8th American WaterJet Conference.
- Study on the effects of different factors on degradation speed of chitosan. J. Anhui Agric. Sci.. 2006;34:1052-1056.
- [CrossRef] [Google Scholar]
- Effect of molecular weight of chitosan with the same degree of deacetylation on the thermal, mechanical, and permeability properties of the prepared membrane. Carbohydr. Polym.. 1996;29:353-358.
- [CrossRef] [Google Scholar]
- Intensification of the degradation of Acid RED-18 using hydrodynamic cavitation. Emerg. Contamin.. 2020;6:20-32.
- [CrossRef] [Google Scholar]
- Research on the degree of deacetylation of chitosan. Chem. Technol. Mark.. 2009;32:14-17.
- [Google Scholar]
- Chitosan nanoparticles preparation and applications. Environ. Chem. Lett.. 2018;16:101-112.
- [CrossRef] [Google Scholar]
- J. Ocean Univ. Qingdao. 2002;32:296-300.
- Investigation and application of self-resonating cavitating water jet in petroleum engineering. Pet. Sci. Technol.. 2005;23:1-15.
- [CrossRef] [Google Scholar]
- Degradation of hyaluronan by an electrochemical process. Carbohydr. Polym.. 2010;82:521-523.
- [CrossRef] [Google Scholar]
- Asian Pac. J. Trop. Med.. 2015;8:757-776.
- [CrossRef]
- Study on jet’s characteristics of organ nozzle and Helmholtz nozzle. Saf. Coal Mines. 2017;48:134-137.
- [CrossRef] [Google Scholar]
- Study on Degradation of Chitosan with UV /H2O2. J. Fujian Normal Univ. (Natural Sci. Ed.). 2004;20:63-67.
- [Google Scholar]
- Heterogeneous degradation of chitosan with H2O2 catalysed by phosphotungstate. Carbohydr. Polym.. 2008;72:500-505.
- [CrossRef] [Google Scholar]
- Synergistic degradation of chitosan by impinging stream and jet cavitation. Ultrason. Sonochem.. 2015;27:592-601.
- [CrossRef] [Google Scholar]
- Degradation of chitosan by hydrodynamic cavitation. Polym. Degrad. Stab.. 2013;98:37-43.
- [CrossRef] [Google Scholar]
- Synthesis and characterization of chitosan and guar gum based ternary blends with polyvinyl alcohol. Int. J. Biol. Macromol.. 2019;143:546-554.
- [CrossRef] [Google Scholar]
- Synthesis of a novel water-soluble chitosan derivative for flocculated decolorization. J. Hazard. Mater.. 2011;185:1482-1488.
- [CrossRef] [Google Scholar]
- Preparation and characterization of chitosan / clay composite for direct Rose FRN dye removal from aqueous media: comparison of linear and non-linear regression methods. Integr. Med. Res.. 2018;8:1161-1174.
- [CrossRef] [Google Scholar]
- Engineering functionalized chitosan-based sorbent material: characterization and sorption of toxic elements. Appl. Sci.. 2019;9:5138.
- [CrossRef] [Google Scholar]
- Effects of frequency and a radical scavenger on ultrasonic degradation of water-soluble polymers. Ultrason. Sonochem.. 2011;18:276-281.
- [CrossRef] [Google Scholar]
- A new chitosan-thymine conjugate: synthesis, characterization and biological activity. Int. J. Biol. Macromol.. 2012;50:493-502.
- [CrossRef] [Google Scholar]
- Design prinpicle of organ-pipe cavitation jet nozzles. J. Univ. Petrol. China. 1992;16:35-39.
- [Google Scholar]
- An amphiprotic novel chitosanase from bacillus mycoides and its application in the production of chitooligomers with their antioxidant and anti-inflammatory evaluation. Int. J. Mol. Sci.. 2016;17:1302.
- [CrossRef] [Google Scholar]
- Experimental study of self-resonating water jet frequency characteristics. Jixie Gongcheng Xuebao/J. Mech. Eng.. 2016;52:182-187.
- [CrossRef] [Google Scholar]
- Kinetic Model of Plasma Degradation of Chitosan and Structural characteristics and Bioactivities Osoligochitosan. Harbin Institute of Technology; 2013.
- Synthesize and characterization of organic-soluble acylated chitosan. Carbohydr. Polym.. 2009;75:390-394.
- [CrossRef] [Google Scholar]
- Preparation andcharacterization of water-soluble N-alkylated chitosan. Carbohydr. Polym.. 2008;74:121-126.
- [CrossRef] [Google Scholar]
- Ultrasound and sonochemistry for radical polymerization: sound synthesis. Chem. – Eur. J.. 2019;25:5372-5388.
- [CrossRef] [Google Scholar]
- Antifungal activity of chitooligosaccharides against the dermatophyte Trichophyton rubrum. Int. J. Biol. Macromol.. 2015;77:330-335.
- [CrossRef] [Google Scholar]
- Intensification of degradation of Rhodamine B using hydrodynamic cavitation in the presence of additives. Sep. Purif. Technol.. 2010;75:385-391.
- [CrossRef] [Google Scholar]
- Chitosan, starch, polyaniline and polypyrrole biocomposite with sugarcane bagasse for the efficient removal of Acid Black dye. Int. J. Biol. Macromol.. 2020;147:439-452.
- [CrossRef] [Google Scholar]
- The influence of frequency on the mechanical and radical effects for the ultrasonic degradation of dextranes. Ultrason. Sonochem.. 1997;4:127-130.
- [CrossRef] [Google Scholar]
- Effect of hydrogen peroxide treatment on the molecular weight and structure of chitosan. Polym. Degrad. Stab.. 2002;76:211-218.
- [CrossRef] [Google Scholar]
- Synthesis and characterization of dithiocarbamate chitosan derivatives with enhanced antifungal activity. Carbohydr. Polym.. 2012;89:388-393.
- [CrossRef] [Google Scholar]
- Ramos, S., Joa, M., Soares, C., Fernandes, C., Tavaria, F.K., Pintado, M.E., Ã, F.X.M., 2008. Antimicrobial effects of chitosans and chitooligosaccharides, upon Staphylococcus aureus and Escherichia coli, in food model systems 25, 922–928. https://doi.org/10.1016/j.fm.2008.05.003.
- Degradation of Reactive Red 120 dye using hydrodynamic cavitation. Chem. Eng. J.. 2011;178:100-107.
- [CrossRef] [Google Scholar]
- The effect of preparation processes on the physicochemical characteristics and antibacterial activity of chitooligosaccharides. Carbohydr. Polym.. 2017;157:251-257.
- [CrossRef] [Google Scholar]
- Bio-molecules composite with peanut hull waste and application for Crystal Violet adsorption. Int. J. Biol. Macromol.. 2016;94:210-220.
- [CrossRef] [Google Scholar]
- Effect of hydrodynamic cavitation in single-hole orifice plate on physicochemical properties of soybean globulin. Food Sci.. 2019;40:135-141.
- [CrossRef] [Google Scholar]
- Gamma radiation-induced grafting of a cationic monomer onto chitosan as a flocculant. Chemospheree. 2007;66:1752-1757.
- [CrossRef] [Google Scholar]
- Determination of the Mark-Houwink equation for chitosans with different degrees of deacetylation. Int. J. Biol. Macromol.. 1991;13:281-285.
- [CrossRef] [Google Scholar]
- A new green technology for direct production of low molecular weight chitosan. Carbohydr. Polym.. 2008;74:127-132.
- [CrossRef] [Google Scholar]
- Degradation of alachlor in aqueous solution by using hydrodynamic cavitation. J. Hazard. Mater.. 2009;161:202-207.
- [CrossRef] [Google Scholar]
- Degradation of chitosan by swirling cavitation. Innov. Food Sci. Emerg. Technol.. 2014;23:188-193.
- [CrossRef] [Google Scholar]
- Study on the degradation of chitosan with hydrodynamic cavitation based on the venturi tube. Sci. Technol. Food Ind.. 2016;02:244-248.
- [Google Scholar]
- Acidic degradation and enhanced antioxidant activities of exopolysaccharides from Cordyceps sinensis mycelial culture. Food Chem.. 2009;117:641-646.
- [CrossRef] [Google Scholar]
- Study on mechanism of chitosan degradation. Ultrason. Sonochem. 2020:105046.
- [CrossRef] [Google Scholar]
- Yanaida, K., Nakaya, M., Eda, K., Nishida, N., 1985. Water jet cavitation performance of submerged horn shaped nozzles. Proceedings, 266–278.
- Chitosan and chitosan coating nanoparticles for the treatment of brain disease. Int. J. Pharm.. 2019;560:282-293.
- [CrossRef] [Google Scholar]
- Ultraviolet radiation-induced accelerated degradation of chitosan by ozone treatment. Carbohydr. Polym.. 2009;77:639-642.
- [CrossRef] [Google Scholar]
- Thermal treatment of chitosan in various conditions. Carbohydr. Polym.. 2010;88:394-400.
- [CrossRef] [Google Scholar]
- Preparation of chitosan antibacterial microparticles via ionic cross-linking intensified by Venturi-tube based hydrodynamic cavitation. Gao Xiao Hua Xue Gong Cheng Xue Bao/J. Chem. Eng. Chin. Univ.. 2019;33:219-227.
- [CrossRef] [Google Scholar]
- Effect of organic acid and degradation condition on degradation speed of chitosan. J. Hebei Normal Univ. Sci. Technol.. 2006;20:32-34.
- [CrossRef] [Google Scholar]
- Study on the Application of High Pressure Homogenization Technology in the Degradation of Chitosan. Nanjing University of Science and Technology; 2008.


