Translate this page into:
Design of new dipeptide inhibitors against SARS-CoV 3CLpro: 3D-QSAR, molecular docking, MD simulation, ADMET studies and retrosynthesis strategy
⁎Corresponding author. souka.esslali@gmail.com (Esslali Soukaina)
-
Received: ,
Accepted: ,
This article was originally published by Elsevier and was migrated to Scientific Scholar after the change of Publisher.
Peer review under responsibility of King Saud University.
Abstract
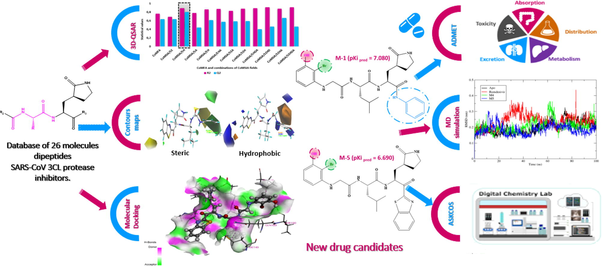
Abstract
The 3CL protease plays a crucial role in the life cycle of SARS-CoV. This protease is considered an important antiviral target. In the present work, the 3D-QSAR study was performed on a set composed of twenty-six dipeptide SARS-CoV 3CLpro inhibitors in order to propose the new potent anti-SARS agents with a high predicted activity value. The model of CoMSIA/SH is the optimal, with good statistical results presenting a high value of the cross-validation coefficient Q2 = 0.796 and a good value of the determination coefficient R2 = 0.887, the external validation of this model is justified by the high value of the prediction coefficient R2pred = 0.884 and the validation of Globraikh, Roy and Tropsha criteria. The exploitation of the different results provided key information about the structures favored to improve the inhibitory activity against 3CLpro, and has enabled us to propose seven new potent inhibitors with significant predictive activity values, notably compound M−1 with pKipred = 7.080. Then, a molecular docking study was performed to determine the binding energy and to identify the key interactions between the receptor (PDB ID: 1WOF) and the ligands. All the newly designed compounds showed low binding energy values as compared to the Remdesivir −8.144 kcal. mol−1 especially for compounds M−5 and M−4 with the binding affinity values −10.022 kcal. mol−1 and −9.727 kcal.mol−1 respectively. In addition, these inhibitors were verified for in silico pharmacokinetic proprieties and toxicity profile using ADMET. Two compounds M−4 and M−5 with potential results in the molecular docking were selected for the molecular dynamic simulation of 100 ns. The MM-GBSA results show that the predicted compound M−5 has the lowest free energy with −38.200 KJ/mol. We exploited the computer-aided synthesis technology using the ASKCOS website to perform a retrosynthetic analysis of compound M−5.
Keywords
SARS CoV 3CLpro
CoMSIA/SH
Molecular docking
MD simulation
Retrosynthesis
1 Introduction
In November 2019, China reported the detection of the first positive case of a new coronavirus 2019 (COVID-19), caused by the severe acute respiratory syndrome coronavirus-2 (Belhassan et al., 2022). Despite global efforts to limit the spread of the virus in the word, the cases started to multiply and the virus affected the millions of people worldwide creating a global pandemic (Traboulsi et al., 2022). As declared by the World Health Organization (WHO), until 29 January 2023, there is a total of 752 517 552 active cases, and the number of deaths caused by COVID-19 has exceeded 6 804 491 in the world (Https://covid19.who.int/, n.d.). 3-Chymotrypsin-like protease (3CLpro) or main protease (Mpro) is known for its indispensable role in the viral life cycle. The inhibition of Mpro activity is expected to block viral replication because no human protease is known to have similar cleavage specificity (Bhati et al., 2021). Therefore, Mpro has been identified as a therapeutic target for the development of anti-SARS agents (Du et al., 2021; V’kovski et al., 2021). The active site of 3CLpro contains a catalytic dyad in which Cys-145 acts as a nucleophile and the histidine residue His-41 as a base (Bhati et al., 2021). Indeed, it has been reported that SARS-CoV 3CLpro is inhibited by different compounds containing a peptide moiety. Several works have been performed for the discovery, the synthesis and development of anti-SARS agents with a peptide moiety (Regnier et al., 2009). The principal objective of this study is to propose the new dipeptide-type SARS-CoV 3CLpro inhibitors using computational chemistry by applying several theoretical studies as shown in Fig. 1. First, we established a quantitative structure–activity relationship (Piekuś-Słomka et al., 2022) for a database composed of 26 dipeptide-type SARS-CoV 3CLpro inhibitors using different methods such as CoMSIA (Jovanović et al., 2021) and CoMFA (Abdizadeh, Hadizadeh, et al., 2020). The results generated by the 3D-QSAR method indicated that the optimal model was COMSIA/SH as it has the best statistical parameters and meets all internal and external validation criteria. The information extracted from the steric and hydrophobic contour maps was exploited to specify the nature of substitution that could be added in each region of the molecule template (compound-21) to increase the biological activity value. As a result, seven new compounds with important predicted activity values were identified. Then, the molecular docking approach was used to calculate the binding affinity and to estimate the key interactions between the newly compounds designed with the active site of the SARS-CoV 3CLpro (PDB: 1WOF). The estimation of the pharmacokinetic properties of the newly designed compounds was assessed using ADMET parameters (ER-RAJY et al., 2022). Molecular dynamics simulation was followed to examine the stability of the ligands M−4 and M−5 in the binding site (Wang et al., 2022). In order to estimate the binding free energy of protein–ligand system, we applied MM-GBSA approach using the gmx-mmgbsa package (Oubahmane et al., 2023). As the proposed molecules had to be synthesizable, a retrosynthesis analysis of compound M−5 was carried out by the computer-assisted synthesis method using the ASKCOS website (https://askcos.mit.edu). By applying this program, a one-step retrosynthesis has been proposed by determining the necessary recommendation conditions: solvent, catalyst and temperature of reaction in order to obtain the target, this program also contains a module of retrosynthesis in multiple steps by the generation of the tree, this module proposed a decomposition of the target by starting the synthesis from simple and commercially available precursors.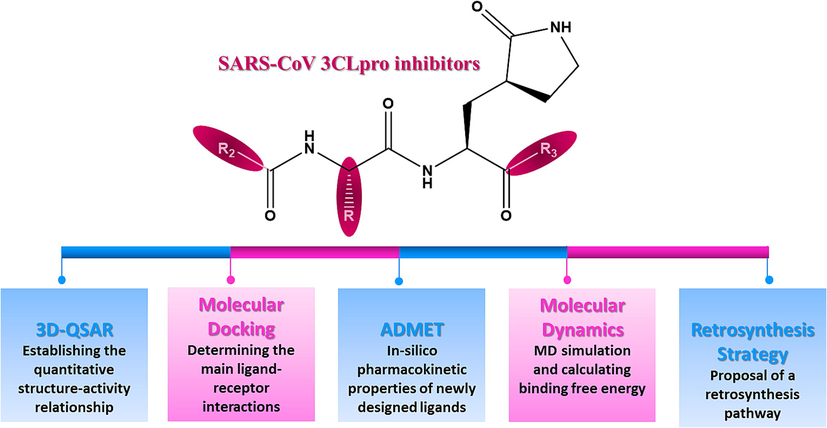
Rational approach of the current work.
2 Materials and methods
2.1 Database selection
In the present study, a database consisting of twenty-six dipeptide-type SARS CoV 3CLpro inhibitors were extracted from the literature (Thanigaimalai et al., 2013), with their biological activities being expressed in Ki, which were subsequently converted to pKi values. The construction of a QSAR model requires to divide the database in two subsets: the training set for the construction of the model, it is constituted of 21 molecules presenting approximately 80 % and the test set for the validation of the model composed of 5 molecules for a percentage of 20 %.
2.2 Minimization and molecular alignment
SYBYL-X 2.0 software was employed in the molecular alignment and minimization of all dipeptides studied. Alignment step presents the sensitive procedure in the development of 3D-QSAR models (Ouassaf et al., 2021). The optimization of all molecules in the database allows the minimization of the energy of these molecules by the standard Tripos field with a convergence criterion of the energy gradient in the order of 0.01 kcal/mol (Tabti et al., 2022a). In this study, compound-21 was used as the reference molecule to align all compounds within the database using distill module in SYBYL-X 2.0. The molecular core and the superimposed structures of aligned database are shown in Fig. 2.
Molecular core is presented by a pink color (A). Alignment of 26 studied molecules using compound- 21 as a template (B).
2.3 3D-QSAR modeling
2.3.1 CoMFA and CoMSIA field descriptors
The construction of different 3D-QSAR models (El Rhabori et al., 2022) was performed using CoMSIA and CoMFA methods, in order to predict the anti-SARS activity (pKipred) of the studied dipeptide molecules as a function of different fields. The CoMFA model was characterized by the presence of two fields (E: electrostatic and S: steric) these two fields were represented in a 3D grid with a spacing of 2.0 Å. For the calculation of the steric and electrostatic field energy, it was performed with a sp3 hybridized carbon atom as a probe with a Lennard-Jones radius of 1.52 Å and a Coulomb charge of + 1.00. The interaction cutoff energies have values of 30 kcal/mol (Hadni & Elhallaoui, 2020). In the case of the CoMSIA method, five fields (S: steric; E: electrostatic; H: hydrophobic; D: donor hydrogen bond and A: acceptor hydrogen bond) were involved in the calculation of various descriptors. The cut-off energies of the interactions are requested to be of the order of 30 kcal/mol and the attenuation factor has been set to 0.3. The column filtering is based on the calculation of molecular field energies with a variation of less than 2.0 kcal/mol (El McHichi et al., 2022).
2.3.2 Partial least squares (PLS) method
All 3D-QSAR models were constructed using the partial least squares (PLS) regression approach implemented in SYBYL-X 2.0. The PLS method has been used to describe the relationship linking two different groups of variables (Khatabi et al., 2022). These two variables are the descriptors molecular (CoMFA and CoMSIA descriptors) and the SARS-CoV 3CLpro inhibitory activity (pKi values). The calculation of the optimal number of components (NOC) (Sherin et al., 2019) and the cross-validation correlation coefficient (Q2) were realized by leave-one-out (LOO) cross-validation, then we used the non-cross-validation technique to calculate the determination coefficient (R2), the F-test value (F) and the standard error of estimation (SEE) (Soukaina et al., 2023).
2.3.3 Validation of QSAR models
Effective internal validation, characterized by elevated Q2 and R2 values, is essential. However, it does not suffice to ensure the predictability of the proposed models. Therefore, external validation was essential using different statistical parameters such as: coefficient of determination (R2test ˃ 0.6) given by the following formula (Eq (1):
PRESS: squared derivations sum among the anticipated and real functions related to the test set molecules.
SD: squared deviation sums between the test set biological activities as well as the training set average activities (Abdizadeh, Heidarian, et al., 2020).
To confirm the best predictive model for the test set, we used these parameters based on the formula (Eqs (2)–(7):
and : significant squared correlation coefficients to calculate regression lines by the origin between predicted and detected activities and vice versa.
k and k’: represent their model’s slopes (Abdizadeh, Heidarian, et al., 2020).
Other Validation factors were calculated to confirm in advantage the assessment of the models such as r2m' and Δ r2m' Eqs (8)–(9)
2.3.4 The applicability domain (AD)
The confidence of the QSAR model developed (CoMSIA/SH) implies the reliability in the predictions of the new SARS-CoV 3CLpro inhibitors according to the domain of applicability (Roy et al., 2015). The model predictions should be considered suitable only for molecules within this domain of applicability, hence the importance of studying the AD. The domain of applicability was constructed by calculating the leverage effect (hi) for each molecule on the basis of standardized residues, by applying the following formula Eq (10):
Were:
xi: is the vector representing the k model parameters of the molecule under study.
X: is the n × k matrix containing the model parameters for each of the n training molecules.
A significant leverage value must be greater than 3(k + 1)/n (Tabti et al., 2024).
2.4 Molecular docking study
Molecular docking approach is a powerful study that has been employed to understand the key structural requirements and to analyze the principal ligand-receptor interactions (Abchir et al., 2022). The crystal structure of the SARS-CoV 3CLpro was selected from Protein Data Bank (PDB ID: 1WOF) with a resolution of 2.00 Å (https://www.rcsb.org/). In order to assess ligand-receptor interactions, all proposed ligands, and the reference compound (Remdesivir) were docked to the selected protein target. Before starting the docking procedure, it was necessary to pre-treat the protein and minimize the ligands: protein preparation was carried out using the “Protein preparation wizard” module, by adding hydrogens, removing water molecules and applying the Epik method (Sarker et al., 2023). Ligands were optimized in the “LigPrep” module, retaining the default parameters. Docking was performed for ligands and receptors prepared with grids generated using XP docking precision, and binding energy was represented in kcal/mol (Indu et al., 2021). The visualization of the results was performed using Discovery Studio 2021 software. In order to determine the key active site residues contributing to the inhibition of SARS-CoV 3CLpro activity of dipeptide studies, we used the online server Protein Contact Atlas (https://www.mrc-lmb.cam.ac.uk/pca/). The number of contacts formed by the residues with the ligand is proportional to the size of the circular nodes. For the selected protein, the key amino acids forming the active site interact with a significant number of atomic contacts with the co-crystallized ligand are: Thr-25, Thr-26, His-41, Met-49, Tyr-54, Asn-142, Phe-140, Leu-141, Gly-143, Ser-144, Cys-145, His-163, His-164, Met-165, Glu-166, Pro-168, His-172, Gln-189 and Thr-190 as shown in Fig. 3.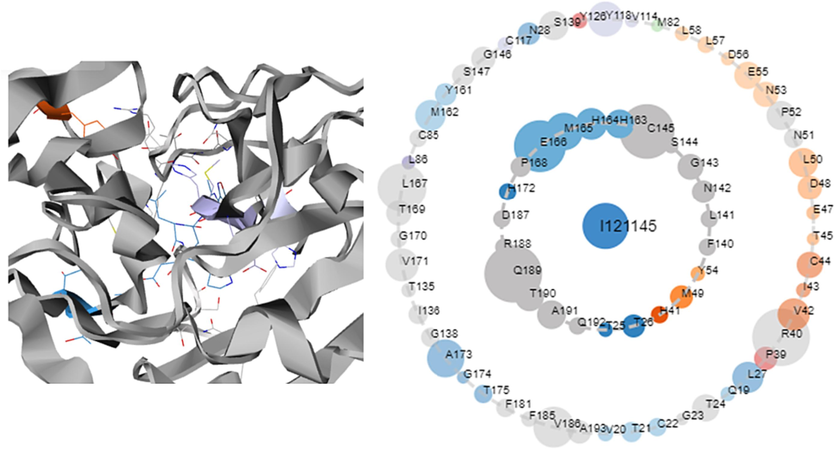
Co-crystallized structure of SARS-CoV 3CLpro (PDB ID:1WOF). The Residues forming the inner ring have immediate contact with the ligand, while residues forming the outer ring have indirect contact with the ligand.
2.5 Molecular dynamic simulations and binding free energy
Based on the energy binding values, two newly designed compounds (M−4 and M−5) were selected for molecular dynamics analysis using GROMACS 2020.6 software (Ouassaf et al., 2022). Initial input parameters were generated using the CHARMM-GUI web server implementing the CHARMM36 force field (Belhassan et al., 2021). The system was solvated in a rectangular grid, containing TIP3P water molecules and counterions (Na+; Cl-) were added to maintain a salt concentration of 0.15 M by Monte Carlo ion displacement (Oubahmane et al., 2023). Energy minimization for each complex was carried out using the steepest descent algorithm with a maximum of 50.000 steps and a maximum force of 10.0 KJ/mol. All complexes were equilibrated for NVT (constant number of atoms, volume and temperature) and isothermal-isobaric NPT (constant number of atoms, pressure and temperature). Temperature and pressure values were set at 300 K and 1.01325 bar, respectively (Oubahmane et al., 2021). The MD simulation was performed for 100 ns. The root-mean-square deviation (RMSD), root-mean-square flexibility (RMSF) and radius of gyration (Rg) were determined to judge the structural stability of the newly designed molecules (Valdés-tresanco et al., n.d.). The determination of the binding free energies of the systems ligands-protein were calculated using gmx-mmgbsa package(Tabti et al., 2023). MM-GBSA method composed of both molecular mechanics energy and implicit solvation models. The binding free energy comprises vacuum molecular mechanics potential bond energy and unbound (EMM), polar (Gpolar) and non-polar interactions (Gnon-polar) solvation energy (Tabti et al., 2022b). The binding free energy was calculated using the following formula (Eq11):
2.6 In silico pharmacokinetics ADMET study
Computer tools remain a reasonable choice in the research and development of new drug candidates, since they have improved the success rate and minimized the number of experimental studies. Newly developed molecules must meet certain criteria to become ideal drug candidates (Liman et al., 2022). Therefore, these compounds were tested in-silico for their pharmacokinetic parameters used ADMET server to predict the Absorption, Distribution, Metabolism, Excretion and Toxicity properties (Zhang et al., 2022).
2.7 Retrosynthesis approach
To perform retrosynthesis planning, we used the Automated System for Knowledge-based Continuous Organic Synthesis (ASKCOS) program, this website is an open source accessible by the following link (https://askcos.mit.edu/). ASCKOS includes a one-step retrosynthesis module providing direct precursors of the target molecule, interactive pathway planning a allows manual combination of one-step retrosynthesis results, with the goal of obtaining a complete synthetic pathway by proposing the necessary conditions for the realization of synthesis, while the Tree-Builder module automatically generates a multi-step retrosynthesis (Coley et al., 2019).
3 Results and discussions
3.1 CoMFA and CoMSIA results
For establishing of various 3D-QSAR models, we used CoMFA method and eleven combinations of the CoMSIA fields. In order to judge the predictability and stability of the CoMFA and CoMSIA models constructed, two statistical parameters R2 and Q2 were used to confirm the internal validation of QSAR models. The values of these two factors for CoMFA and the various CoMSIA combinations are shown in Fig. 4 and the statistical results for all models obtained are shown in Table 1. These results revealing statistically important values and improve that the CoMSIA / SH is the optimal model, because this model showed a good value coefficient of determination with R2 = 0.887, a high value of cross-validation coefficient Q2 = 0.796 using sex optimal components and a good value of prediction coefficient in the test set with R2pred = 0.884. The optimal model is a combination of two fields: steric with 36 % and hydrophobic with 64 %. The correlation plots between experimental and predicted activity and residual values for the CoMSIA/SH model are shown in Fig. 5. The good correlation between predicted and experimental values was confirmed by the existence of most of the molecules in the database on or near the trend line in the optimal model, in addition to the low residual values. All the results of the CoMSIA/SH model demonstrated the applicability of this model for predicting the anti-SARS activity of the proposed new inhibitors.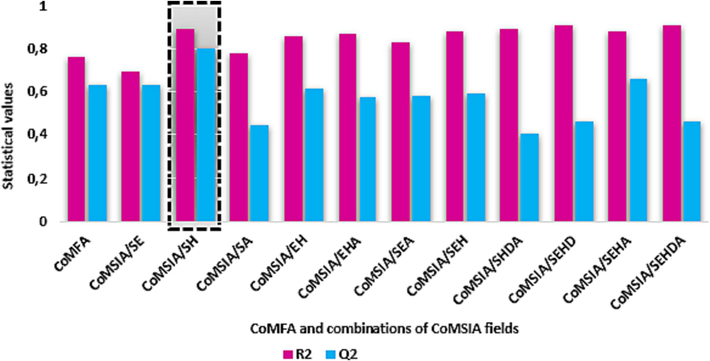
Distribution of R2 and Q2 values achieved by CoMFA and eleven combinations of CoMSIA fields.
3D-QSAR Models
R2
Q2
F
SEE
NOC
R2pred
Fraction
S
E
H
D
A
CoMFA
0.762
0.626
18.145
0.229
3
0.784
0.650
0.350
CoMSIA/SE
0.690
0.616
12.596
0.322
3
0.530
0.384
0.616
CoMSIA/SH
0.887
0.796
17.940
0.216
6
0.884
0.355
0.645
CoMSIA/SA
0.775
0.441
13.812
0.282
4
0.513
0.724
0.276
CoMSIA/EH
0.864
0.605
19.118
0.227
5
0.720
0.483
0.517
CoMSIA/EHA
0.867
0.573
19.479
0.225
5
0.764
0.415
0.466
0.119
CoMSIA/SEA
0.830
0.583
14.612
0.254
5
0.673
0.352
0.502
0.146
CoMSIA/SEH
0.879
0.691
21.825
0.214
5
0.800
0.215
0.396
0.389
CoMSIA/SHDA
0.890
0.403
18.926
0.211
6
0.731
0.253
0.441
0.209
0.097
CoMSIA/SEHD
0.905
0.459
22.116
0.197
6
0.791
0.171
0.293
0.330
0.206
CoMSIA/SEHA
0.881
0.658
22.205
0.212
5
0.805
0.204
0.340
0.357
0.099
CoMSIA/SEHDA
0.905
0.457
22.245
0.196
6
0.675
0.170
0.269
0.314
0.183
0.065
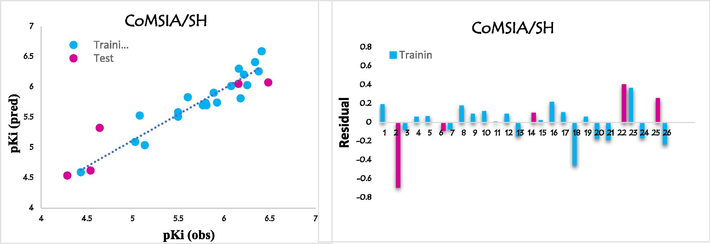
Plots showing correlation and residual between observed and predicted pKi values for CoMSIA/SH model.
3.1.1 Validation of CoMSIA/ SH model
The reliability and validity of the best model selected (CoMSIA/SH) was examined using external validation based on the Globraikh, Roy and Tropsha criteria, the results obtained were collected in Table 2 and compared to the threshold values reflecting the acceptability and reliability of the CoMSIA/SH Model.
Statistical parameter
Score
Threshold
Comment
r2pred
0.884
˃ 0.600
Passed
0.985
˃ 0.500
Passed
0.996
˃ 0.500
Passed
Δr02
−0.011
< 0.300
Passed
−0.115
< 0.100
Passed
−0.127
< 0.100
Passed
K
0.985
0.850 ≺ K ≺ 1.150
Passed
K′
1.010
0.850 ≺ K′ ≺ 1.150
Passed
rm2
0.602
˃ 0.500
Passed
rm
2
0.587
˃ 0.500
Passed
−0.015
< 0.200
Passed
3.1.2 Domain of applicability
To analyze the space of the CoMSIA/SH model constructed and to further validate this model, an applicability domain (AD) analysis was carried out based on the leverage approach, which relies on the variation of standardized residuals of the dependent variable as a function of leverage. As shown in the Williams diagram in Fig. 6 all observations have standardized residuals for a threshold value of ± 2, with the outlier X(h*) being 0.43. The model showed the absence of outliers, as none of the compounds lie outside the domain of applicability.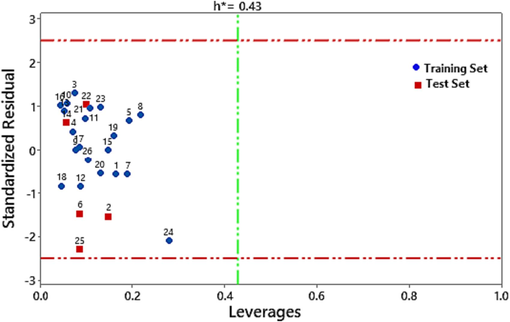
The Williams plot of the CoMSIA /SH model.
3.1.3 CoMSIA/SH graphical interpretations
One of the advantages of the 3D-QSAR method is the visualization of field effects on the biological activity studied, thanks to these contour maps it is possible to determine in the template compound the zones of 3D space in which the activity may decrease or increase. In order to design a powerful new inhibitor of SARS-CoV 3CLpro activity, it is essential to interpret the key results generated from the CoMSIA/SH contour maps. The steric and hydrophobic contour maps of the optimal CoMSIA/SH model are shown in Fig. 7. To extract the main structural features required for the inhibitory activity studied, a simplified illustration of the results generated from the two contour maps, steric and hydrophobic, is presented in Fig. 8.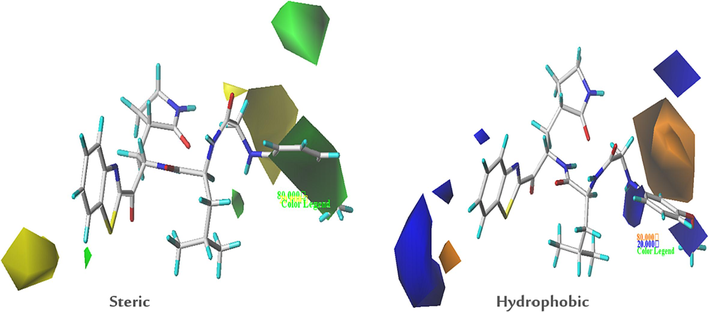
Steric and hydrophobic contour maps of the CoMSIA/SH analysis for compound-21.
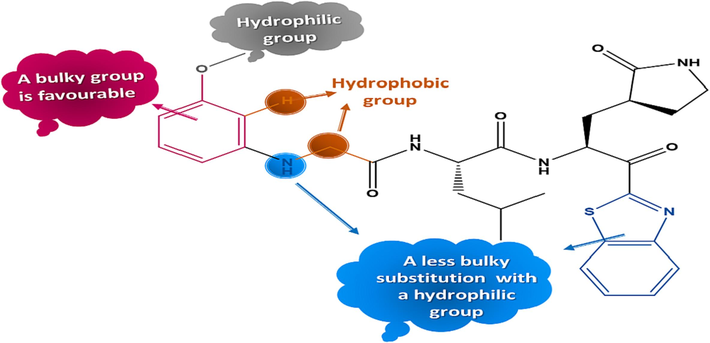
Structure-activity relationships generated from CoMSIA/SH contour maps.
All contours symbolize the default contribution rate of 80 % and 20 % for favored and disadvantaged regions respectively. For CoMSIA steric contour maps, the green contours represent the regions where bulky substituents are favorable. But the yellow contours show the voluminous regions substituents are unfavorable. A green contour covers the R2 substitution of compound-21, indicating that bulky substitutions are required in this region, while the yellow contour around the R3 substitution shows that small substitutions are favored to increase activity in this region. The hydrophobic interactions of CoMSIA are characterized by the orange contours which represents regions of increased activity with hydrophobic substitutions, and the blue contour which hydrophilic groups are favored. The presence of one large orange contour in the ortho position of the substitution R2 indicates that the hydrophobic substitution is required in this region, while two small contours in bleu are present in the group OCH3 on position metha and in the nitrogen atom of the substitution R2 indicated the hydrophilic substitutions are favored in these positions.
3.2 Design of new inhibitors
The results extracted from the steric and hydrophobic contour maps were exploited to design the new agents anti-SARS. The chemical structure of seven new inhibitors and their predicted activity values are listed in Table 3. The new inhibitors were aligned with the starting database using compound-21 as a template. In general, all the proposed new inhibitors show potent predicted activity (pKi > 6.481), and are therefore considered to be good inhibitors.
Molecule
Chemical structure
pKi(pred)
Compound-21
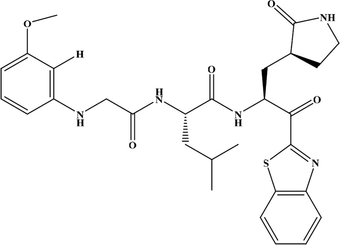
6.409
M−1
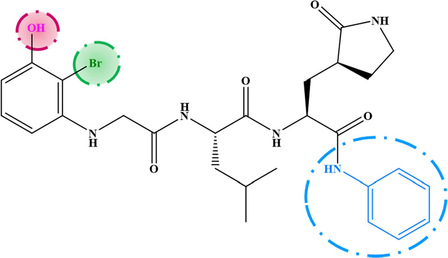
7.080
M−2
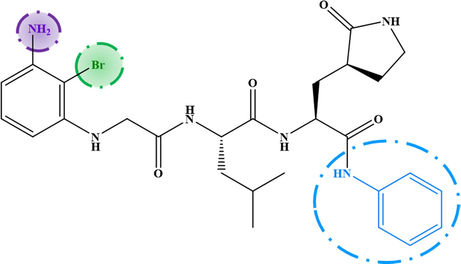
6.993
M−3
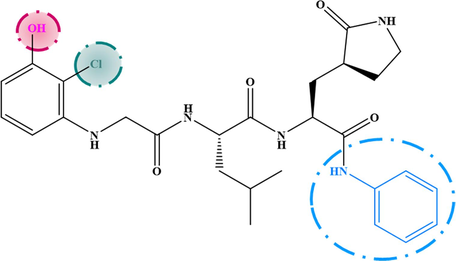
6.912
M−4
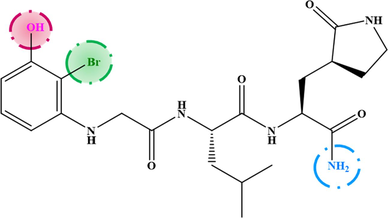
6.800
M−5
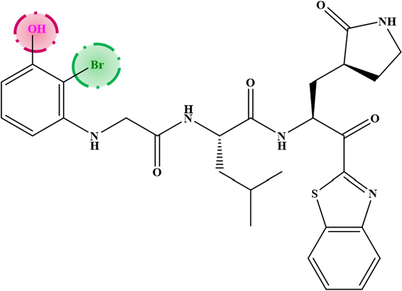
6.690
M−6
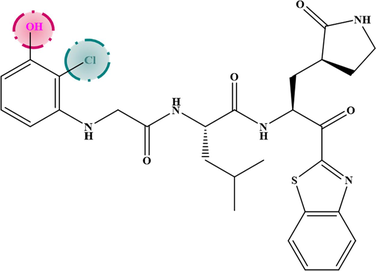
6.605
M−7
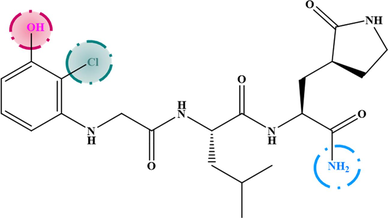
6.496
3.3 Molecular docking results
The principal raison to realize the docking study is to determine the type of interactions and to calculate the binding affinity of the newly developed compounds into the receptor binding site. The seven newly designed compounds were evaluated for their affinity against the SARS-CoV 3CLpro (PDB: 1WOF) by comparing its binding mode and affinity at the receptor with the reference compound (Remdesivir).
The validation of the docking protocol was verified using the re-docking technique by calculating the root means square deviation value using Discovery Studio software. The low value of root means square deviation (RMSD = 0.382 A°) shown in Fig. 9 demonstrated the reliability of the molecular docking performed to predict the active site. The results of molecular docking are presented in Table 4.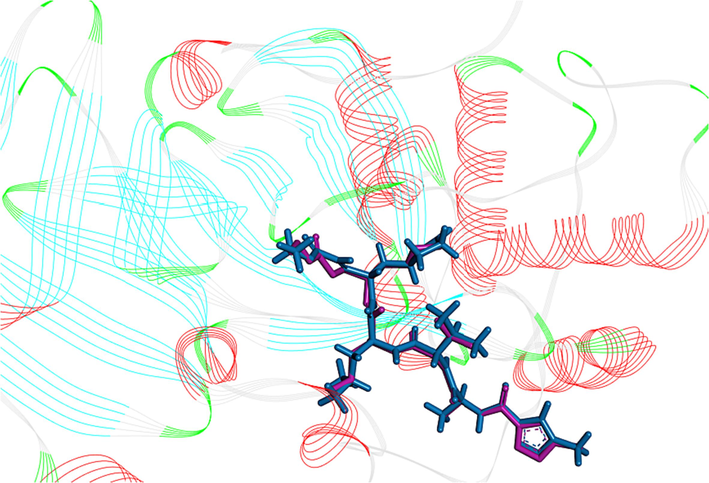
3D visualization of re-docking pose with RMSD value of 0.382 A° original ligand = pink, docked ligand = bleu).
Ligands
Glide GScore Kcal/mol
Glide Emodel
H-bonds interaction
Others
Conventional
Non-conventional
M−1
−9.406
−116.964
Phe-140 (2.20 A°)
Gly-143 (1.90 A°)
His-163 (1.87 A°) Glu-166 (1.94 A°) Glu-166 (2.14 A°)
Gln-189 (2.66 A°)
Thr-190 (1.90 A°)Asn-142 (2.72 A°)
Asn-142 (3.06 A°)
His-164 (2.67 A°)
Glu-166 (2.44 A°)Pro-168 (5.11 A°)
His-41 (4.39 A°)
Met-49 (5.29 A°)
Met-165 (4.63 A°)
Cys-145 (5.88 A°)
M−2
−9.208
−116.991
Phe-140 (2.19 A°)
Gly-143 (1.90 A°)
His-163 (1.85 A°) Glu-166 (1.92 A°) Glu-166 (2.00 A°)
Gln-189 (2.60 A°)
Thr-190 (1.98 A°)Asn-142 (2.74 A°)
Asn-142 (3.02 A°)
His-164 (2.98 A°)Pro-168 (4.90 A°)
Leu-167 (5.21 A°)
Met-165 (4.69 A°)
Met-165 (4.70 A°)
Met-49 (5.12 A°)
Met-49 (5.37 A°)
M−3
−9.339
−119.261
Phe-140 (2.23 A°)
Gly-143 (1.94 A°)
Ser-144 (2.43 A°)
His-163 (1.85 A°) Glu-166 (1.87 A°) Glu-166 (2.09 A°)
Gln-189 (2.46 A°)
Thr-190 (2.18 A°)Asn-142 (2.73 A°)
Asn-142 (3.01 A°)
Asn-142 (3.04 A°)
Glu-166 (2.43 A°)Pro-168 (4.75 A°)
His-41 (4.42 A°)
Met-49 (5.22 A°)
Met-165 (4.64 A°)
Met-49 (5.24 A°)
M−4
−9.727
−96.897
Gly-143 (1.83 A°)
Gly-143 (2.26 A°)
Cys-145 (2.70 A°)
Thr-26 (2.46A°) Glu-166 (1.76 A°) Glu-166 (1.93 A°)
Gln-189 (2.00 A°)
Thr-190 (1.75 A°)Met-165 (2.79 A°)
His-164 (2.59 A°)
Thr-26 (2.92 A°)Met-165 (3.56 A°)
Met-49 (4.43 A°)
Leu-167 (4.86 A°)
Pro-168 (5.08 A°)
M−5
−10.022
−114.159
Gly-143 (2.37A°)
Gly-143 (2.52 A°)
His-163 (1.77 A°)
Glu-166 (1.81 A°) Glu-166 (2.58 A°)
Glu-166 (1.36 A°)
Gln-189 (2.31 A°)
Thr-190 (1.69 A°)
Phe-140 (2.65 A°)Glu-166 (2.58 A°)
Cys-145 (5.34 A°)
Met-49 (4.89 A°)
Met-165 (4.92 A°)
Pro-168 (4. 60A°)
M−6
−9.664
−112.648
Gly-143 (1.88 A°)
Ser-144 (3.07A°)
His-163 (1.84 A°)
Glu-166 (1.88 A°) Glu-166 (2.13 A°)
Gln-189 (2.66 A°)
Thr-190 (2.42 A°)
Phe-140 (2.18 A°)Asn-142 (2.78 A°)
Asn-142 (3.08 A°)
His-164 (2.62 A°)
Glu-166 (2.31 A°)Cys-145 (5.59 A°)
Met-49 (3.54A°)
Met-49 (5.36A°)
Met-165 (4.60 A°)
Pro-168 (5.19A°)
His-41 (4.30A°)
M−7
−9.201
−87.522
Gly-143 (1.98 A°)
His-163 (1.92 A°)
Glu-166 (1.84 A°) Glu-166 (2.17 A°)
Gln-189 (2.36 A°)
Thr-190 (1.76 A°)
Phe-140 (2.29A°)Asn-142 (2.70 A°)
Asn-142 (3.03 A°)
Glu-166 (2.57 A°)Met-49 (5.39A°)
Met-165 (4.52 A°)
Pro-168 (4.60A°)
His-41 (4.40A°)
His-41 (2.73A°)
Remdesivir
−8.144
−87.822
Gly-143 (1.83 A°)
Cys-145 (2.70 A°)
Glu-166 (1.97 A°) Thr-26 (2.81 A°)
His-41 (2.64 A°)Asn-142 (2.70 A°)
Asn-142 (2.26 A°)
Asn-142 (2.67 A°)
Thr-26 (2.32 A°)
Met-165 (2.72 A°)Met-49 (5.26A°)
Met-165 (4.36A°)
Met-165 (4.45A°)
Pro-168 (4.04A°)
His-41 (5.13A°)
Leu-167 (4.96A°)
Leu-167 (5.50A°)
The analysis of the molecular docking results showed that all the newly designed compounds exhibited higher affinities than the control compound Remdesivir (-8.144 kcal/mol). These compounds revealed significant docking scores, particularly for compounds M−5 and M−4 with score values of −10.022 kcal/mol and −9.727 kcal/mol respectively. The results obtained show that the residues interacting most frequently with the new compounds designed and the Remdesivir are: Thr-26, His-41, Phe-140, Asn-142, Gly-143, Ser-144, Cys-145, His-163, Glu-166, Pro-168, Gln-189 and Thr-190. The visualization of the 3D-interactions results between the newly proposed molecules M−4, M−5 and the control compound (Remdesivir) in the SARS CoV 3CLpro is shown in Fig. 10. Molecule M−5 showed the formation of a greater number of conventional hydrogen bonds (nine bonds) with the following amino acid residues: Gly-143 (2.37 A°), Gly-143 (2.52 A°), His-163 (1.77 A°), Glu-166 (1.81 A°), Glu-166 (2.58 A°), Glu-166 (1.36 A°), Gln-189 (2.31 A°), Thr-190 (1.69 A°) and Phe-140 (2.65 A°), in addition to one non-classical hydrogen bond with residue Glu-166 (2.58 A°), and the presence of four hydrophobic interaction bonds were formed with residues Cys-145 (5.34 A°), Met-49 (4.89 A°), Met-165 (4.92 A°) and Pro-168 (4.60 A°).These results demonstrate the correct positioning of these compounds in the receptor's active site.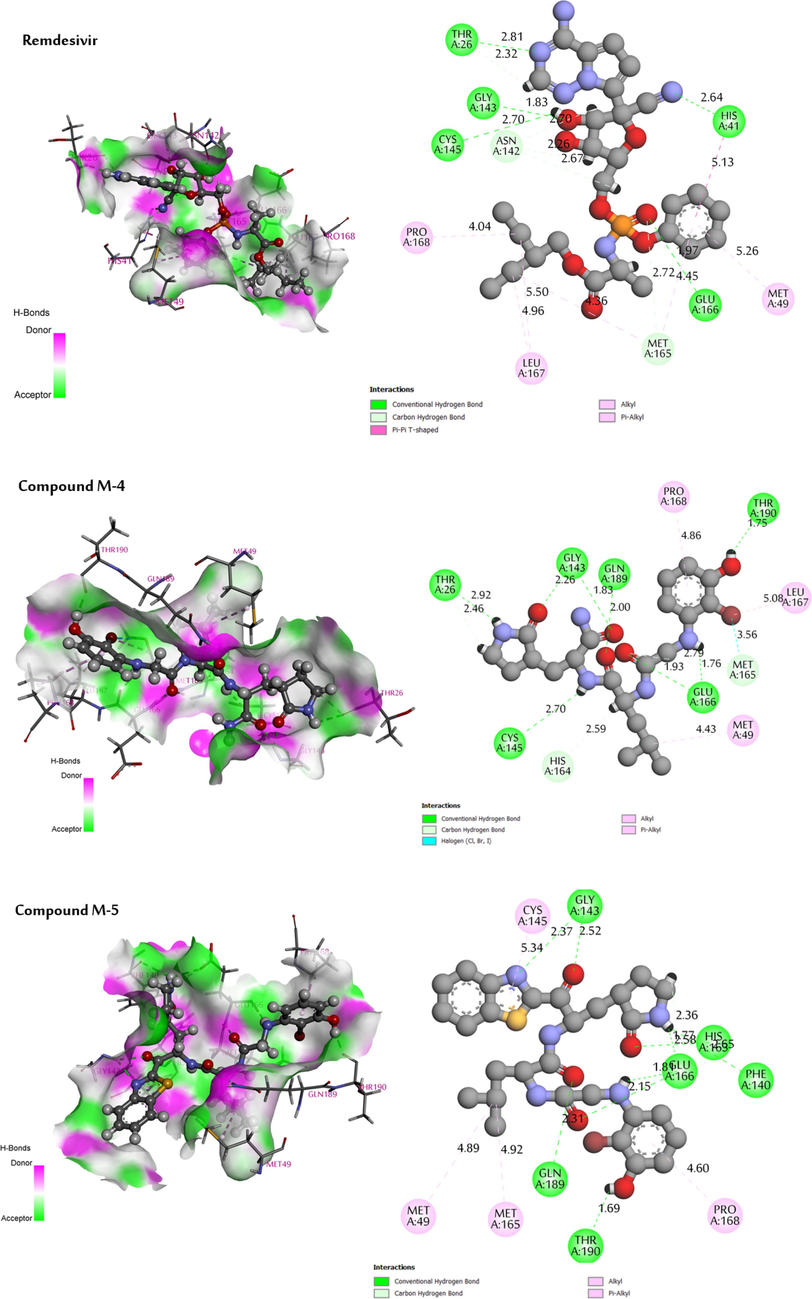
3D visualisation of docking results of compounds (M−4, M−5 and Remdesivir) in the site active of the protein (PDB ID: 1WOF).
3.4 ADMET prediction
In order to validate the behavior of new design molecules to be good drug candidates, a study of the pharmacokinetic properties of the newly developed molecules and the compound of control (Remdesivir) was carried out using online tool pkCSM. The results of the ADME properties and toxicity profile obtained are presented in Tables 5 and 6 respectively. The low absorbance is expressed as an absorbance value less than 30 %. However, all new compounds show a value above 51 %. Therefore, these compounds indicate good absorbance in the human intestine. A good value of BBB permeability must be higher than 0.3 and poor if it is lower than 0.1, regarding the index of CNS permeability, a compound is considered able to penetrate the CNS if it has a value higher than −2, and unable to penetrate the CNS if the LogPS values are lower than −3 (Jovanović et al., 2021), while all compounds proposed as well as Remdesivir have a bad BBB permeability and are difficult to move in the CNS. With the exception of Remdesivir, all compounds tested were not found to be CYP 2D6 substrates. The compounds M−1, M−2, M−5 and M−6 were found to be CYP 3A4 substrates. All compounds proposed as well as the Remdesivir were not observed to inhibit CYP A12, CYP 2C1, CYP 2C9 and CYP 2D6. Only molecule M−7 and Remdesivir were found to inhibit CYP 3A4. The values of clearance are generally low for all molecules. The toxicity profile presented in Table 6 shows a negative result in the AMES test, so all the newly designed compounds are not mutagenic. In addition, the newly compounds recorded various values (MTD) ranging from 0.060 log mg/kg/day (compound M−1) to 0.516 log mg/kg/day (compound M−7). Acute toxicity (LD50) values for the molecules tested ranged from 1,767 mol/kg (compound M−7) to 3,306 mol/kg (compound M−3). All compounds tested showed a higher chronic toxicity value (LOAEL) than Remdesivir (1,639 mg/kg body weight/day). TP toxicity values were all close to those of the control compound. Based on the results of the ADMET study, the new molecules designed present the goods anti-SARS inhibitors.
Adsorption
Distribution
Metabolism
Excretion
Substrate
Inhibitor
Intestinal absorption (human)
VDss (human)
BBB permeability
CNS permeability
CYP
2D6
3A4
1A2
2C19
2C9
2D6
3A4
Total tolerance
N
Numeric (%absorbed)
Numeric (logL kg_1)
Numeric (log BB)
Numeric (log PS)
Categorical (yes/no)
Numeric (log mL min_1 kg_1)
M−1
61.058
−0.151
−1.261
−3.333
No
Yes
No
No
No
No
Yes
0.318
M−2
57.157
−0.151
−1.135
−3.314
No
Yes
No
No
No
No
Yes
0.432
M−3
61.150
0.094
−1.094
−3.320
No
No
No
No
No
No
Yes
0.189
M−4
52.560
−0.692
−1.256
−3.834
No
No
No
No
No
No
Yes
0.276
M−5
71.164
0.020
−1.682
−3. 756
No
Yes
No
No
No
No
Yes
0.012
M−6
71.427
0.010
−1.662
−3.770
No
Yes
No
No
No
No
Yes
0.109
M−7
52.824
−0.697
−1.236
−3.387
No
No
No
No
No
No
No
0.155
Remdesivir
71.109
0.307
−2.056
−4.675
Yes
No
No
No
No
No
No
0.198
Compound
AMES
Max Tolerated Dose (Human) (MTD)
Oral Rate Acute Toxicity (LD50)
Oral Rat Chronic Toxicity (LOAEL)
Toxicity: T. Pyriformis (TP. Toxicity)
Categorical Yes/No
Numerical (log mg/kg/day)
Numeric (mol/kg)
Numeric (log mg/kg /day)
Numeric (log ug/L)
M−1
No
0.060
3.202
3.050
0.287
M−2
No
0.432
2.846
2.934
0.286
M−3
No
0.163
3.306
2.231
0.291
M−4
No
0.503
1.779
2.883
0.288
M−5
No
0.220
3.221
2.999
0.287
M−6
No
0.225
3.216
3.005
0.287
M−7
No
0.516
1.767
2.890
0.288
Remdesivir
No
0.150
2.043
1.639
0.285
3.5 Molecular dynamic simulations
Molecular dynamics simulations (MDs) were employed to evaluate the stability of complexes between ligands and proteins, along with determining the binding affinity of ligands. The investigation involved computing various metrics, including Root Mean Standard Deviation (RMSD), Root Mean Square Fluctuation (RMSF), Radius of Gyration (Rg), Solvent Accessible Surface Area (SASA), and Hydrogen Bond.
In this study, three complexes were subjected to MD analysis over 100 ns. The RMSF, RMSD, Rg and SASA results for two newly designed molecules, M−4 and M−5, as well as for the reference compound Remdesivir, are shown in Table 7 and Fig. 11.
Systems
RMSD (nm)
RMSF (nm)
Rg (nm)
SASA (nm2)
Apo
0.196
0.115
2.203
150.050
Complex Remdesivir
0.236
0.127
2.214
151.670
Complex M−4
0.206
0.118
2.213
153.250
Complex M−5
0.185
0.112
2.211
153.110
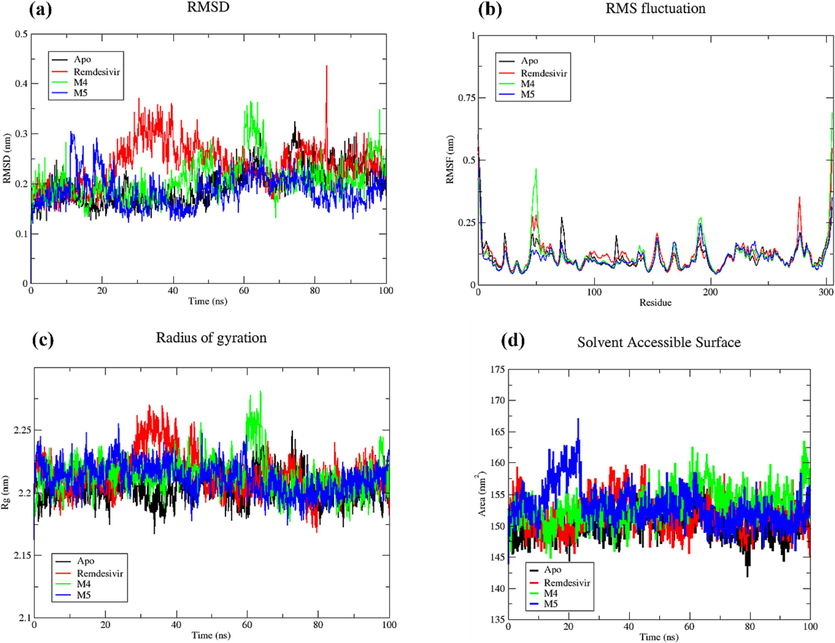
(a). RMSD. (b). RMSF. (c) Plot of Rg vs. time. (d) SASA profile, for Mpro-apo, Remdesivir complex, M−4 complex and M−5 complex.
3.5.1 Root means standard derivation RMSD
RMSD functions as a measure indicating how much a protein's backbone deviates from its initial to final conformation during simulation, offering insights into the structural stability of the protein. A protein that maintains stability will demonstrate minimal backbone deviation, while a less stable protein will exhibit greater deviation. The Evaluation of the MDs results (depicted in the Fig. 11 and Table 7) reveals that the overall average RMSD values for apo, Remdesivir complex, M−4 complex, and M−5 complex are 0.196, 0.236, 0.206, and 0.185 nm, respectively. The lowest average RMSD value suggests that the complexes M−4 and M−5 exhibit greater stability compared to SARS-CoV 3CLpro bound to the approved drug Remdesivir.
3.5.2 Root means square fluctuation (RMSF)
The analysis of Root Mean Square Fluctuation (RMSF) is instrumental in identifying flexible regions within protein–ligand complexes. Regions characterized by lower organization, such as loops and turns, typically exhibit higher RMSF values, while more structured segments like alpha helices and beta sheets demonstrate lower fluctuations. It's important to note that our RMSF analysis considered C-alpha atoms throughout the entire simulation for both the complexes and the apo form of SARS-CoV 3CLpro. To gauge the flexibility of the designed compounds binding to 3CLpro, the RMSF values from the 3CLpro-Remdesivir complex were utilized as a baseline. The average RMSF values for apo, Remdesivir-complex, M−4 complex, and M−5 complex were 0.115, 0.127, 0.118, and 0.112 nm, respectively. Notably, M−5 complex exhibited the lowest RMSF, aligning with the RMSD results. Additionally, M−4 complex displayed a lower RMSF than Remdesivir complex, suggesting that M−4, much like M−5, could potentially act as an inhibitor at 3CLpro catalytic site.
3.5.3 Radius of gyration (Rg)
Rg serves as an indicator of the protein structure's compactness, and it is used to assess changes induced by ligand binding by comparing Rg values before and after the binding process. The lesser the radius of gyration value, the higher the compactness of the protein. The Rg plot for apo, Remdesivir-complex, M−4 complex, and M−5 revealed average Rg values of 2.203, 2.214, 2.213, and 2.211 nm, respectively. Notably, the complexes M−4 and M−5 displayed Rg values that were similar or slightly lower than the 3CLpro bound to Remdesivir, suggesting that these compounds result in a more tightly packed protein structure.
3.5.4 Solvent accessible surface area (SASA)
Solvent Accessible Surface Area (SASA) represents the surface area of a protein that interacts with its solvent molecules. It measures the portion of a protein's surface accessible to solvent molecules. The SASA values for the apo, Remdesivir complex, M−4 complex, and M−5 complex are 150.05 nm2, 151.67 nm2, 153.25 nm2, and 153.11 nm2, respectively. The apo structure reflects the inherent solvent accessibility, while the slight increase in SASA in Remdesivir complex suggests changes upon ligand binding. Complex M−4 and Complex M−5 exhibit higher SASA values, implying alterations in the protein's surface accessibility, potentially due to the binding of different ligands. These SASA variations provide insights into the dynamic nature of the protein, indicating structural adaptations and potential functional implications associated with specific ligand interactions.
3.5.5 Hydrogen bond analysis
Hydrogen bonding between a protein and compounds imparts directionality and specificity to interactions, constituting a crucial element in molecular recognition. In our molecular dynamics simulations (MDs), we delved into the crucial role of hydrogen bonding in stabilizing the interaction between compounds (Remdesivir, M−4, and M−5) and Mpro. Fig. 12 displayed the number of hydrogen bonds between protein and ligand formed during the 100 ns simulation. Based on the results obtained M−4 and M−5 complexes yielded up to 8 hydrogen bonds, while the approved drug Remdesivir rarely yielded up to 6 hydrogen bonds during the 100 ns simulation. It revealed that the top two hits interacted with the active site of the protein with higher stable than Remdesivir. M−5 complex exhibited continuous and stable hydrogen bond interactions, while M−4 complex experienced interruptions, notably with no hydrogen bonds formed within the timeframe of 60–100 ns. The findings suggest that M−5 demonstrates enhanced stability in its binding interaction with 3CLpro compared to M−4.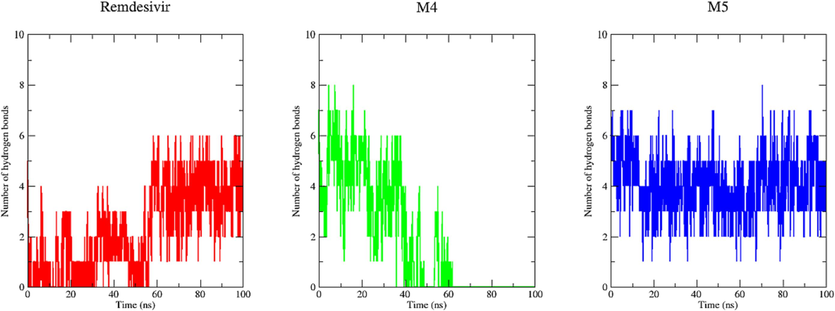
Hydrogen bonds analysis. The average number of hydrogen bonds between Remdesivir, M−4, and M−5 as a function of time. The values were presented during 100,000 ps (100 ns) MD simulations time scale. The red, green, and blue color represent values obtained for Remdesivir, M−4, and M−5 complexes respectively.
3.6 Free binding energy calculations
Concluding the analysis, we conducted MM-GBSA analysis to compute interaction energies throughout the entire molecular dynamics (MD) trajectory. The outcomes, presented in Table 8, reveal the binding free energies for Remdesivir complex, M−4 complex, and M−5 complex as − 16.860, −12.340, and − 38.200 kcal mol−1, respectively. The comparison of binding free energies indicates that complex M−5 exhibits significantly lower energy, suggesting a more favorable and stronger binding than Remdesivir complex. Furthermore, complex M−4 shows a higher binding free energy than compound of control (Remdesivir complex), indicating a less favorable binding affinity in comparison. These results provide valuable insights into the relative strengths of ligand binding, with complex M−5 appearing to be a promising candidate with enhanced binding efficiency compared to the approved drug Remdesivir.
Systems
ΔEvdw
ΔEele
ΔEGB
ΔEsurf
ΔGgas
ΔGsolv
Δtotal
Remdesivir complex
−41.320
−92.640
122.730
−5.630
−133.160
117.100
−16.860
M−4 complex
−18.000
−15.480
23.890
−2.760
−33.480
21.140
−12.340
M−5 complex
−46.780
−39.250
54.410
−6.580
−86.030
47.840
−38.200
3.7 Results of retrosynthesis analysis
ASKCOS is a free, fully automated program developed by Jensen's team at the Massachusetts Institute of Technology, containing approximately 11 million reactions obtained from the Reaxys database (Shen et al., 2021). This program was created with the objective of predicting the experimental conditions necessary for an organic reaction, where the reactants, solvents and catalysts are presented as one-shot vectors, while the temperature is considered as a continuous variable. In this program the reactants and products have been introduced by the use of Morgan's circular footprints, by the use of their SMILES system Fig. 13 (Shen et al., 2021).
Forward of neural network model implemented in ASKCOS retrosynthesis program followed in prediction of conditions.
ASKCOS includes several retrosynthesis modules such as the interactive planning module which allows to combine the results of one-step retrosynthesis into a complete synthesis path and the tree building module which automatically generates multi-step retrosynthesis plans.
In this study, both modules have been exploited for the prediction of efficient retrosynthesis plans of the target molecule (M−5).
3.7.1 Interactive path planning
In the case studied, the one-step retrosynthesis module allows to propose five promising retrosynthetic pathways to obtain the target molecule M−5. These one-step retrosynthetic routes have been ranked in order of priority from 1 to 5 Fig. 14, ASKCOS has proposed recommended experimental conditions such as reagents, solvents, temperature and catalyst if necessary for each of the reactions proposed by the one-step synthesis Fig. 15. According to the results given, the desired target represents the major product with a percentage higher than 99.98 %, which shows a high confidence in the proposed conditions Fig. 16.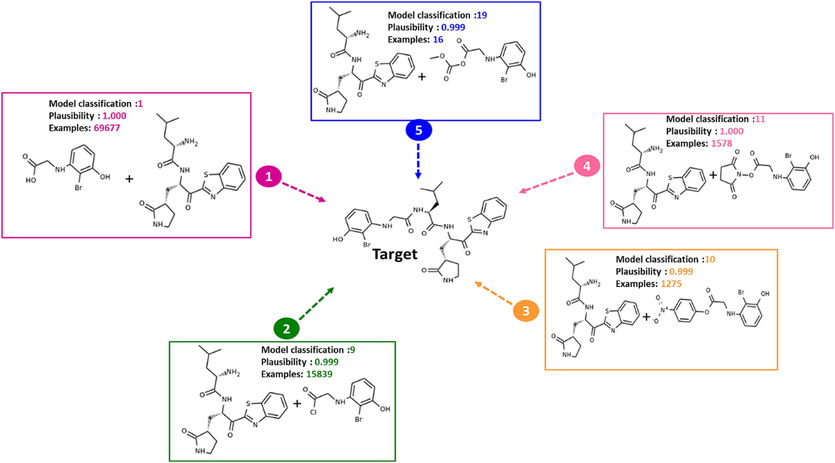
Results of one-step retrosynthesis prediction to obtain the target M−5 using the interactive path planning module implemented in ASKCOS.
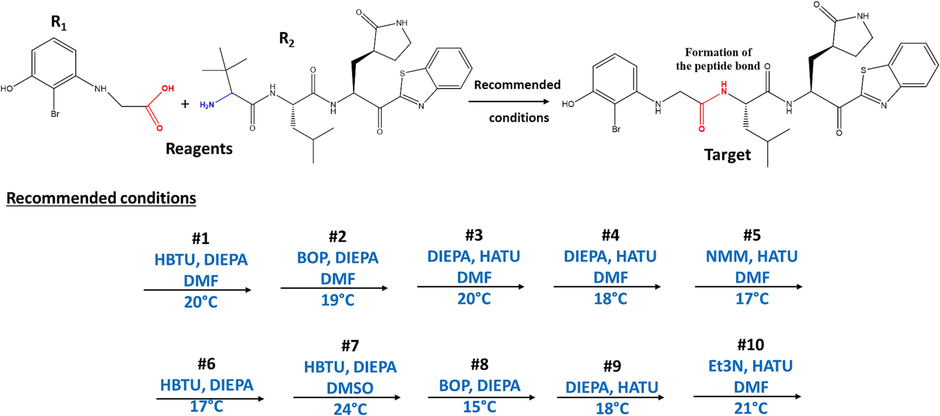
The 10 best conditions recommended for the reaction.
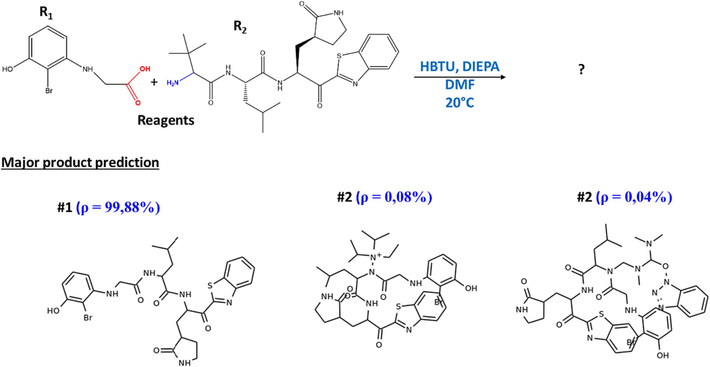
Prediction of the main product under the most recommended conditions.
3.7.2 Tree-Builder module
ASKCOS contains the Tree-Builder module which automatically generates multi-step retrosynthesis schemes, this module has proposed several synthesis trees for the target. The main purpose of this module is to decompose the target molecule (predicted Molecule M−5) step by step into commercially available compounds which have been marked with pink boxes or into simple precursors which can be easily synthesized which have been presented by blue boxes Fig. 17. this module proposes several synthetic routes presented, giving additional information on the commercial availability of the precursors used in the synthesis, and the number of precedents visible on hover.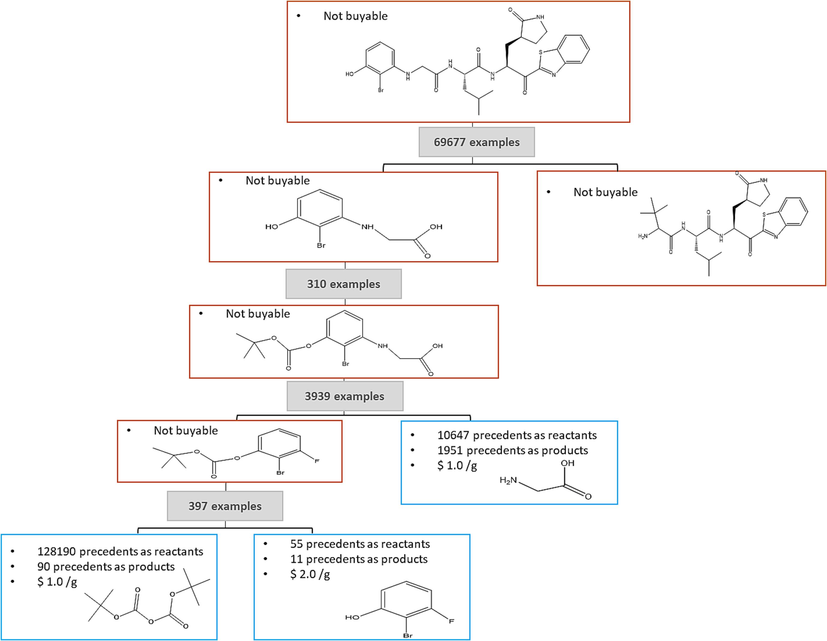
Proposed synthetic route for the target M−5 using the tree builder module implemented in ASKCOS.
4 Conclusion
The importance of this work lies in the design of seven new potent inhibitors of SARS-CoV 3CLpro by combining various in silico approaches: 3D-QSAR, molecular docking and molecular dynamics studies. The compounds developed showed an ADMET profile close to that of the reference drug Remdesivir. Overall, two newly designed compounds (M−4 and M−5) were shown to have significant inhibitory activity against 3CLpro, while also exhibiting significant conformational and structural stability and a favorable binding profile. Subsequently, a complete synthetic route was proposed for the M−5 molecule by applying computer-assisted resynthesis.
Declaration of competing interest
The authors declare that they have no known competing financial interests or personal relationships that could have appeared to influence the work reported in this paper.
References
- Design of novel benzimidazole derivatives as potential α-amylase inhibitors using QSAR, pharmacokinetics, molecular docking, and molecular dynamics simulation studies. J. Mol. Model.. 2022;28(4)
- [CrossRef] [Google Scholar]
- QSAR analysis of coumarin-based benzamides as histone deacetylase inhibitors using CoMFA, CoMSIA and HQSAR methods. J. Mol. Struct.. 2020;1199:126961
- [CrossRef] [Google Scholar]
- Investigation of pyrimidine analogues as xanthine oxidase inhibitors to treat of hyperuricemia and gout through combined QSAR techniques, molecular docking and molecular dynamics simulations. J. Taiwan Inst. Chem. Eng.. 2020;113:72-100.
- [CrossRef] [Google Scholar]
- Camphor, Artemisinin and Sumac Phytochemicals as inhibitors against COVID-19: Computational approach. Comput. Biol. Med.. 2021;136(August):104758
- [CrossRef] [Google Scholar]
- In silico detection of potential inhibitors from vitamins and their derivatives compounds against SARS-CoV-2 main protease by using molecular docking, molecular dynamic simulation and ADMET profiling. J. Mol. Struct.. 2022;1258:132652
- [CrossRef] [Google Scholar]
- Rational design of flavonoid based potential inhibitors targeting SARS-CoV 3CL protease for the treatment of COVID-19. J. Mol. Struct.. 2021;1237:130380
- [CrossRef] [Google Scholar]
- A robotic platform for flow synthesis of organic compounds informed by AI planning. Science. 2019;365(6453)
- [CrossRef] [Google Scholar]
- Epigallocatechin-3-gallate, an active ingredient of Traditional Chinese Medicines, inhibits the 3CLpro activity of SARS-CoV-2. Int. J. Biol. Macromol.. 2021;176:1-12.
- [CrossRef] [Google Scholar]
- 3D-QSAR study, docking molecular and simulation dynamic on series of benzimidazole derivatives as anti-cancer agents. J. Indian Chem. Soc.. 2022;99:100582
- [CrossRef] [Google Scholar]
- 3D-QSAR, molecular docking and ADMET studies of thioquinazolinone derivatives against breast cancer. J. Indian Chem. Soc.. 2022;99(10):100675
- [CrossRef] [Google Scholar]
- QSAR, molecular docking, ADMET properties in silico studies for a series of 7-propanamide benzoxaboroles as potent anti-cancer agents. Chin. J. Anal. Chem.. 2022;50(12):100163
- [CrossRef] [Google Scholar]
- 3D-QSAR, docking and ADMET properties of aurone analogues as antimalarial agents. Heliyon. 2020;6(4):e03580.
- [CrossRef] [Google Scholar]
- Https://covid19.who.int/. (n.d.). No Title.
- Antiviral activity of astragaloside II, astragaloside III and astragaloside IV compounds against dengue virus: Computational docking and in vitro studies. Microb. Pathog.. 2021;152(October 2020):104563
- [CrossRef] [Google Scholar]
- 3D-QSAR, molecular docking and in silico ADMET studies of propiophenone derivatives with anti-HIV-1 protease activity. Struct. Chem.. 2021;32(6):2341-2353.
- [CrossRef] [Google Scholar]
- Rational design of novel potential EGFR inhibitors by 3D-QSAR, molecular docking, molecular dynamics simulation, and pharmacokinetics studies. Chem. Data Collect.. 2022;39(March):100851
- [CrossRef] [Google Scholar]
- Monte Carlo method and GA-MLR-based QSAR modeling of NS5A inhibitors against the Hepatitis C Virus. Molecules. 2022;27(9)
- [CrossRef] [Google Scholar]
- Combined 3D-QSAR and molecular docking analysis of thienopyrimidine derivatives as Staphylococcus aureus inhibitors. Acta Chim. Slov.. 2021;68(2):289-303.
- [CrossRef] [Google Scholar]
- Combined molecular docking and dynamics simulations studies of natural compounds as potent inhibitors against SARS-CoV-2 main protease. J. Biomol. Struct. Dyn.. 2022;40(21):11264-11273.
- [CrossRef] [Google Scholar]
- COVID-19: In silico identification of potent α-ketoamide inhibitors targeting the main protease of the SARS-CoV-2. J. Mol. Struct.. 2021;1244:130897
- [CrossRef] [Google Scholar]
- Design of potent inhibitors targeting the main protease of SARS-CoV-2 using QSAR modeling, molecular docking, and molecular dynamics simulations. Pharmaceuticals. 2023;16(4)
- [CrossRef] [Google Scholar]
- Methoxy and methylthio-substituted trans-stilbene derivatives as CYP1B1 inhibitors – QSAR study with detailed interpretation of molecular descriptors. Arab. J. Chem.. 2022;15(11)
- [CrossRef] [Google Scholar]
- New developments for the design, synthesis and biological evaluation of potent SARS-CoV 3CLpro inhibitors. Bioorg. Med. Chem. Lett.. 2009;19(10):2722-2727.
- [CrossRef] [Google Scholar]
- On a simple approach for determining applicability domain of QSAR models. Chemom. Intel. Lab. Syst.. 2015;145:22-29.
- [CrossRef] [Google Scholar]
- Sarker, P., Mitro, A., Hoque, H., Hasan, M. N., & Nurnabi Azad Jewel, G. M. (2023). Identification of potential novel therapeutic drug target against Elizabethkingia anophelis by integrative pan and subtractive genomic analysis: An in silico approach. Computers in Biology and Medicine, 165(August), 107436. https://doi.org/10.1016/j.compbiomed.2023.107436.
- Automation and computer-assisted planning for chemical synthesis. Nat. Rev. Methods Primers. 2021;1(1)
- [CrossRef] [Google Scholar]
- Molecular docking, dynamics simulations and 3D-QSAR modeling of arylpiperazine derivatives of 3,5-dioxo-(2H,4H)-1,2,4-triazine as 5-HT 1A R agonists. Comput. Biol. Chem.. 2019;78(November 2018):108-115.
- [CrossRef] [Google Scholar]
- Novel antiproliferative inhibitors from salicylamide derivatives with dipeptide moieties using 3D-QSAR, molecular docking, molecular dynamic simulation and ADMET studies. J. Mol. Struct.. 2023;1282:135219
- [CrossRef] [Google Scholar]
- In silico design of novel PIN1 inhibitors by combined of 3D-QSAR, molecular docking, molecular dynamic simulation and ADMET studies. J. Mol. Struct.. 2022;1253:132291
- [CrossRef] [Google Scholar]
- Molecular modelling of antiproliferative inhibitors based on SMILES descriptors using Monte-Carlo method, docking, MD simulations and ADME/Tox studies. Mol. Simul.. 2022;48(17):1575-1591.
- [CrossRef] [Google Scholar]
- Computational exploration of the structural requirements of triazole derivatives as colchicine binding site inhibitors. ChemistrySelect. 2023;8:e202301707.
- [CrossRef] [Google Scholar]
- Computational assessment of the reactivity and pharmaceutical potential of novel triazole derivatives: An approach combining DFT calculations, molecular dynamics simulations, and molecular docking. Arab. J. Chem.. 2024;17(1):105376
- [CrossRef] [Google Scholar]
- Design, synthesis, and biological evaluation of novel dipeptide-type SARS-CoV 3CL protease inhibitors: Structure-activity relationship study. Eur. J. Med. Chem.. 2013;65:436-447.
- [CrossRef] [Google Scholar]
- Development of superior antibodies against the S-protein of SARS-Cov-2 using macrocyclic epitopes. Arab. J. Chem.. 2022;15(3):103631
- [CrossRef] [Google Scholar]
- V’kovski, P., Kratzel, A., Steiner, S., Stalder, H., & Thiel, V. (2021). Coronavirus biology and replication: implications for SARS-CoV-2. Nature Reviews Microbiology, 19(3), 155–170. https://doi.org/10.1038/s41579-020-00468-6.
- Valdés-tresanco, M. S., Valdés-tresanco, M. E., & Valiente, P. A. (n.d.). Supporting Information gmx_MMPBSA : a new tool aid to perform end-state free energy calculations with GROMACS files.
- Studies on the antibacterial activities and molecular mechanism of GyrB inhibitors by 3D-QSAR, molecular docking and molecular dynamics simulation. Arab. J. Chem.. 2022;15(6):103872
- [CrossRef] [Google Scholar]
- Zhang, M., Zhou, S., Obaid, N. H., Altimari, U. S., Adel Mohammed, M., Kareem Obaid Aldulaim, A., Salaam Abood, E., Kotb, H., Enayati, A., Khori, V., Mirzaei, H., Salehi, A., Soltani, A., Sani Sarjadi, M., & Lutfor Rahman, M. (2022). Chromenone-based GSK-3β inhibitors as potential therapeutic targets for cardiovascular diseases: In silico study, molecular dynamics, and ADMET profiles. Arabian Journal of Chemistry, 15(12), 104288. https://doi.org/10.1016/j.arabjc.2022.104288.


