

Translate this page into:
Designing of pH-responsive ketorolac tromethamine loaded hydrogels of alginic acid: Characterization, in-vitro and in-vivo evaluation
⁎Corresponding authors.at: 100 Shih-Chuan 1st Road, Kaohsiung City 80708, Taiwan (P-C. Wu) College of Pharmacy, University of Sargodha, Sargodha 40100, Pakistan (M.U. Minhas). us.minhas@hotmail.com (Muhammad Usman Minhas), pachwu@kmu.edu.tw (Pao-Chu Wu)
-
Received: ,
Accepted: ,
This article was originally published by Elsevier and was migrated to Scientific Scholar after the change of Publisher.
Peer review under responsibility of King Saud University.
Abstract
pH-responsive hydrogels based on alginic acid grafted with acrylic acid and ethylene glycol dimethylacrylate in the presence of ammonium persulfate were developed for controlled delivery of Ketorolac tromethamine. The alginic acid based hydrogels were prepared by free radical polymerization technique. Increase in gel fraction was observed with the increase in alginic acid, acrylic acid, and ethylene glycol dimethylacrylate content. The dynamic swelling and drug release studies were conducted at two different pH values (pH 1.2 and 7.4). Maximum swelling and drug release were observed at pH 7.4. The characterization of prepared hydrogels was carried out by using Fourier transform infrared spectroscopy, thermogravimetric analysis, differential scanning calorimetry, powder x-ray diffraction, and scanning electron microscopy. Similarly, in-vivo study was performed on rabbits and greater plasma drug concentration was achieved by fabricated hydrogels as compared to drug solution and commercial product Keten. Conclusively, the fabricated hydrogels can be considered as a potential candidate for controlled delivery of Ketorolac tromethamine.
Keywords
Hydrogels
Swelling study
Drug release

1 Introduction
Ketorolac tromethamine (KTMA) is one of the non-steroidal anti-inflammatory drugs (NSAIDs), which is used in the management of severe pain with low anti-inflammatory and high analgesic activity (Puglia et al., 2006; Wagh et al., 2019). KTMA is available in market as a tablet, injection, and drop or ophthalmic solution dosage form. Half-life of KTMA is ranged 3–4 h, thus dose of KTMA is required once, twice or multiple times in a day in order to keep the therapeutic level for extended period of time. But, multiple doses of KTMA generate certain complications such as gastrointestinal bleeding, gastrointestinal ulceration, perforation and peptic ulceration, and acute renal failure (Alsarra et al., 2005). So, a polymeric controlled drug delivery system is needed to prolong the release of KTMA and overwhelmed the complications associated with its frequent administration (Mathew et al., 2007). Hence, different strategies and drug delivery systems such as macro, micro, and nano-particulate system are used to overcome the side effects of the therapeutic agents by delivering them to the target site in a controlled way. Wagh. P., et al (2019) fabricated Ketorolac tromethamine loaded micro/nanospheres of ethyl cellulose for controlled release of drug up to 12 h (Wagh et al., 2019). Similarly, Patil Jayesh and his coworkers prepared chitosan based nanoparticles for delivery of Ketorolac tromethamine and reported sustained release of Ketorolac tromethamine up to 12hr (Patil et al., 2020). But, still problems are not solved. Therefore, the macro-particulate system such as hydrogel is considered to be the most suitable carrier system for controlled drug delivery due to its unique and diverse properties (Mamidi et al., 2021).
Hydrogels are three dimensional distinct polymeric networks. Hydrogels do not dissolve in water at any pH or physiological temperature after crosslinking. Hydrogels have an exceptional capability to hold a maximum amount of water. Due to high hydrophilicity and biocompatibility with the biological system, they are used for different purposes especially for targeting and controlled drug delivery systems. Beside this, hydrogels are also employed in localized and topical drug delivery and in cellular immobilization, tissue engineering, and diagnosis (Chai et al., 2017; Suhail et al., 2019). Currently, researchers have focused on stimuli-sensitive hydrogels as this type of hydrogels can show a good response to the external stimuli i.e., ionic strength, temperature, and pH. Furthermore, stimuli-sensitive hydrogels play a key role in tissue regeneration, gene, and drug delivery. pH sensitive hydrogels are considered the most studied hydrogels amongst stimuli sensitive hydrogels as they delivered the drug in a controlled manner in response to the pH of the medium (Mamidi et al., 2020).
All polymers of alginate (Alg) are natural and nontoxic in nature, which are used widely in the development of drug formulation due to their extensive application such as food additives. Recently different natural polymers such as chitosan, chondroitin sulfate and Alg etc are used in hydrogels based controlled drug delivery system. But due to unique properties, Alg can be considered as an ideal excipient to meet the demands of applicants in both pharmaceutical and biomedical fields (Tønnesen et al., 2002). Alg, a natural polysaccharide polymer is obtained from brown seaweed (Phaeophyceae). Alg is solubilized by an extracted dilute solution of alkaline with seaweed. The resulting viscous and thick mass when treated with mineral acid, free Alg is generated, which can be transferred to sodium alginate (a salt of Alg), employed in various pharmaceutical and biomedical areas. The linear Alg polymer is composed of D-mannuronic acid and L-guluronic acid residues that are organized in the polymer chain in a block shaped. Due to Alg hydration, a very viscous ‘‘acid gel’’ is produced. A greater quantity of water is hold physically by Alg matrix after gelation. The capillary forces enabled the gel to hold a greater amount of water. On other hand, thermo-stable gels can be prepared at room temperature (Draget et al., 1994; Wang et al., 1998). Acrylic acid (AcA), a pH-sensitive monomer plays an important role in controlled drug delivery systems. AcA is very sensitive due to the presence of carboxylic acid (–COOH). The ionic repulsion of anionic charged COOH groups results in high swelling and release of drug in basic medium. Due to pH responsive nature, drug is retained by loaded AcA hydrogels in acidic pH while greater drug is released in alkaline and basic medium. The toxicity of AcA is reported very low (Ijaz et al., 2018a).
Keeping in view the diverse properties of both Alg and AcA, we believed that fabricated hydrogels have the potential to sustain the release of KTMA for an extended period of time in a controlled manner. Alg is used particularly for the determination of drug release rate from different dosage form. Similarly, a very important role is played by AcA in oral drug delivery system. Due to the presence of carboxylic group, maximum swelling and drug release is observed at neutral pH values as compared to acidic pH values due to its pKa value (pKa value = 4). The combination of natural polymer Alg and AcA facilitates the developed hydrogel networks to release the maximum drug at high pH values. Hence, different concentrations of Alg, AcA, and EGDMA were employed for the development of hydrogels. Characterizations such as FTIR, PXRD, TGA, DSC, and SEM were conducted for the evaluation of structural properties of the fabricated hydrogels. Similarly, various studies such as dynamic swelling, polymer volume fraction, drug loading, sol–gel analysis, percent porosity, in-vitro drug release, and in-vivo studies on rabbits were investigated to assess the sustainability and compatibility of the formulated hydrogels.
2 Materials and methods
2.1 Materials
Alginic acid (Alg; M. weight = 10,000–600,000) was acquired from Across Organic, Janssen Pharmaceuticalaan, Belgium. Ketorolac tromethamine (KTMA) was procured from Symed Lab Limited (Telangana, India). Acrylic acid (AcA; M. weight = 72.06 g/mol) was purchased from ACROS, New Jersey, USA. Similarly, ethylene glycol dimethacrylate (EGDMA; M. weight = 198.22 g/mol) and ammonium persulfate (APS; M. weight = 228.21) were obtained from ALFA-AESAR, USA, and Showa, Tokyo, Japan.
2.2 Synthesis of hydrogels
A set of various formulations of alginic acid-graft-poly(acrylic acid) (Alg-g-PAcA) hydrogels was fabricated by the free radical polymerization technique as shown in Table 1. Different compositions of polymer Alg and monomer AcA were crosslinked by cross-linker EGDMA with altered composition in the presence of initiator APS. A specific amount of Alg was dissolved in 10 mL deionized distilled water. APS solution was formed by dissolving a fixed amount of APS in 1 mL deionized distilled water and poured into Alg solution. After proper mixing, AcA was added into the mixture of Alg and APS, and kept it on stirring for 25 min. Finally, EGDMA was added slowly into the mixture and kept it on stirring until a transparent solution was formed. The solution was purged by nitrogen gas to remove any dissolved oxygen, poured into glass molds and then placed in water bath at 55 °C initially for 2 h, and then increased the temperature up to 65 °C for the next 21 h. The prepared gel was cut into 8 mm discs, and washed by mixture of ethanol and water (70:30 v/v) to remove any entrapped impurity on the surface of the gel discs. The gel discs were placed at room temperature for 24 h and then placed in a vacuum oven at 40 °C till complete dehydration. The dried discs of hydrogel were evaluated for further studies. Proposed chemical structure of fabricated hydrogel is shown in Fig. 1A.
Formulation code
Polymer
Alg
g/100 gMonomer
AcA
g/100 gInitiator
APS
g/100 gCross-linker
EGDMA
g/100 g
P-1
0.30
25
0.5
0.50
P-2
0.65
25
0.5
0.50
P-3
1.00
25
0.5
0.50
P-4
1.00
20
0.5
0.50
P-5
1.00
25
0.5
0.50
P-6
1.00
30
0.5
0.50
P-7
1.00
25
0.5
0.50
P-8
1.00
25
0.5
0.75
P-9
1.00
25
0.5
1.00
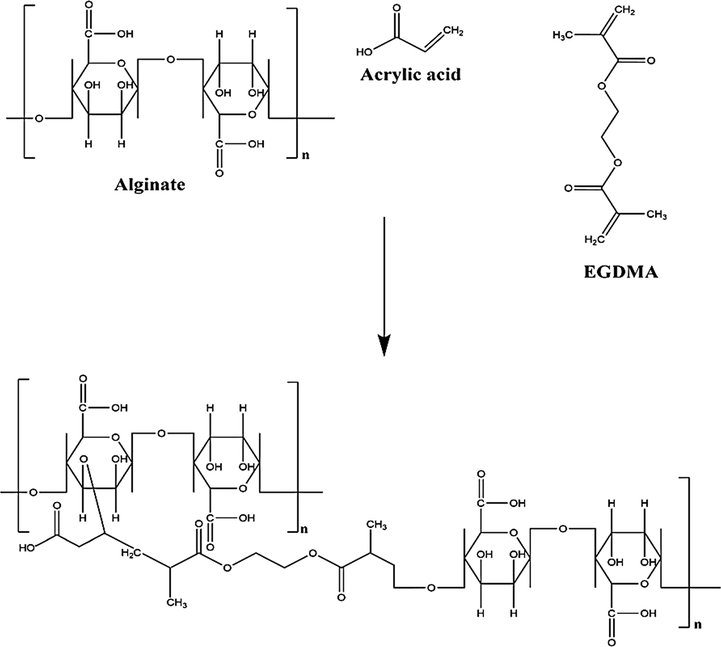
Proposed chemical structure of Alg-g-PAcA hydrogel.
2.3 Fourier transform infrared spectroscopy (FTIR) analysis
ATR (Attenuated total reflectance) was used for spectral analysis of Alg, AcA, unloaded Alg-g-PAcA hydrogels, KTMA, and drug loaded Alg-g-PAcA hydrogels. In order to detect any kind of possible interaction among the polymer, monomers, drug, and the developed hydrogels, spectral matching approach was employed. Both unloaded and drug loaded samples were grounded and passed through the mesh 40 to obtain particles of uniform size. All the samples were then analyzed by using Nicolet 380 FTIR (Thermo Fisher Scientific, Ishioka, Japan) within range of 500–4000 cm−1. Number of scans was kept 8 while resolution was maintained 4 cm−1 during the experiment (Suhail et al., 2021).
2.4 Sol-gel content
Sol-gel content was determined for all formulations of Alg-g-PAcA hydrogels by the Soxhlet extraction technique. Dried, unwashed weighed hydrogel discs were placed in 50 mL boiling distilled water at 85 °C for 10 h. Later, the discs of hydrogel were removed and placed in vacuum oven at 40 °C for dehydration. The dried discs of hydrogel were weighed again (Rafique et al., 2021). The given equations were used for the determination of percent sol–gel content.
W1 represents the initial weight of hydrogel discs, and W2 indicates the final weight of dried hydrogel discs.
2.5 Dynamic swelling
Dynamic swelling was carried out for the purpose to determine the fluid imbibing capacity of the developed hydrogels at both acidic (pH 1.2) and basic (pH 7.4) medium at 37 °C. Hence, weighed dried discs of hydrogel were dipped in 100 mL buffer solution of pH 1.2 and 7.4, respectively. After predetermined time intervals, the discs were removed and wiped with filter paper superficially and weighed again. This process was continued until an equilibrium weight was achieved (Zahra et al., 2021). This study was performed in a triplicate. The given equations were used for the estimation of dynamic and equilibrium swelling.
2.6 Polymer volume fraction
Polymer volume fraction was performed to determine the fraction of polymers of the developed hydrogels in the swelled state at both pH 1.2 and 7.4 respectively. It is represented by V2. Hence, equilibrium volume swelling (Veq) data was used for the determination of polymer volume fraction (Badshah et al., 2021). Given equation was used for the determination of polymer volume fraction;
2.7 Percent porosity
Percent porosity was conducted for the fabricated hydrogels to know their porosity because formulations of various compositions have different percent porosity. Hence, solvent replacement method was adopted for the determination of porosity of the formulated hydrogels. Weighed quantities of dried discs of hydrogel (Z1) were immersed in absolute ethanol (purity greater than 99.9%) for 4 days. After that, discs of hydrogels were removed, wiped with filter paper, and weighed again (Z2). Likewise, thickness and diameter of the hydrogel discs were measured. Percent porosity was carried out three times for the fabricated hydrogels. Given equation was used for percent porosity determination (Ijaz et al., 2018b).
ρ represents the density of absolute ethanol, while V indicates the volume of hydrogel discs after swelling.
2.8 Thermal analysis
Thermal analysis was performed to evaluate the thermal stabilities of Alg and developed Alg-g-PAcA hydrogels. Hence, thermogravimetric analysis (TGA) and differential scanning calorimetry (DSC) were conducted for the purpose to analyze the differences in thermal stabilities that occurred possibly due to any kind of interaction between the components. PerkinElmer Simultaneous Thermal Analyzer STA 8000 was used for TGA analysis. Hence, samples of 3–5 mg were placed in an open aluminum pan. Heat was maintained within range of 40–600 °C with heating rate of 20 °C/min under dry nitrogen flow throughout the analysis (Shafique et al., 2021).
PerkinElmer DSC 4000 (Waltham, MA, USA) was used for DSC analysis of Alg and Alg-g-PAcA hydrogels. 0.1–4 mg of samples was placed in aluminum pan and DSC analysis was performed under nitrogen flow of 20 mL/min with heating rate of 20 °C /min within temperature range of 50–400 °C (Anwar et al., 2017).
2.9 Scanning electron microscopy (SEM)
SEM (JSM-5300 model, Jeol Ltd., Tokyo, Japan) was used for the analysis of surface morphology of the formulated hydrogels. A specific amount of hydrogel sample was crushed in order to achieve the desired and suitable particle size for SEM. The sample (P6) was fixed on a double-adhesive tape stuck to an aluminum stub. Gold sputter was employed for coating of gold on stubs under an argon atmosphere. After that, scanning of coated samples was carried out unsystematically. And finally, surface morphology of the sample was evaluated by photomicrographs. Scanning was performed at various magnifications for the coated sample (Khalid et al., 2018a).
2.10 X-ray diffraction (XRD)
XRD patterns of Alg and developed hydrogels were conducted by using X-ray diffractometer (XRD-6000 SHIMADZU, Tokyo, Japan) to determine the crystallinity of unreacted Alg and formulated hydrogels. The scans were achieved by changing the diffraction angles within the range of 10-60° at a rate of 2° 2θ/min (Mahmood et al., 2016).
2.11 Estimation of drug loading
Loading of KTMA into formulated hydrogels was carried out by simple diffusion technique. Accurate weight of dried discs of hydrogel (500 mg) of each formulation was taken and immersed in 1% KTMA solution of phosphate buffer 7.4 at 37 °C for 72 h. Thereafter, the discs of hydrogel were removed, blotted with filter paper and washed again by deionized distilled water to remove any entrapped drug on the surface of the hydrogel discs. After that, the hydrogel discs were exposed to drying in vacuum oven at 40 °C, and weighed again after complete dryness (Ranjha et al., 2008). Drug loading was conducted in a triplicate in order to obtain the accurate amount of loaded drug.
The estimation of drug loaded by the developed hydrogels was carried out by weight method. Hence, the weight of dried hydrogel discs before immersion into the drug solution was subtracted from the weight of dried hydrogel discs after immersion in drug solution (Khan et al., 2014). Drug loading content was determined by the given equation:
2.12 In-vitro drug release
The release properties of the commercial product Keten capsule and fabricated hydrogels were determined by in-vitro drug release study at both low and high pH values of 1.2 and 7.4 respectively, using USP dissolution apparatus-II, Sr8plus dissolution test station, Hanson Research, Chatsworth, CA USA, equipped with peddle. Therefore, Keten capsule and dried drug loaded discs of hydrogel were immersed in 900 mL buffer solution of both pH 1.2 and 7.4 at 37 ± 0.5 °C and 50 rpm. After that, aliquot of 5 mL was taken at a specific interval of time and fresh medium of the same volume was added back to maintain the sink condition. The collected aliquot was analyzed by using UV–vis-spectrophotometer (U-5100, 3 J2-0014, Tokyo, Japan) at ʎmax 280 nm in a triplicate (Malik et al., 2020).
2.13 Kinetic modeling
The order and mechanism of drug released from the Alg-g-PAcA hydrogels was determined by fitting the in-vitro drug release data into various kinetic models. The best model was selected on the basis of the “r2” value near to 1 (Peppas et al., 1989).
2.14 In-vivo study
All experiments in this study were approved (no. 109008) by the Institutional Animal Care and Use Committee of Kaohsiung Medical University (Kaohsiung, Taiwan). The committee confirmed that all experiments followed the guidelines as set forth by the Guide for Laboratory Fact lines and Care. Healthy male New Zealand White (NZW) rabbits (2.5 kg-3 kg) were housed individually in each cage and maintained under controlled temperature and humidity conditions with a 14 h: 10 h light–dark cycle. Each rabbit has free access to water and dry feed every day. Before the start of the experiment, the animals were kept on adaptation period of 1 week. At the end of the experiment, the rabbits were euthanized with excess sodium pentobarbital and carbon dioxide. Nine rabbits were divided into three groups of three animals each i.e., group-I (control group), group-II (commercial product, Keten) and group-III (KTMA loaded Alg-g-PAcA hydrogels). Food was supplied regularly to all the rabbits before the start of the study. Food was restricted to all the rabbits and made fast for 12 h over-night before the administration of the dose. The rabbits were stained and placed in the boxes. Drug solution of 10 mg/kg was given orally to group-I by the help of feeding tube. Similarly, commercial product Keten and KTMA loaded Alg-g-PAcA hydrogels was given orally at dose of 10 mg/kg and 16.59 mg/kg to group-II and group III respectively. Blood samples of 0.6 mL were taken from the ear vein of all the three groups at 0.5, 1, 2, 3, 4, 5, 6, 8, 10, 12, and 24 h. The collected samples were then stored in a heparinized polypropylene tube. After this, the samples were subjected to centrifugation for 10 min at 4000 rpm to obtain the plasma (Sohail et al., 2015). High performance liquid chromatography (HPLC, HITACHI) was used for the determination of KTMA contents in the plasma. Column (LiChrospher®100 RP-18 endcapped 250 × 4 mm, 5 μm (Merck) was used for the detection of KTMA (RT = KETM 5.1 min, Internal standard of Ketoprofen = 7.7 min (400 μg/mL methanol)). The mixture of phosphoric acid (pH 3.0) /acetonitrile (55:45, v/v) was used as a mobile phase at a flow rate of 1.2 mL/min. A mixture of plasma (100 μL) and internal standard (100 μL) was taken and kept it on vortex mixing for 60 sec. Centrifugation was performed at 8000 rpm for 5 min at room temperature. KTMA was detected at λ max 313 nm (Sethi, 2008). The analytical method was successfully validated for linearity (0.2–10 μg/mL) with a determination coefficient (R2) of 0.9998, coefficient of variation of 5.19%, and relative error of −3.41%. The recovery was 90.3%.
2.15 Statistical analysis
A computer program, SPSS Statistic software 22.0 (IBM Corp, Armonk, NY, USA) was used for the statistical analysis. The differences between the tests were tested by the help of Student’s t-Test and considered significant statistically because the p-value was less than 0.05.
3 Results and discussion
3.1 Synthesis of hydrogels
Hydrogels are formed by free radical polymerization technique. The gelation of hydrogel is occurred by the crosslinking of hydrogel contents. Alg is polymerized with AcA by cross-linker EGDMA in the presence of initiator APS. The whole process of gelation takes 21 h with a constant temperature of 65 °C. Formulations of various concentrations of Alg, AcA, and EGMA are prepared and assessed for further studies. The schematic diagram of gelation process of hydrogel is shown in Fig. 1B.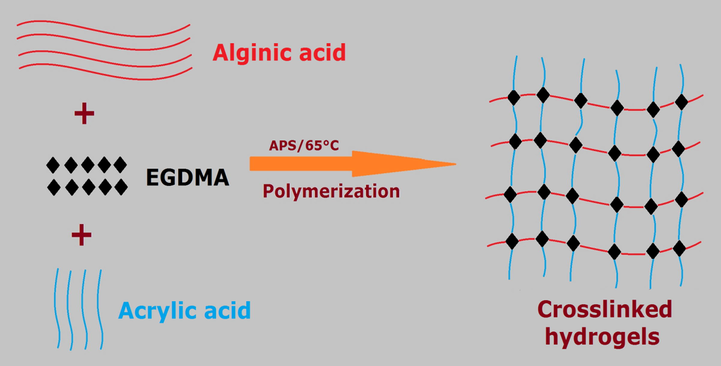
Gelation mechanism of Alg-g-PAcA hydrogels.
3.2 FTIR analysis
FTIR spectrum of Alg, AcA, unloaded Alg-g-PAcA hydrogels (P6), KTMA and loaded Alg-g-PAcA hydrogels (P6) is indicated in Fig. 2(A – E). The FTIR spectra of Alg (Fig. 2A) reveal stretching vibrations of aliphatic C-H at 2910 cm−1 while peaks at 3360 and 1282 cm−1 assign the stretching vibration of OH respectively. The asymmetric and symmetrical vibration of COO– is detected at 1642 and 1488 cm−1. Similarly, the corresponding bands at 988 and 1028 cm−1 indicate the stretching vibration of C-O-C and C-C-C of the pyranic bond. Estrada-Villegas et al., (2020) prepared PVGA/Alginate-AgNPs hydrogel and reported the same FTIR spectra for Alg as we presented (Estrada-Villegas et al., 2020). The FTIR spectra of AcA (Fig. 2B) present the absorption band at 2988 cm−1 assigned to stretching vibration of O–H, while peaks at 1702 and 1574 cm−1 represent the stretching and bending of C = O of the carboxylic group. Similarly, stretching vibration of C–O and C–C is depicted by peaks at 1190 and 1303 cm−1 respectively (Azizullah et al., 2017). A change is seen in the different peaks of both Alg and AcA such as the peaks of Alg and AcA at 1488, 2910 cm−1 and 1303, 1574 cm−1 are shifted to 1520, 3010 cm−1 and 1280, 1513 cm−1 in unloaded Alg-g-PAcA (Fig. 2C). Some peaks are disappeared while a few new are formed. The disappearance, modification, and formation of peaks reveal the grafting of AcA completely over the backbone of Alg. The fluctuation in the peaks of Alg and AcA is due to the formation of different bonds between the functional groups of the hydrogel contents. This all indicate the fabrication of a new polymeric network of hydrogels. The FTIR spectra of KTMA (Fig. 2D) indicate the stretching vibration of –OH, C = O (diaryl ketone), –C–N, NH2, and N-H by peaks at 1098, 1225, 1426, and 3392 cm−1, respectively. Likewise, peaks at 2197 and 772 cm−1 are assigned to bending of C–H (aromatic) (Aşık et al., 2013; Begum et al., 2012; Moharram et al., 2007; Waghulde et al., 2019). Due to loading of KTMA, a few peaks of KTMA are modified slightly such as peaks at 1426 and 3392 cm−1 are shifted to 1505 and 3402 cm−1 in drug loaded Alg-g-PAcA hydrogels (Fig. 2E). The presence of drug peaks in loaded hydrogel reveals the successful loading of drug by the fabricated hydrogels. The results indicate the compatibility, crosslinking, and development of a new polymeric network between the Alg and AcA. Similarly, the successful loading and chemical stability of KTMA is revealed by the developed hydrogels.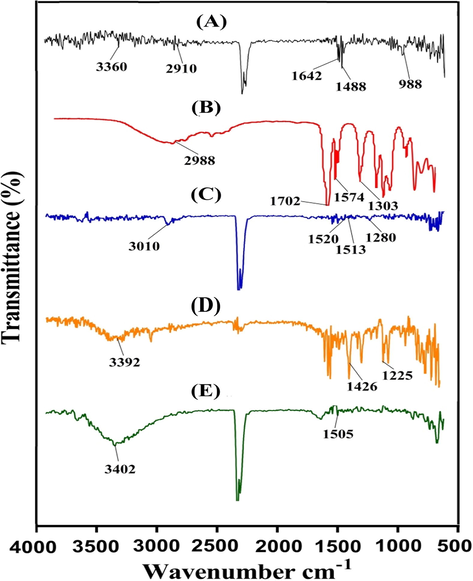
FTIR spectra of (A) Alg, (B) AcA, (C) unloaded Alg-g-PAcA hydrogels, (D) KTMA, and (E) loaded Alg-g-PAcA hydrogels.
3.3 Sol-gel content
Sol-gel analysis is conducted for the purpose to determine the soluble uncross-linked and insoluble crosslinked fraction of the fabricated hydrogels. Hence, impact of various concentrations of Alg, AcA, and EGDMA on sol–gel analysis of the fabricated hydrogels is shown in Table 2. Gel fraction increases with the increasing concentration of Alg (Samanta et al., 2014) due to the availability of high free radicals for polymerization of AcA. Greater the free radicals, high will be the polymerization process and hence greater will be the gel fraction. Similarly, a significant increase is seen in gel fraction with the increasing concentration of AcA (Ranjha et al., 2010). The high concentration of AcA generates maximum numbers of free radicals that leads to rapid crosslinking of AcA with Alg, and hence increase in gel fraction is perceived. Likewise, gel fraction is increased as the EGDMA concentration increases (Hussain et al., 2011). EGDMA crosslinks the Alg and AcA at their proper sites, thus greater quantity of EGDMA leads to faster and high crosslinking, and as a result gel fraction increases (Sun et al., 1997). The crosslinking density of hydrogels increases by the incorporation of a high concentration of EGDMA. On the other hand, decrease in sol fraction is observed with the increasing concentration of Alg, AcA, and EGDMA because there is an inverse relationship between the sol and gel fraction (Dergunov et al., 2005). Increase in one content leads to decrease in another. Khalid et al (2018) developed chondroitin sulfate based hydrogels and reported decrease in sol fraction with the increase in polymer, monomer, and crosslinker concentration whereas the effect on gel fraction was reversed (Khalid et al., 2018b). Thus, the developed hydrogels demonstrate an increase in gel while decrease in sol fraction with the increasing concentration of polymer, monomer, and cross-linker.
F. code
Sol fraction (%)
Gel fraction (%)
Drug loaded (mg)/500 mg of dry gels
Polymer volume fraction
pH 1.2
pH 7.4
P-1
11.63
88.37
185.23 ± 1.24
0.286
0.165
P-2
9.65
90.35
202.42 ± 0.97
0.267
0.135
P-3
7.82
92.18
250.54 ± 1.03
0.256
0.128
P-4
10.14
89.86
213.10 ± 1.17
0.271
0.132
P-5
7.82
92.18
250.54 ± 1.03
0.256
0.128
P-6
6.30
93.70
301.32 ± 0.94
0.252
0.119
P-7
7.82
92.18
250.54 ± 1.03
0.256
0.128
P-8
6.13
93.87
190.62 ± 1.31
0.286
0.169
P-9
5.52
94.48
152.02 ± 1.25
0.324
0.206
3.4 Dynamic swelling
3.4.1 Effect of pH on swelling
The pH sensitive nature of the Alg-g-PAcA hydrogels is evaluated at both acidic and basic media (pH 1.2 and 7.4) respectively. pH affects the dynamic swelling highly as maximum swelling is exhibited at basic pH 7.4 as compared to acidic pH 1.2 as indicated in Fig. 3A. This behavior of fabricated hydrogels is due to the deprotonation and protonation of functional groups of both Alg and AcA. Alg contains carboxylic (COOH) groups. Similarly, AcA is also composed of COOH groups. At low pH 1.2, the COOH groups of both polymer and monomer are protonated and form conjugate with counter ions. Strong hydrogen bonds are formed, due to which the hydrogel network is collapsed, and hence a reduction in swelling is exhibited. However, an increase in swelling is observed with the change in the pH of the medium. Maximum swelling is seen at high pH 7.4 due to the deprotonation of COOH groups of both Alg and AcA. The charge density is increased due to deprotonation of COOH groups and as a result strong electrostatic repulsive forces are produced. These forces swell the hydrogel networks and hence maximum swelling is perceived at pH 7.4 (Chen et al., 2004; Sohail et al., 2014). Fig. 3B indicates the dried and swelled state of hydrogel.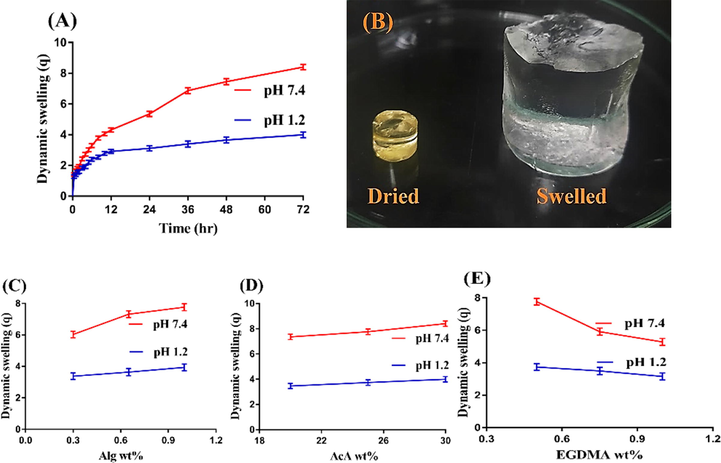
(A) Effect of pH on dynamic swelling, (B) Dried and swelled hydrogel; effects of (C) Alg, (D) AcA, and (E) EGDMA on dynamic swelling of Alg-g-PAcA hydrogels.
3.4.2 Effect of hydrogel contents on swelling
Dynamic swelling of Alg-g-PAcA hydrogel is greatly influenced by its contents at both pH 1.2 and 7.4 as shown in Fig. 3(C-E). Swelling is increased with the increasing concentration of Alg and AcA (Fig. 3C, D). The possible reason is the generation of high number of COOH groups, which produce high charge density and strong electrostatic forces and as a result maximum swelling is exhibited (Sanli et al., 2007; Sullad et al., 2010). Contrary to Alg and AcA, a drop is seen in the swelling index with the increase in the concentration of the EGDMA (Fig. 3E). The bulk and crosslinked density of the fabricated hydrogel is increased with the increase in EGDMA concentration (Caykara et al., 2006; Teijon et al., 2006). The pore size is decreased, due to which penetration of water into the polymeric network of hydrogels is reduced, and thus as a result reduction in swelling is exhibited (Teijon et al., 1997).
3.5 Polymer volume fraction
Polymer volume fraction analysis is performed for the developed hydrogels at both acidic and basic media (pH 1.2 and 7.4) as indicated in Table 2. High volume of polymer is seen at pH 1.2 as compared to pH 7.4. Polymer volume fraction is influenced by the composition of hydrogel contents. A drop in the polymer fraction is observed with the increasing concentration of Alg and AcA, while a rise is seen with the increasing concentration of EGDMA. The reason may be interlinked with the swelling behavior of the developed hydrogels. The low polymer volume fraction at pH 7.4 and high at pH 1.2 reveals the significant swelling and prominent expansion capability of the formulated hydrogels (Badshah et al., 2021).
3.6 Percent porosity
Porosity study is conducted in order to determine the effects of Alg, AcA, and EGDMA concentration on the pore size of the fabricated hydrogels as shown in Fig. 4A. Thus, increase in porosity is observed with the increasing concentration of Alg and AcA. During the polymerization reaction, viscosity of the reaction mixture is enhanced and evaporation of bubbles is restricted. This high viscous mixture generates interconnected channels, which leads to increase in porosity. Contrary to Alg and AcA, porosity is decreased with the increasing concentration of EGDMA due to high crosslinked bulk density of the fabricated hydrogels that influences the drug flexibility. The other parameters such as swelling, drug loading and release of the fabricated hydrogel depend on its porosity. Greater the pore size, high amount of water will be penetrated into the developed hydrogel networks and as a result maximum swelling will be exhibited, due to which greater amount of drug will be loaded and released by the formulated hydrogel (Sarika et al., 2016).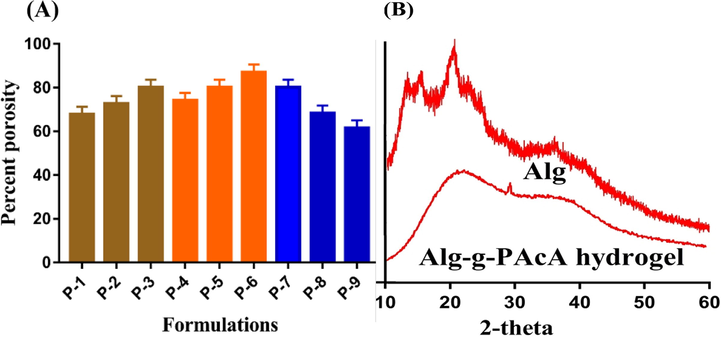
(A) Percent porosity of Alg-g-PAcA hydrogels and (B) PXRD of Alg and Alg-g-PAcA hydrogels.
3.7 X-ray diffraction (XRD)
XRD analysis is performed to evaluate the crystallinity of Alg and Alg-g-PAcA hydrogel as shown in Fig. 4B. Due to crystalline nature, sharp peaks with high intensity are shown by the diffractogram of Alg at 2θ = 13.10°, 15.02°, 19.98°, and 28.88° respectively (Fig. 4B). The diffractogram of Alg-g-PAcA hydrogel reveals a uniform and amorphous structure resulted due to the successful crosslinking of AcA with Alg. We can see in Fig. 4B that all sharp peaks of the unreacted Alg are reduced or even disappeared by the formulated network, which indicates the successful polymerization of hydrogel contents. Lee et al., (2007) developed amphiphilic poly(L-lactide)-grafted chondroitin sulfate copolymer hydrogel and demonstrated a decrease in the crystallinity of the hydrogel contents by the fabricated hydrogel (Lee et al., 2007). Thus, conclusively, we can demonstrate that crystallinity of Alg is lost by fabricated hydrogels and Alg dispersed molecularly in the polymeric network of hydrogel.
3.8 Thermal analysis
TGA (thermogravimetric analysis) is performed for the purpose to evaluate the thermal stability of Alg and Alg-g-PAcA hydrogel as indicated in Fig. 5A. TGA of Alg demonstrates weight loss of 13% as temperature reaches 178 °C. Likewise, as temperature approaches 248 °C, further weight reduction of 33% is detected. Further increase in temperature leads to further loss in weight and approximately 12% reduction in weight is observed as temperature reaches 405 °C. After that, degradation of Alg is started (Soares et al., 2004). Similarly, TGA of Alg-g-PAcA hydrogel (Fig. 5A) indicates 8% loss in weight within temperature range of 200 – 250 °C. Further reduction of 30% in weight of fabricated hydrogels is seen with the increasing temperature up to 350 °C. As the temperature approaches 500 °C, loss of 40% in weight of Alg-g-PAcA hydrogels is perceived and degradation of developed polymeric network is started. The results show that thermal stability of the Alg-g-PAcA hydrogel is greater than pure Alg. The degradation half-life of Alg-g-PAcA hydrogel is (t1/2 = 500 °C) which is higher than degradation half-life of Alg i.e., Alg (t1/2 = 405 °C) respectively. Due to strong cross-linking and grafting of AcA over the backbone of Alg, thermal stability of developed hydrogels is found greater than unreacted Alg. Barkat et al., (2018) prepared PEG 4000-based hydrogels and demonstrated greater thermal stability for the fabricated hydrogels as compared to unreacted polymer (Barkat et al., 2018) .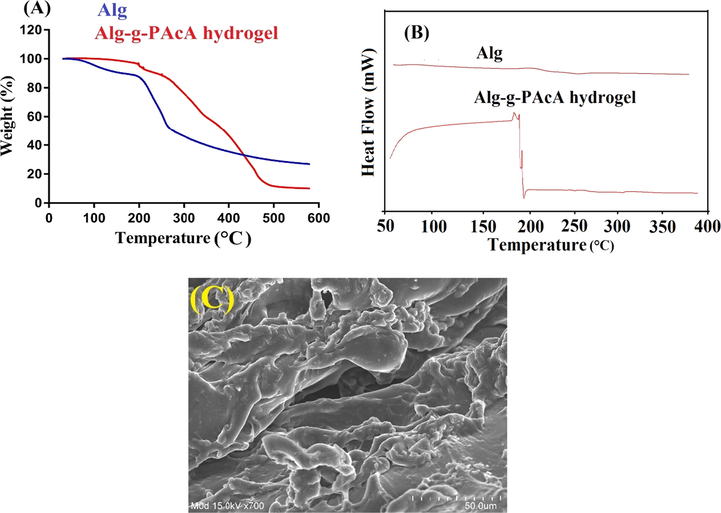
(A) TGA, (B) DSC, and (C) SEM of Alg-g-PAcA hydrogels.
DSC (differential scanning calorimetry) is performed for Alg and Alg-g-PAcA hydrogel as shown in Fig. 5B. Two endothermic peaks are assigned at 59 and 248 °C by DSC of Alg (Fig. 5B), while an exothermic peak is depicted at 198 °C respectively. Endothermic peaks are interlinked with water loss of hydrophilic groups (Sarmento et al., 2006). The DSC of Alg-g-PAcA hydrogel (Fig. 5B) reveals a broad exothermic peak within temperature range of 59–90 °C while two minor exothermic peaks are observed at 187 and 202 °C. Similarly, two endothermic peaks are seen at 198 and 305 °C, respectively. The endothermic and exothermic peaks of the Alg at 248 and 198 °C are shifted to 305 and 202 °C in Alg-g-PAcA hydrogel. The increase in endothermic and exothermic peaks temperature of Alg by fabricated hydrogels is due to the crosslinking of the Alg with others hydrogel contents, which leads to greater thermal stability of developed hydrogels. Thus, these all demonstrate the greater thermal stability of the polymeric hydrogel as compared to Alg. Barkat et al., (2017) prepared chondroitin sulfate-based hydrogels and revealed greater thermal stability for the formulated polymeric hydrogel as compared to unreacted chondroitin sulfate (Barkat et al., 2017).
3.9 Scanning electron microscopy (SEM)
The surface morphology of Alg-g-PAcA hydrogel is evaluated and investigated by SEM as shown in Fig. 5C. An irregular and porous surface is revealed by fabricated hydrogels indicating a compatible and crosslinked polymeric network of Alg and AcA. The porous surface provides channels for water penetration into the hydrogel networks. High the number of pores on the surface, greater will be the channels for penetration of water and hence maximum will be the swelling. And thus high will be the drug loading and release ultimately (Khanum et al., 2018).
3.10 Estimation of drug loading
The amount of drug loaded by the formulated hydrogels is estimated by weight method where the weight of unloaded hydrogels is subtracted from the weight of loaded hydrogels. Drug loading is mainly dependent on the swelling index of the fabricated hydrogels. Greater the swelling, high will be the drug loading (Murthy et al., 2006) and vice versa. Hence, greater amount of drug is loaded as the concentration of the Alg and AcA is increased (Table 2). The main reason is the high swelling index of both Alg and AcA which increases with the increase in their concentration. Similar to swelling, a drop is seen in loading of drug due to high crosslinked density as the concentration of the EGDMA is increased (Table 2).
3.11 In-vitro drug release
3.11.1 Effect of pH on drug release
As like dynamic swelling, the pH sensitive nature of the Alg-g-PAcA hydrogels on drug release is also evaluated at both pH 1.2 and 7.4 respectively as indicated in Fig. 6A. pH influences the percent drug release highly as maximum drug released from the formulated hydrogels is observed at pH 7.4 as compared to pH 1.2. The low drug release at pH 1.2 is due to the protonation of functional groups of both Alg and AcA. The COOH groups of Alg and AcA form conjugate with the counter ions by strong hydrogen bonding and as a result charge density of the same groups is decreased, which leads to decrease in swelling and drug release at pH 1.2. Contrary to pH 1.2, a greater amount of drug release is detected at pH 7.4 due to the deprotonation of COOH groups of both Alg and AcA. The charge density of the same groups is increased, and as a result strong electrostatic repulsive forces are generated. These forces repeal each other and hence maximum swelling and drug release is observed at pH 7.4 (Al-Tabakha et al., 2021; Kulkarni et al., 2009). Similarly, percent drug release study is performed for Keten capsule at both pH 1.2 and 7.4, respectively as indicated in Fig. 6B. Greater drug release is depicted at pH 7.4 as compared to pH 1.2. Maximum drug release of 97% is observed at pH 7.4 within initial 4 h, which remained constant up to 36 h. On other hand, percent drug release of 70% is detected at pH 1.2 for initial 12 h, and then further increase up to 91% is observed at 36 h. The rapid and high release of Keten at both pH values indicates the immediate release of drug and hence repeated dose is needed to maintain a constant plasma level. Similarly, Rokhade and his coworkers developed gelatin/sodium carboxymethyl cellulose based microspheres and reported released of ketorolac tromethamine for 10 h (Rokhade et al., 2006). Also, Dasankoppa and her coworkers synthesized osmotic pump for controlled delivery of ketorolac up to 12 h (Dasankoppa et al., 2012). Comparing the percent drug release from the formulated hydrogels, Keten capsule, and previous reported data, we can demonstrate that drug release is sustained significantly by the fabricated hydrogels as compared to commercial product Keten and previous published data. Hence, it can be concluded from the discussion that the developed hydrogels could be used for controlled delivery of KTMA on clinical basis.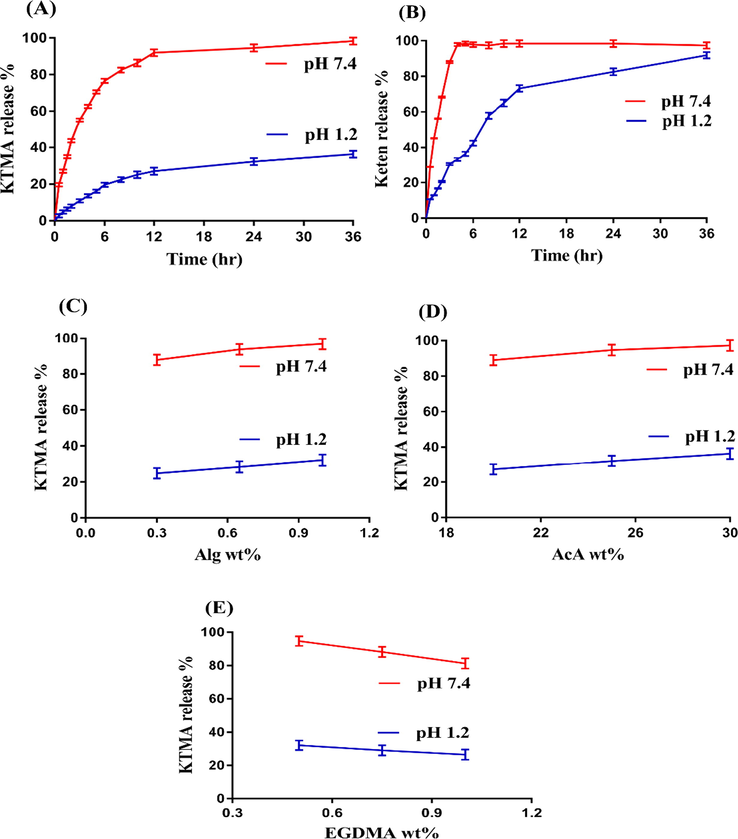
Effects of pH on percent drug release from (A) Alg-g-PAcA hydrogels, (B) commercial product Keten, (C) Alg, (D) AcA, and (E) EGDMA on KTMA percent release from Alg-g-PAcA hydrogels.
3.11.2 Effect of hydrogel contents on drug release
Percent drug release is affected by hydrogel contents greatly at both pH 1.2 and 7.4 as indicated in Fig. 6(C-E). The percent drug release is increased as the concentration of the Alg and AcA is increased due to the generation of high number of COOH groups which leads to greater swelling and percent drug release (Fig. 6C,D) (Nasir et al., 2019; Sanli et al., 2007). A reduction in percent drug release is seen with the increasing concentration of EGDMA due to less porosity, greater crosslinking and bulk density (Fig. 6E) (Shah et al., 2013).
3.11.3 Kinetic modeling
The chemical architecture of a polymeric network influences its swelling behavior, which plays an important role in the release of drug from the fabricated network. Different kinetic models such as Zero order, first order, Higuchi, and Korsmeyer–Peppas models are applied to release data to evaluate the drug release mechanism form the developed hydrogel. Table 3 suggests that all the formulations of Alg-g-PAcA hydrogels follow the first-order kinetics because the “r2” values for first-order are higher than rest of the kinetic models. “r2” values are found greater than 0.5 for Higuchi model, which demonstrates that the release of drug is diffusion based. “n” value determines the type of diffusion. The “n” values for all formulations obtained for Korsmeyer-Peppas are found greater than 0.45 indicating the non-Fickian behavior and refers to the coupling of Fickian diffusion and polymer matrix relaxation (Maziad et al., 2015; Shoaib et al., 2006).
F. code
Zero order
r2
First order
r2
Higuchi
r2
Korsmeyer-Peppas
r2 n
P-1
0.9318
0.9805
0.8562
0.9328
0.7311
P-2
0.8713
0.9784
0.9763
0.9725
0.5781
P-3
0.8849
0.9908
0.9722
0.9823
0.5418
P-4
0.8553
0.9864
0.9504
0.9629
0.5933
P-5
0.8849
0.9908
0.9722
0.9823
0.5418
P-6
0.8768
0.9914
0.9663
0.9812
0.5116
P-7
0.8849
0.9908
0.9722
0.9823
0.5418
P-8
0.8973
0.9902
0.9775
0.9817
0.6099
P-9
0.9010
0.9934
0.9793
0.9644
0.7825
3.12 In-vivo study
Nine healthy rabbits are selected for in-vivo study in order to estimate the plasma drug concentration and other different pharmacokinetic parameters of drug solution, Keten and KTMA loaded Alg-g-PAcA hydrogel. The nine rabbits are divided into three groups of three animals each. Drug solution is administered orally to group-1 (control group), while Keten and KTMA loaded Alg-g-PAcA hydrogel are given orally to group-II (commercial product) and group-III (test group) respectively.
Fig. 7 indicates the plasma drug concentration vs time for drug solution, Keten and KTMA loaded Alg-g-PAcA hydrogels. The graph shows that plasma concentration of KTMA loaded Alg-g-PAcA hydrogels is greater than plasma concentration of drug solution and Keten. The release pattern of the drug is; drug solution < Keten < KTMA loaded Alg-g-PAcA hydrogels. Thus, the results show that drug release is highly sustained for a prolonged time by KTMA loaded Alg-g-PAcA hydrogels as compared to drug solution and Keten. All three groups of the rabbits reveal a significant difference in their pharmacokinetics parameters. Tmax values indicate a rapid absorption of drug for drug solution (1.00 ± 0.00) and Keten (0.50 ± 0.00) as compared to KTMA loaded Alg-g-PAcA hydrogels (5.00 ± 0.00). The drug absorption is much greater from drug loaded hydrogels with significant difference indicates the slow absorption of drug from the developed hydrogels and therefore demonstrates sustained release behavior. Plasma concentration is found greater for fabricated hydrogels as compared to pure drug solution and Keten. Therefore, Cmax values of KTMA loaded Alg-g-PAcA hydrogels (8.10 ± 0.25) > drug solution (6.62 ± 109.72) > Keten (5.53 ± 0.32) even possessing the same drug concentration. Hence, we can conclude that plasma concentration is maintained by the developed hydrogels for a prolonged time. Similarly, a significant difference is seen in other pharmacokinetic parameters of the three groups. AUC0-x (μg/mL*h) value of developed hydrogels (124.26 ± 8.64) is significantly higher than drug solution (48.21 ± 2.29) and Keten (49.53 ± 0.61) (p less than 0.05). Similarly, elimination rate constant of KTMA loaded Alg-g-PAcA hydrogels (0.17 ± 0.00) is found greater than drug solution (0.12 ± 0.00) and commercial product Keten (0.15 ± 0.01). Radwan, M. A., et al. (2010) prepared Ketorolac tromethamine loaded nanoparticles of polyethylcyanoacrylate and reported elevated plasma drug concentration up to 6 h successfully (Radwan et al., 2010), while in case of our studies, plasma drug concentration is maintained for 24 h. Conclusively, we can demonstrate from the above discussion that fabricated hydrogels has enhanced the bioavailability of KTMA significantly for a prolonged time as compared to pure drug solution, commercial product Keten, and reported nanoparticles of polyethylcyanoacrylate. Hence, the developed hydrogels could be used for controlled release of KTMA on commercial basis.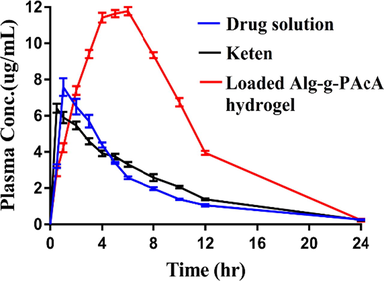
Plasma concentration vs time plot of KTMA administered as oral solution, Keten and Alg-g-PAcA hydrogels to healthy rabbits.
4 Conclusion
Alg-g-PAcA hydrogels were fabricated successfully by the free radical polymerization technique. FTIR revealed the crosslinking of Alg and AcA during the polymerization reaction and confirmed the grafting of AcA over the backbone of Alg. TGA and DSC analysis indicated higher thermal stability for fabricated hydrogel as compared to unreacted Alg. Irregular and porous surface was seen by the SEM. Similarly, PXRD confirmed a reduction in the crystallinity of the Alg by the formulated hydrogels. Increase in dynamic swelling at both pH values was demonstrated with the increase in the concentration of Alg and AcA due to high porosity while a drop was seen with the increase in EGDMA concentration. And as a result, increase and decrease in the drug loading and percent drug release was observed ultimately in the same pattern. Gel fraction was increased with the increasing concentration of Alg, AcA, and EGDMA while sol fraction was decreased. In-vivo studies revealed that all pharmacokinetic parameters of the fabricated hydrogels were greater than drug solution and Keten. Conclusively, Alg-g-PAcA hydrogels could be a suitable alternate to conventional dosage forms for ketorolac tromethamine controlled delivery for a long duration of time.
Acknowledgements
This work was funded and supported by the National Science Council of Taiwan, MOST 109-2320-B-037-0025 and 110-2320-B-037-014-MY2.
Declaration of Competing Interest
The authors declare that they have no known competing financial interests or personal relationships that could have appeared to influence the work reported in this paper.
References
- Synthesis, Characterization and Safety Evaluation of Sericin-Based Hydrogels for Controlled Delivery of Acyclovir. Pharmaceuticals-Base. 2021;14(3)
- [Google Scholar]
- Proniosomes as a drug carrier for transdermal delivery of ketorolac. Eur. J. Pharm. Biopharm.. 2005;59(3):485-490.
- [Google Scholar]
- Alginate-polyvinyl alcohol based interpenetrating polymer network for prolonged drug therapy, Optimization and in-vitro characterization. Carbohydr. Polym.. 2017;166:183-194.
- [Google Scholar]
- Ketorolac tromethamine loaded chitosan nanoparticles as a nanotherapeutic system for ocular diseases. Hacettepe J Biol Chem. 2013;41(1):81-86.
- [Google Scholar]
- Azizullah, Haider, A., Kortz, U., Joshi, S.A., Iqbal, J., 2017. Polyethyleneimine-Polyoxometalate-Based Supramolecular Self-assembled pH-Responsive Hydrogels: Formulation and in vitro Evaluation. Chemistryselect 2 (21), 5905–5912.
- Porous and highly responsive cross-linked beta-cyclodextrin based nanomatrices for improvement in drug dissolution and absorption. Life Sci.. 2021;267:118931
- [Google Scholar]
- Oxaliplatin-loaded crosslinked polymeric network of chondroitinsulfate-co-poly(methacrylic acid) for colorectal cancer: Its toxicological evaluation. J. Appl. Polym. Sci.. 2017;134(38):45312.
- [Google Scholar]
- Development and characterization of pH-responsive polyethylene glycol-co-poly (methacrylic acid) polymeric network system for colon target delivery of oxaliplatin: Its acute oral toxicity study. Adv. Polym. Tech.. 2018;37(6):1806-1822.
- [Google Scholar]
- Ketorolac tromethamine loaded liposomes of long alkyl chain lipids: Development, characterization and in vitro performance. Int. J. Pharm. Tech. Res. 2012;4(1):218-225.
- [Google Scholar]
- Effect of the amount and type of the crosslinker on the swelling behavior of temperature-sensitive poly(N-tert-butylacrylamide-co-acrylamide) hydrogels. Colloid Polym. Sci.. 2006;284(9):1038-1048.
- [Google Scholar]
- Hydrogels for Biomedical Applications: Their Characteristics and the Mechanisms behind Them. Gels. 2017;3(1)
- [Google Scholar]
- A novel pH-sensitive hydrogel composed of N, O-carboxymethyl chitosan and alginate cross-linked by genipin for protein drug delivery. J. Control. Release. 2004;96(2):285-300.
- [Google Scholar]
- Formulation and evaluation of controlled porosity osmotic pump for oral delivery of ketorolac. J. Basic Clin. Pharm.. 2012;4(1):2-9.
- [Google Scholar]
- Radiation synthesis and characterization of stimuli-sensitive chitosan-polyvinyl pyrrolidone hydrogels. Radiat. Phys. Chem.. 2005;72(5):619-623.
- [Google Scholar]
- Alginic acid gels: the effect of alginate chemical composition and molecular weight. Carbohydr. Polym.. 1994;25(1):31-38.
- [Google Scholar]
- PVGA/Alginate-AgNPs hydrogel as absorbent biomaterial and its soil biodegradation behavior. Polym. Bull.. 2020;77(8):4147-4166.
- [Google Scholar]
- Swelling and Controlled Release of Tramadol Hydrochloride from a pH-Sensitive Hydrogel. Des. Monomers Polym.. 2011;14(3):233-249.
- [Google Scholar]
- Ijaz, Q.A., Abbas, N., Arshad, M.S., Hussain, A., Javaid, Z., 2018a. Synthesis and evaluation of pH dependent polyethylene glycol-co-acrylic acid hydrogels for controlled release of venlafaxine HCl. J. Drug Delivery Sci. Technol. 43, 221–232.
- Ijaz, Q.A., Abbas, N., Arshad, M.S., Hussain, A., Shahiq-uz-Zaman, Javaid, Z., 2018b. Synthesis and evaluation of pH dependent polyethylene glycol-co-acrylic acid hydrogels for controlled release of venlafaxine HCl. J. Drug Deliv. Sci. Tec. 43, 221–232.
- Preparation and characterization of alginate-PVA-based semi-IPN: controlled release pH-responsive composites. Polym. Bull.. 2018;75(3):1075-1099.
- [Google Scholar]
- Synthesis and evaluation of chondroitin sulfate based hydrogels of loxoprofen with adjustable properties as controlled release carriers. Carbohyd Polym. 2018;181:1169-1179.
- [Google Scholar]
- Effect of degree of cross-linking on swelling and on drug release of low viscous chitosan/poly(vinyl alcohol) hydrogels. Polym. Bull.. 2014;71(8):2133-2158.
- [Google Scholar]
- Fabrication and in vitro characterization of HPMC-g-poly(AMPS) hydrogels loaded with loxoprofen sodium. Int. J. Biol. Macromol.. 2018;120(Pt B):1624-1631.
- [Google Scholar]
- Polyacrylamide-Grafted-Alginate-Based pH-Sensitive Hydrogel Beads for Delivery of Ketoprofen to the Intestine: in Vitro and in Vivo Evaluation. J. Biomat. Sci. Polym. E. 2009;20(2):235-251.
- [Google Scholar]
- Synthesis and characterizations of amphiphilic poly(L-lactide)-grafted chondroitin sulfate copolymer and its application as drug carrier. Biomol. Eng.. 2007;24(1):131-139.
- [Google Scholar]
- Formulation and in vitro evaluation of acyclovir loaded polymeric microparticles: a solubility enhancement study. Acta Pol. Pharm.. 2016;73(5):1311-1324.
- [Google Scholar]
- Chitosan/xanthan gum based hydrogels as potential carrier for an antiviral drug: fabrication, characterization, and safety evaluation. Front. Chem.. 2020;8
- [Google Scholar]
- Design, fabrication and drug release potential of dual stimuli-responsive composite hydrogel nanoparticle interfaces. Colloid Surf. B. 2021;204
- [Google Scholar]
- Engineering and evaluation of forcespun functionalized carbon nano-onions reinforced poly (epsilon-caprolactone) composite nanofibers for pH-responsive drug release. Mater Sci Eng C Mater Biol Appl. 2020;112:110928
- [Google Scholar]
- Formulation and evaluation of ketorolac tromethamine-loaded albumin microspheres for potential intramuscular administration. AAPS PharmSciTech. 2007;8(1):14.
- [Google Scholar]
- Radiation preparation of smart hydrogel has antimicrobial properties for controlled release of ciprofloxacin in drug delivery systems. Asian J. Pharm. Clin. Res.. 2015;8(3):193-200.
- [Google Scholar]
- Application of FTIR spectroscopy for structural characterization of ternary poly(acrylic acid)-metal-poly(vinyl pyrrolidone) complexes. J. Appl. Polym. Sci.. 2007;105(4):1888-1893.
- [Google Scholar]
- Semi-IPNs of starch and poly(acrylamide-co-sodium methacrylate): Preparation, swelling and diffusion characteristics evaluation. React. Funct. Polym.. 2006;66(12):1482-1493.
- [Google Scholar]
- pH-responsive smart gels of block copolymer [pluronic F127-co-poly(acrylic acid)] for controlled delivery of Ivabradine hydrochloride: its toxicological evaluation. J. Polym. Res.. 2019;26(9)
- [Google Scholar]
- Generation of sustained release chitosan nanoparticles for delivery of ketorolac tromethamine: a tubular microreactor approach. Int J Polym Mater Po. 2020;69(8):516-524.
- [Google Scholar]
- A simple equation for the description of solute release. III. Coupling of diffusion and relaxation. Int. J. Pharm.. 1989;57(2):169-172.
- [Google Scholar]
- Evaluation of alternative strategies to optimize ketorolac transdermal delivery. AAPS PharmSciTech. 2006;7(3):64.
- [Google Scholar]
- Pharmacokinetics of ketorolac loaded to polyethylcyanoacrylate nanoparticles using UPLC MS/MS for its determination in rats. Int. J. Pharm.. 2010;397(1–2):173-178.
- [Google Scholar]
- Designing gelatin-based swellable hydrogels system for controlled delivery of salbutamol sulphate: characterization and toxicity evaluation. Polym. Bull. 2021
- [Google Scholar]
- Preparation and characterization of hybrid pH-sensitive hydrogels of chitosan-co-acrylic acid for controlled release of verapamil. J. Mater. Sci. - Mater. Med.. 2010;21(10):2805-2816.
- [Google Scholar]
- Swelling and aspirin release study: Cross-linked pH-sensitive vinyl acetate-co-acrylic acid (VAC-co-AA) hydrogels. Drug Dev. Ind. Pharm.. 2008;34(5):512-521.
- [Google Scholar]
- Semi-interpenetrating polymer network microspheres of gelatin and sodium carboxymethyl cellulose for controlled release of ketorolac tromethamine. Carbohyd. Polym.. 2006;65(3):243-252.
- [Google Scholar]
- Synthesis, characterization, swelling and drug release behavior of semi-interpenetrating network hydrogels of sodium alginate and polyacrylamide. Carbohydr. Polym.. 2014;99:666-678.
- [Google Scholar]
- Release characteristics of diclofenac sodium from poly(vinyl alcohol)/sodium alginate and poly(vinyl alcohol)-grafted-poly(acrylamide)/sodium alginate blend beads. Eur. J. Pharm. Biopharm.. 2007;65(2):204-214.
- [Google Scholar]
- Preparation, characterization and biological evaluation of curcumin loaded alginate aldehyde-gelatin nanogels. Mat. Sci. Eng. C-Mater.. 2016;68:251-257.
- [Google Scholar]
- Characterization of insulin-loaded alginate nanoparticles produced by ionotropic pre-gelation through DSC and FTIR studies. Carbohyd Polym. 2006;66(1):1-7.
- [Google Scholar]
- Sethi, P., 2008. Quantitative analysis of drugs in pharmaceutical formulations, ed. CBS publications, New Delhi.
- Bio-functional hydrogel membranes loaded with chitosan nanoparticles for accelerated wound healing. Int. J. Biol. Macromol.. 2021;170:207-221.
- [Google Scholar]
- Development and evaluation of pH-dependent interpenetrating network of acrylic acid/polyvinyl alcohol. Iran. Polym. J.. 2013;22(11):811-820.
- [Google Scholar]
- Evaluation of drug release kinetics from ibuprofen matrix tablets using HPMC. Pak. J. Pharm. Sci.. 2006;19(2):119-124.
- [Google Scholar]
- Soares, J.P., Santos, J.E., Chierice, G.O., Cavalheiro, E.T.G., 2004. Thermal behavior of alginic acid and its sodium salt. Eclética Química, 2004 29(2): p 57–64 29 (2).
- Controlled delivery of valsartan by cross-linked polymeric matrices: Synthesis, in vitro and in vivo evaluation. Int. J. Pharm.. 2015;487(1–2):110-119.
- [Google Scholar]
- Synthesis and characterization of graft PVA composites for controlled delivery of valsartan. Lat. Am. J. Pharm.. 2014;33(8):1237-1244.
- [Google Scholar]
- Fabrication and characterization of diclofenac sodium loaded hydrogels of sodium alginate as sustained release carrier. Gels. 2021;7(1)
- [Google Scholar]
- Nanogels as drug-delivery systems: a comprehensive overview. Therap. Delivery. 2019;10(11):697-717.
- [Google Scholar]
- Novel pH-Sensitive Hydrogels Prepared from the Blends of Poly(vinyl alcohol) with Acrylic Acid-graft-Guar Gum Matrixes for Isoniazid Delivery. Ind. Eng. Chem. Res.. 2010;49(16):7323-7329.
- [Google Scholar]
- Microgel formation in the free radical cross-linking copolymerization of methyl methacrylate (MMA) and ethylene glycol dimethacrylate (EGDMA) Ind. Eng. Chem. Res.. 1997;36(4):1343-1351.
- [Google Scholar]
- Effect of the crosslinking degree and the nickel salt load on the thermal decomposition of poly (2-hydroxyethyl methacrylate) hydrogels and on the metal release from them. J Colloid Interf Sci. 2006;295(2):393-400.
- [Google Scholar]
- Cytarabine trapping in poly(2-hydroxyethyl methacrylate) hydrogels: Drug delivery studies. Biomaterials. 1997;18(5):383-388.
- [Google Scholar]
- Preparation and characterization of ketorolac tromethamine-loaded ethyl cellulose micro-/nanospheres using different techniques. Particul. Sci. Technol.. 2019;37(3):347-357.
- [Google Scholar]
- Preparation and characterization of miglitol-loaded Poly (d, l-lactide-co-glycolide) microparticles using high pressure homogenization-solvent evaporation method. Int . J. Polym. Mater. Po. 2019;68(4):198-207.
- [Google Scholar]
- Calcium alginate gels: formation and stability in the presence of an inert electrolyte. Polymer. 1998;39(13):2759-2764.
- [Google Scholar]
- Arabian J. Chem. Polym Bull. 2021


