

Translate this page into:
Determination of total reactive sulfide species in biological matrix after administration of hydrogen sulfide donors or cellular oxidative stress
*Corresponding authors: E-mail addresses: louyuefen@sina.cn (Y. Lou), guorfan@163.com (G. Fan), zz_gxyjy@163.com (Z. Zhao),
-
Received: ,
Accepted: ,
Abstract
Detection and quantification of the third gasotransmitter, hydrogen sulfide (H2S), are of great significance in understanding its physiological and therapeutic effects. It has been increasingly accepted that H2S may exert many of its biological functions via the formation of sulfane sulfur species (mainly persulfides and polysulfides). It is hard to discriminate between the biological effect of H2S and sulfane sulfur by detection after derivatization with specific alkylating agents due to their redox equilibrium interconversions. In this study, a liquid chromatography tandem mass spectrometry (LC-MS/MS) method for simultaneous determination of H2S and sulfane sulfur (termed total reactive sulfide species (TRSS)) was developed by derivatization with 4-chloro-7-nitro-2,1,3- benzoxadiazole (NBDCl) and converting them into the same product, 7-nitrobenzofurazan-4-thiol (NBDSH). The NBDSH response of TRSS in rat plasma was linearly correlated with the nominal concentration of H2S spiked in blood. Since the analytes were endogenous compounds, and surrogate matrix and analytes were unattainable, the concentration of TRSS was calibrated using NBDSH spiked plasma standard samples. The method showed excellent linearity in the range of 0.1-20 μM; the precision, accuracy, recovery, matrix effect, dilution effect and stability of NBDSH met the requirements for bio-analysis. The method was successfully applied to pharmacokinetic study of H2S donors in rats, the results showed that the baseline level of TRSS in rat plasma was approximately 20 µM, the concentration of TRSS reached the peak value of 27 µM and 36 µM at 4 min and 10 min after administration of Na2S at 5 mg∙kg-1 and 10 mg∙kg-1, respectively. Using this method, we have also found that the level of TRSS in mice peritoneal macrophages was decreased when the cells were under oxidative stress after activation of the Nucleotide oligomerization domain (NOD)-like receptor family pyrin domain-containing 3 (NLRP3) inflammasome. This study could provide a reference for establishment and validation of methods for quantification of volatile endogenous active compounds, and the method would be further applied in future to assess the druggability of newly designed H2S controlled release preparation and elucidate the physiological and pathological effects of endogenous reactive sulfide species and reactive oxygen species (ROS).
Keywords
4-chloro-7-nitro-2,1,3-benzoxadiazole
Derivatization
LC-MS/MS
NLRP3 inflammasome
Pharmacokinetics
Total reactive sulfide species

1. Introduction
Hydrogen sulfide (H2S) is a gasotransmitter synthesized in vivo by catalysis of three distinct enzymes: cystathionine γ-lyase (CSE), cystathionine β-synthase (CBS), and 3-mercaptopyruvate sulfur transferase (3-MST) [1]. It participates in the regulation of apoptosis, oxidative stress, energy metabolism, cell cycle, cell proliferation and cell migration, and is associated with the homeostasis of the cardiovascular, immune, renal and central nervous systems; therefore, it is associated with various types of diseases such as dermatological diseases, cancer, and viral infections including Severe Acute Respiratory Syndrome Coronavirus 2 (SARS-CoV-2) [1-5]. Therefore, H2S donors have preventive or therapeutic effects on diverse pathological complications [6]. Since its confirmation as the third gaseous signaling molecule, H2S has garnered significant attention and been the topic of extensive research. It has been found that the endogenous H2S level varies in different tissues and between healthy and abnormal cells [7,8]. For example, Renieris et al. measured the plasma levels of H2S in a cohort with COVID-19 pneumonia and found that COVID-19 survivors had significantly higher serum H2S levels than non-survivors. H2S could down-regulate the levels of Interleukin (IL-6), the pro-inflammatory cytokine correlated with the cytokine storm that leads to severe lung injury, respiratory failure, and death by COVID-19; H2S may be a potentially predictive variable of the outcome of COVID-19 [9]. Therefore, the determination of H2S is of great importance in understanding its physiological, pathological or therapeutic effects.
Various detection toolkits have been developed for the detection of endogenous H2S in biological systems, including gas chromatography (GC), electrophoresis, amperometry, high-performance liquid chromatography-fluorescence detection (HPLC-FLD), LC-MS/MS and fluorescence imaging, etc. [7,8,10,11] Among these technologies, GC is less used nowadays due to poor quantification linearity and complicated sample pretreatment process [11,12]. Amperometry and fluorescence imaging have the advantage of fast response, excellent selectivity, high sensitivity and real-time monitoring, and a variety of fluorescent probes and nano sensors for the detection of H2S have been designed based on various strategies [8,11,13,14]. However, fluorescent probes and nano sensors are not commercially available in general laboratories and need custom synthesis, which is often costly. Therefore, HPLC-FLD and LC-MS/MS analysis following derivatization with monobromobimane (MBB) is the most frequently used method in studies elucidating the biological effects of H2S. This is also because of the availability and broad application of MBB paired with high sensitivity, selectivity, precision and reproducibility of HPLC-FLD [9,15-24]. These studies typically calculated H2S concentrations using aqueous H2S standard curves [18] or standard curves constructed using aqueous solutions of the reaction product, sulphide dibimane (SDB) [16,17,24]. In the other studies, the calibration curves were not even mentioned, and the impact of matrix effect and recovery on the accuracy for H2S detection was not considered. In the studies where a matrix spiked calibration curve was used, the details about method validation were abridged [25]. Haouzi challenged the application of exogenous H2S aqueous standard solutions to determine the potential physiological functions and possible therapeutic applications of endogenous H2S [26]. Roda et al. have appreciated the existence of H2S as a varied species in blood and the necessity of plasma-spiked calibration standards for limiting of matrix effect. However, in their study, the Na2S spiked serum samples showed a lower SDB response than the Na2S standard solution, which conflicted with the results in the study of Bogdándi et al. who showed that MBB can shift speciation equilibrium and hence could deprive sulfide from the endogenous sulfur pool [27,28]. Malaeb et al. quantitatively reduced polysulfides using tris (2-carboxyethyl)phosphine (TCEP) to recover free H2S and simultaneously quantified the total H2S and other abundant thiols using stable isotope-dilution LC-MS/MS method; however, Sonobe and Haouzi had reported earlier that in the presence of protein, H2S could be oxidized into sulfide compounds and could not be reversibly released under acidic or reducing conditions [22,29]. Therefore, there’s currently no consensus in the literature with respect to the baseline level of reactive sulfide concentration in blood and tissues due to differences in methodologies. A fully validated method for the quantification of reactive sulfide in biological matrix is urgently needed.
In fact, the majority of H2S present in blood, cells or tissues would immediately combine with metallo-proteins, react with reactive oxygen species (ROS) or reactive nitrogen species (RNS) to form persulfide (RSSH), or be trapped by ambient disulfides [26,30]. The reaction between H2S and disulfides initially results in an equilibrated mixture of corresponding thiols and persulfides. The formed persulfide species would be transformed into dialkyl trisulfides in a second equilibrium, and H2S would finally exist as homocyclic species (longer-chain polysulfides), which are thermodynamically more stable than their open-chain isomers [27,30]. Therefore, the response of H2S detected by derivatization with most alkylating reagents is mainly contributed by sulfane sulfurs. Sulfane sulfur is a zero charge sulfur atom with the unique ability to bind reversibly to other sulfur atoms to form persulfide and polysulfide (RSnR, RSnH, and HSnH, n ≥ 2) in possession of six valence electrons [30,31]. It has been increasingly accepted that H2S exerts many of its biological functions indirectly by forming sulfane sulfur species, yet very little research has addressed the fluctuation of sulfane sulfur levels following the administration of exogenous H2S or pathological factors.
The traditional method for the detection of sulfane sulfur is based on the formation of the [Fe (SCN)]2+ complex, which has a characteristic maximum absorbance at 460 nm by reaction with cyanide (pH>8.5, forming thiocyanate (SCN-)) following Fe3+ [30]. There are also selective fluorescence or electrochemical probes designed for monitoring sulfane sulfur (or endogenous polysulfids) [32-37]. The overwhelming majority of the H2S and sulfane sulfur quantification methods rely on the initial or final trapping of thiols and polysulfides using specific electrophilic alkylating agents. However, the alkylated species may indicate the relative reactivity of individual polysulfides with the alkylating agent rather than their actual concentrations given that sulfur species exist in a dynamic redox equilibrium. Bogdándi et al. have proved by numerous systematic experiments that alkylation perturbs the equilibrium of sulfur species in both a time- and concentration-dependent manner and exogenous electrophilic alkylating agents compete with intrinsic disulfides for reaction with persulfides, strong alkylating agents MBB and N-ethylmaleimide (NEM) can cleave polysulfur chains more effectively than iodoacetamide (IAM) [27]. Consistently, Nagai and Koshiishi quantified glutathione hydropersulfide by alkylation with IAM [38]. It seems that alkylating agents work though nucleophilic substitution (SN2) reaction show stronger ability to deprive sulfide from the endogenous sulfur pool compared with those work through the Michael addition reaction [39-43]. Later, Schilling et al. [44] proved that the property of the alkylating agent determined the ability of the disulfide bond (R-S-S-Alk) to tautomerize into thiosulfoxide (R-(S=S)-Alk), and/or the ability of nucleophiles to deprive the sulfane sulfur atom from the thiosulfoxide, in their study, NEM and IAM could convert protein persulfides into thioethers while MBB and N-t-butyl-iodoacetamide generated stable alkylated persulfides, which shows conflict with the results of Bogdándi et al. [27,38]. In a word, despite the existence of specific chemical probes, it is hard to discriminate between specific responses of H2S and sulfane sulfur due to their redox equilibrium interconversions and perturbation of sulfur speciation by alkylation agents. Then termed total reactive sulfide species (TRSS), which consist of trace-free H2S and sulfane sulfur, would be a better description of reactive H2S in biological matrix.
To assess the pharmacokinetics of H2S in vivo after administration of H2S donors or the fluctuation of neonatal H2S aroused by specific pathological stimulus, H2S dosage or the strength/type of stimuli would show a stronger correlation with the response of TRSS than with that of a single persulfide or polysulfide which was formed by the reaction of H2S with ROS, RNS or disulfides, consequently, it is more reasonable and feasible to detect H2S and sulfane sulfur simultaneously using a suitable alkylating agent that could transform both into a single analyte. The current most used alkylating agent, MBB, may not be good enough to quantify TRSS since it was also reported to form stable alkylating products with persulfides and polysulfides. Therefore, we are aiming to establish a fully validated LC-MS/MS method which we hope could be applied to guarantee efficacy and eliminate the toxicity of H2S donors at the design stage, or identify physiological or pathological factors that talk with H2S signaling pathways via monitoring the level of TRSS in vivo or in cells based on the selection of an appropriate alkylating agent.
In our previous work, we tested the commonly used chromatographic modifier, NBDCl, and four probes derived from it for fast quantification of H2S by LC-MS/MS and found that the LC-MS/MS response of the reaction product NBDSH and concentration of H2S showed good linearity correlation only in reaction with NBDCl and 4- Ethoxy -7- nitro-2, 1, 3- Benzoxadiazole (NBDOEt). Their sensitivities and linearity were comparable to that of MBB. NBDCl showed a sizable response to blank rat plasma while NBDOEt was more selective to free H2S and did not respond to blank plasma under the reaction conditions at the time The NBDOEt method showed better selectivity, higher repeatability, simpler reaction condition and lower reagent cost for quantification of H2S in Na2S∙9H2O drug material and preparations compared with the MBB method [45]. We found in our preliminary experiment that the H2S selective probe, NBDOEt, could not effectively recover the spiked H2S in rat plasma even when ascorbic acid, dithiothreitol (DTT) or TCEP were added; it is infeasible to detect free H2S in plasma. NBDCl could quantitatively deprive the biological sulfide pool of sulfane sulfur to form the same reaction product as with H2S under alkaline condition. The NBDSH response of TRSS showed a linear correlation with the spiked H2S concentration. Therefore, we detected TRSS in rat plasma by derivatization with NBDCl after injection of Na2S . To eliminate the matrix effect, the concentration of TRSS in the pharmacokinetic study of an H2S donor was calibrated using NBDSH spiked plasma standard curve and blood samples were collected at three time points before administration of H2S donors for subtraction of the mean background response [46,47]. Linearity, precision, accuracy, recovery, matrix effect, dilution effect and stability in processed samples were validated for accurate detection of NBDSH in rat plasma. The method could also be applied to detect the fluctuation of TRSS in mice macrophage cells after activation of the NOD-like receptor family pyrin domain-containing 3 (NLRP3) inflammasome.
2. Materials and Methods
2.1. Chemicals and reagents
NBDCl standard substance (Batch NO. RH560817, purity 98%), dithiothreitol (DTT, AR, purity≧98%), and ammonium acetate (purity≧99.5% for HPLC) were sourced from Shanghai ANPEL laboratory Technologies Inc. (Shanghai, China). Ammonium hydroxide (AR, 25%-28%) was sourced from Chinasun Specialty Products Co., Ltd. (Jiangsu, China). Methanol (HPLC grade) and tris(2-carboxyethyl) phosphine (TCEP, AR, purity≥98%) were purchased from MERCK (KgaA, Germany). Ibuprofen (ID 690F-1E05, purity 99.9%) was sourced from the National Institutes for Food and Drug Control, China. Sodium sulfide (Na2S∙9H2O, purity 99.9%, Adamas reagent Co., Ltd, Cat NO.19978A) was used as the source of H2S. Na2S∙9H2O injection (150 mg/ ampoule, Batch NO. 20170801) used in the pharmacokinetic study was provided by West China School of Pharmacy Sichuan University. EDTA (AR, 99%) was obtained from Shanghai Yuanye Bio-technology Co., Ltd (Shanghai, China). NBDSH (1 g, purity ≧95% by Nuclear Magnetic Resonance Spectroscopy) was synthesized by Shanghai Nafu biotechnology Co., Ltd. (Shanghai, China). NBDOEt and 4, 4’ -Thiobis (7-nitro-2,1,3-benzoxadiazole) (TBNBD) were synthesized as in our previous work [45]. RPMI-1640 cell culture media (Item NO. 11875, Lot NO. 2572144) was from Gibco (Invitrogen; Darmstadt, Germany). Cell culture fetal bovine serum (FBS, Cat NO. Z7181FBS, Batch NO. 42302202S) was from Zeta Life Inc. (California, USA). Penicillin-Streptomycin liquid (100×, Cat NO. P1400), trypsin digestion solutions (0.25%, without phenol red, Cat NO. T1350) and thioglycolate broth medium (Cat NO. LA8740) were from Solarbio Science & technology co., Ltd. (Beijing, China). Escherichia coli Lipopolysaccharides (LPS, Cat NO. L5293-2ML, Lot NO. 0000219279) and Adenosine 5’-triphosphate Sodium salt hydrate (ATP, Cat NO. A2383-1G, PCode 1001150755) were from Merck KGaA (Darmstadt, Germany). RNA fast 200 total RNA rapid extraction kit (Cat NO. 220011) was obtained from Shanghai Fastagen Bio-technology Co., Ltd (Shanghai, China). ReverTra AceTM qPCR RT Kit (Lot NO. 256200) was obtained from TOYOBO life science (Shanghai, China). TB Green Premix Ex Taq Ⅱ (Til RNaseH Plus, Cat NO. RR420A, Lot NO. AM81832A) was obtained from Takara Bio Inc. (Beijing, China). Deionizer water (18.2 MΩ/cm) was prepared from the Milli-Q purification system (Millipore, Bedford, MA, USA).
2.2. Animals
Sprague-Dawley (SD) rats (18/sex) were procured from Sipple-Bikai Laboratory Animal Co., LTD (Shanghai, China) at 2 months of age. C57BL/6 mice were procured from Slack Jingda Laboratory Animal Co., LTD (Hunan, China) at 2 months of age and kept in a specific pathogen free (SPF grade) system. Animals were kept in standard cages under 12 h light/dark cycle and provided with ad libitum access to water and food throughout the experimental period. Animal studies were conducted in accordance with the recommendations in the Guidelines for the Care and Use of Laboratory Animals and relevant Chinese laws and regulations. The experimental procedures and protocols for SD rats were approved by the Institutional Animal Care and the Use Committee of Shanghai Jiao Tong University (IACUC No. A2018075). The experimental procedures and protocols for C57BL/6 mice were approved by the Animal Ethics Committee of Guangxi Institute for Drug Control (IACUC No. LLSC20240301-1).
2.3. Preparation of solutions
NBDOEt, NBDCl, NBDSH and TBNBD stock solutions were prepared in methanol to a concentration of 5 mM. Ibuprofen stock solution was prepared in methanol to 1 mg∙mL-1.
Hypoxic deionizer water was prepared by ultrasonic degassing (15 min) in combination with nitrogen gas saturation (1 h). Na2S stock solution was prepared by dissolving Na2S∙9H2O crystal with hypoxic deionizer water in a plastic volumetric flask under nitrogen gas flow to make a concentration of 20 mM, the oxidized Na2S at the surface of the crystal was discarded before weighing by rinsing with the solvent and wiping dry; nitrogen gas was filled into the headspace of the volumetric flask and the stock solution was used within 30 min. Na2S calibration and quality control (QC) series working solutions were prepared by gradual dilution of the stock solutions with hypoxic deionizer water and kept on ice with no head space in Eppendorf (EP) plastic tubes.Considering compatibility with he mass spectrometer, all the reaction solvents at pH 6.5, 9.5, and 10.5 were prepared by adjusting the pH of ammonium acetate (NH4Ac) solution using ammonium hydroxide (NH4OH).
The reaction solvent for derivatization of TRSS in plasma was prepared by accurately weighing 38.54 mg of ammonium acetate into a 100 mL volumetric flask, dissolving and diluting to volume under nitrogen gas flow with hypoxic methanol that was saturated by nitrogen gas for 30 min, and then adjusting pH to 9.5 using ammonium hydroxide. Then, the derivatization solution was prepared by the addition of NBDCl and the internal standard ibuprofen into the reaction solvent under nitrogen gas flow to make a concentration of 150 μM and 50 ng∙mL-1, respectively.
2.4. Pretreatment of plasma samples
150 μL of the reaction solution was transferred into a 0.5 mL EP plastic tube under nitrogen gas flow, filled with nitrogen gas and capped. The blood sample was centrifuged at 12000 rpm for 3 min immediately after collection, and 30 μL of plasma was quickly added into the test tube containing 150 μL of reaction solution under nitrogen gas flow. It was filled with nitrogen gas, capped and reacted for 2 h on a decolorization shaker at 25 rpm (Room Temperature). Then, 5 uL of 40 mM Ethylene diamine tetra acetic acid (EDTA) was added into the reaction solution, followed by vortexing for 3 min and centrifugation at 12000 rpm (4˚C) for 10 min. The supernatant was finally analyzed by LC-MS/MS. The reaction solution should be protected from light at all times.The injection volume was 10 µl.
2.5. Method validation
2.5.1. Precision for derivatization of TRSS and linear relation between plasma NBDSH response and blood spiked H2S concentration
0.5, 1, 2, 5, 10, 20 and 50 μM Na2S series working solutions were prepared, and the H2S spiked blood calibration standards were prepared by quick addition of 25 μl Na2S working solution into 225 μl fresh rat blood under nitrogen gas flow and mixing by gently turning upside down five times. Each standard sample was prepared in triplicates and centrifuged at 12000 rpm for 3 min, then two replicates of 30 μl plasma were drawn from the supernatant under nitrogen gas flow and treated as described in section 2.4. The coefficient of variation (CV) of the NBDSH response at each concentration was calculated to assess the precision of derivatization. The net response of spiked H2S in plasma was obtained by subtracting the mean NBDSH response of six blank plasma samples from the NBDSH response of each plasma sample. The linearity for quantification of TRSS was assessed by plotting the mean net response of spiked H2S against the spiked concentration and fitting by least-squares linear regression.
2.5.2. Stability of TRSS in whole blood
35 μl of 1 and 40 μM Na2S stock solution was added into 315 μl freshly collected rat blood under nitrogen gas flow and mixed by gently turning upside down to make 0.1 and 4 μM H2S spiked blood samples, 12 samples were prepared at each level. At 0, 10, 20 and 30 min after spiked, 3 blood samples from each group were centrifuged at 12000 rpm for 3 min, and two replicates of 30 μl plasma were drawn from each blood sample under nitrogen gas flow and treated following the process in section 2.4.
2.5.3. Stability of TRSS in rat plasma
40 μl of 1 and 40 μM Na2S stock solution was added into 360 μl freshly collected rat plasma under nitrogen gas flow and mixed by vortex for 2 s to make 0.1 and 4 μM H2S spiked plasma samples. 6 samples were prepared at each concentration level. 30 μl plasma from each sample was treated following the process in section 2.4 at 3 min, 5 min, 10 min, 15 min, 20 min and 30 min after spiking.
2.5.4. Validation for detection of NBDSH in plasma
1, 2, 5, 10, 20, 50, 100 and 200 μM NBDSH calibration curve standard working solution and 3, 15 and 160 μM quality control (QC) standard working solution were prepared by gradual dilution of the NBDSH stock solution with methanol. Then calibration and QC standard plasma samples were prepared by the addition of 5 μl working solution into 45 μl plasma and mix by vortex. NBDSH aqueous standard solution was prepared by the addition of 5 μl working solution into 45 μl deionizer water and mixed by vortexing.
250 μl of methanol containing 50 ng∙mL-1 ibuprofen and 1 mmol∙L-1 EDTA was added into 50 μl of NBDSH standard samples, vortexed for 3 min and centrifuged at 12000 rpm for 10 min, and the supernatant was analyzed by LC-MS/MS.
Three groups of calibration and QC standard plasma samples were prepared and analyzed in 3 consecutive days. Linear regression analysis was performed between the concentration of NBDSH (x) and the ratio of the peak area of NBDSH to ibuprofen (y) using the Masslynx Software, and the weighting factor was 1/X. The intra- and inter-assay precision and accuracy were estimated based on the concentration of six replicates of QC samples at three levels predicted by the concomitant calibration curve. Standard deviation from the nominal values (RE) and CV were calculated for assessment of accuracy and precision, respectively. The absolute recovery (%) was determined by dividing the peak area of NBDSH or IS obtained from extracted plasma QC samples by those obtained from the aqueous standard solutions. The matrix effect was assessed at low and high concentration levels by comparing the peak areas of NBDSH or IS spiked in the supernatant, generated from protein precipitation of individual blank plasma from six different lots with those spiked in the aqueous standard solutions. Each sample was prepared in triplicates. To ensure that the unknown samples with a concentration exceeding the upper limit of quantification (ULOQ) could be accurately detected after dilution with the precipitation solvent to within the range of the calibration curve, NBDSH spiked rat plasma samples were prepared at 40 and 30 μM (2 and 1.5 fold of ULOQ, respectively) and diluted again right after precipitation with the precipitation solvent at dilution factors of 2 and 1.5 respectively. Dilution integrity was confirmed when mean analytical accuracy was between 85% and 115% with a CV ≤ 15%. The stability of processed samples after storage in the refrigerator (-20˚C) for 24 h, and in the autosampler for 2, 4, 6, 8, 12 and 24 h was also assessed. Samples were prepared at low and high QC levels in triplicates, and then analyzed on schedule in the company with newly prepared fresh calibration curve standards and QC samples. The stability was confirmed when accuracy was within ± 15% RE and precision within ±15% CV.
2.6. Pharmacokinetic study
Twelve rats were fasted for 12 h and randomly divided into two groups (n = 6) to receive Na2S at 5 and 10 mg∙kg-1, respectively. 19.5 and 9.7 mL sterile injection solvents were added through disposable medical syringes into 150 mg Na2S·9H2O to make 2.5 and 5 mg∙mL-1 Na2S injection, which were administered by tail vein injection right after dissolution. The injection of Na2S into rats was finished within 2 min but should not be fast in case the rats die of toxicity. Approximately 0.2 mL blood samples were collected from the posterior orbital venous plexus of the rats into 0.5 mL heparinized plastic EP tubes under nitrogen gas flow at 10, 5 and 0 min before dosing and 2, 4, 6, 8, 10, 15, 20, 30, 45, 60 and 120 min after injection. The test tubes were filled with nitrogen gas and centrifuged at 12000 rpm for 3 min right after blood sample collection, and 30 μl of plasma was immediately added into a test tube containing 150 μl derivatization reaction solution and treated as described in section 2.4.
2.7. Cell culture and activation of NLRP3 inflammasome
LPS was reconstituted in cell culture media and ATP in sterile water. The stock solutions were diluted in corresponding media to prepare intermediate concentration solutions and stored at −20˚C. 3% sterile thioglycolate broth medium was prepared by dissolving 3 g of solid thioglycolate broth medium in 100 mL deionized water and autoclave at 121° for 15 min.
Mice peritoneal macrophages were harvested from C57BL/6 mice (aged 10 weeks, mixed sex). Mice were given intraperitoneal injections of 3% sterile thioglycolate broth medium to induce peritoneal inflammation and euthanized by cervical dislocation after 3 days; then macrophages were collected by peritoneal lavage using 15﹢10 mL of serum-free RPMI 1640 medium. The collected cells were resuspended in RPMI-1640 medium supplemented with 10% FBS, 100 U/mL Penicillin and 100 µg∙mL-1 Streptomycin and plated in 6-well plates to a density of 2 × 10⁶ cells/well. Cells were cultured overnight at 37˚C under an atmosphere of 5% CO2 before use.
To activate the NLRP3 inflammasome, cells were primed with LPS (100 ng∙mL-1 for 4 h) followed by stimulation with ATP (5 mM, 30 min)[48-50]. Activation of NLRP3 inflammasome by priming with LPS was confirmed by the detection of the mRNA expression levels of Tnfa, Il1b and Il6 gens by reverse transcription quantitative real-time polymerase chain reaction (RT-qPCR). Mouse macrophage RNA was extracted using Fastagen RNA fast200 total RNA rapid extraction kit, and mRNA was converted to cDNA using TOYOBO ReverTra AceTM qPCR RT Kit according to the manufacturer’s instructions. qPCR reactions were performed on the BIO-RAD CFX96 Real-Time System based on the optimal concentrations of primers and probes recommended by the manufacturer. The thermal profile consisted of pre-denaturation at 95˚C for 1 min, then 40 cycles of denaturation at 95˚C for 10 s, annealing at 60˚C for 20 s, and extension at 72˚C for 30 s. This was plotted as a melting curve. The difference between samples was determined using glyceraldehyde-3-phosphate dehydrogenase (GAPDH) as internal standards. Data were analyzed using Bio-Rad CFX Manager Version 3.1.1517.0823. Oligonucleotide primers were shown in Table 1.
| Premier | Sequence |
|---|---|
| TNFa-F | 5’-CAGGCGGTGCCTATGTCTC-3’ |
| TNFa-R | 5’- CGATCACCCCGAAGTTCAGTAG-3’ |
| IL1b-F | 5’-GCAACTGTTCCTGAACTCAACT-3’ |
| IL1b -R | 5’- ATCTTTTGGGGTCCGTCAACT -3’ |
| Il6-F | 5’-TAGTCCTTCCTACCCCAATTTCC-3’ |
| Il6-R | 5’- TTGGTCCTTAGCCACTCCTTC -3’ |
| GAPDH-F | 5’-AGGTCGGTGTGAACGGATTTG-3’ |
| GAPDH-R | 5’-TGTAGACCATGTAGTTGAGGTCA-3’ |
qPCR: quantitative polymerase chain reaction, TNFa: Tumor necrosis factor alpha, IL1b: Interleukin-1 beta, IL6: Interleukin-6, GADPH: Glyceraldehyde-3-phosphate dehydrogenase.
For detection of TRSS, the cell culture medium was discarded, and cells were digested by adding 500 µl 0.25% trypsin solution into each well. Then 1 mL of cell culture medium was added to stop digestion, and the cell suspension was transferred to a 2 mL EP plastic tube and centrifuged at 1500 rpm for 5 min. The supernatant was discarded and 400 μL of derivatization solution (Section 2.3) containing 150 µM NBDCl and 150 ng∙mL-1 ibuprofen was added into the test tube under nitrogen gas flow. The test tube was filled with nitrogen gas, capped and put into a thermomixer for derivatization reaction (800 rpm, 25˚C). After the reaction, the reaction solution was centrifuged at 12000 rpm for 10 min and the supernatant was subjected to LC-MS/MS analysis. The injection volume was 5 µl.
2.8. LC–MS/MS analysis
LC-MS/MS detection of TRSS in rat plasma was performed on a triple quadrupole tandem mass Spectrometer (Micromass Quattro Ultima, Waters Corporation, Milford, MA, USA) coupled to the HPLC system (Waters 2695) through an electrospray ionization (ESI) source; MassLynx 4.1 software was used for system control, data acquisition and statistical Processing. Chromatographic separation was dependent on an Ultimate XB C8 column (50 mm × 4.6 mm, 5 μm). The mobile phase was methanol (A) and 5 mM ammonium acetate solution (B)the gradient program are shown in Table 2, only three-tenth of the post-column flow (1 mL∙min-1) was split into the EIS source by a three-way cock. Ibuprofen was used as the internal standard. The analytes were detected under the negative ion mode using multiple reaction monitoring (MRM). The mass spectrometric parameters were optimized as in Table 3.
| Time (min) | A | B |
|---|---|---|
| 0 | 10 | 90 |
| 1.5 | 95 | 5 |
| 4 | 95 | 5 |
| 4.1 | 10 | 90 |
| 6 | 10 | 90 |
NBDCl: 4-chloro-7-nitro-2,1,3- benzoxadiazole, NBDSH: 7-nitrobenzofurazan-4-thiol, TBNBD: 4’ -Thiobis (7-nitro-2,1,3- benzoxadiazole).
| Mass spectrometry parameter | Unit | Value |
|---|---|---|
| Cone voltage | V | 30 |
| Capilary voltage | kV | 3.2 |
| Source temperature | ˚C | 120 |
| Desolvation temperature | ˚C | 350 |
| Desolvation gas flow | L/hr | 700 |
| NBDCl channel | m/z | 199→165 (CE 15 eV |
| NBDSH channel | m/z | 196→150 (CE 15 eV) |
| TBNBD channel | m/z | 359→314 (CE 15 eV) |
| ibuprofen channel | m/z | 206→161 (CE 8 eV) |
| Dwell time | s | 0.33 |
NBDCl: 4-chloro-7-nitro-2,1,3-benzoxadiazole, NBDSH: 7-nitrobenzofurazan-4-thiol, TBNBD: 4’-Thiobis (7-nitro-2,1,3-benzoxadiazole).
LC-MS/MS detection of TRSS in macrophages was performed on Shimadzu LCMS-8050 triple quadrupole tandem mass Spectrometer equipped with the LabSolutions software Shimadzu Corporation, Kyoto, Japan. Chromatographic separation was dependent on an Ultimate XB C8 column (2.1 × 100 mm, 1.8 μm), the mobile phase and gradient program was the same as that in detection of rat plasma sample except that the flow rate was 0.3 mL∙min-1. ESI was performed in the negative ionization mode with a spray capillary voltage of -3 kV. The detector voltage was 1.68 kV. The temperatures of the interface, drying gas, desolvation line and heat block were 300, 526, 250, and 400˚C, respectively. The nebulizing gas flow, heating gas flow, and drying gas flow were 3, 10, and 10 L/min, respectively. Collision-induced dissociation gas pressure was set to 270 kPa. Collision energies for MRM of NBDSH, TBNBD, NBDCl and ibuprofen were 14, 12, 9 and 9 eV, respectively.
3. Results and Discussion
3.1. Assay development
In our previous work, we established an LC-MS/MS method for quantification of H2S in Na2S·9H2O bulk drug and injection based on derivatization with NBDOEt [45]. The method was subsequently applied to the detection of H2S in rat plasma. Considering the extra consumption of the probe by the sulfides in plasma, probe concentration was optimized for the new matrix. Since the optimal reaction concentration of NBDOEt with H2S at pH 10.5 was 30 μM in our previous work, we observed the response of NBDSH in blank plasma, 2 μM Na2S aqueous solution and 2 μM Na2S spiked plasma sample by reaction with 30, 100, 200, 500, 1000, 2000 and 5000 μM NBDOEt. Consistent with the results of our previous work, the response of aqueous samples was suppressed when the concentration of NBDOEt exceeded 100 μM. The peak area of NBDSH in H2S spiked plasma samples was even lower than that in the blank plasma when the concentration of NBDOEt was lower than 100 μM, and the NBDSH response was suppressed when the concentration of NBDOEt was higher than 2 mM. The NBDSH response of blank plasma and 2 µM H2S spiked plasma samples by reaction with 200-5000µM NBDOEt are shown in Figure S1. Then, plasma samples were treated using 2 mM NBDOEt. However, when using this optimized concentration, the recovery of H2S from plasma was 66.4%, 9.6% and 5.6% (n=3) at 0.1, 1 and 10 μM, respectively, which could not be improved by the addition of ascorbic acid, DTT or TCEP. And the reproducibility of the NBDSH peak area was very poor. The recovery of different concentrations of H2S from rat plasma by reaction with 2 mM NBDOEt are shown in Table S1. According to our previous work, the reaction of NBDOEt with H2S was less interfered by sulfur compounds, meaning NBDOEt showed stronger specificity to H2S than other NBD probes [45]. Therefore, we could speculate that once added to the biomatrix or produced in vivo, H2S would soon be transformed into other forms that could not react with H2S specific probe and could not be reduced back to H2S by addition of dithiothreitol (DTT) or tris(2-carboxyethyl)phosphine (TCEP).
We have also found in our previous work that the ratios of the NBDSH response of blank plasma to that of 2 µM H2S aqueous solution for NBDCl was 123.5% [45], indicating that NBDCl could react with bound sulfide species in rat plasma to form the same reaction product as with H2S. Therefore, we try to detect TRSS in vivo using NBDCl as the derivatization reagent after administration of exogenous H2S. The optimal reaction pH for H2S and NBDCl in our previous work was 10.5 (0.1% NH4OH methanol solution) [45], however, the recovery of TRSS was improved in company with better precision when 5 mM ammonium acetate was added into the reaction solvent, the results are shown in Table S2. Even though in 0.1% NH4OH 5 mM NH4Ac methanol solution, H2S aqueous standard solutions could not react with NBDCl efficiently, the reaction efficiency of plasma sulfane sulfur with NBDCl was improved. We speculate that NBDCl was hydrolyzed in the alkaline methanol solution and the intermediate product NBDOMe could react faster with H2S, which would explain the faster reaction rate of H2S with NBDCl at higher pH in aqueous solution [51]. However, in the plasma, sulfane sulfur makes up the major part of TRSS and it may react with NBDCl more efficiently than with NBDOMe or the final hydrolysate NBDOH to produce NBDSH, and 0.1% NH4OH 5 mM NH4Ac methanol solution could provide the alkaline environment for reaction of sulfane sulfur with NBDCl but also inhibit dramatic hydrolysis of NBDCl. As mentioned in the “Introduction” section, Schilling et al. [44] have shown that when some alkylating agents were used to trap persulfides, the resulting persulfide adducts (R-S-S-Alk) would soon be converted into thioethers (R-S-Alk) due to sulfur deprivation by ambient nucleophiles, the nature of the alkylating agent determines the ability of nucleophiles to deprive the thiosulfoxide of the sulfane sulfur atom [44]. Since we could not detect appropriate amounts of R-S-S-NBD or R-S-S-S-NBD by mass scan when fresh rat plasma sample was extracted with NBDCl reaction solution, we could speculate that NBDCl could not form stable alkylated intermediates with sulfane sulfur, the sulfur atom of the intermediates was deprived by NBDCl itself to form NBDSH given that NBDCl is a better nucleophilic acceptor than other ambient nucleophiles. The proper reaction mechanism for NBDCl and sulfane sulfur is shown in Figure 1.
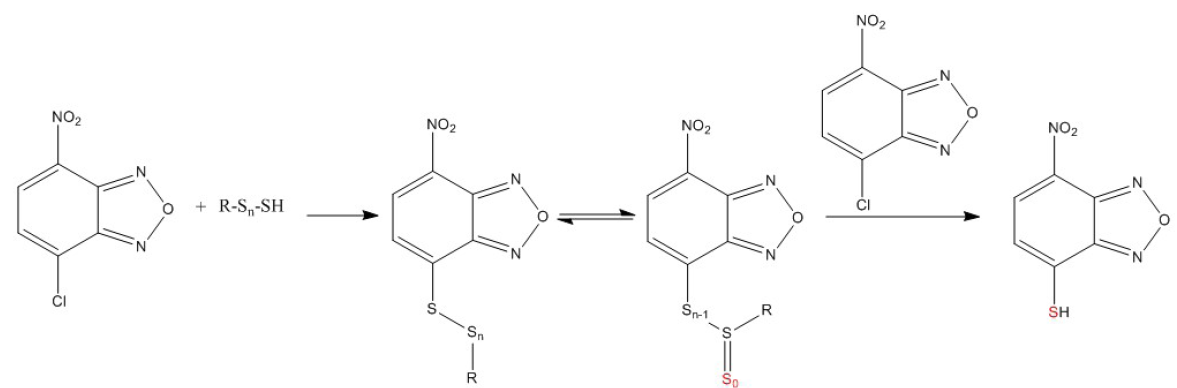
- Proper reaction mechanism for 4-chloro-7-nitro-2,1,3-benzoxadiazole (NBDCl) and sulfane sulfur (n=1).
Then the reaction concentration of NBDCl was optimized for detection of TRSS in plasma. We observed the response of NBDSH by reaction of 2 μM Na2S spiked plasma sample with 30, 50, 100, 150 and 500 μM NBDCl and found that the signal of NBDSH plateaued at 100 μM and suppressed at 500 μM, the results are shown in Figure S2. Considering the application of the method to detect samples with TRSS concentration higher than 2 μM, the concentration of NBDCl used in our method was set as 150 μM.
In our previous work, 1 mM EDTA was added into the samples to improve the precision of NBDSH, which contains a thiol group that would cause absorption of NBDSH onto the metal surface of the instrument pipeline. Therefore, in this work, 1 mm EDTA was also added into plasma samples after reaction with NBDCl to improve recovery and precision of NBDSH. Moreover, we found in our experiment that excess oxygen presented in the reaction solvent would impair the precision of NBDSH peak area probably through perturbing the initial redox equilibrium of the sulfane sulfur species. Since the simple application of nitrogen-saturated reaction solution was enough to eliminate the reduction in precision, there’s no need to perform all the derivatization steps in a glove box filled with nitrogen gas. Therefore, to eliminate the influence of oxygen on the detection of TRSS, the solvents for NBDCl and Na2S were degassed by ultrasonic for 15 min and saturated with nitrogen gas for more than 1 h, 0.5 mL EP plastic tube was used to reduce the volume up the reaction solution, and the reaction solution was added into tubes under nitrogen gas flow and the lid was capped before use. The matrix samples were also added into the reaction solvent under nitrogen gas flow to avoid the sharp rise of oxygen content in the reaction solution. Even though oxygen gas would continuously slip into the capped test tube, or the opened test tube protected under nitrogen gas flow, protection of the reaction solvent with nitrogen gas still met the requirement of our sample processing. The precision of NBDSH peak area in 0.5 and 2 µM H2S spiked plasma samples by derivatization with NBDCl in a normal and hypoxic reaction solvent are shown in Table S3.
According to US Food and Drug Administration (FDA) guidance for industry “Bioanalytical Method Validation and Study Sample Analysis”, the calibration curve should be prepared by fresh matrix spiked calibration standards. For analysis of endogenous molecules (e.g., replacement therapies), the accuracy of the assay constitutes a difficulty when the method cannot discriminate between the therapeutic agent and the endogenous molecule [47]. Considering that surrogate matrix and surrogate analyte were unattainable for sulfane sulfur and H2S, in this study, the concentration of TRSS in the pharmacokinetic study of an H2S donor was calibrated using NBDSH spiked plasma standard curve and the background subtraction approach was used to determine the concentration of the analyte in the test samples [46,47]. Typical chromatograms of blank rat plasma, rat plasma sample obtained after injection of Na2S and Na2S standard solution after derivatization with NBDCl are shown in Figure 2. The retention time of NBDSH, NBDCl, TBNBD and ibuprofen were 2.34, 2.8, 3.0 and 2.98 min respectively. Even though there was cross-talk between NBDCl/TBNBD and NBDSH due to their common structural fragment, the detection of NBDSH was not interfered with by NBDCl and TBNBD since they could be separated by chromatography. And TBNBD was undetected in biological samples.
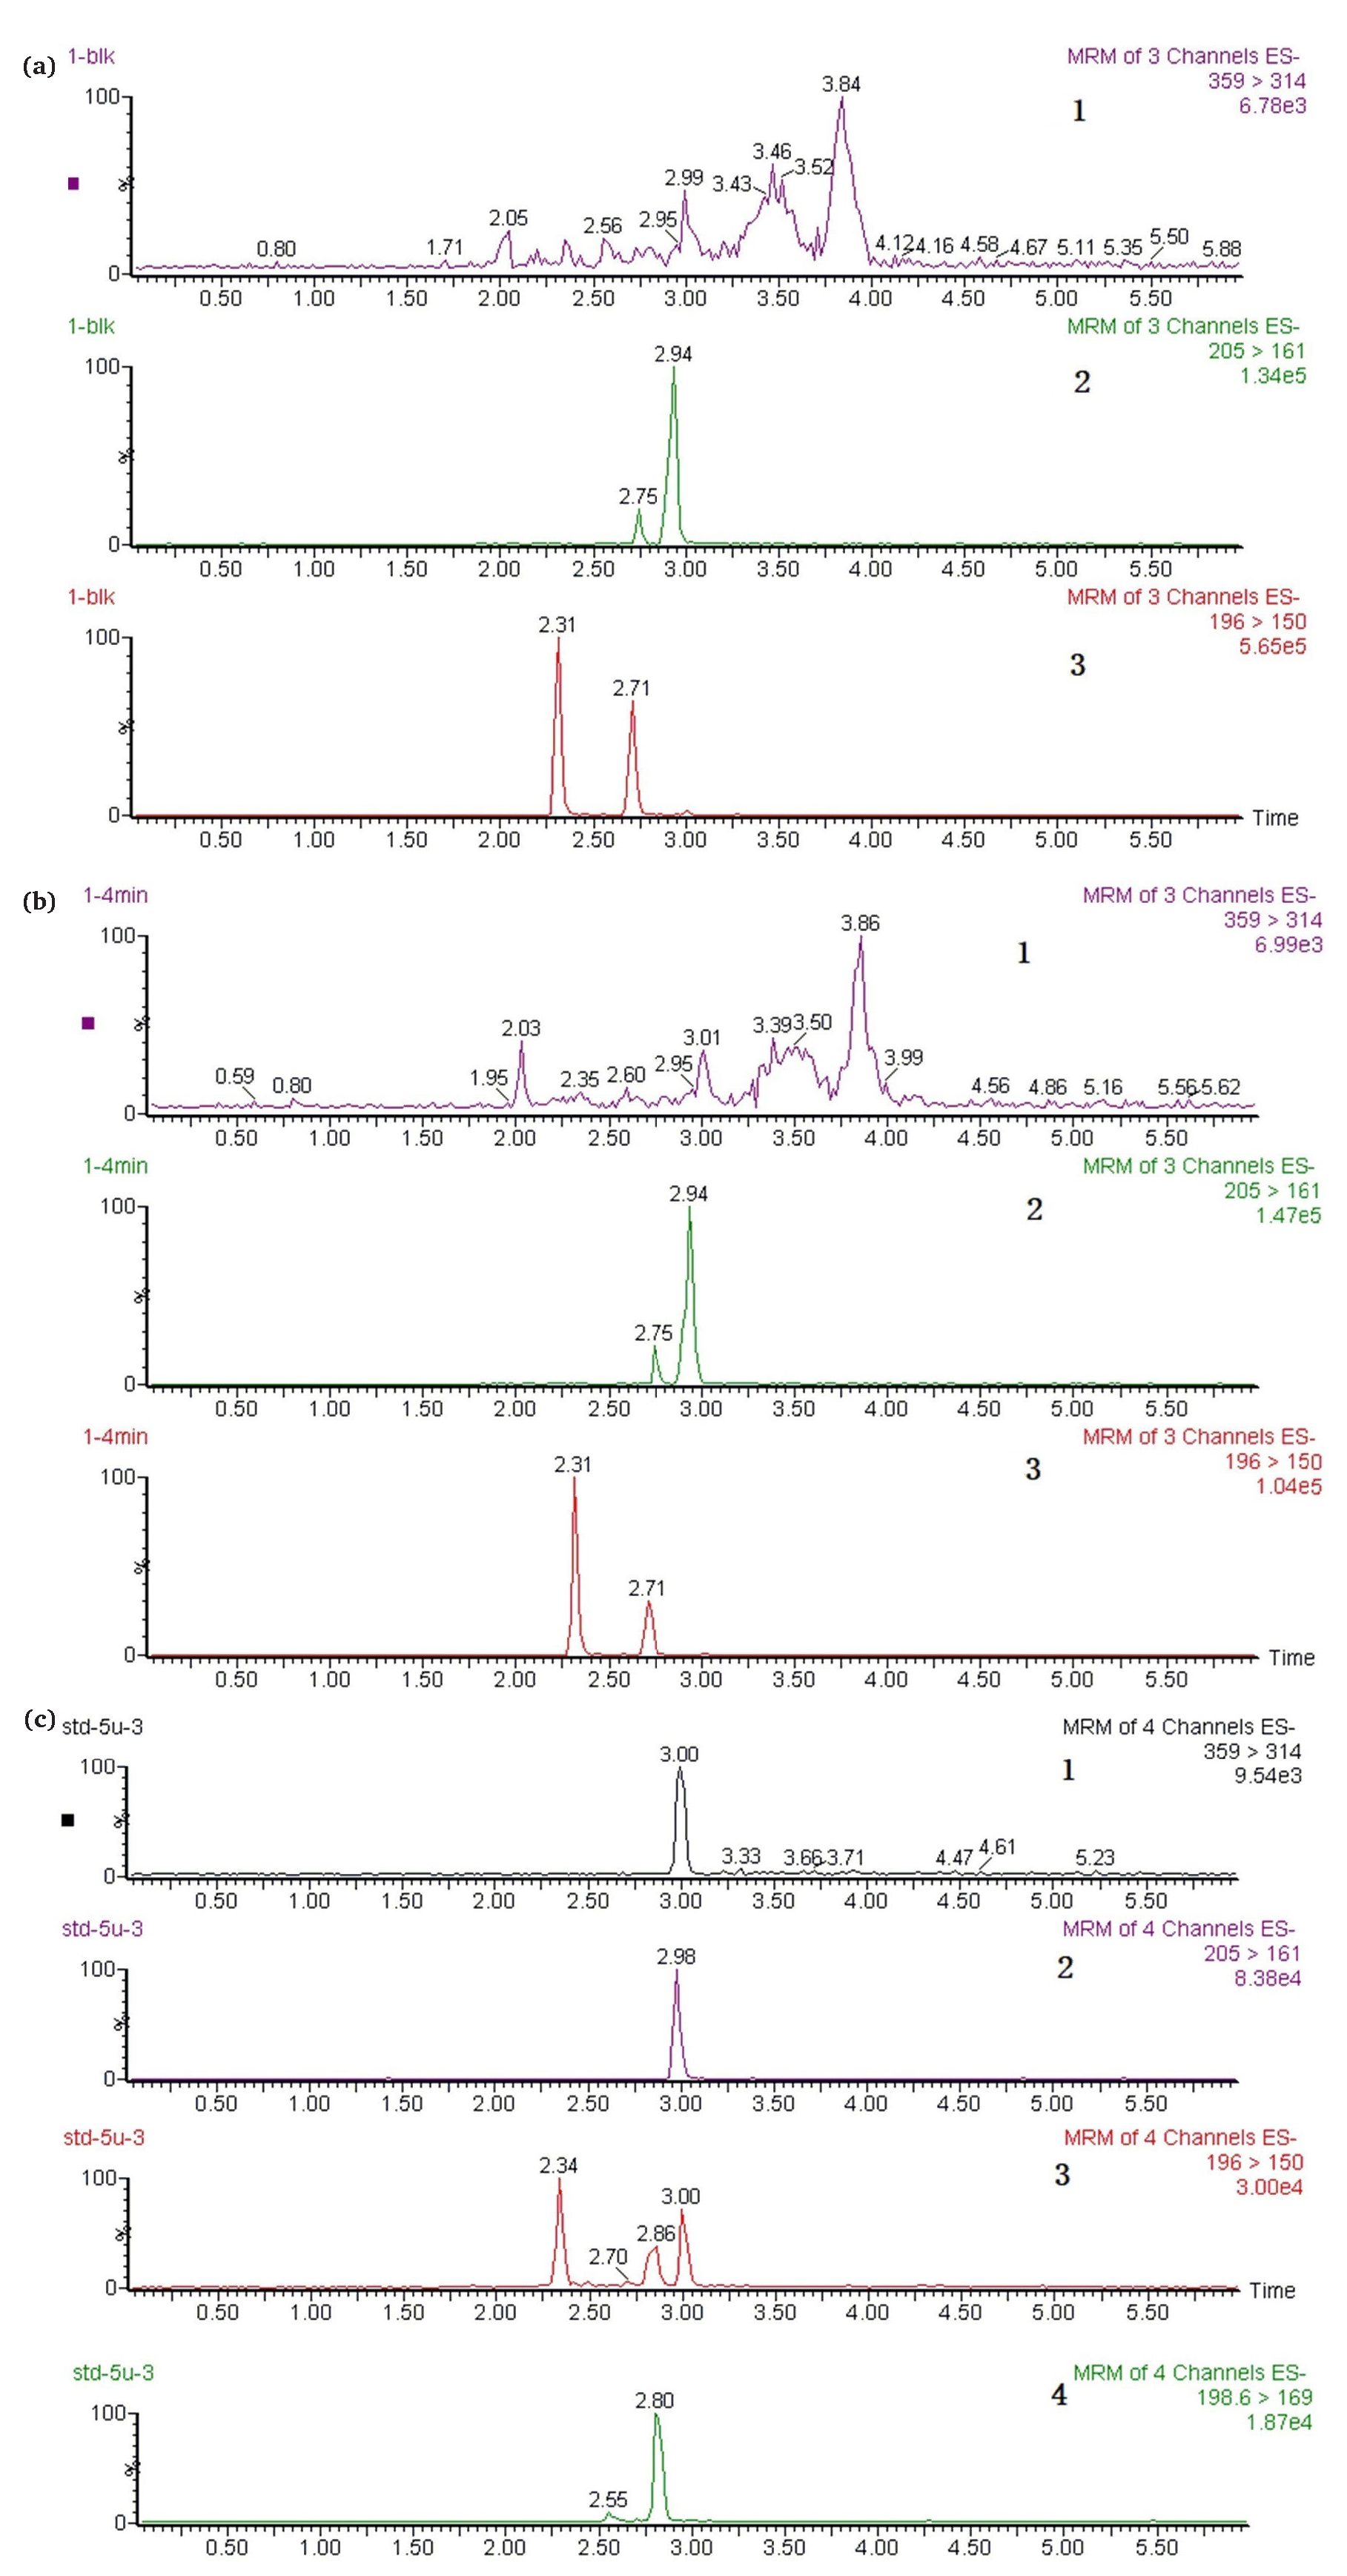
- Representative multiple reaction monitoring (MRM) chromatograms of (a) blank rat plasma, (b) rat plasma sample obtained 4 min after tail intravenous injection of Na2S 5 mg∙kg-1, (c) 5 μM Na2S standard solution after derivatization with NBDCl. (1: TBNBD channel; 2: IS channel; 3: NBDSH channel; 4: NBDCl channel.) NBDCl: 4-chloro-7-nitro-2,1,3- benzoxadiazole, NBDSH: 7-nitrobenzofurazan-4-thiol, TBNBD: 4, 4’ -Thiobis (7-nitro-2,1,3-benzoxadiazole), IS: the internal Standard, ibuprofen.
3.2. Method validation
3.2.1. Precision for derivatization of TRSS and linear relation between plasma NBDSH response and blood spiked H2S concentration
The precision for derivatization of TRSS was assessed by calculating the CV of NBDSH response at each concentration, and the results are shown in Table 4. The percentage relative standard deviations (% RSD) of the NBDSH peak area were within 15%. The mean NBDSH response of plasma samples at each concentration level was plotted against the spiked concentration, and the regression equation fit by least-squares linear regression was y=1.1793x+1046.8, the square correlation coefficient (R2) was 0.9692. We could speculate that the NBDSH response of TRSS in rat plasma by reaction with NBDCl is linearly correlated with the blood-spiked H2S concentration. However, the linearity correlation coefficients do not meet the requirement of precise quantification (r2>0.99) because the surrogate matrix or surrogate analyte was not available for the construction of calibration standards. Therefore, to eliminate the interference of the matrix effect on the detection of TRSS in plasma, NBDSH spiked calibration standard plasma samples would be used for the quantification of TRSS in rat plasma in this study.
| level | Mean NBDSH area | RSD | Mean subtracted NBDSH area |
|---|---|---|---|
| blank | 7600.080±801.410 | 10.54 | - |
| 50 | 8238.211±456.147 | 5.54 | 638.131 |
| 100 | 8348.350±749.261 | 8.94 | 784.271 |
| 200 | 9112.611±586.004 | 6.43 | 1512.532 |
| 500 | 9560.856±473.568 | 4.95 | 1960.776 |
| 1000 | 9843.476±643.309 | 6.54 | 2243.396 |
| 2000 | 11520.882±671.834 | 5.83 | 3920.802 |
| 5000 | 14304.378±1585.241 | 11.08 | 6704.298 |
TRSS: Termed total reactive sulfide species, RSD: Relative standard deviations, NBDSH: 7-nitrobenzofurazan-4-thiol.
3.2.2. Stability of TRSS in rat whole blood and plasma
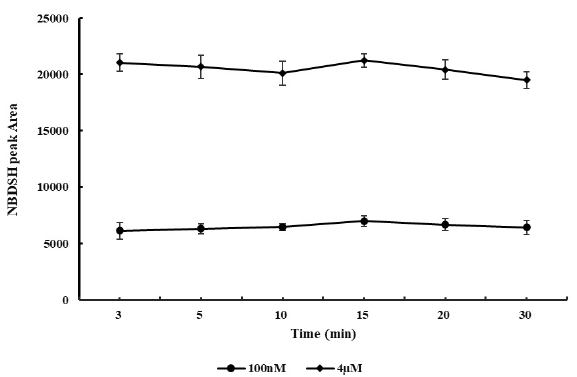
Stability assessment of TRSS in rat whole blood and plasma are shown in Figure 3 and Figure 4, respectively. RSD for the NBDSH peak area of all sample groups were within 15%. Despite minor fluctuation at 10 min after spiked, NBDSH response in 100 nM and 4 µM H2S spiked blood and plasma samples were considered stable for at least 30 min, the detected NBDSH peak area could represent the actual level of TRSS in vivo. Better precision would be obtained by preparation of sample by centrifugation for only 3 min, immediately after blood collection, protection by filling the test tube with nitrogen gas, and detection immediately right after centrifugation.
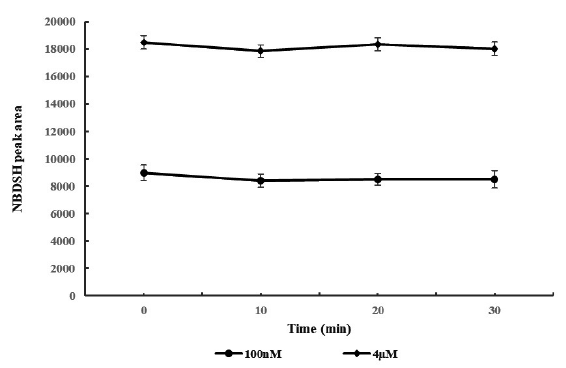
- Stability of termed total reactive sulfide species (TRSS) in 0.1 and 4μM H2S spiked blood samples (n=6).
- Stability of termed total reactive sulfide species (TRSS) in 0.1 and 4 μM H2S spiked blood samples (n=6). NBDSH: 7-nitrobenzofurazan-4-thiol.
3.2.3. Validation for detection of NBDSH in plasma
The calibration curve of NBDSH showed good linearity in 0.1∼20 μM (H2S 3.4 ∼680 ng∙mL-1), the linear regression equation was Y = 0.39625X - 0.0212402, the correlation coefficient was R2= 0.995. The percentile deviations for each concentration point were within acceptable limits, as recommended by the US FDA guidelines for method validation (US FDA, 2022). Accuracy and precision data for intra- and inter-day plasma samples for NBDSH are presented in Table 5, all the values were within acceptable limits (CV ≤ 15%, RE within ±15%). The absolute recovery (%) of NBDSH in rat plasma were 119.26 ± 4.21%, 86.75 ± 6.17%, and 81.41 ± 8.33% at 0.3, 1.5, and 16 μM, respectively (n = 6); the average absolute recovery of IS was 94.79 ± 3.09%, as shown in Table 6. The results of the matrix effect assessment are shown in Table 7. The matrix effects of NBDSH and IS were within acceptable limits (RE 85%–115%), indicating that the ionization of NBDSH and IS was not affected by plasma constituents and other co-eluted impurities. The precision for back-calculated concentrations of 2 and 1.5 times diluted test samples was with ±15% CV, and the accuracy was within ± 15% RE. Therefore, in the pharmacokinetic study, the plasma samples with a concentration exceeding 20 μM could be diluted with the precipitation solvent without affecting the final concentrations. NBDSH in processed samples was found to be stable in the refrigerator (-20˚C) and autosampler (15˚C) for 24 h, as shown in Table 8, the CV and RE were within the acceptable limit.
| Cnorminal (µM) | Inter-day | Intra-day | |||||
|---|---|---|---|---|---|---|---|
| Cmeasured (µM) | Accuracy | RSD | Cmeasured (µM) | Accuracy | RSD | ||
| LQC | 0.3 | 0.271±0.016 | 90.33±5.39 | 5.96 | 0.285±0.020 | 94.93±6.77 | 7.13 |
| MQC | 1.5 | 1.502±0.095 | 100.14±6.30 | 6.29 | 1.508±0.055 | 100.56±3.70 | 3.67 |
| HQC | 16 | 15.621±0.763 | 97.63±4.77 | 4.89 | 15.308±0.540 | 95.67±3.37 | 3.53 |
NBDSH: 7-nitrobenzofurazan-4-thiol, RSD: Relative standard deviations, LQC: Low quality control, MQC: Medium quality control, HQC: High quality control.
| LQC | MQC | HQC | IS | |
|---|---|---|---|---|
| Area of QC samples(n=6) | 1376.882 ± 48.625 | 6188.522 ± 440.105 | 45772.471 ± 4682.354 | 6291.463 ± 185.693 |
| Area of pure solutions(n=3) | 1154.567 ± 36.311 | 7133.538 ± 719.757 | 56224.714 ± 1029.323 | 6638.484 ± 201.750 |
| Mean absolute recovery (%) | 119.26 ± 4.21 | 86.75 ± 6.17 | 81.41 ± 8.33 | 94.79±3.09 |
QC: Quality control, NBDSH: 7-nitrobenzofurazan-4-thiol, LQC: Low quality control, MQC: Medium quality control, HQC: High quality control, IS: Internal standard.
| Matrix effect (%) | NBDSH | IS | ||
|---|---|---|---|---|
| LQC | HQC | |||
| Matrix | 1 | 109.39±5.40 | 89.69±2.49 | 93.39±3.06 |
| 2 | 107.00±7.40 | 90.31±4.39 | 94.40±2.68 | |
| 3 | 108.20±8.83 | 88.44±5.71 | 95.96±3.37 | |
| 4 | 110.76±4.72 | 91.14±4.88 | 92.24±3.77 | |
| 5 | 106.76±6.61 | 89.41±2.66 | 96.33±1.93 | |
| 6 | 111.26±4.52 | 89.36±3.40 | 93.49±3.42 | |
NBDSH: 7-nitrobenzofurazan-4-thiol, LQC: Low quality control, HQC: High quality control.
| Storage conditions | Level | Cnominal (µM) | Cmeasured (µM) | Accuracy (RE, %) | Precision (RSD, %) | |
|---|---|---|---|---|---|---|
| 2h | LQC | 0.3 | 0.311±0.020 | 103.78±6.50 | 6.26 | |
| Autosampler | HQC | 1.6 | 15.672±0.279 | 97.95±1.74 | 1.78 | |
| 4h | LQC | 0.3 | 0.301±0.013 | 100.22±4.34 | 4.33 | |
| HQC | 1.6 | 15.628±0.032 | 97.67±0.20 | 0.20 | ||
| 8h | LQC | 0.3 | 0.276±0.011 | 92.00±3.67 | 3.99 | |
| HQC | 1.6 | 14.943±0.144 | 93.40±0.90 | 0.96 | ||
| 12h | LQC | 0.3 | 0.271±0.016 | 90.33±5.24 | 5.80 | |
| HQC | 1.6 | 15.354±0.235 | 95.96±1.47 | 1.53 | ||
| 24h | LQC | 0.3 | 0.265±0.008 | 88.44±2.59 | 2.93 | |
| HQC | 1.6 | 15.407±0.060 | 96.29±0.37 | 0.39 | ||
| -20 in refrigerator | LQC | 0.3 | 0.305±0.011 | 101.67±3.61 | 3.55 | |
| HQC | 1.6 | 15.341±0.132 | 95.88±0.82 | 0.86 | ||
NBDSH: 7-nitrobenzofurazan-4-thiol, RE: Standard deviation from the nominal values, RSD: Relative standard deviation, LQC: Low quality control, HQC: High quality control.
3.3. Application of the assay in pharmacokinetic study of H2S in rats
The development of H2S donors for the treatment of diseases will benefit from a reliable method for the determination of TRSS in blood, tissues and cells. Despite the controversy in the baseline level of reactive sulfide concentration in blood, cells and tissues in most studies focused on H2S detection. A short half-life of available blood sulfide and a dose-dependent relationship between H2S administration and subsequent elevation of sulfide availability were consistently observed in most pharmacokinetic studies [15,17,20]. In this study, after a single dose injection of 5 mg∙kg-1 and 10 mg∙kg-1 Na2S, TRSS in rat plasma was trapped by NBDCl and calculated by NBDSH plasma calibration curve. Baseline levels of TRSS were determined to be approximately 20 µM, and intravenous bolus dosing of Na2S also resulted in a dose-dependent increase in plasma TRSS levels. The P-value of the Student’s t-test for the two groups of mean plasma concentration of TRSS at different time points was 0.001. The mean plasma concentration-time curve of TRSS after bolus injection of Na2S at different doses is shown in Figure 5. The results show that the concentration of TRSS reached the peak value (27 µM) at 4 min after administration of 5 mg∙kg-1 Na2S and fell back to the base level at 10 min; the peak TRSS concentration in the 10 mg∙kg-1 Na2S dose group (36 µM) occurred at 10 min and fell back to a new base level at 30 min. We could see that in the 5 mg∙kg-1 dose group, the mean concentration of TRSS at 45 min (15 µM) was lower than the initial base level (20 µM) before Na2S administration, however, in the 10 mg∙kg-1 dose group, the mean concentration of TRSS at 60 min (approximately 24 µM) was much higher than the initial base level. The former phenomenon could be attributed to the overwhelming detoxification enzyme system, while the latter attributed to the saturation of detoxification capability. The difference in the pharmacokinetic property of Na2S at different dosages indicates that the natural defense mechanism may respond to the toxic H2S by increasing production of enzymes involved in its metabolism, which is consistent with the results by Osipov et al. [16] Therefore, caution should be given to the release kinetics when designing H2S donors. Our method would be a powerful tool to assess the druggability of newly designed controlled release preparation of H2S.
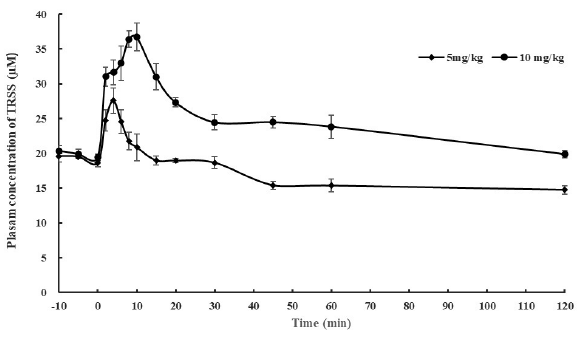
- Mean plasma concentration-time curve of termed total reactive sulfide species (TRSS) in rats after tail vein injection of Na2S at dose of 5 and 10 mg·kg-1. P=0.001 by Student’s t-test for the mean plasma concentration of TRSS across time points between two dose groups.
3.4. The level of TRSS in mice macrophages decreased after activation of NLRP3 inflammasome
The method was also applied for the detection of TRSS in mice peritoneal macrophages. Typical chromatograms of NBD derivatives and the internal standard obtained by extraction of LPS and ATP-stimulated macrophages with the derivatization solution containing NBDCl and ibuprofen are shown in Figure 6. The retention time of NBDSH, NBDCl, TBNBD and ibuprofen were 2.33, 2.7, 2.9 and 2.75 min, respectively. We could see that the retention time of NBDSH was stably reproduced on different instruments using different columns when the solid phase material, the mobile phase and the chromatographic elution gradient were kept unchanged, and there was no interference from the matrix appearing at the retention time of NBDSH.
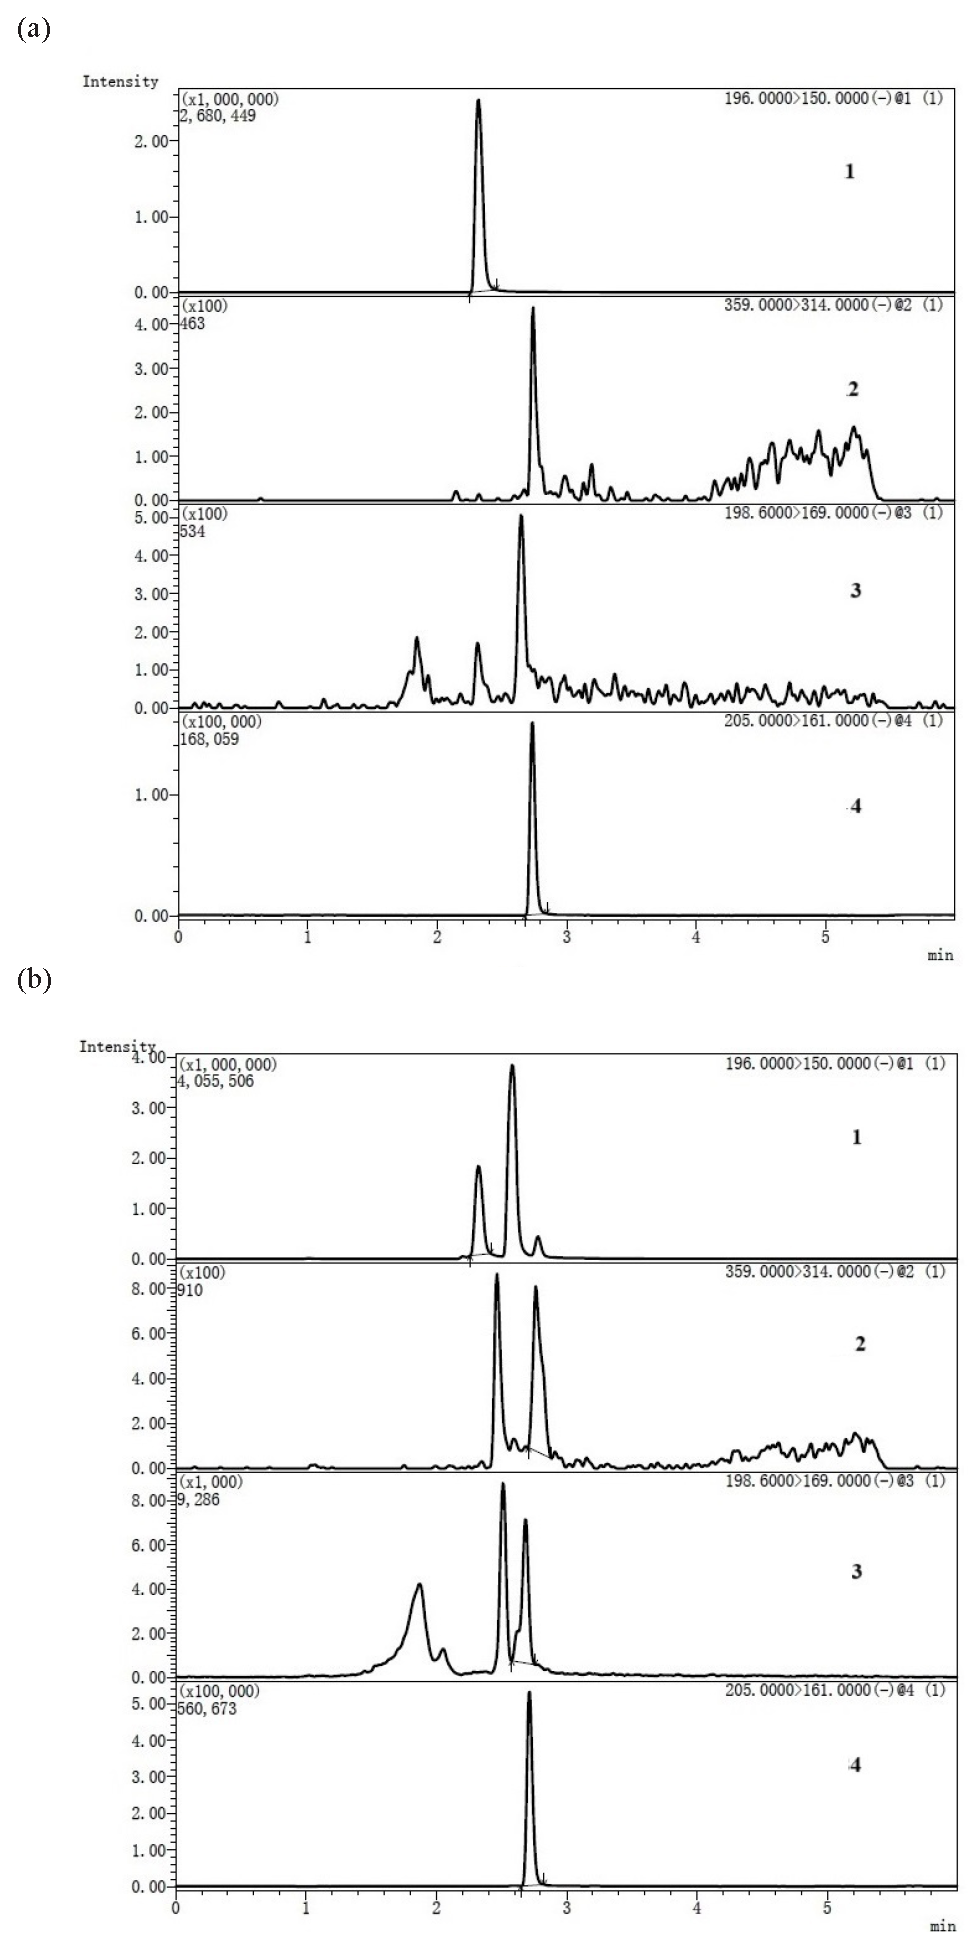
- Representative multiple reaction monitoring (MRM) chromatograms of NBDSH(1), TBNBD(2), NBDCl(3) and ibuprofen(4) by analyzing (a) the aqueous standard solution containing 500 nM of NBDSH and 100 ng∙mL-1 of ibuprofen; (b) the extraction solution of LPS (100 ng∙mL-1, 4h) and ATP (5 mM, 30min) stimulated macrophages with the derivatization solution containing 150 μM NBDCl and 150 ng∙mL-1 ibuprofen. NBDCL: 4-chloro-7-nitro-2,1,3- benzoxadiazole, NBDSH: 7-nitrobenzofurazan-4-thiol, TBNBD: 4’ -Thiobis (7-nitro-2,1,3- benzoxadiazole).
Activation of NLRP3 inflammasome in mice peritoneal macrophages by priming with LPS was confirmed by detection of the mRNA expression level of Tnfa, Il1b and Il6 genes by RT-qPCR. As shown in Figure 7, the mRNA level of Tnfa and Il1b were significantly elevated 2 hrs after priming; after priming for 4 hrs, the mRNA level of Tnfa reached a maximum, and the mRNA level of Il1b and Il6 were also approximate to the maximum level. Therefore, we activated the NLRP3 inflammasome using ATP at 4 hrs after priming with LPS.
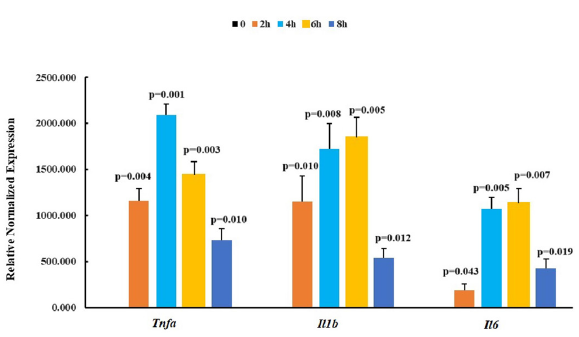
- Relative normalized expression of Tnfa, Il1b and Il6 in mice peritoneal macrophages after primed with 100ng∙mL-1 LPS. n=3, P value was calculated by Student’s t-test. NBDSH: 7-nitrobenzofurazan-4-thiol, LPS: Escherichia coli Lipopolysaccharides, ATP: Adenosin 5’-triphosphate.
The method was applied to the detection of the change in TRSS in mice peritoneal macrophages. As shown in Figure 8, the level of TRSS (NBDSH peak area normalized by the area of the internal standard) decreased after activation of the NLRP3 inflammasome (P=0.03 by Student’s t-test), which is consistent with the result in the study by Bronowicka-Adamska et al. that say, stimulation of murine J774A.1 cell line (macrophage) with LPS or interferon-gamma (IFNγ) after 24 h resulted in a decrease in H2S levels [52]. There are very few reports focused on H2S levels in LPS-activated macrophages. Even though it has been reported that activation of macrophages by LPS contributed to higher mRNA levels of CSE, H2S concentration in those studies was not detected, or only free H2S was detected using amperometric microsensor [53-55]. Moreover, a high CSE mRNA level does not necessarily imply a high H2S level. Mikami et al. have reported that H2S production in cells is catalyzed by CSE at the steady state and is suppressed given increased intracellular Ca2+ concentrations [56]. Fortuitously, the flux of Ca2+ into the cytosol is a critical upstream event in NLRP3 activation.
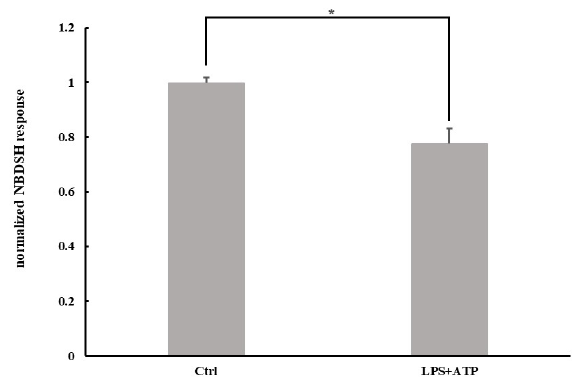
- The level of termed total reactive sulfide species (TRSS) in mice peritoneal macrophages was decreased after priming with 100 ng∙mL-1 LPS for 4 h following stimulation with 5 mM ATP for 30 min. *p=0.03 by Student’s t-test.
The unifying NLRP3 activators, including viral, bacterial and fungal infections, as well as endogenous damage-associated molecular patterns (DAMPs) and environmental irritants which mediated sterile inflammation, all induce cellular stress, which is then sensed by NLRP3. Exactly how the NLRP3 receptor senses cellular stress and which pathways work in to terminate NLRP3 activation and inflammasome assembly remains unclear. Since most NLRP3 activators also induce ion fluxes and organelle damage, it is hard to know whether mitochondrial dysfunction and mitochondrial reactive oxygen species (mtROS) are crucially involved or just associated with NLRP3 activation [57]. It has been supported by increasing evidence that redox-sensitive protein cysteine residues may act as oxidant sensors [58]. At physiological pH, protein cysteine residues with low pKa exist mainly as thiolate anions (S-) which behave as strong nucleophiles and can generate the sulfenic acid (SOH) form (termed protein S-sulfenylation) by reaction with ROS. The sulfenic form can be irreversibly oxidized into the sulfinic acid (SO2H) or sulfonic acid (SO3H) forms or react with HS- or H2S to form a per sulfide bond, the latter has been termed protein S-sulfhydration or per sulfidation [59]. Theoretically, the balance between H2S and ROS determines the redox state of protein cysteine residues, which then affect the function of the redox-regulated protein. It has been reported that in superoxide dismutase 1 (SOD1) -deficient macrophages, the activity of caspase1, a proteinase-activated in response to microbial and ‘danger’ signals by assembling inflammasomes, was specifically inhibited due to reversible oxidation and glutathionylation of the cysteine residues Cys397 and Cys362, which could be contributed to decreased cellular redox potential caused by higher superoxide production [60]. In addition, Mishra et al. also reported that IFN-γ stimulated NO-suppressed IL-1β maturation by suppression of inflammasome activity via S-nitrosylation [61]. Moreover, Carroll and coworkers have established proteomics workflows to reveal the dynamic response of S-sulfenylation and S-sulfinylation to oxidative stress and moderate overlapped proteins were observed with disulfide, S-glutathionylation, and S-nitrosylation proteomes [62-64]. Since soluble macromolecules constitute a considerable proportion of the total cell volume, protein modification could explain the plethora of effects H2S exhibits. The response of TRSS by derivatization with NBDCl, indicates the relative reactivity of protein polysulfides with the alkylating agent, could reflect the amount of total redox-sensitive cysteine residues. Therefore, monitoring the fluctuation of total TRSS in macrophages after activation of NLRP3 inflammasome would be helpful to uncover the role of H2S and ROS in the signaling transduction pathways involved in NLRP3 activation.
4. Conclusions
In this study, considering the short half-life time of H2S in a biological matrix, the interworking mutual transformation pathways between H2S and sulfane sulfur in vivo, and the perturbation of sulfur speciation by alkylation agents, we developed an LC-MS/MS method for simultaneous determination of H2S and sulfane sulfur by converting them into the same product, NBDSH, through derivatization with an easily available chemical probe, NBDCl, which could quantitatively deprive the biological matrix of TRSS . The NBDSH response of TRSS in rat plasma by reaction with NBDCl is linearly correlated with the spiked H2S concentration. The total response of TRSS were stable during the collection and pretreatment process of rat plasma samples. The inevitable interference from the biological matrix on detection of endogenous compounds was eliminated by the background subtraction approach, and NBDSH spiked plasma standard curves was used to calibrate the total concentration of TRSS. The plasma calibration curve of NBDSH showed good linearity in the range of 0.1∼20 μM (r2 = 0.995); the data for precision, accuracy, matrix effect, dilution effect and stability assessment were within acceptable limits (CV ≤ 15%, RE within ±15%); The absolute recovery of NBDSH in rat plasma at low, medium and high QC levels fell within 80%-120%; NBDSH in processed samples was stable in the refrigerator (-20˚C) and autosampler (15˚C) for 24 h. The method met all requirements for bio-analysis and was successfully applied to study the pharmacokinetics of H2S donors. The baseline level of TRSS in rat plasma was determined to be approximately 20 µM; the peak concentration of TRSS after administration of 5 mg∙kg-1 and 10 mg∙kg-1 Na2S were 27 µM and 36 µM, respectively; and the time to reach the peak value were 4 min and 10 min, respectively. Intravenous bolus dosing of Na2S resulted in a dose-dependent increase in plasma TRSS levels. The difference in elimination speed and intensity of TRSS indicates the induction of enzymes involved in H2S metabolism after dosing. Using this method, we could also observe the decrease in TRSS in mice macrophages after NLRP3 activation. This method would be helpful for assessing the druggability of H2S donors and elucidating the physiological and pathological effects of endogenous reactive sulfide species and ROS.
Acknowledgment
The authors would like to thank the chief administer Songyu Zhou and the quarter master Hongshui Yu for administrative support, and thank the director of pharmacology department Chaoquan Wu, the director and deputy director of microbiology department Bin Zhu and Yongqi Gan for technical support and kind donations of materials used for experiments. This work was supported by the Scientific Research Project of Traditional Chinese Medicine Bureau of Guangdong Province [grant number 20232005].
CRediT authorship contribution statement
Liai Lan: Conceptualization, Methodology, Data curation, Formal analysis, Writing—original draft preparation. Jianping Zhu: Methodology, Validation, Investigation, Writing—original draft preparation. Ming Deng: Methodology, Validation, Investigation, Writing—original draft preparation. Qinghua Zeng: Software, Formal analysis. Zhuangwei Liu: Formal analysis. Ling Ning: Formal analysis. Zhao Chen: Writing—review and editing, Funding acquisition. Yuefen Lou: Resources, Project administration. Guorong Fan: Conceptualization, Resources, Writing—review and editing, Project administration. Zhuang Zhao: Resources, Data curation, Supervision, Project administration, Funding acquisition.
Declaration of competing interest
The authors declare that they have no known competing financial interests or personal relationships that could have appeared to influence the work reported in this paper.
Declaration of Generative AI and AI-assisted technologies in the writing process
The authors confirm that there was no use of artificial intelligence (AI)-assisted technology for assisting in the writing or editing of the manuscript and no images were manipulated using AI.
Appendix A. Supplementary material
Supplementary material to this article can be found online at https://dx.doi.org/10.25259/AJC_115_2024
References
- Functional and molecular insights of hydrogen sulfide signaling and protein Sulfhydration. Journal of Molecular Biology. 2017;429:543-561. https://doi.org/10.1016/j.jmb.2016.12.015
- [CrossRef] [PubMed] [PubMed Central] [Google Scholar]
- Hydrogen sulfide and cancer. Handbook of Experimental Pharmacology. 2015;230:233-41. https://doi.org/10.1007/978-3-319-18144-8_12
- [CrossRef] [PubMed] [PubMed Central] [Google Scholar]
- Hydrogen sulfide in signaling pathways. Clin. Chim. Acta. 2015;439:212-8. https://doi.org/10.1016/j.cca.2014.10.037
- [CrossRef] [PubMed] [Google Scholar]
- Hydrogen sulfide: An endogenous regulator of the immune system. Pharmacological Research. 2020;161:105119. https://doi.org/10.1016/j.phrs.2020.105119
- [CrossRef] [PubMed] [Google Scholar]
- H2S donors and their use in medicinal chemistry. Biomolecules. 2021;11:1899. https://doi.org/10.3390/biom11121899
- [CrossRef] [PubMed] [PubMed Central] [Google Scholar]
- Progress and perspective on hydrogen sulfide donors and their biomedical applications. Medicinal Research Reviews. 2022;42:1930-1977. https://doi.org/10.1002/med.21913
- [CrossRef] [PubMed] [Google Scholar]
- Biosynthesis, quantification and genetic diseases of the smallest signaling thiol metabolite: Hydrogen sulfide. Antioxidants (Basel). 2021;10:1065. https://doi.org/10.3390/antiox10071065
- [CrossRef] [PubMed] [PubMed Central] [Google Scholar]
- Advances and Opportunities in H2S Measurement in Chemical Biology. JACS Au. 2023;3:2677-2691. https://doi.org/10.1021/jacsau.3c00427
- [CrossRef] [PubMed] [PubMed Central] [Google Scholar]
- Serum hydrogen sulfide and outcome association in pneumonia by the SARS-CoV-2 coronavirus. Shock. 2020;54:633-637. https://doi.org/10.1097/SHK.0000000000001562
- [CrossRef] [PubMed] [PubMed Central] [Google Scholar]
- Simple micellar electrokinetic chromatography method for the determination of hydrogen sulfide in hen tissues. Electrophoresis. 2015;36:1028-32. https://doi.org/10.1002/elps.201400518
- [CrossRef] [PubMed] [Google Scholar]
- Emerging analytical tools for the detection of the third gasotransmitter H2S, a comprehensive review. Journal of Advanced Research. 2020;27:137-153. https://doi.org/10.1016/j.jare.2020.05.018
- [CrossRef] [PubMed] [PubMed Central] [Google Scholar]
- Hydrogen sulfide measurement by headspace-gas chromatography-mass spectrometry (HS-GC-MS): Application to gaseous samples and gas dissolved in muscle. Journal of Analytical Toxicology. 2015;39:52-57. https://doi.org/10.1093/jat/bku114
- [CrossRef] [PubMed] [Google Scholar]
- Chromogenic and fluorogenic chemosensors for hydrogen sulfide: review of detection mechanisms since the year 2009. RSC Advances. 2015;5:2191-2206. https://doi.org/10.1039/c4ra11870g
- [CrossRef] [Google Scholar]
- Synthetic nanoprobes for biological hydrogen sulfide detection and imaging. View. 2022;3 https://doi.org/10.1002/viw.20210008
- [CrossRef] [Google Scholar]
- Detection of exhaled hydrogen sulphide gas in healthy human volunteers during intravenous administration of sodium sulphide. British Journal of Clinical Pharmacology. 2010;69:626-36. https://doi.org/10.1111/j.1365-2125.2010.03636.x
- [CrossRef] [PubMed] [PubMed Central] [Google Scholar]
- Effect of hydrogen sulfide in a porcine model of myocardial is chemia–reperfusion: comparison of different administration regimens and characterization of the cellular mechanisms of protection. Journal of Cardiovascular Pharmacology. 2009;54:287-297.
- [CrossRef] [PubMed] [Google Scholar]
- A monobromobimane‐based assay to measure the pharmacokinetic profile of reactive sulphide species in blood. British Journal of Pharmacology. 2010;160:941-957. https://doi.org/10.1111/j.1476-5381.2010.00704.x
- [CrossRef] [PubMed] [PubMed Central] [Google Scholar]
- Measurement of plasma hydrogen sulfide in vivo and in vitro. Journal of Free Radicals in Biology & Medicine. 2011;50:1021-31. https://doi.org/10.1016/j.freeradbiomed.2011.01.025
- [CrossRef] [PubMed] [Google Scholar]
- Hydrogen sulfide measurement using sulfide dibimane: Critical evaluation with electrospray ion trap mass spectrometry. Nitric Oxide. 2014;41:97-104. https://doi.org/10.1016/j.niox.2014.06.002
- [CrossRef] [PubMed] [PubMed Central] [Google Scholar]
- New method for quantification of gasotransmitter hydrogen sulfide in biological matrices by LC-MS/MS. Science Reports. 2017;7:46278. https://doi.org/10.1038/srep46278
- [CrossRef] [Google Scholar]
- Chiral CuxOS@ZIF‐8 Nanostructures for ultrasensitive quantification of hydrogen sulfide in vivo. Advanced Materials. 2020;32 https://doi.org/10.1002/adma.201906580
- [Google Scholar]
- Stable isotope dilution mass spectrometry quantification of hydrogen sulfide and thiols in biological matrices. Redox Biology. 2022;55:102401. https://doi.org/10.1016/j.redox.2022.102401
- [CrossRef] [PubMed] [PubMed Central] [Google Scholar]
- Dual-mode biosensing platform for sensitive and portable detection of hydrogen sulfide based on cuprous oxide/gold/copper metal organic framework heterojunction. Journal of Colloid and Interface Science. 2023;629:796-804. https://doi.org/10.1016/j.jcis.2022.09.120
- [CrossRef] [PubMed] [Google Scholar]
- Precolumn derivatization LC/MS method for observation of efficient hydrogen sulfide supply to the kidney via d-cysteine degradation pathway. Journal of Pharmaceutical and Biomedical Analysis. 2023;222:115088. https://doi.org/10.1016/j.jpba.2022.115088
- [CrossRef] [PubMed] [Google Scholar]
- Development of a derivatization method for the quantification of hydrogen sulfide and its application in vascular calcification rats. Journal of Chromatography. B, Analytical Technology. 2017;1055-1056:8-14. https://doi.org/10.1016/j.jchromb.2017.04.023
- [CrossRef] [Google Scholar]
- Is exogenous hydrogen sulfide a relevant tool to address physiological questions on hydrogen sulfide? Respiratory Physiology & Neurobiology. 2016;229:5-10. https://doi.org/10.1016/j.resp.2016.03.015
- [CrossRef] [PubMed] [Google Scholar]
- Speciation of reactive sulfur species and their reactions with alkylating agents: do we have any clue about what is present inside the cell? British Journal of Pharmacology. 2019;176:646-670. https://doi.org/10.1111/bph.v176.4/issuetoc
- [CrossRef] [PubMed] [PubMed Central] [Google Scholar]
- Optimization of a monobromobimane (MBB) derivatization and RP-HPLC-FLD detection method for sulfur species measurement in human serum after sulfur inhalation treatment. Antioxidants. 2022;11:939.
- [CrossRef] [PubMed] [PubMed Central] [Google Scholar]
- H2S concentrations in the heart after acute H2S administration: methodological and physiological considerations. American Journal of Physiology-Heart Circulatory Physical. 2016;311:H1445-H1458. https://doi.org/10.1152/ajpheart.00464.2016
- [CrossRef] [Google Scholar]
- Persulfidation (S-sulfhydration) and H2S. 230 2015:29-59. https://doi.org/10.1007/978-3-319-18144-8_2
- [CrossRef] [Google Scholar]
- Chemical tools for the study of hydrogen sulfide (H2S) and sulfane sulfur and their applications to biological studies. Journal of Clinical Biochemistry and Nutrition. 2016;58:7-15. https://doi.org/10.3164/jcbn.15/91
- [CrossRef] [PubMed] [PubMed Central] [Google Scholar]
- New fluorescent probes for sulfane sulfurs and the application in bioimaging. Chemical Sciences. 2013;4:2892-2896. https://doi.org/10.1039/C3SC50754H
- [CrossRef] [Google Scholar]
- Isotope dilution mass spectrometry for the quantification of sulfane sulfurs. Free Radical Biology & Medicine. 2014;76:200-7. https://doi.org/10.1016/j.freeradbiomed.2014.08.003
- [CrossRef] [PubMed] [Google Scholar]
- A selective and sensitive method for quantification of endogenous polysulfide production in biological samples. Redox Biology. 2018;18:295-304. https://doi.org/10.1016/j.redox.2018.07.016
- [CrossRef] [PubMed] [PubMed Central] [Google Scholar]
- A reversible fluorescent probe for real‐time live‐cell imaging and quantification of endogenous hydropolysulfides. Angewandte Chemie (International Ed.). 2018;57:9346-9350. https://doi.org/10.1002/anie.201804309
- [Google Scholar]
- Sensitive method for reliable quantification of sulfane sulfur in biological samples. Analytical Chemistry. 2019;91:11981-11986. https://doi.org/10.1021/acs.analchem.9b02875
- [CrossRef] [PubMed] [Google Scholar]
- Highly stable electrochemical probe with bidentate thiols for ratiometric monitoring of endogenous polysulfide in living mouse brains. Analytical Chemistry. 2022;94:1447-1455. https://doi.org/10.1021/acs.analchem.1c04894
- [CrossRef] [PubMed] [Google Scholar]
- Simple and sensitive quantification of glutathione hydropersulfide alkylated using iodoacetamide by high-performance liquid chromatography with post-column derivatization. Journal of Chromatography. B, Analytical Technology. 2021;1163:122516. https://doi.org/10.1016/j.jchromb.2020.122516
- [CrossRef] [Google Scholar]
- Theoretical investigation for the designing of novel antioxidants. Canadian Journal of Chemical Engineering. 2013;91:126-130. https://doi.org/10.1139/cjc-2012-0356
- [CrossRef] [Google Scholar]
- theoretical investigation for exploring the antioxidant potential of chlorogenic acid: A density functional theory study. International Journal of Food Properties. 2016;19:745-751. https://doi.org/10.1080/10942912.2015.1042588
- [CrossRef] [Google Scholar]
- Key electronic, linear and nonlinear optical properties of designed disubstituted quinoline with carbazole compounds. Molecules. 2021;26:2760. https://doi.org/10.3390/molecules26092760
- [CrossRef] [PubMed] [PubMed Central] [Google Scholar]
- Synthesis, characterization and DFT calculated properties of electron-rich hydrazinylthiazoles: Experimental and computational synergy. Journal of Molecular Structure. 2021;1245:131043. https://doi.org/10.1016/j.molstruc.2021.131043
- [CrossRef] [Google Scholar]
- Photovoltaic response promoted via intramolecular charge transfer in triphenylpyridine core with small acceptors: A DFT/TD-DFT study. Materials Science in Semiconductor Processing. 2025;186:109086. https://doi.org/10.1016/j.mssp.2024.109086
- [CrossRef] [Google Scholar]
- commonly used alkylating agents limit persulfide detection by converting protein persulfides into thioethers. Angewandte Chemie (International Ed. in English). 2022;61:e202203684. https://doi.org/10.1002/anie.202203684
- [CrossRef] [PubMed] [PubMed Central] [Google Scholar]
- A simple liquid chromatography tandem mass spectrometric method for fast detection of hydrogen sulfide based on thiolysis of 7-nitro-2, 1, 3-benzoxadiazole ether. Journal of Chromatography A. 2020;1625:461243. https://doi.org/10.1016/j.chroma.2020.461243
- [CrossRef] [PubMed] [Google Scholar]
- Quantitative analysis of endogenous compounds. Journal of Pharmaceutical and Biomedical Analysis. 2016;128:426-437. https://doi.org/10.1016/j.jpba.2016.06.017
- [CrossRef] [PubMed] [Google Scholar]
- M10 Bioanalytical Method Validation and Study Sample Analysis. https://www.fda.gov/media/162903/download
- Frontline Science: Specialized proresolving lipid mediators inhibit the priming and activation of the macrophage NLRP3 inflammasome. Journal of Leukocyte Biology. 2019;105:25-36. https://doi.org/10.1002/JLB.3HI0517-206RR
- [CrossRef] [PubMed] [Google Scholar]
- The impact of inflammatory stimuli on xylosyltransferase-I regulation in primary human dermal fibroblasts. Biomedicines. 2022;10:1451. https://doi.org/10.3390/biomedicines10061451
- [CrossRef] [PubMed] [PubMed Central] [Google Scholar]
- Geraniin restricts inflammasome activation and macrophage pyroptosis by preventing the interaction between ASC and NLRP3 to exert anti-inflammatory effects. International Immunopharmacology. 2024;129:111656. doi: 10.1016/j.intimp.2024.111656
- [CrossRef] [PubMed] [Google Scholar]
- Derivatization with 4-chloro-7-nitrobenzofurazan for liquid chromatographic determination of hydroxyproline in collagen hydrolysate. Analytical Chemistry. 1981;53:485-9. https://doi.org/10.1021/ac00226a024
- [CrossRef] [PubMed] [Google Scholar]
- Expression and activity of hydrogen sulfide generating enzymes in murine macrophages stimulated with lipopolysaccharide and interferon-γ. Plant Molecular Biology Reporter. 2019;46:2791-2798. https://doi.org/10.1007/s11033-019-04725-7
- [Google Scholar]
- Glucocorticoids suppress cystathionine gamma-lyase expression and H2S production in lipopolysaccharide-treated macrophages. Cellular and Molecular Life Sciences. 2010;67:1119-32. https://doi.org/10.1007/s00018-009-0250-9
- [CrossRef] [PubMed] [PubMed Central] [Google Scholar]
- Inhibition of hydrogen sulfide production by gene silencing attenuates inflammatory activity of LPS-activated RAW264.7 cells. Applied Microbiology and Biotechnology. 2013;97:7845-52. https://doi.org/10.1007/s00253-013-5080-x
- [CrossRef] [PubMed] [Google Scholar]
- The binding site for the transcription factor, NF-κB, on the cystathionine γ-lyase promoter is critical for LPS-induced cystathionine γ-lyase expression. International Journal of Molecular Medicine. 2014;34:639-45. https://doi.org/10.3892/ijmm.2014.1788
- [CrossRef] [PubMed] [Google Scholar]
- Hydrogen sulfide is produced by cystathionine γ-lyase at the steady-state low intracellular Ca2+ concentrations. Biochemical and Biophysical Research Communications. 2013;431:131-135. https://doi.org/10.1016/j.bbrc.2013.01.010
- [CrossRef] [PubMed] [Google Scholar]
- The NLRP3 inflammasome: molecular activation and regulation to therapeutics. Nature Reviews Immunology. 2019;19:477-489. https://doi.org/10.1038/s41577-019-0165-0
- [CrossRef] [PubMed] [PubMed Central] [Google Scholar]
- Quantitative reactivity profiling predicts functional cysteines in proteomes. Nature. 2010;468:790-5. https://doi.org/10.1038/nature09472
- [CrossRef] [PubMed] [PubMed Central] [Google Scholar]
- H2S signalling through protein sulfhydration and beyond. Nat. Rev. Mol. Cell. Biol.. 2012;13:499-507. https://doi.org/10.1038/nrm3391
- [CrossRef] [PubMed] [Google Scholar]
- Superoxide dismutase 1 regulates caspase-1 and endotoxic shock. Nature Immunology. 2008;9:866-72. https://doi.org/10.1038/ni.1633
- [CrossRef] [PubMed] [Google Scholar]
- Nitric oxide controls the immunopathology of tuberculosis by inhibiting NLRP3 inflammasome–dependent processing of IL-1β. Nature Immunology. 2013;14:52-60. https://doi.org/10.1038/ni.2474
- [CrossRef] [PubMed] [PubMed Central] [Google Scholar]
- Mining the thiol proteome for sulfenic acid modifications reveals new targets for oxidation in cells. ACS Chemical Biology. 2009;4:783-799. https://doi.org/10.1021/cb900105q
- [CrossRef] [PubMed] [Google Scholar]
- Site-specific mapping and quantification of protein S-sulphenylation in cells. Nature Communication. 2014;5:4776. https://doi.org/10.1038/ncomms5776
- [CrossRef] [Google Scholar]
- Chemical proteomics reveals new targets of cysteine sulfinic acid reductase. Nature Chemical Biology. 2018;14:995-1004. https://doi.org/10.1038/s41589-018-0116-2
- [CrossRef] [PubMed] [PubMed Central] [Google Scholar]


