

Translate this page into:
Development and validation of a simple, sensitive and reproducible method for simultaneous determination of six polyphenolic bioactive markers in Dendrobium plants
⁎Corresponding author at: Department of Food and Pharmaceutical Chemistry, Faculty of Pharmaceutical Sciences, Chulalongkorn University, 254 Phayathai Road, Patumwan, Bangkok 10330, Thailand. Pornchai.r@chula.ac.th (Pornchai Rojsitthisak)
-
Received: ,
Accepted: ,
This article was originally published by Elsevier and was migrated to Scientific Scholar after the change of Publisher.
Peer review under responsibility of King Saud University.
Abstract
Dendrobium is a large genus of orchid plants containing several bioactive polyphenols, including bibenzyls, phenanthrenes, and flavanones that have been used as antioxidants in nutraceutical and pharmaceutical products. Several polyphenols including (2S)-eriodictyol, (2S)-homoeriodictyol, moscatilin, gigantol, chrysotoxine and crepidatin are primarily found in Dendrobium species and can serve as bioactive markers of orchid plants. In the present study, a simple UPLC-UV method for the simultaneous determination of six polyphenols was developed for evaluating the distribution of bioactive phytochemicals in orchid plants and validated according to the ICH Q2 (R1) guidance. The sample was prepared by extracting dendrobium powder with methanol and the supernatant was analyzed using the Waters ACQUITY UPLCTM H-Class system on an ACQUITY UPLCTM BEH C18 column (2.1 × 50 mm, 1.7 μm) with gradient elution of water and acetonitrile, containing 1% v/v trifluoroacetic acid (TFA) each, at a flow rate of 0.2 mL/min and UV detection at 280 nm. The chromatographic condition provided good peak shape and resolution. The method was linear over the specific ranges with the coefficient of determination (r2) > 0.995. Accuracy of the method expressed as %recovery ranged from 80 to 110%. The precision of the method demonstrated as %CV was < 7.3%. The method is simple, accurate, precise and robust and is recommended for routine quality control analysis of orchid plants containing the six polyphenols as the main principles in the herb. The proposed method was successfully applied for simultaneous quantification of the 6 polyphenolic compounds in 11 samples from 3 Dendrobium species, suggesting that the method was suitable for quality assessment of orchid herbal raw materials.
Keywords
Dendrobium
UPLC
Phenolic compounds
Orchid

1 Introduction
Folk medication with natural herbal products has been traditionally used in the Asia health care system to treat acute and chronic diseases including degenerative ailments. They have been used to prevent and treat several diseases because they consist of various bioactive phytochemicals (Lam et al., 2015). Nowadays, polyphenolic compounds are fascinating phytochemicals as potential candidates for the treatment of several diseases. Oxidative stress from cell aging, food intake and environmental pollution, which can induce deteriorated cell growth resulting in a pathological condition, is the main target hit of polyphenols (Minh et al., 2016). Antioxidant activity from polyphenolic compounds plays not only a crucial role in the traditional health care system but is also commonly applied for the combination treatment with other substances in modern medicine, skincare, and nutraceutical products.
Dendrobium species, belonging to the family Orchidaceae, are polyphenol-rich plants often used in traditional medicine for human disorder treatments such as cancer, autoimmune disorders and atherosclerosis (Handique and Baruah 2002). It is also a source of tonic, astringent, analgesic, and anti-inflammatory substances. Polyphenols in orchid plants are naturally synthesized from secondary metabolisms. These secondary metabolites do not essentially function in growth promotion, but their actions involve alternative roles such as insect-repellant, disease protection, or plant hormone4. The natural polyphenols, including bibenzyls, flavanones, and phenanthrenes, are major components in orchids of the genus Dendrobium and possess various bioactivities (Phechrmeekha et al., 2012, Chimsook 2016). Among those polyphenols, (2S)-eriodictyol, (2S)-homoeriodictyol, moscatilin, gigantol, chrysotoxine and crepidatin (Fig. 1) are primarily found and can serve as bioactive markers for evaluating phytochemical distribution of orchid plants.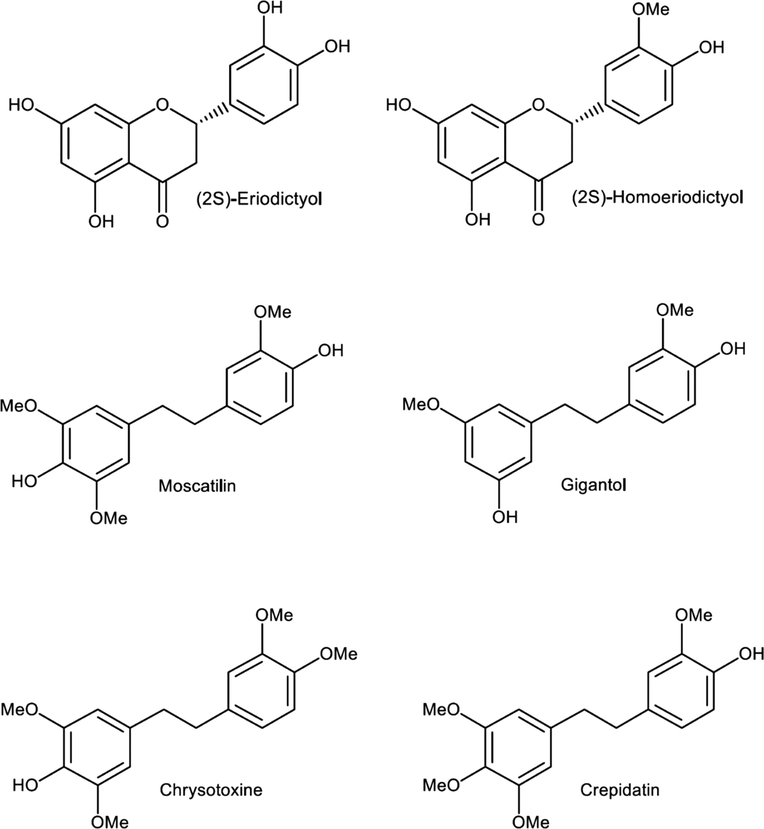
Six polyphenolic bioactive markers in Dendrobium plants.
Several published articles reported the phytochemical distribution and biological activities of the six polyphenols in Dendrobium spp (Song et al., 2010; Song et al., 2012; Cao et al., 2019; Thongin et al., 2019; Deng et al., 2020; Liang et al., 2020; Guo et al., 2022; Cardile et al., 2020; Hossasin, 2011; Fischer et al., 2019; Guo et al., 2022; Majumder and Chatterjee, 1989; Paudel et al., 2019; Cai, 2021). Chysotoxine isolated from D. aurantiacum inhibited 6-hydroxydopamine-induced apoptosis via mitochondria protection and NF-κB modulation and possessed neuroprotection effects (Song et al., 2010; Song et al., 2012). Eriodictyol isolated from D. officinale and D. ellipsophyllum was reported with various biological activities including neuroprotective, cardioprotective, hepatoprotective, antidiabetic and antioxidant effects (Cao et al., 2019; Thongin et al., 2019; Deng et al., 2020; Liang et al., 2020; Guo et al., 2022). Moscatilin found in D. moschatum, D. aurantiacum and D. loddiesii demonstrated an apoptosis induction in melanoma cells as well as other pharmacological properties such as antiplatelet, anti-inflammatory and antioxidant effects (Cardile et al., 2020; Hossasin, 2011). The neuroprotective effect exhibited by homoeriodictyol was isolated from D. densifiorum (Fischer et al., 2019; Guo et al., 2022). Crepidatin purified from D. crepidatum was demonstrated to possess antimitotic and antioxidant activities (Majumder and Chatterjee, 1989; Paudel et al., 2019). Finally, gigantol isolated from D.aurantiacum was shown to have anticancer activity (Cai, 2021).
Previous studies showed that the constituents in Dendrobium plants are diverse not only amongst species but even in the same species. The contents of the investigated compounds have demonstrated considerable variation because of environmental differences and varied cultural practices. Therefore, determining various profiles of biologically active phenolic compounds in Dendrobium species can explain the accumulation of the secondary metabolites derived from different environmental circumstances and aid in determining the optimal harvesting period. Furthermore, systematic data analysis provides helpful information on finding novel sources of naturally occurring bioactive natural products as lead compounds (Yang et al., 2006, Choonong et al., 2019).
High-performance liquid chromatography (HPLC) has been widely utilized for quality control of pharmaceuticals and medicinal herbs (Xu et al., 2010). The HPLC coupled with a diode array detector (DAD) approach is a suitable tool for determining natural compounds such as phenolic compounds in plants and their extracts. Its simplicity and precision facilitate comprehensive quantitative analysis (Yang et al., 2006, Yang et al., 2007, Choonong et al., 2019). For medicinal plant analysis, identification and quantification of bioactive and marker compounds in complex matrices are realized using the HPLC–DAD method even with structurally similar natural products, based on their chromatographic retention time, spectral characteristics, and quantitative information (Yang et al., 2006). Recently, ultra-performance liquid chromatography (UPLC) with better separation efficiency, shorter analytical run time, and less solvent consumption compared to HPLC has increased considerable attention (Swartz and Technologies 2005, Xu et al., 2010). Here, we describe our efforts in the first publication of a simple, sensitive, specific, and robust UPLC method to determine six polyphenolic constituents simultaneously in orchid plants. The developed method was also validated according to the Q2(R1) ICH guidelines (The International Conference on Harmonization, 2005).
In the present study, we therefore further developed and validated a simultaneous determination of 6 markers in Dendrobium spp. to achieve a shorter analysis time and robust analytical method with comparable sensitivity. The validated method was applied to determine the markers in 11 samples from 3 Dendrobium spp. to demonstrate the method’s applicability for routine analysis purposes.
2 Materials and methods
2.1 Sample collection
D. stricklandianum was collected and authenticated by Dr. Boonchoo Sritularak and Mr. Yanyong Punpreuk. D. crumenatum, D. friedericksianum and D. officinale were purchased from local markets in Bangkok, Thailand. The voucher specimens were deposited at the Department of Pharmacognosy and Pharmaceutical Botany, Faculty of Pharmaceutical Sciences, Chulalongkorn University, Bangkok, Thailand.
2.2 Material and reagents
(2S)-Eriodictyol, (2S)-homoeriodictyol, moscatilin, gigantol, chrysotoxine and crepidatin were provided from the Department of Pharmacognosy and Pharmaceutical Botany, Faculty of Pharmaceutical Sciences, Chulalongkorn University, Bangkok, Thailand. They were isolated from orchid plants and confirmed their structures using infrared spectrophotometry (IR), nuclear magnetic resonance spectroscopy, and high-resolution mass spectrometry (Chanvorachote et al., 2013; Tanagornmetar et al., 2014; Klongkumnuankarn et al., 2015). Chromatographic purity of the isolated compounds was determined by UPLC coupled with a photodiode array (PDA) detector to confirm their purity of > 98.0% and used as standards in the validation and assay. Chromatographic purities of (2S)-Eriodictyol, (2S)-homoeriodictyol, moscatilin, gigantol, chrysotoxine and crepidatin are 99.8, 98.3, 98.2, 99.3, 100.0, and 98.6 respectively. Reagent grade trifluoroacetic acid was purchased from Sigma-Aldrich (St. Louis, Missouri, USA). HPLC gradient grade acetonitrile and methanol were obtained from Fisher (Seoul, Korea). High purity water was prepared in-house using Ultra-high quality (UHQ) water purification system (Milli-Q, Millipore Corporation, Bedford, MA, USA).
2.3 Instruments and chromatographic conditions
The Waters ACQUITY UPLCTM H-Class system (Waters Corporation, Milford, MA, USA) consisted of a quaternary pump, a column oven, an autosampler and a PDA detector was used for method development and validation. The Empower 3 software was used for instrument control and data acquisition process. Chromatographic separation was achieved on an ACQUITY UPLCTM BEH C18 1.7 μm, 2.1 × 50 mm column (Waters Chromatography Ireland Limited, Dublin, Ireland). The mobile phase consisting of water (A) and acetonitrile (B), containing 1 %v/v TFA each, was delivered at a flow rate of 0.2 mL/min. The gradient elution program was optimized as follows: initial isocratic A-B of 68:32 from 0.0 to 1.0 min; linear gradient A-B of 35:65 from 1.0 to 7.0 min; linear gradient A-B of 68:32 from 7.0 to 7.3 min; isocratic A-B of 68:32 from 7.3 to 11.0 min. All analytes and interferences were achieved with a complete chromatographic separation under the total chromatographic run time of 11 min. The column oven temperature and detection wavelength were set at 30 °C and 280 nm, respectively. The injection volume was 2 μL.
2.4 Preparation of a system suitability solution
Six standard stock solutions of (2S)-eriodictyol, (2S)-homoeriodictyol, moscatilin, gigantol, chrysotoxine and crepidatin were separately prepared by dissolving 5 mg of each compound with methanol in 25-mL volumetric flasks (200 μg/mL). A 3 mL of the standard stock solution was transferred to a 10-mL volumetric flask and diluted to volume with methanol to obtain a working standard solution of each compound at the concentration of 60 μg/mL.
A system suitability solution was then prepared by co-spiking 1 mL of (2S)-eriodictyol, (2S)-homoeriodictyol, moscatilin, gigantol, chrysotoxine and crepidatin working standard solutions to obtain a solution mixture at a concentration of 10 μg/mL. The system suitability solution was filtered through a 0.22 μm nylon membrane filter prior to analysis.
2.5 Calibration curve preparation
A five-point calibration curve of each compound was constructed in the range of 8–80, 1–40, 5–100, 0.5–50, 1–50 and 1–40 μg/mL for (2S)-eriodictyol, (2S)-homoeriodictyol, moscatilin, gigantol, chrysotoxine and crepidatin, respectively. Calibration samples were prepared in a dilution of the standard stock solution of each compound. The solution was filtered through a 0.22 μm nylon membrane filter before analysis.
2.6 Matrix and sample preparation
2.6.1 Matrix preparation
The stem of D. stricklandianum was separately cut into small pieces and dried in an oven at 60 °C until the constant weight was obtained, approximately 3 h. The dried plants were powdered using a kitchen grinder and passed through a 40 mesh screen before extraction. The powdered plant of each species (250 mg) was transferred into a 15-mL screw-cap test tube. After that, 5 mL methanol was added, and the sample was extracted by heat-maceration at 50 °C for 60 min. Then, the mixture was subsequently sonicated for 45 min and centrifuged at 5,500 rpm, 20 °C for 10 min. The supernatant was filtered through a 0.22 μm nylon membrane filter before analysis.
2.6.2 Sample preparation
The samples of D. crumenatum, D.friedericksianum and D. officinale were prepared as above described in section 2.6.1.
2.7 Method validation
The method was validated according to the ICH Q2 (R1) guidance for the validation of analytical procedures in the aspect of assay procedures (The International Conference on Harmonization, 2005). The validation parameters including system suitability, specificity, linearity, accuracy, precision, LOD, LOQ and robustness, were assessed under the appropriately designed validation experiments.
2.7.1 System suitability
The system suitability test was performed to verify the repeatability of injection and the performance of the chromatographic system prior to analysis. For the repeatability of injection and chromatographic performance tests, the system suitability solution at a concentration of 10 μg/mL was injected in five replicates. The system reproducibility was evaluated on the variations (%CV ≤ 2) of retention time and peak area to indicate the precision of injections (Center for Drug Evaluation and Research, 1994). The performance of the chromatographic system was assessed as the resolutions (R ≥ 2) between two adjacent peaks to demonstrate the efficiency of chromatographic separation, the USP tailings of six phenolic compounds (T < 2) and the number of theoretical plates (N > 2,000).
2.7.2 Specificity
Specificity was investigated by separately injecting the diluent (methanol) and working standard solutions of (2S)-eriodictyol, (2S)-homoeriodictyol, moscatilin, gigantol, chrysotoxine and crepidatin at a concentration of 20 μg/mL. The standard mixture of six polyphenolic components at 10 μg/mL was injected to indicate the selectivity of the chromatographic column. D. stricklandianum was selected and used as the surrogate matrix in the validation experiment.
2.7.3 Linearity and range
Calibration curves of authentic standard solutions of six phenolic compounds (n = 3) at 5 concentrations ranging from 8 to 80, 1–40, 5–100, 0.5–50, 1–50 and 1–40 μg/mL for (2S)-eriodictyol, (2S)-homoeriodictyol, moscatilin, gigantol, chrysotoxine and crepidatin, respectively were constructed to determine the linear relationship. Linearity was assessed from the calibration curves plotted between the peak response (y) and the concentration (x) using the linear least square model (Danzer and Currie 1998). The percent deviation of the mean back-calculated concentrations of six phenolic compounds should be within ± 10% (Jurado et al., 2017). The linearity is acceptable if the coefficient of determination (r2) is higher than 0.995 (Ip et al., 2018). The regression analysis of the residual plot is often used to determine whether the slope and y-intercept are significantly different from zero at a 95% confidence interval. In the case of a p-value below 0.05, a significant difference of zero can be observed in the slope and y-intercept (Barwick 2003). The linear relationship between the peak response (y) and the concentration (x) is assessed from the F value when Fcal is greater than FANOVA (Danzer and Currie 1998).
2.7.4 Limit of detection (LOD) and limit of quantitation (LOQ)
The sensitivity of the method was evaluated using the limit of detection (LOD) and limit of quantification (LOQ). The LOD was assessed in terms of a signal-to-noise (S/N) ratio of ≥ 3 with a %CV of six replicate injections of ≤ 15. The LOQ was estimated by determining the S/N ratio of ≥ 10. The estimated LOQ was confirmed by six replicate injections of the spiked sample to achieve 80–110 % recovery with %CV of ≤ 11.
2.7.5 Accuracy and precision
Accuracy and precision were determined by analyzing the spiked powdered plant samples at 8 (LOQ), 40 and 80 μg/mL for (2S)-eriodictyol, 1 (LOQ), 10 and 40 μg/mL for (2S)-homoeriodictyol and crepidatin, 5 (LOQ), 20 and 100 μg/mL for moscatilin, 0.5 (LOQ), 25 and 50 μg/mL for gigantol and 1.0 (LOQ), 10 and 50 μg/mL for chrysotoxine. Each concentration level was prepared and analyzed in triplicate on the same day and for two different days representing intra-day (within–run) and inter-day (between–run) analyses, respectively. Accuracy was assessed using the percent recovery. The percent recovery should be in the range of 80 – 110%. The intra-day and inter-day precision were assessed as %CV of percent recovery.
2.7.6 Robustness
Robustness is a validation parameter to determine whether the method remains tolerable or unaffected when slight variations in chromatographic parameters were deliberately changed. In this study, the robustness of the method was determined as the suitability of the system under the slight variation of the method parameters including the change of the acid content in the mobile phase and column temperature. The percentage of TFA was changed from the original chromatographic condition of 1% (v/v) TFA (±0.1%), and the column temperature was varied from the method condition of 30 °C (±1 °C). The precision values of the peak response and retention time for six phenolic compounds were determined after a slight variation in the method parameters. The results were evaluated using the system suitability parameters as mentioned in Section 2.7.1 to ensure the efficiency of the method under minor modifications.
3 Results and discussion
Currently, there are several quantitative methods of chemically bioactive constituents in Dendrobium spp (Yang et al., 2006; Yang et al., 2007; Xu et al., 2010; Choonong et al., 2019). Yang et al., (2006) developed qualitative and quantitative determination of 11 phenolic constituents in Dendrobium species using HPLC-DAD with a total analysis time of about 55 min (Yang et al., 2006). Sample pre-treatment was achieved by 80% (v/v) methanol maceration and ultra-sonication. The LOD and LOD ranged from 0.04 to 0.61 and 0.13–1.83 μg/mL, respectively. Later on, they reported simultaneous analysis of 9 phenolic compounds using the similar previously reported HPLC-DAD method (Yang et al., 2007). SPE was used to remove matrix interferences. The LOD and LOQ ranged from 0.04 to 0.6 and 0.1–1.8 μg/mL, respectively. The study also employed HPLC-MS for structural confirmation of unknown compounds found in Dendrobium spp. A few years later, the UPLC method was developed for simultaneous determination of 5 markers in Dendrobium spp. with a total analysis time of about 6.5 min (Xu et al., 2010). Sample preparation was performed by pressurized liquid extraction (PLE) under 1500 psi using 80% methanol (v/v) at 140 °C for 15 min. The LOD and LOQ ranged from 0.03 to 2.44 and 0.08–7.32 μg/mL, respectively. Recently, we developed the reversed-phase HPLC-UV to determine 7 bioactive compounds in 33 orchid species with a total analysis time of about 60 min (Choonong et al., 2019). Samples were treated with methanol and then processed via ultrasonic-assisted extraction for 15 min for 3 times. The LOD and LOQ ranged from 0.10 to 1.57 and 0.32–5.23 μg/mL, respectively.
It is of note that Yang et al., (2007) implemented an HPLC-MS technique in the analysis of Dendrobium spp. in addition to the HPLC-DAD method. The HPLC coupled with MS was applied to identify the components in the plant as a qualitative measurement. The structural confirmation by MS provided additional information on the markers that are not available as reference or working standards. For example, in such study, moscatilin, gigantol, moscatin and coumarin were structurally characterized by HPLC-MS due to the lack of standard materials. In our current study, all six polyphenolic compounds were isolated, purified and characterized to serve as standard materials. However, the MS technique can be further implemented if unknown markers are applied.
3.1 Method development
The analytical method was developed for simultaneous determination of six polyphenolic markers in orchid plants. The compounds contain phenolic groups that can ionize in the mobile phase. Separation of polyphenolic analytes on reverse-phase chromatography can be achieved by an ion-suppression technique using organic acids such as formic acid, acetic acid, or TFA (Lian et al., 2005). Formic acid is most often chosen as a modifier for ion suppression due to its eco-friendly with no pungent smell like glacial acetic acid. However, formic acid is insufficient to completely suppress the ionization of polyphenolic functional groups. A stronger acid such as TFA at 1 %v/v is usually preferred because of its ability to control pH of the mobile phase and suppress ionization of phenolic groups. Buffers such as acetate and phosphate at higher pH can cause peak splitting, especially long-eluting peaks. An ACQUITY UPLCTM BEH C18 column was chosen because it can tolerate the low pH of the mobile phase and provide symmetrical peaks. In contrast, some phenolic compounds cannot retain on the C8 column and co-elute with matrix interferences. Alternatively, a phenyl column can make much more retention of phenolic analytes, resulting in a longer analysis time. Chromatographic separation of the six polyphenolic compounds was achieved at a flow rate of 0.2 mL/min with the gradient elution program varying the ratio of aqueous (1% v/v TFA in water) and organic (1% v/v TFA in acetonitrile) phases. Initially, the column condition was equilibrated at a 32% organic composition for 1 min. Then, the organic phase was slowly gradient up to 65 % to achieve the complete separation of all analytes within 7 min. It was noted that too fast ramping of an organic composition might make the peak coelution. After that, the mobile phase composition was gradient to the initial composition within 0.3 min. Conditioning the column should be performed with sufficient time to ensure column re-equilibration. An attempt to use methanol was unsuccessful due to peak broadening and long analytical run time. As the UV spectra of six detected polyphenols shown in Fig. 2, the detection wavelength was selected at 280 nm representing the maximum absorption wavelength of the analytes (λ(2S)-Eriodictyol = 287; λ(2S)-Homoeriodictyol = 287; λMoscatilin = 280; λGigantol = 280; λChrysotoxine = 279 and λCrepidatin = 279). The developed chromatographic condition provided sufficient separation among all analytes and other matrix interferences.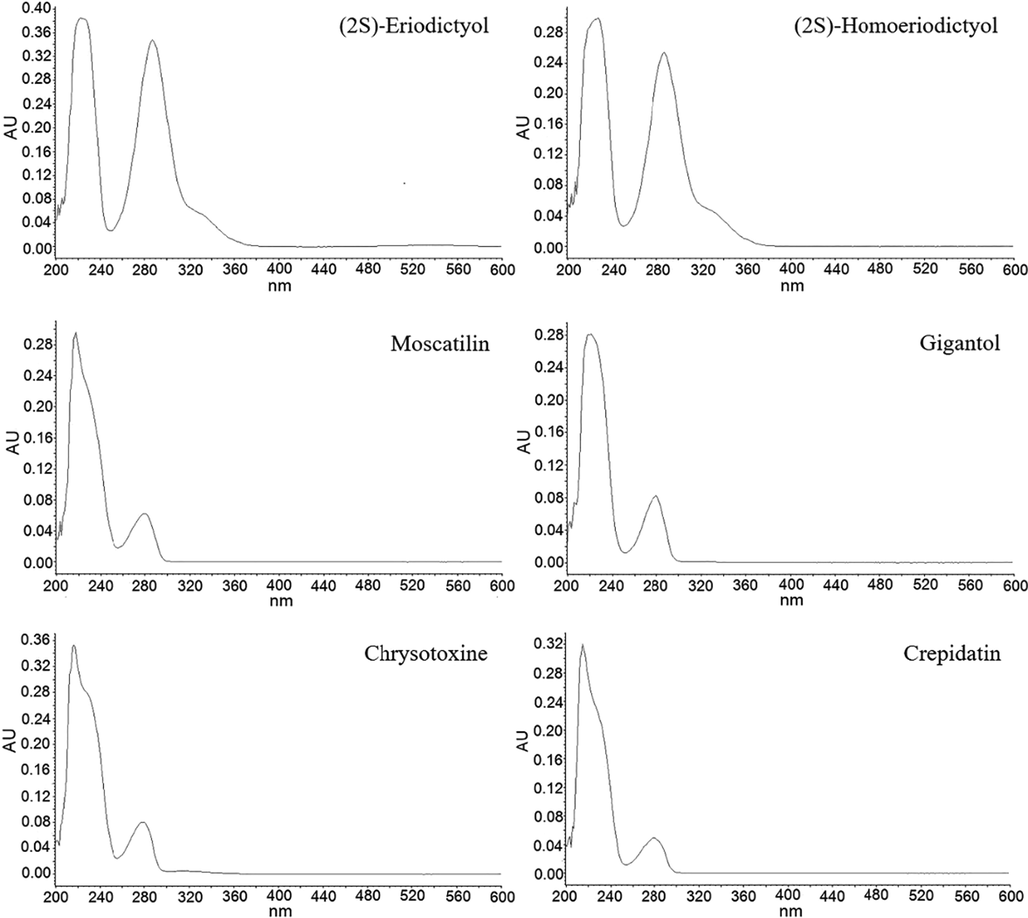
The UV spectra of six detected polyphenols: (2S)-eriodictyol, (2S)-hyomoeriodictyol, moscatilin, gigantol, chrysotoxine and crepidatin.
3.2 System suitability
Suitability was verified during method validation and sample analysis to ensure the validity of the chromatographic condition. The system suitability solution containing (2S)-eriodictyol, (2S)-homoeriodictyol, moscatilin, gigantol, chrysotoxine and crepidatin at a concentration of 10 μg/mL for each compound was prepared by mixing 1 mL of each working standard solution (60 μg/mL). Fig. 3A and B represent the overlaid chromatograms of each working standard solution and the typical chromatogram of the system suitability solution. The retention times of (2S)-eriodictyol, (2S)-homoeriodictyol, moscatilin, gigantol, chrysotoxine and crepidatin were 1.35, 2.21, 2.98, 3.39, 4.63 and 4.95, respectively. System performance was achieved with sufficient resolution between the adjacent analytes (R > 2.2), tailing factor (T < 1.1) and theoretical plate (N > 2,104). Five-replicate injection of the system suitability solution demonstrated that the system was reproducible with low variation of peak area, retention time, resolution, tailing factor and theoretical plate. The overall system suitability results summarized in Table 1 suggest that the developed chromatographic condition is suitable for further validation of simultaneous analysis of the six phenolic compounds.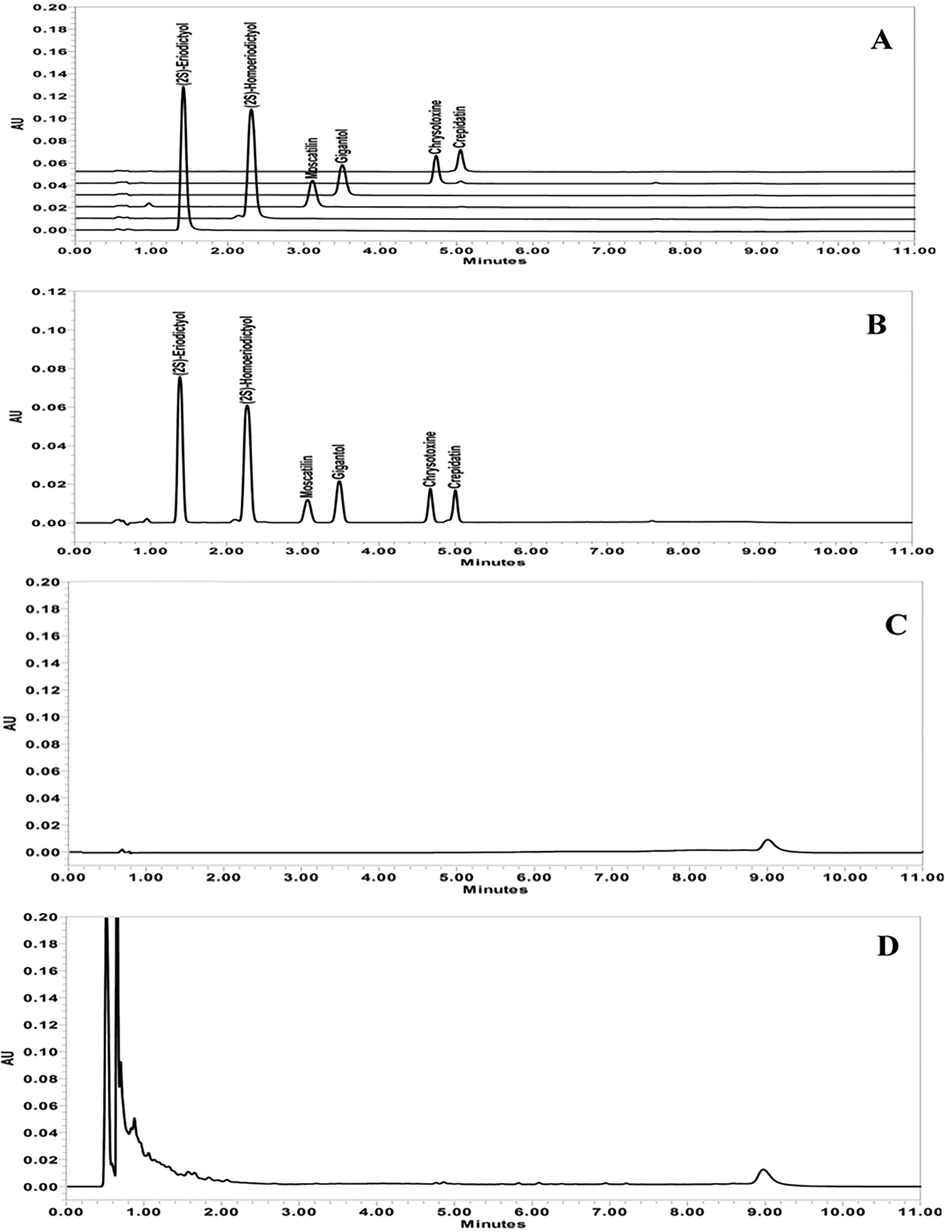
Representative chromatograms of (A) the overlaid working standard solutions of each polyphenol standard at a concentration of 20 μg/mL, (B) the system suitability solution containing six polyphenols at a concentration of 10 μg/mL, (C) the diluent (methanol), and (D) the matrix extract of D. stricklandianum.
Compound
%CV (n = 5)
Retention Time (min)
Resolution
USP Tailing Factor
USP Plate Count
Retention time
Peak response
(2S)-Eriodictyol
0.13
0.22
1.35
–
1.1
2,104
(2S)-Homoeriodictyol
0.22
0.28
2.21
6.1
1.1
2,913
Moscatillin
0.23
0.24
2.98
4.5
1.0
4,252
Gigantol
0.19
0.23
3.39
2.3
1.0
5,830
Chrysotoxine
0.12
0.24
4.63
8.1
1.0
21,233
Crepidatin
0.11
0.19
4.95
2.5
0.9
25,061
3.3 Specificity
Specificity is crucial in method development to separate analytes from solvent, matrices, and potential impurity. Fig. 3C and D represent blank chromatograms of methanol and matrix extract of D. stricklandianum, respectively. Compared with the chromatograms of polyphenolic analytes as shown in Fig. 3A and B, the chromatograms of methanol and the matrix extract of D. stricklandianum revealed no co-eluting peaks at the retention times of the polyphenolic analytes. The specificity result suggests that the chromatographic system is sufficient to revolve the analyte peaks from other interference peaks.
3.4 Linearity and range
The linear relationships between analyte concentrations and signal responses were evaluated at the concentration range of 8–80, 1–40, 5–100, 0.5–50, 1–50 and 1–40 μg/mL for (2S)-eriodictyol, (2S)-homoeriodictyol, moscatilin, gigantol, chrysotoxine and crepidatin, respectively. The calibration curves were constructed by plotting between the concentrations versus the peak responses of analytes. Using the linear least square model, the calibration curve was linear over the tested concentration range (r2 > 0.995). The percent deviations of the mean back-calculated concentrations and actual concentrations of (2S)-eriodictyol, (2S)-homoeriodictyol, moscatilin, gigantol, chrysotoxine and crepidatin were in the ranges of −2.3–6.9, −9.0–4.1, −1.1–6.0, −2.3–2.4, −3.6–1.6, and −1.7–9.1, respectively. The %CV (n = 3) of the back-calculated concentrations was<6.5%. The calibration curve results summarized in Table 2 indicate that the ranges of the analytical procedure possess suitable levels of precision, accuracy and linearity.
Compound
Nominal conc. (μg/mL)
Back-calculated conc. (μg/mL)
mean back-calculated conc. (μg/mL)
%Deviation
%CV
Day 1
Day 2
Day 3
(2S)-Eriodictyol
8.0
8.5
8.7
8.5
8.6
6.9
1.9
20.0
19.3
19.6
20.5
19.8
−1.0
3.4
40.0
37.3
40.4
39.5
39.1
−2.3
4.1
60.0
58.6
60.8
59.6
59.7
−0.5
1.8
80.0
79.9
80.6
81.5
80.7
0.8
1.0
r2
0.9986
Fcal
8388.13
FANOVA
1.17 × 10⁻¹⁹
p-value of slope
1.17 × 10⁻¹⁹
p-value of intercept
0.064
(2S)-Homoeriodictyol
1.0
1.0
1.0
1.0
1.0
−0.4
1.0
5.0
4.5
4.5
4.7
4.6
−9.0
2.0
10.0
10.1
10.2
9.6
10.0
−0.2
2.9
20.0
20.7
20.5
21.3
20.8
4.1
2.0
40.0
39.3
40.5
39.1
39.6
−0.9
1.8
r2
0.9984
Fcal
8205.09
FANOVA
1.35 × 10⁻¹⁹
p-value of slope
1.35 × 10⁻¹⁹
p-value of intercept
0.300
Moscatilin
5.0
5.3
5.5
5.1
5.3
6.0
3.1
10.0
9.5
10.8
10.0
10.0
1.1
6.5
20.0
20.4
19.6
19.4
19.8
−1.1
2.6
50.0
47.8
49.8
51.1
49.6
−0.8
3.3
100.0
99.5
101.1
100.1
100.2
0.2
0.8
r2
0.9995
Fcal
25746.57
FANOVA
8.06 × 10⁻²³
p-value of slope
8.06 × 10⁻²³
p-value of intercept
0.098
Gigantol
0.5
0.6
0.6
0.6
0.6
1.5
2.7
1.0
1.1
1.1
1.1
1.1
1.4
0.1
5.0
5.0
5.3
5.1
5.1
2.4
2.9
25.0
24.8
23.8
24.6
24.4
−2.3
2.1
50.0
51.2
49.4
50.2
50.3
0.5
1.8
r2
0.9994
Fcal
20478.66
FANOVA
3.57 × 10⁻²²
p-value of slope
3.57 × 10⁻²²
p-value of intercept
0.370
Chrysotoxine
1.0
1.0
1.0
1.0
1.0
−3.6
0.1
5.0
5.2
4.9
5.1
5.1
1.6
2.9
10.0
10.0
10.1
9.9
10.0
−0.1
0.8
25.0
25.5
24.7
24.6
24.9
−0.3
2.0
50.0
49.3
50.0
50.7
50.0
0.1
1.4
r2
0.9997
Fcal
37925.83
FANOVA
6.51 × 10⁻²⁴
p-value of slope
6.51 × 10⁻²⁴
p-value of intercept
0.274
Crepiatin
1.0
1.1
1.1
1.1
1.1
9.1
0.5
5.0
4.9
5.0
5.0
5.0
−0.4
1.2
10.0
9.8
9.9
9.8
9.8
−1.7
0.9
20.0
19.8
20.4
20.1
20.1
0.5
1.6
40.0
39.7
40.3
40.0
40.0
0.0
0.8
r2
0.9998
Fcal
61788.47
FANOVA
2.73 × 10⁻²⁵
p-value of slope
2.73 × 10⁻²⁵
p-value of intercept
0.079
The residual plots and regression generated by one-way analysis of variance demonstrated that the F values (FANOVA) of all regression lines were significantly less than the calculated F values (Fcal), indicating an excellent linear relationship between the peak response (y) and the concentration of analyte (x). The p-value is the regression parameter used to indicate whether the slope and y-intercept are significantly different from zero at a 95% confidence interval. The p-values of slope and y-intercept are summarized in Table 2. The p-values of slopes were<0.05, indicating a significant difference from zero. The p-values of intercepts exceeded 0.05, indicating that the intercepts of all regression lines were insignificantly different from zero. The linearity results suggest that the calibration curve within the specified range can be applied for the routine analysis of the six polyphenolic compounds, and the single-point standard can also be used for the single-point assay.
3.5 LOD and LOQ
LOD and LOQ of six polyphenolic analytes were experimentally determined, and the results are summarized in Table 3. The LOD of analytes showed the S/N ratio ranging from 4 to 6 with a %CV of six replicate injections of ≤ 1.9. The LOQ of analytes showed the S/N ratio ranging from 15 to 45. The accuracy and precision at the LOQ of all analytes were achieved with percent recovery ranging from 88.3 to 104.2 % and precision (%CV) of ≤ 6.5.
Compound
Limit of Detection (n = 6)
Limit of Quantitation (n = 6)
Nominal conc. (μg/mL)
Precision (%CV)
S/N
Nominal conc. (μg/mL)
Accuracy (%Recovery)
Precision (%CV)
S/N
(2S)-Eriodictyol
1.00
1.6
6
8.00
92.0
0.9
45
(2S)-Homoeriodictyol
0.25
1.9
4
1.00
89.2
6.5
18
Moscatillin
0.50
1.3
5
5.00
98.9
1.8
42
Gigantol
0.25
1.7
6
0.50
88.3
6.4
15
Chrysotoxine
0.25
1.8
6
1.00
102.7
3.8
23
Crepidatin
0.25
1.2
6
1.00
104.2
1.5
22
3.6 Accuracy and precision
The accuracy and precision of the matrix extract spiked with individual polyphenolic standards were determined at three concentration levels. The accuracy and precision results are summarized in Table 4. The intra-day accuracy and precision exhibited percent recoveries ranging from 86.0 to 105.7% with relative standard deviations of %CV between 0.1 and 8.4. The inter-day accuracy and precision showed percent recoveries ranging from 86.1 to 104.2% with relative standard deviations of %CV between 0.9 and 6.5. The results demonstrated satisfactory accuracy and precision of the proposed method.
Compound
Nominal conc. (μg/mL)
Intra-day (n = 3)
Inter-day (n = 6)
Mean back-calculated conc. (μg/mL)
Accuracy (%Recovery)
Precision (%CV)
Mean back-calculated conc. (μg/mL)
Accuracy (%Recovery)
Precision (%CV)
8.00
7.41
92.6
0.8
7.36
92.0
0.9
(2S)-Eriodictyol
40.00
39.36
98.4
1.4.
37.84
94.6
4.7
80.00
74.88
93.6
0.2
78.68
98.4
5.4
1.00
0.94
94.4
1.0
0.91
89.2
6.5
(2S)-Homoeriodictyol
10.00
9.31
93.1
2.2
8.98
89.8
4.4
40.00
36.31
90.8
2.6
36.09
90.2
1.9
5.00
4.96
99.3
2.6
4.94
98.9
1.8
Moscatillin
20.00
18.64
93.2
0.9
19.48
97.4
4.9
100.00
95.14
95.1
0.6
95.90
95.9
1.5
0.50
0.45
90.6
8.4
0.44
88.3
6.4
Gigantol
10.00
9.71
97.1
1.7
9.19
91.9
6.3
50.00
46.39
92.8
0.1
45.31
90.6
2.6
1.00
1.06
105.7
2.8
1.03
102.7
3.8
Chrysotoxine
10.00
8.60
86.0
3.1
8.61
86.1
2.1
50.00
48.40
96.8
1.2
47.84
95.7
1.5
1.00
1.05
105.1
0.9
1.04
104.2
1.5
Crepidatin
10.00
9.16
91.6
0.9
9.04
90.4
2.1
40.00
37.13
92.8
1.4
37.85
94.6
2.6
3.7 Robustness
The system suitability solution was used to assess the robustness of the method under slight variations of a column temperature and a TFA concentration in the mobile phase. The robustness results are summarized in Table 5. The retention times of six polyphenolic analytes were insignificantly different among the modified chromatographic conditions. In addition to the retention time, the slight variations in the column temperature and TFA concentration had no impact on the reproducibility of injections. The %CV values of the retention time and peak response were within the limit criteria with % CV < 2. The variations in the column temperature and TFA concentration had a subtle effect on the peak separation but the chromatographic resolutions between two adjacent analytes remained>2. The slight changes in tested chromatographic factors did not affect the system’s performance as measured by the tailing factor (T < 1.1) and the number of theoretical plates (N > 2,041).
Compound
Parameter change
%CV (n = 5)
Retention time
(min)
Resolution
USP
Tailing Factor
USP
Plate Count
Retention time
Peak response
(2S)-Eriodictyol
No change
0.13
0.22
1.35
–
1.1
2,104
(2S)-Homoeriodictyol
0.22
0.28
2.21
6.1
1.1
2,913
Moscatillin
0.23
0.24
2.98
4.5
1.0
4,252
Gigantol
0.19
0.23
3.39
2.3
1.0
5,830
Chrysotoxine
0.12
0.24
4.63
8.1
1.0
21,233
Crepidatin
0.11
0.19
4.95
2.5
0.9
25,061
(2S)-Eriodictyol
Column temperature (29 °C)
0.22
0.72
1.37
–
1.1
2,122
(2S)-Homoeriodictyol
0.14
0.75
2.24
6.2
1.1
2,979
Moscatillin
0.14
0.71
2.99
4.5
1.0
4,396
Gigantol
0.15
0.74
3.42
2.2
1.0
6,160
Chrysotoxine
0.11
0.72
4.64
8.1
1.0
21,281
Crepidatin
0.11
0.72
4.96
2.5
0.9
25,140
(2S)-Eriodictyol
Column temperature (31 °C)
0.15
0.77
1.34
–
1.1
2,053
(2S)-Homoeriodictyol
0.09
0.75
2.18
6.0
1.1
2,855
Moscatillin
0.12
0.80
2.96
4.4
1.0
4,159
Gigantol
0.11
0.79
3.35
2.3
1.0
5,575
Chrysotoxine
0.08
0.77
4.60
8.0
1.0
20,498
Crepidatin
0.07
0.76
4.93
2.4
0.9
24,248
(2S)-Eriodictyol
Percent of acid (0.9% TFA)
0.11
0.27
1.35
–
1.1
2,041
(2S)-Homoeriodictyol
0.12
0.27
2.19
6.3
1.1
2,860
Moscatillin
0.12
0.32
2.96
4.2
1.0
4,019
Gigantol
0.08
0.28
3.36
2.2
1.0
5,479
Chrysotoxine
0.06
0.27
4.61
8.2
1.0
19,563
Crepidatin
0.08
0.27
4.93
2.4
0.9
23,029
(2S)-Eriodictyol
Percent of acid (1.1% TFA)
0.09
0.69
1.33
–
1.1
2,090
(2S)-Homoeriodictyol
0.13
0.63
2.15
6.2
1.1
2,921
Moscatillin
0.15
0.69
2.92
4.3
1.0
4,184
Gigantol
0.10
0.67
3.32
2.3
1.0
5,492
Chrysotoxine
0.03
0.67
4.58
8.2
1.0
20,693
Crepidatin
0.04
0.71
4.90
2.3
0.9
24,453
3.8 Method applications for determination of six polyphenolic bioactive markers in Dendrobium spp.
The content of six phenolic compounds (moscatilinm gigantol, crepidatin, chrysotoxine, eriodictyol and homoeriodictyol) in Dendrobium spp. was quantified using the developed and validated UPLC-UV method. Typical UPLC chromatograms of methanolic extracts of D. crumenatum, D. friedericksianum and D. officinale are depicted in Fig. 4. The content of six phenolic compounds in stems from the three Dendrobium plants is summarized in Table 6. The results show that only a few markers were found in each Dendrobium spp. with different amounts. These observations are in agreement with previous reports (Yang et al., 2006; Yang et al. 2007; Xu et al., 2009). For example, the HPLC method developed by Yang et al. (2006) for determination of 11 compounds in Dendrobium spp. demonstrated that only three primary detected markers were found including gigantol, moscatilin, and moscatin. In addition, Yang et al. (2007) reported that only 4 phenolic compounds including moscatilin, gigantol, moscatin, and coumarin were detected in which gigantol was observed as the primary bioactive marker (Yang et al., 2007). Xu et al. (2009) also found only gigantol and moscatilin in most orchid hybrids. In our study, moscatilin, gigantol and crepidatin were mainly found in D. crumenatum. However, eriodictyol, homoeriodictyol and chysotoxine were primarily located in D. friedericksianum and D. officinale.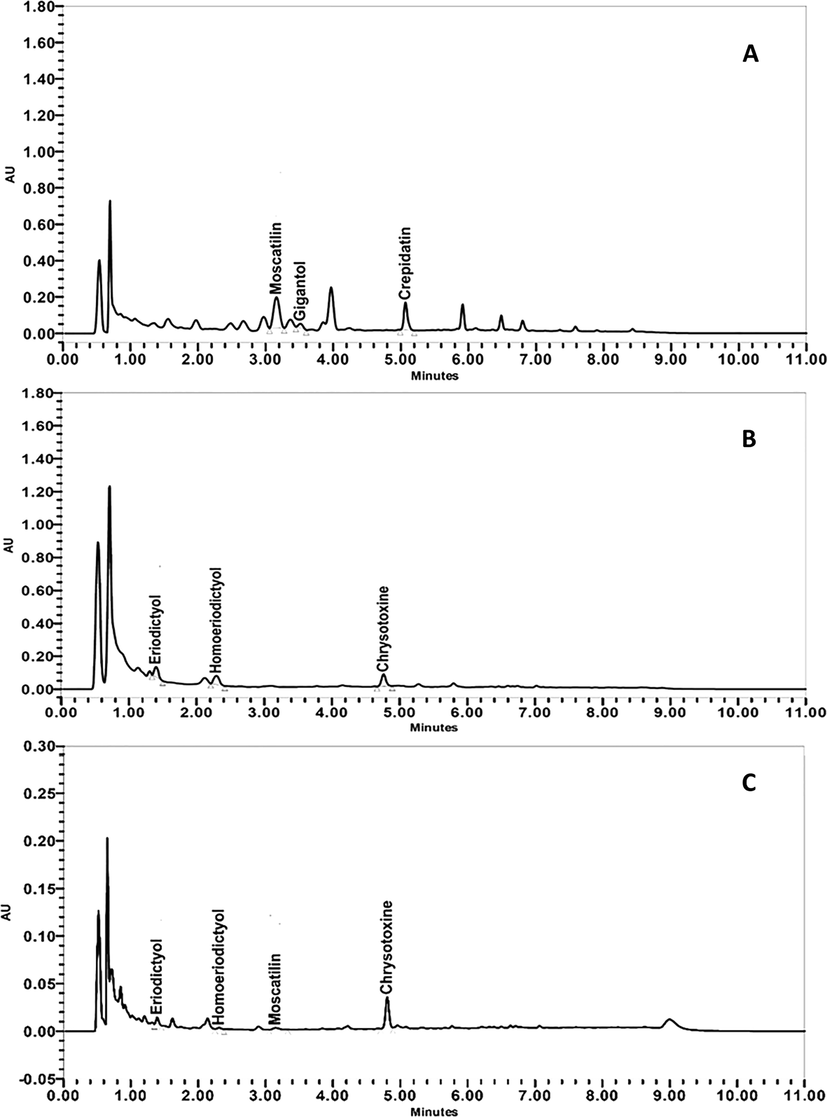
Typical UPLC chromatograms of methanolic extracts of (A) D. crumenatum, (B) D. friedericksianum and (C) D. officinale.
Sample
Sample Code
Content (μg/g)
Eriodictyol
Homoeriodictyol
Moscatilin
Gigantol
Chysotoxine
Crepidatin
D. crumenatum
DC01
–
–
3,484
355
–
1,064
DC02
–
–
2,444
1,796
–
2,468
DC03
–
–
2,026
1,404
–
9,311
DC04
–
–
–
2,272
–
11,021
DC05
–
–
545
245
–
7,582
D. friedericksianum
DF01
172
171
–
–
595
–
DF02
144
173
–
–
974
–
DF03
7
165
–
–
939
–
DF04
163
95
–
–
391
–
DF05
173
182
–
–
701
–
D. officinale
DO01
27
4
9.4
–
925
–
4 Conclusions
To the best of our knowledge, there is no currently available UPLC method for simultaneous determination of six bioactive phenols including eriodictyol, homoeiodictyol, moscatilin, gigantol, chrysotoxine, crepidatin. Because the UPLC approach can provide a fast, sensitive and robust method compared to HPLC, UPLC is therefore more suitable for qualitative analysis of multiple biomarkers in plants obtained from various sources with complex matrices. Simplified sample preparation can also facilitate routine phytochemical screening. Our developed UPLC method proposed in the present study had a total analysis run time of about 11 min using simple methanolic extraction as sample pre-treatment. The developed method was achieved in the complete validation according to the ICH Q2 (R1) guidance for the validation of analytical procedures. The validation results indicate sufficient accuracy, precision and sensitivity, suggesting that the proposed UPLC method is applicable for routine analysis of the six phenolic constituents in identifying Dendrobium plants.
Declaration of Competing Interest
The authors declare that they have no known competing financial interests or personal relationships that could have appeared to influence the work reported in this paper.
CRediT authorship contribution statement
Worathat Thitikornpong: Formal analysis, Investigation, Methodology, Visualization, Writing – original draft. Ponsiree Jithavech: Writing – original draft, Writing – review & editing. Somphob Thompho: Investigation. Yanyong Punpreuk: Investigation. Hasseri Halim: Writing – review & editing. Boonchoo Sritularak: Conceptualization, Writing – review & editing, Supervision. Pornchai Rojsitthisak: Conceptualization, Writing – review & editing, Project administration, Resources, Supervision, Funding acquisition.
Acknowledgments
The authors express their gratitude to the Ratchadaphiseksomphot Endowment Fund for supporting the Center of Excellence in Natural Products for Ageing and Chronic Diseases, Chulalongkorn University (GCE 6503433003-1) (P.R.). This work was financially supported by Office of the Permanent Secretary, Ministry of Higher Education, Science, Research and Innovation (W.T.) and Grants for Development of New Faculty Staff, Ratchadapiseksomphot Fund, Chulalongkorn University (DNS 63_074_33_004_1) (W.T.). We would like to thank the Pharmaceutical Research Instrument Center of the Faculty of Pharmaceutical Sciences at Chulalongkorn University for providing the research facilities.
References
- Barwick, V.J., 2003. Preparation of calibration curves: a guide to best practice, In LGC/VAM/2003/032; LGC.
- Gigantol inhibits cell proliferation and induces apoptosis by regulating DEK in non-small cell lung cancer. Exp. Ther. Med.. 2021;22:1317.
- [CrossRef] [Google Scholar]
- Extensive metabolic profiles of leaves and stems from the medicinal plant Dendrobium officinale Kimura et Migo. Metabolites. 2019;9:215.
- [CrossRef] [Google Scholar]
- Moscatilin, a bibenzyl derivative from the orchid Dendrobium loddigesii, induces apoptosis in melanoma cells. Chem. Bio. Interact.. 2020;323:109075
- [CrossRef] [Google Scholar]
- Center for Drug Evaluation and Research (CDER), 1994. Reviewer Guidance: Validation of Chromatographic Methods. 1-30.
- Chanvorachote, P., Kowitdamrong, A., Ruanghirun, T., et al. 2013. Anti-metastatic activities of bibenzyls from Dendrobium pulchellum. Nat. Prod. Commun. 8, 115-118. https://doi.org/10.1177%2F1934578X1300800127.
- Phytochemical screening, total phenolic content, antioxidant activities and cytotoxicity of Dendrobium signatum leaves. MATEC Web Conf.. 2016;62:03005.
- [CrossRef] [Google Scholar]
- The contents of bibenzyl derivatives, flavonoids and a phenanthrene in selected Dendrobium spp. and the correlation with their antioxidant activity. Sci. Asia. 2019;45:245-252.
- [CrossRef] [Google Scholar]
- Guidelines for calibration in analytical chemistry. part I. fundamentals and single component calibration (IUPAC Recommendations 1998) Pure Appl. Chem.. 1998;70:993-1014.
- [CrossRef] [Google Scholar]
- Pharmacological activity of eriodictyol: The major natural polyphenolic flavanone. Evid. Based Complement. Alternat. Med. eCAM. 2020;2020:6681352.
- [CrossRef] [Google Scholar]
- Old age-associated phenotypic screening for Alzheimer’s disease drug candidates identifies sterubin as a potent neuroprotective compound from Yerba santa. Redox Biol.. 2019;21:101089
- [CrossRef] [Google Scholar]
- Eriodictyol and Homoeriodictyol improve memory impairment in Aβ25-35-induced mice by inhibiting the NLRP3 Inflammasome. Molecules. 2022;27:2488.
- [CrossRef] [Google Scholar]
- Polyphenolic compounds: an overview. React Funct Polym.. 2002;52:163-188.
- [CrossRef] [Google Scholar]
- Hossain, M.M., 2011. Therapeutic orchids: traditional uses and recent advances- An overiew. Fitoterapia. 82, 102-140. https://doi.org/ 10.1016/j.fitote.2010.09.007.
- Physicochemical stability of extemporaneously prepared oral suspension of fluconazole 50 mg/mL in SuspendIt™. Pharm. Technol. Hosp. Pharm.. 2018;3:101-112.
- [CrossRef] [Google Scholar]
- Some practical considerations for linearity assessment of calibration curves as function of concentration levels according to the fitness-for-purpose approach. Talanta. 2017;172:221-229.
- [CrossRef] [Google Scholar]
- Cytotoxicity and antimigratory activities of phenolic compounds from Dendrobium brymerianum. Evid. based Complement Alternat. Med.. 2015;2015:350410
- [CrossRef] [Google Scholar]
- Evaluation of chemical constituents and important mechanism of pharmacological biology in dendrobium plants. Evid. Based Complement. Alternat. Med. eCAM. 2015;2015:841752
- [CrossRef] [Google Scholar]
- Determination of phenolic preservatives in gelatin and vacant capsules for medicine use by ion-suppression reversed-phase high performance liquid chromatography. J. Pharm. Biomed. Anal.. 2005;37:369-372.
- [CrossRef] [Google Scholar]
- Assessment of violet-blue color formation in Phalaenopsis orchids. BMC Plant Biol.. 2020;20:212.
- [CrossRef] [Google Scholar]
- Crepidatin, A bibenzyl derivative from the orchid Dendrobium crepidatum. Phytochem.. 1989;28:1986-1988.
- [CrossRef] [Google Scholar]
- Phenolic compounds and antioxidant activity of phalaenopsis orchid hybrids. Antioxidants. 2016;5
- [CrossRef] [Google Scholar]
- Assessment of antioxidant and cytotoxic activities of extracts of Dendrobium crepidatum. Biomolecules. 2019;9(478)
- [CrossRef] [Google Scholar]
- New phenolic compounds from Dendrobium capillipes and Dendrobium secundum. J. Asian Nat. Prod. Res.. 2012;14:748-754.
- [CrossRef] [Google Scholar]
- Chrysotoxine, a novel bibenzyl compound, inhibits 6-hydroxydopamine induced apoptosis in SH-SY5Y cells via mitochondria protection and NF-κB modulation. Neurochem. Int.. 2010;57:676-689.
- [CrossRef] [Google Scholar]
- Chrysotoxine, a novel bibenzyl compound selectivity antagonizes MPP+, but not rotenone, neurotoxicity in dopaminergic SH-SY5Y cells. Neurosci. Lett.. 2012;521:76-81.
- [CrossRef] [Google Scholar]
- UPLC™: an introduction and review. J. Liq. Chromatogr. Relat. Technol.. 2005;28:1253-1263.
- [CrossRef] [Google Scholar]
- Cytotoxic and anti-metastatic activities of phenolic compounds from Dendrobium ellipsophyllum. Anticancer Res. 2014;34:6573-6580.
- [Google Scholar]
- The International Conference on Harmonization (ICH), 2005. Harmonized Tripartite Guideline. Validation of Analytical Procedures: Text and methodology Q 2(R1), 1–13.
- Eriodictyol attenuates hydrogen peroxide-induced cell death in neuronal SH-SY5Y cells. Thai J. Pharm Sci.. 2019;43:131-137.
- [Google Scholar]
- Fast determination of five components of coumarin, alkaloids and bibenzyls in Dendrobium spp. using pressurized liquid extraction and ultra-performance liquid chromatography. J. Sep. Sci.. 2010;33:1580-1586.
- [CrossRef] [Google Scholar]
- Simultaneous determination of phenols (bibenzyl, phenanthrene, and fluorenone) in Dendrobium species by high-performance liquid chromatography with diode array detection. J. Chromatogr. A. 2006;1104:230-237.
- [CrossRef] [Google Scholar]
- Simultaneous quantitative and qualitative analysis of bioactive phenols in Dendrobium aurantiacum var. denneanum by high-performance liquid chromatography coupled with mass spectrometry and diode array detection. Biomed Chromatogr.. 2007;21:687-694.
- [CrossRef] [Google Scholar]


