

Translate this page into:
Development and validation of an UHPLC-MS/MS method for simultaneous determination of palbociclib, letrozole and its metabolite carbinol in rat plasma and pharmacokinetic study application
⁎Corresponding author at: Department of Pharmaceutical Chemistry, College of Pharmacy, King Saud University, P.O. Box 2457, Riyadh 11451, Saudi Arabia. mhefnawy@ksu.edu.sa (Mohamed Hefnawy)
-
Received: ,
Accepted: ,
This article was originally published by Elsevier and was migrated to Scientific Scholar after the change of Publisher.
Peer review under responsibility of King Saud University.
Abstract
A sensitive and selective UHPLC-MS/MS method was developed and validated to simultaneously determine of palbociclib (PLB), letrozole (LTZ) and its metabolite carbinol (CBL) in rat plasma. After sample pre-treatment by acetonitrile-protein precipitation, the chromatographies resolution was performed using a reversed phase Acquity® UPLC BEH C18 column (1.7 μm particle size, 50 mm × 2.1 mm ID) in isocratic mobile phase consisted of a mixture of methanol and water containing 0.1% acetic acid (55:45, v/v) at pH 4.5. The flow rate and run time were 300 µL/min and 2.5 min, respectively. The target drugs were detected in multiple reaction monitoring (MRM) mode using tandem mass spectrometer coupled to a positive ESI interface to monitor the precursor-to-product ion transitions. Method validation was assessed as per the FDA guidelines for determination of PLB, LTZ and CBL within the concentration ranges 0.5–600 ng/mL for PLB and LTZ and 0.2–200 ng/mL for CBL (r2 ≥ 0.997). The rest of validation parameters were within the accepted limits. The validated method was applied to PK study of these drugs in rats, and succeeded to determine the values of the PK parameters of PLB and LTZ.
Keywords
UHPLC-MS/MS
Palbociclib
Letrozole
Carbinol, method validation
Rat plasma
Pharmacokinetic

1 Introduction
Cancer is a group of diseases characterized by the uncontrolled development and spread of abnormal cells, which may result in death (Skeel and Khlief, 2011). Overall, 1.5 million new cases of breast cancer are reported annually worldwide (Finn et al., 2014). In Saudi Arabia breast cancer is the most common cancer, accounting for 27.4% of all newly diagnosed cancers in women (Al-Othman et al., 2015). Therefore, there is a vital essential to investigate new targets to overcome the resistance and/or enhance the current therapies (Matsumoto et al., 2016). In March 2017, the U.S. Food and Drug Administration (FDA) gave quickened endorsement for the new combination of the anticancer agents, (6-acetyl-8-cyclopentyl-5-methyl-2-(5-piperazin-1-ylpyridin-2-ylamino)-8H-pyrido(2,3-d)pyrimidin-7-one) (palbociclib, PLB) and (1-[Bis(4-cyanophenyl)methyl]-1,2,4-triazole) (letrozole, LTZ), as an initial endocrine based therapy in postmenopausal women (Rugo et al., 2019). The addition of palbociclib to letrozole significantly enhanced progression-free survival in women with ER-positive and HER2-negative breast cancer compared to that by treatment with letrozole alone (Finn et al., 2014).
PLB (molecular weight [Mwt] 448.14, Fig. 1) is an oral, potent, and the most advanced CDK4/6 inhibitor and has shown actual promising antitumor activity, particularly against the ERα+ breast cancer subtype (Rugo et al., 2019). PLB was absorbed with median time to achieve Cmax of 4–8 h. In vitro and in vivo studies indicated that PLB undergoes hepatic metabolism in human, which the major primary metabolic pathways involved oxidation and sulfonation, with acylation and glucuronidation contributing as minor pathways (Rugo et al., 2019). Up to now, there are no reports on the metabolite's studies of PLB (Chavana et al., 2018). LTZ (Mwt 286.07; Fig. 1) is a nonsteroidal competitive inhibitor of the aromatase enzyme system; which inhibits the conversion of androgens to estrogens by competitively binding to the heme of the cytochrome P450 subunit of the enzyme, resulting in a reduction of estrogen biosynthesis in all tissues (Letrozole, 2014).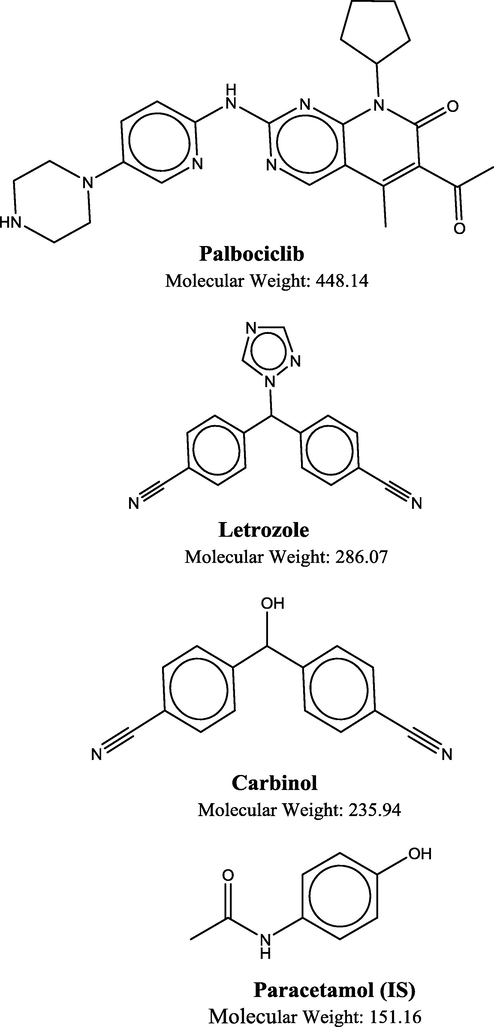
Chemical structure of palbociclib (PLB), letrozole (LTZ), carbinol (CBL) and paracetamol (IS).
The LTZ is rapidly and completely absorbed from the gastrointestinal tract. It is metabolized slowly to an inactive metabolite carbinol (bis (cyanophenyl) methanol) whose glucuronide conjugate is excreted renally, representing the major clearance pathway. Letrozole’s terminal elimination half-life is about 2 days and steady-state plasma concentration after daily 2.5 mg dosing is reached in 2–6 weeks. Plasma concentrations at steady state are 1.5 to 2 times higher than predicted from the concentrations measured after a single dose, indicating a slight non-linearity in the pharmacokinetics of letrozole upon daily administration of 2.5 mg (Letrozole, 2014).
Pharmacokinetic (PK) data display the time course of circulated drug concentrations and are considered very important in the evaluation of new biotherapeutics in drug development. In the early stages of drug discovery, preclinical PK studies are typically carried out in rat and other animal models. Different types of sampling are available such as traditional composite sampling, which is often used where time points across a time course are monitored in different animals, to obtain a sufficient volume of data for bioanalytical analyses. Serial sampling for PK studies is a beneficial approach used in bioanalytical laboratories (Joyce et al., 2014). From an ethical perspective, this approach is supported by the Ethics Committee of the Experimental Animal Care Society, College of Pharmacy, King Saud University, Riyadh, Saudi Arabia.
Due to the complex nature of the matrix (often plasma or urine) and the need for high sensitivity to observe concentrations after low dose administration over a long period, PK is often studied using the MS technique. The most common instrumentation used in this application is LC-MS with a triple quadrupole mass spectrometer; MS/MS is also usually used for additional specificity (Hsieh and Korfmacher, 2006; Covey et al., 1986; Covey et al., 1985). Currently, there is considerable interest in the use of very high sensitivity MS for micro-dosing studies, which are seen as a promising alternative to animal experimentation (ICH guideline, 2009).
Because this is a newly formulated anticancer combination, an UPLC-MS/MS method to simultaneously estimate this recent anticancer combination of PLB, LTZ and its metabolite carbinol (CBL) in any biological matrix is not available. Therefore, in this work, we aimed to develop and validate a sensitive, specific, selective, and rapid an UPLC-ESI-MS/MS method for the simultaneous determination of PLB, LTZ and CBL in rat plasma. We also aimed to evaluate the application of this method to rat PK studies.
2 Experimental
2.1 Chemicals and reagents
Reference standards of palbociclib (purity > 99%), letrozole (purity > 99%), and a carbinol (purity > 99%) were purchased from Toronto Research Chemicals (Toronto, Ontario, Canada). Paracetamol reference standard (purity > 99%), (internal standard; IS), was obtained from the Amoun Pharmaceutical Company (El-Obour City, Cairo, Egypt). HPLC grade solvents including methanol and acetonitrile (Panreac, Barcelona, Spain) were used in the study. Also, formic acid, acetic acid, trifluoracetic acid, ammonium acetate (Sigma Aldrich, Chemic GmbH, Steinem, Germany) was used. Ultrapure water involved in the study was obtained from Ultrapure water Milli-Q Advantage water purification system, 0.22 μm filter (Millipore, Molsheim, France).
2.2 Instrumentation and chromatographic conditions
Analyses were acquired on a Waters® Acquity Ultra Performance LC/(Milford, USA) supplied with sample manager (Acquity Ultra Performance LC/model code UPA, serial # K08UPA 993 M, product of USA) and Binary Solvent Manager (Acquity Ultra Performance LC/model code UPA, serial # C08UPA 634 M, product of USA). The instrument was also equipped with electrospray ionization spectrometry (Zspray™ ESI-APCI-ESCI, Acquity Ultra Performance LC) with multiple reaction monitoring (MRM)-mode using a triple-quadrupole mass spectrometer detector (STEP WAVE™, Ultra Performance LC/TQ Detector/model code TQD, serial # QBA489). Column Manager (Acquity Ultra Performance LC/model code OPM, serial # B11UPM 163G, product of Singapore). The data were acquired and processed using the Masslynx™ version 4.1 software (Micromass, Manchester, UK), Waters® Acquity Ultra Performance LC BEHC18 (1.7µmx2.1x50mm, made in Ireland). Sample filtration was performed using disposable syringe filters (CHROMAFIL Xtra PA-20/25 polyamide filter, pore size: 0.22 µm, filter-Ø:25 mm (MACHEREY NAGEL, GmbH &Co, KG. Duren, Germany).
Samples were separated on a reversed phase Acquity® UPLC BEH C18 column (1.7 μm particle size, 50 mm × 2.1 mm ID) in isocratic mode. The mobile phase consisted of a mixture of methanol and water containing 0.1% acetic acid (55:45, v/v) at pH 4.5. The column temperature and autosampler were kept constant at room temperature 25 °C. The injection volume was 5.0 µL with the full loop mode at a constant flow rate of 300 µL/min. The total run time was 3 min.
The LTZ, PLB and CBL were ionized via electrospray ionization (ESI) in positive ion mode. The acquisition was performed using multiple reaction monitoring (MRM) of the transitions from protonated precursor ions [M + H]+ to particular daughter ions to quantity each compound. Different MS parameters including the collision energy, capillary voltage and cone voltage were separately optimized for each compound. The selected collision energies that produced maximum intensities of the selected daughter ions of all studied drugs were summarized in Table 1. Moreover, the intensity of the particular fragment ion increased gradually with increased the cone voltage till certain optimum values after which a dramatic decrease was recorded. The selected optimum values for cone voltages for all studied drugs were shown in Table 1. Full scans mass spectra were recorded in order to select the most abundant m/z value. The most abundant precursor is m/z 448.14 → 379.96 for PLB, m/z 286.07 → 216.84 for LTZ, m/z 235.94 → 84.76 for CBL and m/z 151.90 → 92.68 for PAR (IS). The postulated fragmentation patterns of these agents are shown in Fig. 2. A source temperature of 150 °C was employed. Nitrogen was used as the desolvation gas at a flow rate of 800 L/h. Collision gas flow was set at 0.15 mL/min while cone gas flow at 150L/h. The dwell time of 0.025 s was used for all compounds. The resolutions of the MS analyzer were set as follows; low mass (LM) of 2.8 and high mass (HM) of 14.86. PLB, palbociclib; LTZ, letrozole; CBL, carbinol; PAR, paracetamol.
Drug
Precursor ion [M + H]+
Daughter ion
Cone voltage (V)
Collision energy (eV)
Desolvation Temp. (0C)
Ion mode
PLB
448.14
379.96
42
30
150
ES+
LTZ
286.07
216.84
20
12
150
ES+
CBL
235.94
84.78
38
22
150
ES+
PAR (IS)
151.90
92.68
30
22
150
ES+
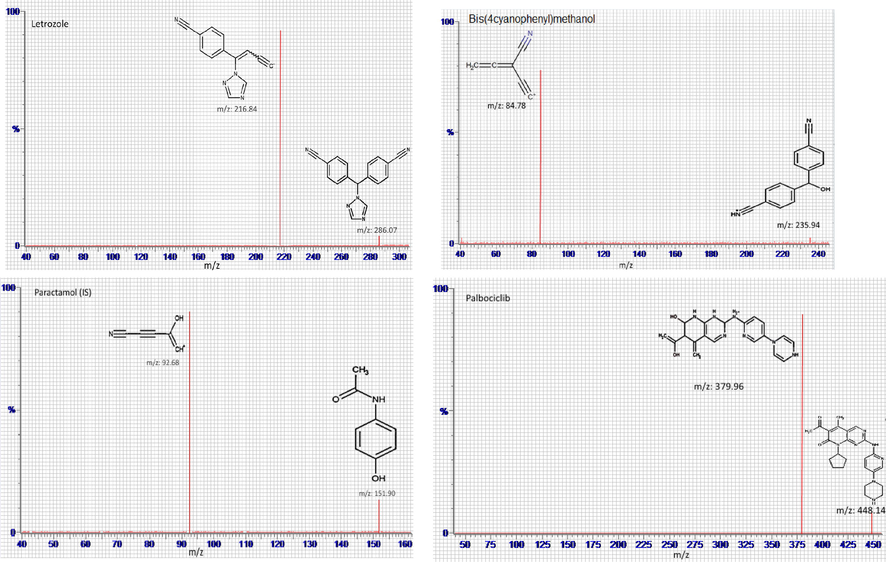
Product ion mass spectra of letrozole, carbinol, palbociclib and paracetamol (IS).
2.3 Preparation of stock, standard and quality control samples and calibration curve
Primary stock solutions of LTZ and CBL were prepared separately for use as standard and quality controls (QC) at concentration 10.0 µg/mL by dissolving 5.0 mg of LTZ and CBL in 1.0 mL of of dimethyl sulfoxide (DMSO); in 10.0 mL volumetric flask and complete to the mark with ultrapure water, then the serial dilution was achieved using ultrapure water. Also, primary stock solutions of PLB were prepared for use as standard and quality controls (QC) at concentration 10.0 µg/mL by dissolving 5.0 mg in 0.5 mL of ultrapure water with pH = 4.0 (acetic acid) in 10.0 mL volumetric flask then complete to the volume was similarly prepared using the same methodology for LTZ. Primary stock solution of paracetamol (IS) at concentration 10.0 µg/mL was similarly prepared using the same methodology for PLB. All solutions were found to be stable for 1 month if kept in refrigerator at 2–8 °C, and no evidence of degradation of LTZ, CBL, and PLB was observed in the chromatograms obtained during this period. The working standard solutions of PLB, LTZ (500.0 ng/mL) and of CBL (200.0 ng/mL) were used to spike a pool of blank rat plasma, followed by serial dilution with ultrapure water to obtain eight calibration standards at ranges of 0.5–600 ng/mL for PLB and LTZ and 0.2–200 ng/mL for CBL, respectively. The quality control (QC) standards were similarly prepared using the same methodology at five different concentration levels, namely, the lower LOQ (LLOQ) and lower, lower-medium, medium, and high QC (LQC, LMQC, MQC, and HQC, respectively) at 0.5, 1.5, 100, 300, and 550 ng/mL for PLB, LTZ and 0.2, 0.6, 50, 100, and 180 ng/mL for CBL, respectively. Sufficient calibration and QC standards were prepared to validate the method, and only three levels of controls were prepared as LQC, MQC, and HQC. All samples were stored at −20 °C. The calibration curve constructed with different concentrations of 0.5, 5, 50, 100, 180, 360, 480, and 600 ng/mL for LTZ and PLB; and concentrations of 0.2, 2, 10, 20, 50, 100, 150, and 200 ng/ml for CBL with along IS. The peak area ratios of each compound to IS were processed to obtain the calibration graph of each compound. Alternatively, the corresponding regression equation was derived.
2.4 Sample preparation
Simple protein precipitation was used to obtain samples free from endogenous components, which are essential for increasing recovery and minimizing matrix effects in UPLC-MS/MS. Different precipitating solvents, like methanol, ethanol, and acetonitrile have been tested. Acetonitrile proved to be the most suitable for removing endogenous components and obtaining clean plasma samples leading to acceptable matrix effect and recoveries, so it was used in the protein precipitation step (Polson et al., 2003). Before analysis, rat plasma samples were defrosted at room temperature. Rat plasma (50 μL) was spiked with different aliquots of the working standard solutions of PLB, LTZ and CBL with 50 µL of IS (500 ng/mL) in 2.0 mL disposable polypropylene microcentrifuge tubes. Each tube was diluted to 1350 μL with ultrapure water and gently mixed for at least 30 s. The mixture was treated with 500 μL of acetonitrile for deproteinization. The tubes were subsequently vortexes at high speed for 1 min and centrifuged at 6000 rpm for 30 min. The supernatants were transferred to clean Eppendorf tubes before evaporating to dryness (at 40 °C) under a gentle stream of nitrogen. The dry extracts were reconstituted in 100 µL of the mobile phase, filtered, and loaded into the autosampler tray. A 5.0 μL volume of the supernatant was then injected into the UPLC-MS/MS system for analysis. Blank plasma samples without PLB, LTZ, CBL or the IS were similarly processed.
2.5 Validation procedures
The method was validated for selectivity, carry-over, linearity, accuracy, precision, percentage recovery, matrix effect (ME), and stability, according to the US Food and Drug Administration (FDA) guidelines (US-FDA Guidelines, 2018).
2.5.1 Specificity and selectivity
The specificity of the method was determined by analyzing six different batches of rat plasma, including one without analyte and the IS (double blank samples), with the IS only (blank samples), and LLOQ samples with IS to demonstrate the lack of chromatographic interference from endogenous plasma components.
2.5.2 Calibration curve and LLOQ
The calibration curves were constructed in rat plasma by plotting the peak area ratio of the transition pair of analytes with that of the IS against the nominal concentration of the calibration standards. The concentrations used for PLB and LTZ were 0.5, 5, 50, 100, 180, 360, 480, and 600 ng/mL and those for CBL were 0.2, 2, 10, 20, 50, 100, 150, and 200 ng/mL.
2.5.3 Carry-over (residual) effect
The carry-over effect on the succeeding runs was assessed by sequentially injecting the following samples: blank plasma, LLOQ, blank plasma, the upper LOQ (ULOQ), and finally blank plasma. The carry-over effect in the blank sample following the high concentration standard should not be >20% of the LLOQ.
2.5.4 Precision and accuracy
The five different QC levels were used to assess the precision and accuracy of the assay by analyzing six replicates of each QC level on three separate days. The criteria for acceptability of the data include an accuracy ±15% the SD of the nominal values at each QC level (Hallur et al., 2018).
2.5.5 Recovery
Recovery was determined by comparing processed samples (HQC, MQC, and LQC, n = 6) to the reference PLB, LTZ and CBL solutions in blank rat plasma extracted at equivalent concentrations (Retmana et al., 2017).
2.5.6 Matrix effect
LC-MS quantitative analysis using the API or the ESI interface can be affected by ion (or signal) -suppression or ion-enhancement due to plasma. Therefore, matrix effect (ME should be critically investigated during method development and validation processes (Kim and Kang, 2016; Eeckhaut et al., 2009; Quintela et al., 2006). The effect of plasma constituents on the ionization of PLB, LTZ, CBL and the IS was determined by comparing the responses of the post-extracted plasma standard QC samples with the response of the neat analyte solutions in the mobile phases at equivalent concentrations (Eeckhaut et al., 2009). Plasma samples fortified with PLB, LTZ and CBL at three concentration levels covering the linear range.
2.5.7 Dilution integrity
Plasma samples spiked with high concentrations of 800 ng/mL for PLB and LTZ and of 300 ng/mL for CBL were used following dilution with blank plasma samples, dilution folds (1:2 and 1:4). Diluted samples were then treated as under described in Section 2.4.
2.5.8 Stability
The stability of the analytes was evaluated at the LQC and HQC levels in triplicate in different stabilities condition. Samples were considered stable if the assay values were within the acceptable limits of accuracy (±15% SD) and precision (≤15% RSD).
2.6 PK study in rats
Four Wistar healthy male rats, weighing 250 ± 30 g, were intraperitoneally injected with a combination of letrozole 2 mg/kg and palbociclib 25 mg/kg solution. The injected volume was 0.01 mL/g body weight. Blood samples (approx. 300 μL) were collected before drug administration, and at 30 min, 1, 2, 3, 4, 6, 8, 10, 12, 24, and 36 h after dosing in lithium heparinized tubes, which were placed in an ice-water bath (ARRIVE guidelines, 2018). Plasma was separated by centrifugation for 10 min at 3500 rpm at 4 °C and stored at −80 °C till further analysis. The study design was approved by the Animal Ethics Committee of the Pharmacology Department, College of Pharmacy, King Saud University, Kingdom of Saudi Arabia (No. KSU-SE-18-18) and all efforts were made to minimize the number of animals used and their suffering. Animals were housed in cages in a well-ventilated room and subjected to a regular 12 h day-night cycle at a relative humidity of 40–60% and average temperature of 24–27 °C. All rats had free access to water while diet was prohibited for 12 h before drug administration. Rats were acclimatized for 7 days to laboratory conditions before the experiment was conducted. For the fate of animals used in this study, a washout period (i.e., two weeks) was performed so that animals could be used in other studies in our laboratory. The non-compartmental model was used to calculate the pharmacokinetic parameters using WinNonlin software (Pharsight Co., Mountain View, CA, USA). The maximum plasma concentration (Cmax), time to achieve this (Tmax), area under curve zero to last and infinity (AUC0-24; AUC0-∞), half-life (T½), elimination rate constant (Kel) and mean residence time were measured. Statistical parameters like mean, standard deviation and % RSD were calculated by using MS-Excel 2013 (Microsoft).
3 Results and discussion
3.1 Selection and optimization of chromatographic conditions and MS detections
The aim of this work was to develop a rapid, selective and sensitive analytical method including an efficient and reproducible sample clean-up step for a quantitative analysis mixture of PLB, LTZ and CBL in plasma. Method development was begun with the optimization of chromatographic conditions, including mobile phase compositions, column temperature and flow rate. The feasibility of various mixtures of solvents such as methanol, acetonitrile with water and additive of 0.1%formic, 0.1% trifluoracetic acid, 0.1% acetic acid and 10 mM ammonium acetate were tested regarding peak shape, response, analysis time and peak area. Mobile phase consisted of methanol and water with 0.1% acetic acid (1:2, v/v) was shown to improve signal-to-noise ratio and thus found to be suitable for the chromatographic separation of the analytes especially, for CBL. Furthermore, investigated of selected mobile phase with different ratios of the methanol percentage (30–90%) and water each mixed with 0.1% acetic acid. The percentage of methanol in mobile phase had a significant effect on the separation and retention time, particularly for CBL. Best results were obtained when methanol as the organic modifier in the ratio of 55% along with the aqueous phase. Moreover, the percentage of acetic acid in the mobile phase was examined in the range (0.03–0.15%). It was noticed that acetic acid was essential to get sharp peak for CBL with a decrease in the retention time of all drugs upon increasing acetic acid content in the mobile phase. However, there was some tailing observed for CBL peaks with 0.15% acetic acid and the best results were achieved with 0.1% acetic acid. The analysis was thus performed with an isocratic elution using a mobile phase of methanol, water, each with 0.1% acetic acid (55:45, v/v) for the whole run time of 3 min. Under the above optimized chromatographic conditions, symmetric and sharp peaks of all drugs were obtained (LTZ eluted at 1.88 ± 0.04 min, PLB at 1.39 ± 0.08 min, CBL at 0.89 ± 0.11 min and IS at 0.57 ± 0.07 min).
The mass spectrometry (ESI-MS/MS) conditions were optimized to achieve the maximum stable response of the parents and the major productions of the analysts by infusing a standard mixture of PLB, LTZ, CBL and PAR at a concentration of 100 ng/mL in both positive and negative ionization modes. Comparatively, better analyte signal was appeared in positive mode for PLB, LTZ, CBL and PAR relative to the negative ionization mode, under different MS parameters. For the highest intensity of the protonated molecular ions, different MS/MS parameters were adjusted as follows: desolvation gas flow rate of 800 L/h and an ESI source temperature of 150 0C were found optimum in the analysis. On the other hand, the collision energy is an important parameter to get reasonable responses of the daughter fragment ions. However, increasing the collision energy resulted in an increased in the intensity of the particular fragment ion till optimum values after which a decrease in the intensity would be observed. The selected collision energies that produced maximum intensities of the selected daughter ions of the studied drugs were presented in Table 1.
3.2 Method validation parameters
3.2.1 Linearity and LLOQ
According to the FDA guidance for bioanalytical method validation, the calibration curve adequately describes the concentration versus response relationship if the observed deviation and precision are ≤15%. The calibration curve was linear from 0.5 to 600 ng/mL, for LTZ, PLB and 0.2–200 ng/mL for CBL, in the plasma (Table 2). The low value of LLOQ obtained for PLB, LTZ and CBL ensure the applicability of the developed method for the determination of trace concentrations PLB and LTZ in plasma, an important issue in PK studies.
Parameters
PLB
LTZ
CBL
Range (ng/mL)a
0.5–600
0.5–600
0.2–200
LLOQ (ng/mL)b
0.5
0.5
0.2
LLOD (ng/mL)c
0.2
0.2
0.06
Correlation coefficient®2
0.998
0.998
0.997
Equation
y = 0.9341x + 0.5642
Y = 0.1528x + 0.0863
Y = 0.0220x + 0.0051
Slope (b)
0.9341
0.1528
0.0220
Intercept (a)
0.5642
0.0863
0.0051
Sad
0.0871
0.0172
0.0313
Sbe
0.0105
0.0021
0.0004
Sy/xf
0.0336
0.0463
0.0753
Fh
7887.439
5369.9
5326.905
3.2.2 Precision and accuracy
Five QC concentrations were tested in the precision and accuracy assay in rat plasma. A summary of the data generated from the intra-day and inter-day tests (n = 6 each) is presented in Table 3. The RSD (%) and SE (%) values were well within the FDA’s acceptable criteria of <15% of the QC samples and <20% of the LLOQ sample. These results demonstrated the satisfactory precision and accuracy of the developed assay.
Drug
Actual Conc. (ng/mL)
Experimental Conc. (ng/mL)
RSD (%)a
Error (%)b
LTZ
Intra-day
0.5
0.47 ± 0.01
2.12
−6.00
1.5
1.43 ± 0.03
2.09
−4.66
100
94.39 ± 1.83
1.93
−5.61
300
287.97 ± 1.93
0.67
−4.01
550
533.72 ± 4.93
0.92
−2.96
Inter-day
0.5
0.47 ± 0.01
3.19
−6.00
1.5
1.44 ± 0.03
2.08
−4.00
100
94.67 ± 1.88
1.99
−5.33
300
269.26 ± 2.11
0.78
−3.58
550
530.81 ± 3.95
0.74
−3.49
CBL
Intra-day
0.2
0.19 ± 0.01
2.68
−5.00
0.6
0.58 ± 0.02
3.44
−3.33
50
49.36 ± 1.11
2.24
−1.28
100
98.11 ± 1.25
1.27
−1.89
180
178.06 ± 1.55
0.87
−1.08
Inter-day
0.2
0.19 ± 0.01
3.15
−5.00
0.6
0.57 ± 0.02
3.10
−6.66
50
49.02 ± 0.95
1.94
−1.98
100
98.75 ± 1.16
1.17
−1.25
180
176.51 ± 1.35
0.76
−1.94
PLB
Intra-day
0.5
0.48 ± 0.01
2.08
−4.00
1.5
1.47 ± 0.02
1.36
−2.00
100
96.32 ± 0.62
0.64
−3.68
300
283.76 ± 1.92
0.68
−5.08
550
519.75 ± 4.66
0.89
−5.50
Inter-day
0.5
0.47 ± 0.01
2.12
−6.00
1.5
1.46 ± 0.02
1.37
−2.66
100
96.16 ± 0.75
0.77
−3.84
300
293.25 ± 2.11
0.72
−2.25
550
537.02 ± 4.94
0.91
−2.36
3.2.3 Extraction recovery
The mean extraction recoveries determined using six replicates of QC samples at three concentration levels (LQC, MQC and HQC, n = 6) in rat plasma were shown in Table 4. Recovery values of not less than 95.52 for PLB, 94.66 for LTZ and 94.00 for CBL indicate a high degree of extraction recovery of the optimized method for all analytes from plasma samples.
Nominal concentration (ng/mL)
PLB
LTZ
CBL
1.5 ng/mL
300 ng/mL
550 ng/mL
1.5 ng/mL
300 ng/mL
550 ng/mL
0.6 ng/mL
100 ng/mL
180 ng/mL
Meana
1.46
286.55
531.11
1.42
290.55
527.51
0.564
95.79
178.11
Recovery (%)
97.33
95.52
96.56
94.66
96.85
95.91
94.12
95.79
98.95
SD
0.04
3.38
4.12
0.05
3.95
3.6
0.02
1.95
3.6
Precision (RSD%)
2.73
1.18
0.77
3.52
1.36
0.68
3.55
2.04
2.02
3.2.4 Matrix effect
Numerical values (%) for each concentration level were calculated by dividing the area of the extracted plasma sample spiked with the analyte and IS, by the area of the respective neat solution. The mean matrix effect values at three concentration levels of PLB, LTZ and CBL were more than 94.67% and the obtained RSD of the studied analytes were less than 4.83%, which demonstrates the proposed method was practically free from ME for the determination of LTZ, PLB and CBL in rat plasma. Since the ME was nearly negligible, trace analysis of LTZ and PLB in plasma samples was possible using the proposed method.
3.2.5 Specificity
The specificity of the method was assessed by comparing the chromatograms obtained from six batches of blank and plasma samples with those spiked with low concentrations equivalent to LLOQ of all studied drugs. The acceptance criteria for PLB, LTZ and CBL had a mean interference per batch less than 20% of the signal at LLOQ. The IS had a mean interference of less than 5% of the signal at the working concentration. No interference peak was detected at the retention time of PLB, LTZ, CBL and IS indicates a high degree of method specificity. Representative MS chromatograms of blank rat plasma samples and plasma samples spiked with LTZ, PLB and CBL at its LLOQ levels were shown in Figs. 3A and 3B.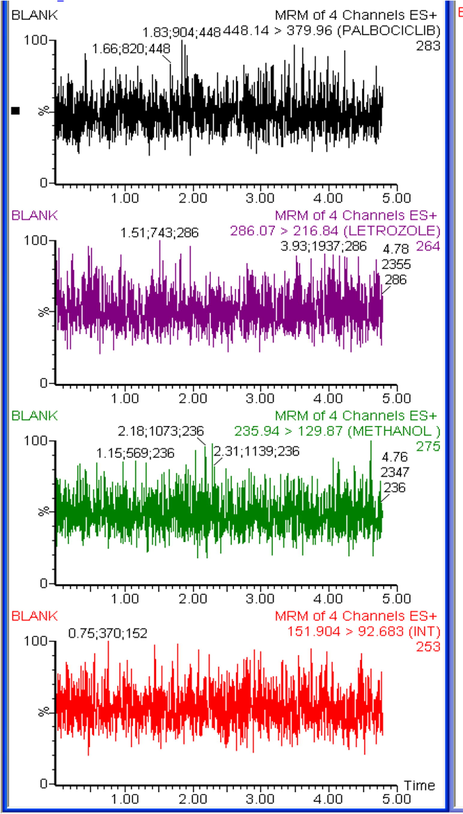
Typical multiple reaction monitoring (MRM) chromatograms for blank rat plasma.
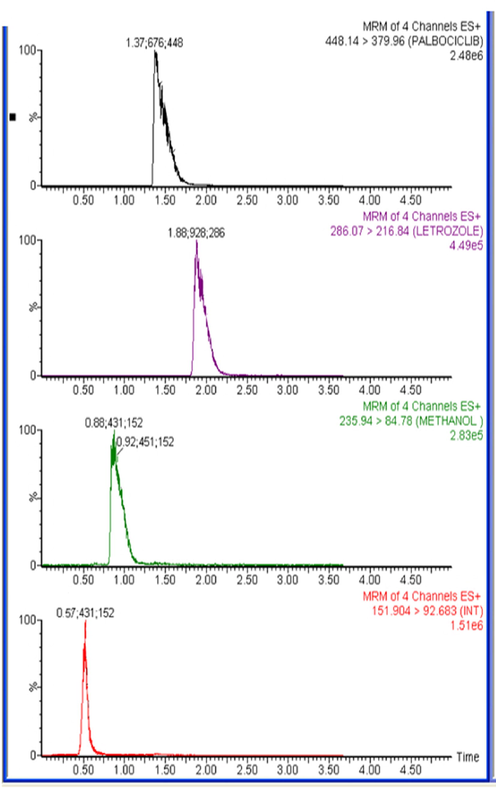
Typical multiple reaction monitoring (MRM) chromatograms for rat plasma spiked with LTZ (0.5 ng/mL), PLB (0.5 ng/mL), and CBL (0.2 ng/mL) along with IS (50 ng/mL).
3.2.6 Dilution integrity
To demonstrate the dilution integrity of three studied analytes, plasma samples were spiked with high concentrations of each of the studied drug beyond the linear range of the presented method and diluted with rat plasma (1:2 and 1:4) then analyzed. In each case, mean percentage recovery (±RSD) was calculated as presented in Table 5. All recovery results were within ±15% of the nominal values with % RSD ≤ 15 indicating the integrity of the analytes up to four times dilution of plasma samples.
Analyte
Spiked Conc. (ng/ mL)
Dilution fold
Mean recovery (%) ± RSDa
Er± (%)b
LTZ
800
1:2
99.10 ± 1.25
−0.86
1:4
98.31 ± 1.94
−1.68
CBL
300
1:2
98.66 ± 1.37
−1.38
1:4
98.02 ± 3.21
−1.97
PLB
800
1:2
98.22 ± 1.45
−1.78
1:4
99.23 ± 1.64
−0.78
3.2.7 Stability
The stability of PLB, LTZ and CBL of the stock solution and biological matrix was evaluated under all exposure conditions that might have been encountered before detection. PLB, LTZ and CBL displayed good stability in the stock solutions after storage at −80 °C for 30 days as stability values were in the range, 92.3–97.4% for LTZ, 97.3–99.2% for CBL and 92.4–96.9% for PLB; drug stability in rat plasma samples is summarized in Table 6. There was no obvious degradation of analytes after short-term storage, three freeze-thaw cycles, long-term storage, or storage in the autosampler, indicating that PLB, LTZ and CBL displayed good stability in all analyses. dExtract stability assesses the degradation of the processed sample relative to the starting material.
Mean recovery (%) ± RSDa
Drug
Nominal Conc. ng/ml
Auto-sampler stability (15 °C, 24 h)b
Short-term stability (25 °C, 6 h)c
Freeze-thaw stability (−80 °C, 3 cycles)e
long-term stability (−80 °C, 30 days)f
LTZ
0.5
93.47 ± 6.12
92.67 ± 1.20
93.97 ± 3.30
92.33 ± 0.83
600
96.79 ± 0.89
95.56 ± 1.81
96.67 ± 2.30
97.41 ± 1.19
CBL
0.2
98.89 ± 0.83
98.33 ± 0.92
98.20 ± 1.43
97.33 ± 1.96
200
99.41 ± 0.52
99.63 ± 0.32
99.31 ± 0.41
99.21 ± 0.21
PLB
0.5
93.43 ± 1.45
92.87 ± 1.55
91.40 ± 1.74
92.47 ± 1.39
600
94.69 ± 0.25
95.48 ± 1.49
95.43 ± 1.40
96.90 ± 0.30
3.2.8 Incurred samples reanalysis
All samples chosen for the incurred sample reanalysis (ISR) met the acceptance criteria, and the back-calculated accuracy values were in the range, 96.8–99.6%, in the initial assay, fulfilling the guideline criteria.
3.3 Application to pharmacokinetic study in rats
The pharmacokinetic parameters result for PLB, LTZ and CBL are summarized in Table 7. The results showed that LTZ is extensively metabolized to CBL as it was undetectable after 8 h after post administration of 2 mg/kg of LTZ. The Tmax and T1/2 of LTZ was 6 and 5.61 min only as compared to 8 and 1.39 min of CBL. PLB is also rapidly absorbed with Cmax of 516 ng/mL, which was achieved at 4 h after 25 mg/kg of post administration. The ratios of AUC (AUC0-24/ AUC0-∞) were found to be ≥ 89% for PLB, LTZ and CBL, demonstrating that our assay was sensitive enough to cover the elimination phase of these analytes. The representative MRM chromatogram of PLB, LTZ and CBL and IS after 6 h of intraperitoneal administration of LTZ (2 mg/kg) and PLB (25 mg/kg) are shown in Fig. 4, whereas the mean plasma concentration-time curves of PLB, LTZ and CBL in rats are shown in Fig. 5.
Parameter
Unit
PLB
LTZ
CBL
AUC0-24a
ng.h/mL
2952.42 ± 26.68
2821.82 ± 690.36
13.67 ± 1.69
AUC0-∞b
ng.h/mL
3034.68 ± 277.81
3166.94 ± 566.58
14.37 ± 0.85
Cmaxc
ng.h/mL
516.26 ± 66.27
286.47 ± 25.44
11.00 ± 0.85
Tmaxd
h
4.00 ± 0.12
6.00 ± 0.21
8.00 ± 0.19
t1/2e
h
2.11 ± 0.18
5.61 ± 0.87
1.39 ± 0.44
Kef
ng/mL
0.33 ± 0.03
0.13 ± 0.02
N/Ak
Vdg
mL/g
34.06 ± 2.76
3.03 ± 0.83
N/A
CLh
mL/min/kg
80.95 ± 13.61
15.92 ± 3.17
N/A
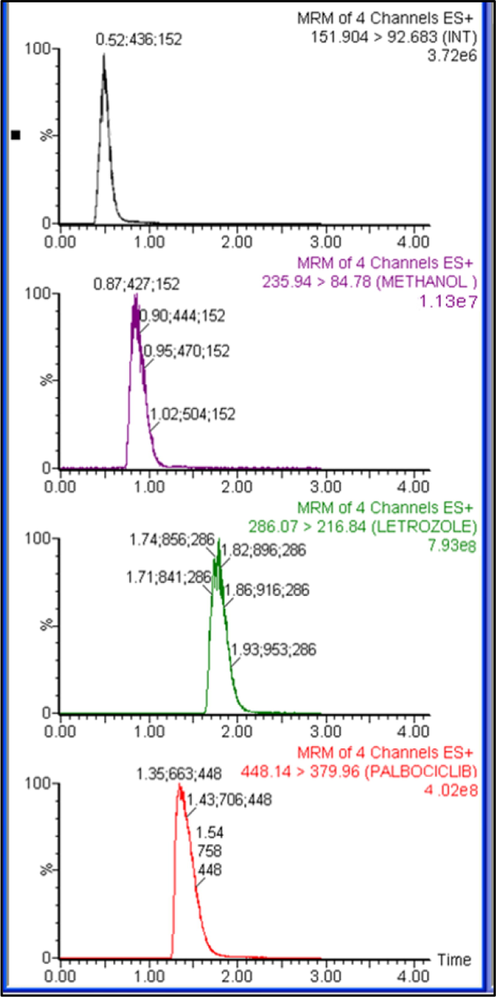
Typical multiple reaction monitoring (MRM) chromatograms in vivo rat plasma sample 6 h after intraperitoneal administration of letrozole (2 mg/kg) and palbociclib (25 mg/kg).
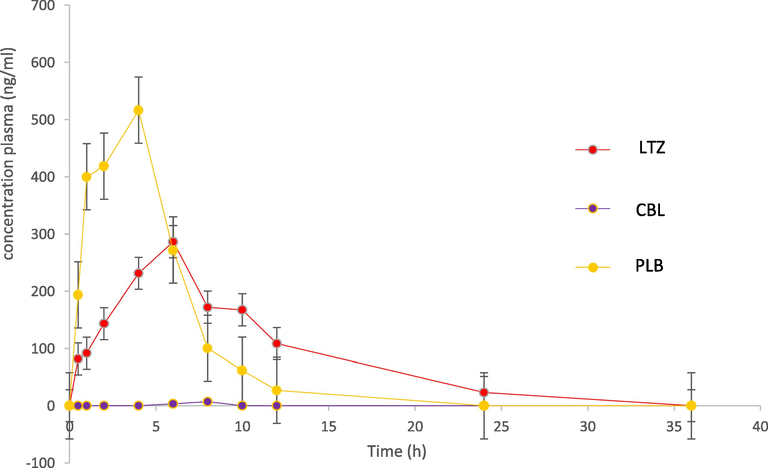
Concentration-time profile of a combination of letrozole (LTZ) and palbociclib (PLB) in rat plasma following intraperitoneal administration of LTZ (2 mg/kg) and PLB (25 mg/kg). Each point represents mean ± SD.
4 Conclusion
In this study, an UHPLC-MS/MS method has been developed and validated for simultaneous quantification of palbociclib (PLB) and letrozole (LTZ) with its metabolite carbinol (CBL) in rat plasma, for the first time. The increased specificity of the method with a decreased interference able to measure three analytes with linearity range of 0.5–600 ng/mL for PLB and LTZ and 0.2–200 ng/mL for CBL. This study takes advantage of simple protein precipitated to preparation of biological samples that provide many benefits for this developed method. The results offer significant advantages, including simple, rapid, specific, and sensitive. It also demonstrated good accuracy and precision and was fully validated based on the FDA guidelines. This method was successfully used in the rat PK study. In addition, the method could significantly contribute to the quality control of pharmaceutical formulations containing this combination of anticancer agents and could be easily applied to routine analyses and in bioequivalence study of these drugs.
Acknowledgement
The authors extend their appreciation to the Deanship of Scientific Research at King Saud University, Saudia Arabia, for funding the work through the research group project no. RGP-VPP-037.
Declaration of Competing Interest
The authors declare that they have no competing interests.
References
- Tackling cancer control in the gulf cooperation council countries. Lancet Oncol.. 2015;16:e246-e257.
- [Google Scholar]
- ARRIVE guidelines-NC3Rs. https://www.nc3rs.org.uk/arrive-guidelines. Retrieved March., 20, 2019.
- In vitro and in vivo metabolic investigation of the Palbociclib by UHPLC-Q-TOF/MS/MS and in silico toxicity studies of its metabolites. J. Pharm. Biomed. Anal.. 2018;157:59-67.
- [Google Scholar]
- Thermospray liquid chromatography/mass spectrometry determination of drugs and their metabolites in biological fluids. Anal. Chem.. 1985;57(2):474-481.
- [Google Scholar]
- High-speed liquid chromatography/ tandem mass spectrometry for the determination of drugs in biological samples. Anal. Chem.. 1986;58(12):2453-2460.
- [Google Scholar]
- Validation of bioanalytical LC-MS/MS assays: evaluation of matrix effects. J. Chromatogr. B. 2009;877:2198-2207.
- [Google Scholar]
- The cyclin-dependent kinase 4/6 inhibitor palbociclib in combination with letrozole versus letrozole alone as first-line treatment of oestrogen receptor-positive, HER2-negative, advanced breast cancer (PALOMA-1/TRIO-18): a randomized phase 2 study. Lancet Oncol.. 2014;16:25-35.
- [Google Scholar]
- LC-ESI–MS/MS determination of defactinib, a novel FAK inhibitor in mice plasma and its application to a pharmacokinetic study in mice. J. Pharm. Biomed. Anal.. 2018;149:358-364.
- [Google Scholar]
- Increasing speed and throughput when using HPLCMS/MS systems for drug metabolism and pharmacokinetic screening. Curr. Drug Metab.. 2006;7(5):479-489.
- [Google Scholar]
- Letrozole (Femara® tablets), 2014. https://www.accessdata.fda.gov/drugsatfda_docs/label/2014/020726s027lbl.pdf. Retrieved March, 20, 2019.
- ICH. Guidelines, 2009. ICH guidelines M3 (R2) on nonclinical safety studies for the conduct of human clinical trials and marketing authorization for pharmaceuticals, ICH, European Medicines Agency, 1–26.
- One mouse, one pharmacokinetic profile: quantitative whole blood serial sampling for biotherapeutics. Pharm. Res.. 2014;31(7):1823-1833.
- [Google Scholar]
- Matrix effects: Hurdle for development and validation of bioanalytical LC-MS methods in biological samples analyses. Biodesign.. 2016;4(2):46-58.
- [Google Scholar]
- Biological markers of invasive breast cancer. Jpn. J. Clin. Oncol.. 2016;46:99-105.
- [Google Scholar]
- Optimization of protein precipitation based upon effectiveness of protein removal and ionization effect in liquid chromatography-tandem mass spectrometry. J. Chromatogr. B. 2003;785:263-275.
- [Google Scholar]
- Liquid chromatography-tandem mass spectrometry for detection of low concentrations of 21benzodiazepines, metabolites, and analogs in urine: method with forensic applications. Clin. Chem.. 2006;52(7):1346-1355.
- [Google Scholar]
- Liquid chromatography-tandem mass spectrometric assay for the quantitative determination of the tyrosine kinase inhibitor quizartinib in mouse plasma using salting-out liquid-liquid extraction. J. Chromatogr. B. 2017;1061:300-305.
- [Google Scholar]
- Palbociclib plus letrozole as first-line therapy in estrogen receptor-positive/human epidermal growth factor receptor 2-negative advanced breast cancer with extended follow-up. Breast Cancer Res. Treat. 2019
- [CrossRef] [Google Scholar]
- Skeel, T.R., Khlief, S.N., 2011. Handbook of Cancer Chemotherapy, Lippincott Williams & Wilkins Handbook Series, eighth ed., Philadelphia, PA, USA.
- US-FDA, Bioanalytical method validation guidance for industry. https://www.fda.gov/ucm/groups/fdagov-public/@fdagov-drugsgen/documents/document/ucm070107.pdf, 2018. Retrieved March, 20, 2019.


