

Translate this page into:
Development and validation of novel LC–MS/MS method for determination of Lusutrombopag in rat plasma and its application to pharmacokinetic studies
⁎Corresponding author. narendradec1984@gmail.com (N. Singh)
-
Received: ,
Accepted: ,
This article was originally published by Elsevier and was migrated to Scientific Scholar after the change of Publisher.
Peer review under responsibility of King Saud University.
Abstract
A sensitive HPLC-MS/MS assay for analysis of Lusutrombopag in plasma sample. Recently implemented FDA guideline was followed for method validation. Successfully applied in metabolic stability and pharmacokinetic study in rats.
Abstract
A novel, simple and sensitive method for the determination of Lusutrombopag in rat plasma using liquid chromatography coupled with tandem mass spectrometry (LC-MS/MS) was developed and validated. The determination was performed on an API4000 triple quadrupole mass spectrometry in the multiple reaction monitoring mode using the respective [M+H]+ ions m/z 593.1 → 272.3 for Lusutrombopag. The limit of detection was 0.5 ng/mL, and the lower limit of quantification was 2.0 ng/mL in rat plasma. Good linearity was obtained over the range of 2.0–150.0 ng/mL and the correlation coefficient was found to be 0.9998. The intra and inter-day precisions were found to be 3.8–6.9% and 6.8–10.5%, respectively. The intra and inter-day accuracy derived from QC samples was found to be 2.5–4.9% and 5.5–7.2%, respectively. The analyte was stable under various conditions (at room temperature, during freeze-thaw, in the autosampler and under deep-freeze conditions). The F-test and t-test at 95% confidence level were subjected on data for statistical analysis. The developed method was successfully applied to the pharmacokinetic study in rats.
Keywords
Development and validation
Novel LC-MS/MS method
Lusutrombopag
Pharmacokinetic studies
ICH

1 Introduction
Lusutrombopag (LMB) is an orally bioavailable thrombopoietin receptor (TPOR) agonist. The chemical name for LMB is (2E)‐3‐{2,6‐Dichloro‐4‐[(4‐{3‐[(1S)‐1‐(hexyloxy) ethyl]‐2‐methoxyphenyl}‐1,3‐thiazol‐2‐yl) carbamoyl]phenyl}‐2‐methylprop‐2‐enoic acid and empirical formula is C29H32Cl2N2O5S (Kim, 2016; Sakamaki et al., 2017). The structure of LMB is shown in Fig. 1. TPOR is a regulatory target site for endogenous thrombopoietin, which acts as a primary cytokine to promote megakaryocyte proliferation and differentiation. It affects other hematopoietic lineages as well, including erythroid, granulocytic and lymphoid lineages. Thrombocytopenia, which indicates abnormally low levels of platelets, is a common complication related to chronic liver disease (Sato et al., 2017; Ninos et al., 2006; Kuter, 2013). This hematological abnormality, especially in cases of severe thrombocytopenia (platelet count <50,000/μL), creates challenges to patients requiring invasive medical procedures where significant risk for spontaneous bleeding. LMB binds to the transmembrane domain of TPOR expressed on megakaryocytes, and causes the proliferation and differentiation of megakaryocytic progenitor cells from hematopoietic stem cells (Patel et al., 2005; Yoshida et al., 2018; Peck, 2017; Baertschi et al., 2016; Bonfiglio et al., 1999; Tateishi et al., 2019; Afdhal et al., 2008; Hayashi et al., 2014; Handa, 2009).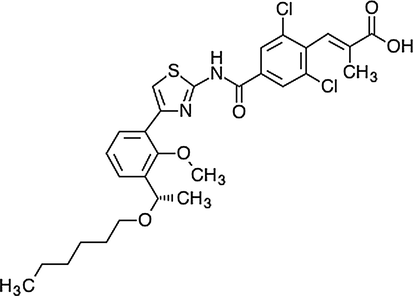
Structure of LMB.
Solid-phase extraction (SPE) has been demonstrated to be a cost-effective and reliable technique for the selective isolation and concentration of a variety of analytes and sample matrices. It offers many improvements over conventional techniques such as liquid–liquid extraction. Some of the classic applications for SPE include drug analysis in pharmaceutical dosage forms, clinical applications for drugs in physiological matrices, extraction of pesticides, purification of peptides and growth promoters from foods. SPE was invented as an alternative to liquid/liquid extraction and eliminated many drawbacks, such as usage of large amount of solvent, high cost, potential sources of error and extended operation time/procedure steps. Moreover, SPE can be plied to the samples combined with other analytical methods and sample preparation techniques optionally. SPE is routinely used in the sample preparation for quantifying analytes in biological fluids such as plasma and urine. This technique allows both removal of interfering biological matrix components and enhancing the concentrations of analytes in LC/MS samples. Its ability to solve sample preparation problems has been well documented in the literature over the past two decades. There is a wide choice of sorbents for SPE including; polar, nonpolar, ion exchange and mixed mode chemistries and they provide the analyst with the selectivity which is necessary to obtain clean extracts for analysis (Awadh et al., 2019; Zeid and Mohammad, 2019).
In order to support (pre)clinical studies with LMB, it is necessary to develop bio-analytical assays that are able to monitor the concentration of LMB in different biological matrices. Now a day, the high sensitivity and selectivity of tandem mass spectrometry (MS-MS) is a unique analytical tool for the quantification of drugs from nanogram (ng) to pictogram (pg) level in biological matrices. The key advantages of LC-MS/MS technique are improved precision and accuracy, better selectivity, high sensitivity and rapidity. However, to the best of our knowledge, no LC method for the quantification of the LMB in rat plasma using liquid chromatography-tandem mass spectrometry has been reported so far. Therefore, the aim of the present study is to develop and validate a novel, simple, sensitive, rugged and accurate method for the quantification of LMB in rat plasma, which could be applied to the pharmacokinetic study.
2 Materials and methods
2.1 Chemicals and reagents
LMB standard (purity 99.6%) was obtained from Zuvius Lifesciences Pvt. Ltd. (Maharashtra). LC-MS grade water, acetonitrile and methanol of HPLC quality were procured from Merck (Darmstadt, Germany). Ammonium acetate, formic acid and ortho phosphoric acid were procured from Anaqua Chemicals Supply (Houston TX). HPLC grade water was used throughout the study. Other chemicals used were of analytical or HPLC grade.
2.2 LC-MS/MS instrument and conditions
The LC–MS/MS system was made up of an API 4000 mass spectrometer (Applied Bio-systems, MDS Sciex Toronto, Canada) equipped with an electrospray ionization (ESI) source system, and an Agilent 1200 HPLC system (Wilmington, DE) consisting of a vacuum degasser, a binary pump and an auto-sampler. LMB was separated on a Synergi Polar-RP column (50 × 2.0 mm, 4 μm) eluting with mobile phase system, which consisted of water and acetonitrile (20:80, v/v) containing 0.2% formic acid (v/v) as a modifier at flow rate of 0.4 mL/min. The sample injection volume was 5 µL and the column temperature was maintained at 35 °C. The ion spray voltage was set at 4500 V. The instrument parameters, viz., nebulizer gas, auxiliary gas, curtain gas and collision gas were set at 50, 60, 30 and 10 psi, respectively. Compounds parameters, viz., declustering potential (DP), collision energy (CE) and collision exit potential (CXP) were 74, 41 and 15 V, respectively for LMB. Zero air was used as the source gas while nitrogen was used as both curtain and collision gas. The mass spectrometer was operated in an ESI positive ion mode. Data acquisition and quantitation were performed using analyst software version 1.4.1 (Applied Bio-systems, MDS Sciex Toronto, and Canada).
2.3 Preparation of stock solution, calibration and quality control (QC) samples
A stock solution of LMB was prepared in methanol at a concentration of 1.0 mg/mL. The LMB stock solution was further diluted in methanol to make LMB working solutions for standards (15.0, 12.0, 10.0, 8.0, 5.0, 2.0, 1.0, 0.5 and 0.2 μg/mL) and QC samples at 14.0 (high), 7.0 (medium), 0.7 (low) μg/ml). LMB working solutions were then spiked (100 times dilution) into rat plasma to make calibration standards and QC samples. The resulting concentrations of standard samples were 150.0, 120.0, 100.0, 80.0, 50.0, 20.0, 10.0, 5.0 and 2.0 ng/mL. The resulting concentrations of QC samples were 140.0, 70.0 and 7.0 ng/mL. Calibration standards and QC samples were prepared freshly daily.
2.4 Sample preparation
A simple SPE method was followed for the extraction of LMB from rat plasma. Rat plasma samples (100 µL) were pipetted into the 1.5 mL Eppendorf tubes and followed by 100 µL of methanol. The mixture was mixed for 30 s by a vortex before each sample was centrifuged (15,000g) for 5 min and then loaded on an Agilent Bond ElutPlexa SPE cartridges (30 mg, 1 cc) SPE column which was preconditioned with 1.0 mL of methanol and then 1.0 mL of ultrapure water. After washing with 1.0 mL of water followed by vacuum drying, the analyte were then eluted with 1.0 mL of methanol. Subsequently, the collected eluent was completely evaporated to dryness by a gentle stream of nitrogen at 40 °C. The residue was reconstituted in 100 µL of the mobile phase and 5 µL of the sample solution was injected into the LC-MS/MS system for bioanalysis.
2.5 Method validation
A full method validation was performed according to bioanalytical method validation guidelines for industry published by United State Food and Drug Administration (USFDA). Bio-analytical method validation by evaluating selectivity, linearity, lower limit of quantitation (LLOQ), intra and inter-day precisions and accuracy, recovery, matrix effect, and stability. Selectivity was evaluated by analyses of six blank rat plasma obtained from different drug-free rats. There should be no interferences at the respective retention times of LMB. Three replicates of LLOQ concentration of LMB were prepared by spiking blank rat plasma at the lowest standard concentration in the calibration curve. The determination value of precision within 20% was thought to be acceptable. The linearity of this method was determined by analysis of standard plots associated with nine point standard calibration curve. The matrix effect was evaluated by comparing the peak area of analytes resolved in the blank sample with that resolved in methanol. The accuracy and precision was calculated and expressed in terms of % bias and %RSD. Values should be within 15%, except LLOQ. The matrix effect was determined by dividing slopes of calibration curves of LMB in the rat blood matrix and mobile phase. The stability of method (include freeze-thaw stability, autosampler stability, short-term stability and long-term stability) was evaluated from three QC samples. The freeze (-80 °C)-thaw (room temperature) stability was conducted under the conditions of three freeze–thaw cycles. The autosampler stability of the plasma samples was investigated by the extracted QC samples that were kept in an autosampler (4 °C) for 12 h. In addition, the long-term stability was evaluated through the determination of three QC samples that were kept at −80 °C for 30 days. All samples were considered stable with RSDs < ±15% (ICH, 1996; ICH Harmonised Tripartite Guideline, 2005; ICH, 2002, 2005, 2003, 1996; US DHHS, 2013, 2001; FDA, 1996, 2001; Guidance for Industry on Bioanalytical Method Validation, 2001; Smith, 2012; Hassan and Bahrani, 2014; Ramesh et al., 2019; Chwatko et al., 2019; Harona et al., 2019).
2.6 Pharmacokinetic application
Specific-pathogen-free grade healthy Wistar rats (250 ± 50 g, 6 males and 6 females) were supplied by Medical Laboratory Animal Center (Saudi Arabia). Rats were housed in an environmentally controlled breeding room [temperature (25 ± 2) °C, humidity (60 ± 5)%, 12 h dark/light cycle] for 1 week before the experiment. All rats were fed a soy-free custom diet and water ad libitum. The animal experiment was approved according to the guidelines of the National Research Council, AMU University, Saudi Arabia. All experiments were carried out in accordance with the ethical guidelines for experimental studies with animals as per the local Research Ethics Committee. All rats were allowed free access to food and water, and were fasted overnight before the pharmacokinetic experiment with free access to water. Rats were orally gavaged with LMB at a single dose of 3.0 mg/kg. Blood samples (approximate 0.1 mL) were obtained from the orbital vein before dosing at 0.00, 0.25, 0.75, 1.00, 1.25, 1.50, 1.75, 2.00, 2.50, 3.00, 3.50, 4.00, 4.50, 5.00, 5.50, 6.00, 8.00, 12.00, 16.00, 20.00 and 24.00 h after oral dosing of LMB. The samples were placed in heparinized tubes and plasma was isolated by centrifugation at 3000 r·min−1 for 10 min. All plasma samples were stored at −20 °C until analysis (US FDA, 2001; Guideline for performance of blood transfusion, 2005). The plasma concentrations of LMB at different time points were expressed as mean ± SD (standard deviation, SD).
2.7 Data statistics
All values were expressed as mean ± SD. Pharmacokinetic parameters for LMB in rats were analyzed by non-compartmental analysis of data using Origin 86 (OriginLab Corporation, Massachusetts, USA) and Phoenix Winnolin 6.3 (Certara, Princeton, USA) software.
3 Results and discussion
3.1 Sample pre-treatment
Sample pre-treatment is to remove the interference of endogenous plasma constituents with a high relative extract recovery of analyte. Several sample pre-treatment methods were investigated and compared. Protein precipitation using acetonitrile or methanol gave the low extraction recovery and strong interferences from endogenous substances in plasma. Liquid–liquid extraction with various organic solvents such as ethyl acetate, n-butanol and diethyl ether and their mixtures resulted in non-reproducible recoveries and interferences in the plasma sample matrix. Hence, SPE was applied to extract LMB from rat plasma. We found that Agilent Bond ElutPlexa SPE cartridges (30 mg, 1 cc.) SPE column obtained satisfying extracted recovery of LMB.
3.2 Chromatography
The main objective of this work was to develop a novel, simple and sensitive method for the determination of LMB in rat plasma using liquid chromatography coupled to tandem mass spectrometry (LC-MS/MS). The development of the HPLC method followed systematic changes of the chromatographic factors. The process involved the selection of appropriate conditions and their optimization. These conditions included the type of column packing, column dimensions, mobile phase composition with flow rate, oven temperature and sample amount. The stationary and mobile phases play an important role on theoretical plate, peak shape, symmetry and resolution. To obtain symmetrical peak with better resolution and peak purity, various chromatographic conditions were investigated and optimized for the determination of LMB. In order to obtain a suitable stationary phase, a lot of commercially available column were assessed including Synergi hydro-RP C18 (50 × 2.0 mm, 4 μm), Symmetry C18 Column (3.5 µm, 4.6 mm × 50 mm), Eclipse Plus C18 (3.5 µm, 2.1 × 50 mm) and Gemini® C18 (5 µm, 50 × 4.6 mm). In respect of the peak shape, retention time, sensitivity, carry-over and baseline noise for analyte, the Synergi Polar-RP column (50 × 2.0 mm, 4 μm) column was found to be optimal, which exhibited good peak shape and retention time. As the LMB was difficult to be eluted and the carry-over effect was observed, hence the composition of mobile phases was also investigated. As a consequence, water and acetonitrile (20:80, v/v) containing 0.2% formic acid (v/v) as a modifier at flow rate of 0.4 mL/min was optimal mobile phase. The retention time for LMB was 4.1 min. Finally, the mobile phase containing water and acetonitrile (20:80, v/v) containing 0.2% formic acid (v/v) at a flow-rate of 0.4 mL/min was selected and found to be optimal with more theoretical plates (≥14,101), narrow peak, high peak symmetry (0.95 and 1.06) and short retention time (below 5 min).
3.3 Optimization of mass spectrometric condition
The mass spectrometry parameters were optimized by directly infusing the 1.0 μg/mL standard solution of LMB into the mass spectrometry. Taking the signal response into consideration, the positive mode was chosen to quantify LMB. Under the positive ESI conditions, LMB produced predominantly protonated molecule [M+H]+ at m/z 593.1 in Q1 full scan mass spectra. The corresponding product ion mass spectra was showed in Fig. 2, where [M+H]+ of each compound was selected as precursor ion. We were chosen transition m/z 593.1 → 272.3 for quantification analysis due to its more stable and less disturbed.![Production mass spectra of [M+H]+ ion of LMB.](/content/184/2020/13/2/img/10.1016_j.arabjc.2019.06.014-fig2.png)
Production mass spectra of [M+H]+ ion of LMB.
3.4 Method validation
3.4.1 Selectivity and specificity
In the present study, the specificity and selectivity were examined using independent plasma samples from six different rats. Fig. 3 shows a typical chromatogram for the rat blank plasma (Fig. 3a), rat plasma spiked with LMB (Fig. 3b), rat plasma spiked with LLOQ (Fig. 3c) and an in vivo rat plasma sample after oral administration of LMB (Fig. 3d). As shown in Fig. 3, there is no significant interference from plasma found at retention times of LMB. The retention time of LMB was approximately 4.1 min. The results indicated that the method exhibited good specificity with selectivity and was applied to plasma samples for the pharmacokinetic study.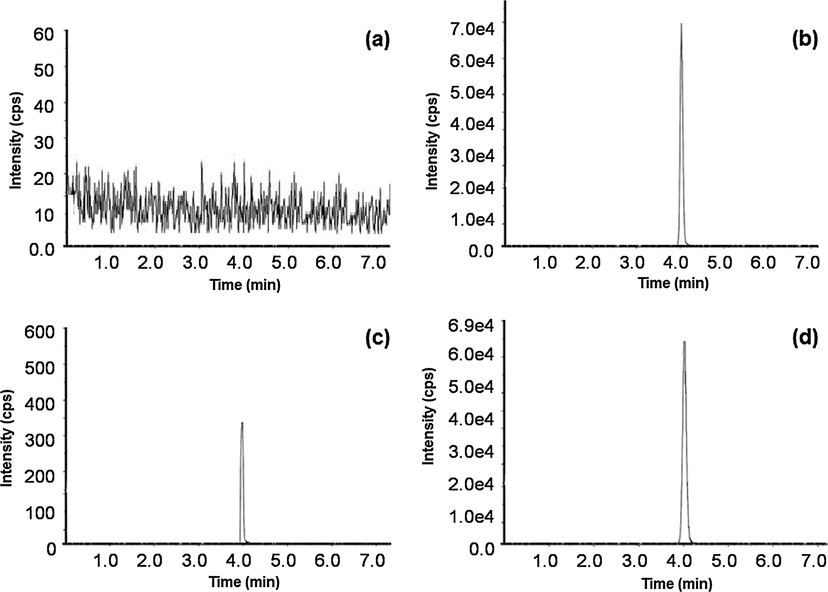
Typical chromatograms of (a) rat blank plasma; (b) rat plasma spiked with 120.0 ng/mL of LMB (c) rat plasma spiked with LLOQ of LMB (d) plasma sample showing LMB peak obtained following oral dose of 3.0 mg/kg LMB to rats.
3.4.2 Limit of detection, the lower limit of quantification and the linearity
The LOD of the LMB assays demonstrated as 0.5 ng/mL (S/N ≥ 3), and the LLOQ was 2.0 ng/mL. The calibration curves ranged from 2.0 to 150.0 ng/mL using nine calibration standards. The regression equation for calibration curves in plasma was y = 1.576 ± 0.015x + 5.469 ± 0.028 (n = 5), where y is the peak-area of analyte, and x is the concentration of LMB. The correlation coefficient (r2) was ≥0.9998 ± 0.0042 for all the calibration curves, and the observed deviation was within ±6.3% for all the calibration concentrations. The results confirmed the linearity and the reproducibility of the assay method. Regression characteristics of the proposed HPLC method are given in Table 1. The results clearly indicate that the calculated value (cal) is less than the critical value (cri), hence there is no significant difference between five calibration curves (n = 5) generated on consecutive days. The method was found to be sufficiently sensitive for the determination of the pharmacokinetic analysis of LMB in rats. The results showed that an excellent correlation existed between peak area and concentration of drug within the selected concentration range. Data are presented as mean ± SD of five calibration curves (n = 5).
Linearity parameter
LMB
Range
2.0–150.0 ng/mL
Slope
1.576 ± 0.015
Intercept
+5.469 ± 0.028
Regression coefficient (r2)
0.9998 ± 0.0042
F-test
1.82 cal (6.02cri)a
t-test
0.37 cal (1.77cri)a
3.4.3 Matrix effect
In this study, the matrix effect was evaluated by analyzing the low (7.0 ng/mL), middle (70.0 ng/mL) and high (140.0 ng/mL) QC samples. The results are summarized in Table 2. The average matrix effect values were 97.1 ± 2.8, 101.7 ± 4.2 and 103.2 ± 3.1% for LMB at low, middle and high QC, respectively. The matrix effect on the ionization of the analyte was not obvious under these conditions.
Spiked plasma concentration (ng/mL)
Measured concentration (ng/mL)
Matrix effect (%)
RSD (%)
7.0
6.8 ± 0.3
97.1 ± 2.8
10.2
70.0
71.2 ± 2.9
101.7 ± 4.2
8.8
140.0
144.5 ± 6.2
103.2 ± 3.1
5.7
3.4.4 Extraction recovery
The extraction recovery was determined in five replicates by comparing the peak areas of the extracted plasma at 7.0, 70.0 and 140.0 ng/mL with those obtained from the direct injection of standard solutions without preparation at the same concentrations. The extraction recoveries of LMB were 92.9 ± 3.5%, 86.7 ± 6.6% and 89.4 ± 5.7% for QC samples at the concentrations of 7.0, 70.0 and 140.0 ng/mL, respectively. All the data are summarized in Table 3. The recovery of the determination of LMB in rat plasma was consistent, precise and reproducible.
Spiked plasma concentration (ng/mL)
Measured concentration (ng/mL)
Extraction recovery (%)
RSD (%)
7.0
6.5 ± 0.5
92.9 ± 3.5
9.5
70.0
60.7 ± 8.8
86.7 ± 6.6
6.8
140.0
125.2 ± 19.3
89.4 ± 5.7
7.9
3.4.5 Accuracy and precision
The accuracy and precision data for intra and inter-day plasma samples are presented in Table 4. The assay values for both occasions (intra and inter-day) were found to be within the accepted variable limits. The intra and inter-day precisions were found to be 3.8–6.9% and 6.8–10.5%, respectively. The results obtained from intra and inter day were evaluated statistically using the F-test and student’s t test. The calculated value of F-test and student’s t test indicated that the intra and inter day data did not differ significantly in terms of precision. The intra and inter-day accuracy were found to be 2.5–4.9% and 5.5–7.2%, respectively. The data indicated that the present method has a satisfactory accuracy, precision and reproducibility. All of the RE (%) and RSD (%) values met the acceptance limits established by the guidance of the US Food and Drug Administration Bioanalytical Method Validation (2015).
Spiked plasma concentration (ng/mL)
Intra-day
Inter-day
Measured concentration (ng/mL)
Precision (RSD, %)
Accuracy (RE, %)
Measured concentration (ng/mL)
Precision (RSD, %)
Accuracy (RE, %)
2.0
2.1 ± 0.1
5.7
2.9
2.2 ± 0.1
9.1
3.8
7.0
6.2 ± 0.3
3.9
4.9
6.3 ± 0.2
8.2
6.7
70.0
62.7 ± 6.1
6.9
2.5
71.3 ± 5.7
10.5
5.5
140.0
128.1 ± 12.6
3.8
3.9
125.7 ± 18.4
6.8
7.2
3.4.6 Stability
QC samples at three concentrations were analyzed in five replicates for studying the possible conditions to which the samples might be exposed during storage and handling. It was found that LMB was stable in rat plasma after being stored at room temperature for 4 h, after repeated three freeze-thaw cycles and after being stored at −70 °C for 30 days. In addition, the treated samples were found to be stable in the autosampler for a period of 24 h, and the results were found to be within the assay variability limits during the entire process. All results of the stability tests are summarized in Table 5.
Storage conditions
Concentration (ng/mL)
RSD (%)
RE (%)
Spiked
Measured (mean ± SD)
At room temperature for 4 h
7.0
7.1 ± 0.2
2.9
5.1
70.0
68.3 ± 3.7
3.1
−3.8
140.0
141.5 ± 7.6
6.4
4.3
After three freeze/thaw cycles in plasma
7.0
6.9 ± 0.3
3.3
−4.1
70.0
71.5 ± 2.8
4.5
6.6
140.0
148.2 ± 9.3
8.1
5.9
In the auto-sampler for 24 h
7.0
7.2 ± 0.2
4.8
2.9
70.0
73.6 ± 3.7
6.9
7.5
140.0
150.1 ± 8.2
9.2
4.6
Long-term stability (at −70 °C for 30 days)
7.0
7.1 ± 0.2
4.2
10.2
70.0
75.2 ± 2.9
7.6
6.8
140.0
152.2 ± 9.5
10.3
10.4
3.4.7 Robustness
Upon variation of the flow rate, the column temperature, and the percentage of acetonitrile in aqueous phase, the retention time shift of LMB remained statistically not significant at the 95% level using ANOVA.
3.4.8 Carry over
The highest calibration sample of LMB was injected after blank rat sample for evaluation of carry over effect. The average carry-over was 4.3% (below 20%) for LMB, indicating that the carry-over has no impact on the results.
3.5 Pharmacokinetic study
We applied the newly developed LC–MS/MS method to the pharmacokinetic study of LMB and successfully obtained a series of the pharmacokinetic data of LMB in twelve rats after oral administration of 3.0 mg/kg. The sensitivity and specificity of the assay were found to be sufficient for accurately characterizing the plasma pharmacokinetics of LMB in rats. The mean plasma concentration–time profiles of LMB after oral administration is illustrated in Fig. 4, and the major pharmacokinetic parameters of LMB after oral administration were calculated by a non-compartmental model and are presented in Table 6. The values of Cmax and Tmax were obtained directly from experimental observations. The mean of Cmax and Tmax were 42.48 ± 24.78 ng/mL and 1.05 ± 0.19 h, respectively. Plasma concentration declined with at t1/2 of 2.57 ± 1.62 h. AUC0→24 and AUC0→∞values obtained were 103.79 ± 5.02 ng h/mL and 125.63 ± 9.37 ng h/mL, respectively. Cmax, maximum concentration; Tmax, time to reach maximum concentration; AUC0→24, area under the concentration time curve from 0 to 24 h; AUC0→∞, AUC from 0 h to infinity; t1/2, half-life; Vd = volume of distribution.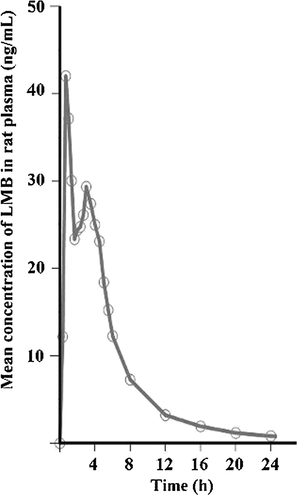
Plasma concentration–time profiles of LMB in rat plasma after oral administration dose of 3.0 mg/kg to rats (n = 12).
Parameters
Mean ± SD
Cmax (ng/mL)
42.48 ± 24.78
Tmax (h)
1.05 ± 0.19
AUC0→24 (ng h/mL)
103.79 ± 5.02
AUC0→∞(ng h/mL)
125.63 ± 9.37
Kel (h)
0.1012 ± 0.011
t1/2 (h)
2.57 ± 1.62
Vd(L)
18.65 ± 4.33
4 Conclusion
A novel, simple and sensitive LC-MS/MS method has been developed for quantification of LMB in rat plasma using solid phase extraction for the first time. This method was completely validated and applied to a pharmacokinetic study of LMB in rats after oral administration at a dose of 3.0 mg/kg. Validation experiments proved that the developed LC-MS/MS method is linear in the proposed working range as well as accurate, precise and specific. F-test and t-test were applied to the data at 95% confidence level, and no statistically significant difference was observed. The validated method was successfully applied to a pharmacokinetics study of LMB along with a simple solid phase extraction method and less solvent consumption will enable its use in further bioequivalence studies.
Acknowledgement
The authors are grateful to Zuvius Life Sciences Pvt. Ltd. (Maharashtra) for providing gift sample of LMB. NS designed the study, developed method, validated method, drafted the manuscript and provided the final approval for publication. MM and PB provided various official method validation protocols only. YC performed method validation, evaluated pharmacokinetic studies, interpreted the results, drafted the manuscript and provided the final approval for publication.
Source of funding
The author(s) received no specific funding for this work.
Declaration of Competing Interest
No conflicts of interest have been declared.
References
- Thrombocytopenia associated with chronic liver disease. J. Hepatol.. 2008;48(6):1000-1007.
- [Google Scholar]
- Silica-based chelating resin bearing dual8-Hydroxyquinoline moieties and its applications for solid phase extraction of trace metals from seawater prior to their analysis by ICP-MS. Arab. J. Chem.. 2019;12:360-369.
- [Google Scholar]
- Baertschi S.W., Alsante K.M., Reed R.A., eds. Pharmaceutical Stress Testing: Predicting Drug Degradation. CRC Press; 2016.
- The effects of sample preparation methods on the variability of the electrospray ionization response for model drug compounds. Rapid Commun. Mass Spectrom.. 1999;13(12):1175-1185.
- [Google Scholar]
- Determination of lipoic acid in human plasma by high-performance liquid chromatography with ultraviolet detection. Arab. J. Chem.. 2019;12:4878-4886.
- [CrossRef] [Google Scholar]
- FDA, 1996. Guidance for Industry: ICH E6 Good Clinical Practice. US Department of Health and Human Services, Food and Drug Administration, Centre for Drug Evaluation and Research and Centre for Biologics Evaluation and Research.
- FDA, 2001. Guidance for Industry, Bioanalytical Method Validation. US Department of Health and Human Services, Food and Drug Administration Centre for Drug Evaluation and Research and Centre for Veterinary Medicine.
- Guidance for Industry on Bioanalytical Method Validation, 2001. (Center for Drug Evaluation and Research, US Food and Drug Administration, Rockville, MD. <https://www.fda.gov/downloads/Drugs/Guidance/ucm070107.pdf>.
- Guideline for performance of blood transfusion (revised version) and guideline for usage of blood products (revised version). Issued in 2005, revised February 2009. <http://www.jrc.or.jp/vcms_lf/iyakuhin_benefit_guideline_sisin090805.pdf>.
- Indication and usage of platelet preparations, platelet concentrates (transfusion medicine) Jpn. J. Thromb. Hemost.. 2009;20:495-497.
- [Google Scholar]
- Quantitative determination and pharmacokinetic study of fusaricidin A in mice plasma and tissues using ultra-high performance liquid chromatography-tandem mass spectrometry. J. Pharm. Biomed. Anal.. 2019;170:187-192.
- [Google Scholar]
- Determination of atorvastatin in human serum by salting out assisted solvent extraction and reversed-phase high-performance liquid chromatography-UV detection. Arab. J. Chem.. 2014;7(1):87-90.
- [Google Scholar]
- Management of thrombocytopenia due to liver cirrhosis: a review. World J. Gastroenterol.: WJG. 2014;20(10):2595.
- [Google Scholar]
- ICH Harmonised Tripartite Guideline, 2005. Validation of Analytical Procedures: Text and Methodology Q2(R1). International Conference on Harmonisation of Technical Requirements for Registration of Pharmaceuticals for Human Use, Geneva, pp. 1–13.
- ICH, 1996. The European Agency for the Evaluation of Medicinal Products. ICH Topic Q2B Note for Guideli.ne on Validation of Analytical Procedures: Methodology. GPMP/ICH/281/95.
- ICH, Q1B, Stability Testing: Photo stability Testing of New Drug Substances and Products, International Conference on Harmonization. IFPMA, Geneva, Switzerland, 1996.
- ICH Guidance on Analytical Method Validation, International Convention on Quality for the Pharmaceutical Industry: Toronto, Canada, 2002.
- ICH, 2003. ICH Q1 A (R2) Stability Testing of New Drug Substances and Products. International Conference on Harmonization, Geneva.
- ICH, 2005. Technical Requirements for the Registration of Pharmaceutical for Human Use; Validation of Analytical Procedures: Text and Methodology Q2(R1); IFPMA: Geneva, Switzerland, November, 2005, pp. 1–13.
- The biology of thrombopoietin and thrombopoietin receptor agonists. Int. J. Hematol.. 2013;98(1):10-23.
- [Google Scholar]
- The thrombopoietin receptor, c-Mpl, is a selective surface marker for human hematopoietic stem cells. J. Trans. Med.. 2006;4(1):9.
- [Google Scholar]
- The biogenesis of platelets from megakaryocyte proplatelets. J. Clin. Investig.. 2005;115(12):3348-3354.
- [Google Scholar]
- Simultaneous quantification of nimesulide, phenylpropanolamine, caffeine and chlorpheniramine in rat plasma by RP–HPLC/PDA method and application to pharmacokinetic studies in healthy rat subjects. Arab. J. Chem.. 2019;12:2320-2327.
- [CrossRef] [Google Scholar]
- Lusutrombopag increases hematocytes in a compensated liver cirrhosis patient. Clin. J. Gastroenterol.. 2017;10(3):261-264.
- [Google Scholar]
- Efficacy of repeated lusutrombopag administration for thrombocytopenia in a patient scheduled for invasive hepatocellular carcinoma treatment. Int. Med. 2017:8791-16.
- [Google Scholar]
- European Medicines Agency guideline on bioanalytical method validation: what more is there to say? Bioanalysis. 2012;4(8):865-868.
- [Google Scholar]
- A randomized controlled trial of lusutrombopag in Japanese patients with chronic liver disease undergoing radiofrequency ablation. J. Gastroenterol.. 2019;54(2):171-181.
- [Google Scholar]
- US DHHS, FDA, CDER, CVM, 2001. Guidance for Industry: BioanalyticalMethodValidation. U.S. Department of Health and Human Services, Food and DrugAdministration, Center for Drug Evaluation and Research (CDER), Center forVeterinary Medicine (CVM), Rockville, MD, USA.
- US DHHS, FDA, CDER, CVM, Guidance for Industry: Bioanalytical Method Validation, U.S. Department of Health and Human Services, Food and Drug Administration, Center for Drug Evaluation and Research (CDER), Center for Veterinary Medicine (CVM), Rockville, MD, USA, 2013.
- US. FDA, 2001. Guidance for industry. In: Bioanalytical Methods Validation, <http://www.fda.gov/cder/guidance/4252fnl.htm>.
- Development of a new knock-in mouse model and evaluation of pharmacological activities of lusutrombopag, a novel, nonpeptidyl small-molecule agonist of the human thrombopoietin receptor c-Mpl. Exp. Hematol.. 2018;59:30-39.
- [Google Scholar]
- Application of carbon nanotubes in extraction and chromatographic analysis: a review. Arab. J. Chem.. 2019;12:633-651.
- [CrossRef] [Google Scholar]


