

Translate this page into:
Differential distribution of phytochemicals in Scutellariae Radix and Scutellariae Amoenae Radix using microscopic mass spectrometry imaging
⁎Corresponding authors at: National Institutes for Food and Drug Control, Beijing 102629, China. kangshuai@nifdc.org.cn (Shuai Kang), masc@nifdc.org.cn (Shuangcheng Ma)
-
Received: ,
Accepted: ,
This article was originally published by Elsevier and was migrated to Scientific Scholar after the change of Publisher.
Abstract
Scutellariae Radix, the root of Scutellaria baicalensis Georgi, is widely applied in China for the treatment of fever, ulcer, bronchitis, hepatitis and inflammatory symptoms. Sctuellariae Amoenae Radix, the root of Scutellaria amoena C.H. Wright, is often prescribed as the substitute for Scutellariae Radix. Up to now, no attempt has been made to unveil and compare the localization of phytochemicals in Scutellariae Radix and its succedaneum. This investigation succeeded to look into the differential distribution of natural compounds in Scutellariae Radix and Scutellariae Amoenae Radix using microscopic mass spectrometry imaging. Compounds presenting different distribution modes in two kinds of roots were sorted out, then a quick method for the differentiation between Scutellariae Radix and Scutellariae Amoenae Radix was established. Accumulation sites of baicalein, baicalin, wogonin and wogonoside in Scutellariae Radix were also uncovered using microscopic mass spectrometry imaging. Moreover, the application of matrix assisted laser desorption ionization-quadrupole-time of flight mass spectrometry allowed the on-tissue dissociation of major flavonoids. Overall, the utilization of microscopic mass spectrometry imaging and matrix assisted laser desorption ionization-quadrupole-time of flight mass spectrometry provided a novel perspective for the discovery of natural compounds within medicinal plants.
Keywords
Mass spectrometry imaging
Medicinal plants
Natural compounds
Traditional Chinese medicine
Scutellariae Radix
Scutellariae Amoenae Radix

- TCM
-
Traditional Chinese Medicine
- SR
-
Scutellariae Radix
- SAR
-
Scutellariae Amoenae Radix
- MSI
-
mass spectrometry imaging
- AP-MALDI, MALDI
-
matrix assisted laser desorption ionization
- MALDI-Q-TOF-MS
-
matrix assisted laser desorption ionization-quadrupole-time of flight-mass spectrometry
- LC-MS
-
liquid chromatography coupled with mass spectrometry
- NPG
-
2-nitrophloroglucinol
- OCT
-
optimum cutting temperature compound
- ITO
-
indium tin oxide-coated
- ROI
-
region of interest
- DHB
-
2,5-dihydroxybenzoic acid
- CHCA
-
α-cyano-4-hydroxycinnamic acid
- GC–MS
-
gas chromatography coupled with mass spectrometry
- HPLC
-
high performance liquid chromatography
Abbreviations
1 Introduction
Plants of the Scutellaria L. genus (the Lamiaceae family) are perennial herbs represented by around 360 species. Most of the Scutellaria species are widely spread in European, North American and Eastern Asian regions (Karimov and Botirov, 2017). A number of Scutellaria plants are utilized for clinical use since ancient times. For example, Scutellariae Radix (SR), the root of Scutellaria baicalensis Georgi, is widely used to treat fever, ulcer, bronchitis, hepatitis and inflammatory symptoms (Liu et al., 2009). It has been proved by modern pharmacological research that the extracts of SR possessed anti-tumor, anti-viral, anti-microbial, anti-oxidative and neuroprotective bioactivities (Wang et al., 2018). SR is now included officially in Chinese Pharmacopoeia (Chinese Pharmacopoeia Commission, 2020). During the past decades, different classes of phytochemicals were isolated from SR, including flavonoids, lignins, amides, and phenylethanoid glycosides (Liu et al., 2019; Qiao et al., 2016). Flavonoids are the major bioactive components of SR (Ji et al., 2015). Baicalein, wogonin, baicalin and wogonoside are four well-known flavonoids extracted from the SR (Zhao et al., 2016), which have been proved to exert anti-tumor activities (Liu et al., 2016; Huynh et al., 2017; Tao et al., 2018; Sun et al., 2016). Among the four major flavonoids, baicalin is selected as the chemical marker of SR in Chinese Pharmacopoeia (Chinese Pharmacopoeia Commission, 2020).
In Southwest China, the root of Scutellaria amoena C.H. Wright, namely, Scutellariae Amoenae Radix (SAR), is often prescribed as the substitute for SR. It was illustrated in a previous study that the natural constituents in SAR were quite different from that in SR (Zhang et al., 2007). Over the years, many attempts have been made to look into the difference of phytochemicals between the two Scutellaria species. In 2016, an investigation was carried out to differentiate SR and SAR using liquid chromatography coupled with mass spectrometry (LC-MS) (Ling et al., 2016).
When illustrating the chemical compositions of a medicinal plant, conventional analytical methods such as LC-MS usually require that the samples be homogenized before analysis, thus the spatial information of natural constituents is lost during sample preparation step. Besides, when natural compounds were extracted from the crude drugs, ultra-sonication or heating reflux procedures may easily lead to the decomposition or loss of components (Husain et al., 2020). To overcome the drawbacks of the previous analytical methods, a new technique named mass spectrometry imaging (MSI) has been adopted to explore the material basis of medicinal plants.
MSI is a frontier analytical method which allows direct visualization of endogenous metabolites in native tissues. Over the decades, MSI has been applied to various kinds of fields, such as pathology (Chung et al., 2022), pharmacy (Schulz et al., 2019), cancer research (McDonnell et al., 2017) and plant science (Sturtevant et al., 2015). The application of MSI in photochemistry puts forward the exploration of natural compounds in medicinal plants (Huang et al., 2022b). For the MSI analysis of plant metabolomes, matrix assisted laser desorption ionization mass spectrometry imaging (MALDI-MSI) and desorption electrospray ionization mass spectrometry imaging (DESI-MSI) are two commonly applied techniques (Huang et al., 2022b; Bjarnholt et al., 2014). Compared with conventional analytical tools, MSI requires less or even no sample pretreatment, thus not only saves time and labor, but also avoids the possible loss of constituents during extraction or purification process (Husain et al., 2020). In an MSI analytical task, various classes of natural compounds could be simultaneously detected by MSI (Kuo et al., 2019). Accumulation sites of natural components uncovered by MSI could serve as a guidance for high-efficiency extraction of active components (Feng et al., 2014). Additionally, the localization patterns of phytochemicals illustrated by MSI could also provide new perspectives on the biosynthesis of pharmaceutical constituents in medicinal plants (Freitas et al., 2019; Marques et al., 2014). More recently, comparative analysis of spatial information of natural constituents in different plant samples were carried out under the method of MSI (Duan et al., 2022; Huang et al., 2022a).
Up to now, there have been a few investigations attempting to map out the distribution of secondary metabolites in SR using MSI (Feng et al., 2014; Pramanik et al., 2019). However, the reproducibility of component distribution across duplicate or multiple SR samples were not mentioned in previous studies. In order to draw a more accurate and universal conclusion of compound distribution in SR samples, it was necessary to conduct MSI analysis towards SR samples collected from different habitats. In our work, SR samples were collected from four different provinces in China, therefore the results of component distribution in SR were more convincing. The spatial distribution of phytochemicals in SAR was also explored in our investigation, which has not been studied in any previous research.
Using microscopic MSI, this study illustrated the differential distribution of metabolomes in SR and SAR. Visualization of components in roots collected from the two species was achieved using matrix assisted laser desorption ionization-quadrupole-time of flight mass spectrometry (MALDI-Q-TOF-MS). Localization patterns of detected chemicals in the roots of two Scutellaria species were compared, providing information for the quick differentiation from SR and SAR. Particularly, four pharmaceutically important flavonoids in SR and SAR were accurately identified by on-tissue tandem mass spectrometry analysis.
2 Materials and methods
2.1 Plant materials
Scutellariae Radix (SR), Huang-Qin in Chinese, is the root of Scutellaria baicalensis Georgi. Scutellariae Amoenae Radix (SAR), Dian-Huang-Qin in Chinese, is the root of Scutellaria amoena C.H. Wright. SAR and SR samples were collected from different habitats in China. Samples of SAR (Sample A-B) were bought from the local market of Chinese materia medica in Yunnan, China. Samples of SR (Sample C-F) were bought from the local markets of Chinese materia medica in four provinces of China. Sample C was bought from Hebei, Sample D was bought from Neimenggu, Sample E was bought from Shanxi, and Sample F was bought from Shandong. The origin of Samples A-B was authenticated as the root of Scutellaria amoena C.H. Wright by Associate Professor Shuai Kang in accordance with the Yunnan Standard of Chinese Materia Medica (Medical Products Administration of Yunnan Province, 2005). The origin of Samples C-F was authenticated as the root of Scutellaria baicalensis Georgi by Associate Professor Shuai Kang in accordance with the Chinese Pharmacopeia (Chinese Pharmacopoeia Commission, 2020). For future reference, the voucher specimens (Samples A-F) were deposited in National Institutes for Food and Drug Control, Beijing, PR China.
2.2 Chemicals and reagents
2-Nitrophloroglucinol (NPG), acetonitrile, trifluoroacetic acid, and gelatin were purchased from Sigma-Aldrich (St. Louis, MO, United States). Reference standards of baicalein, wogonin, baicalin and wogonosdie were purchased from Shanghai Standard Technology Co. (Shanghai, China). Ultra-pure water was obtained from a Milli-Q water purification system (Millipore, Bedford, MA, United States). Optimum cutting temperature compound (OCT) was supplied by Leica (Nussloch, Germany).
2.3 Sample preparation
Roots harvested from different habitats were cut into pieces with length within 2 cm using a blade, and the small pieces were embedded in 0.09 g/ml gelatin solution and fast-frozen at −80 °C for 20 min. The frozen samples were axially fixed to a cryomicrotome (Leica, Nussloch, Germany) and were sectioned into 30 μm slices. Afterwards, the thin slices of fresh tissues were thaw-mounted onto an indium tin oxide-coated (ITO) glass slide (Matsunami Glass, Osaka, Japan).
Reference solutions of baicalein, wogonin, baicalin and wogonoside were prepared at a concentration of 100 mg/ml in 80 % acetonitrile respectively. Then 1 μl of the reference solution of each flavonoid was dropped onto the surface of a steel plate using a pipette.
Prior to MSI analysis, transverse sections on the ITO glass slide and dried droplets on the steel plate were deposited with NPG matrix. The NPG solution was prepared at a concentration of 10 mg/ml in 80 % acetonitrile containing 0.1 % trifluoroacetic acid. The matrix solution was uniformly sprayed to the sample surface using an automatic sprayer system iMLayer AERO (Shimadzu, Kyoto, Japan). Twenty layers of matrix solution were successively sprayed onto the sample surface at a flow rate of 60 μl/min.
2.4 Mass spectrometry imaging analysis
MSI analysis was conducted using the iMScope QT instrument (Shimadzu, Kyoto, Japan). The Imaging MS Solution Ver.2 software was used to carry out the on-line control of iMScope QT instrument. Optical images of sample sections were captured using stereo microscope with FusionOptics (Leica, Nussloch, Germany). Then, the sample holder was aligned and the alignment information was registered in the instrument. Before data acquisition, acquisition areas were defined according to the botanical structures displayed in optical images. Data points locating within the acquisition areas were analyzed by a high-performance time-of-flight mass spectrometer equipped with an atmospheric pressure chamber for matrix assisted laser desorption ionization (AP-MALDI) source. Accumulated 500 laser shots per pixel were acquired using a diode-pumped 355 nm Nd:YAG laser, with a laser repetition frequency of 1000 Hz. The diameter of laser spots was set at 25 μm, while the laser intensity was kept at 76.5 (arbitrary unit in iMScope). The spatial resolution of acquired data was set at 50 μm. Mass spectra were generated in positive ion detection mode, and the mass range was m/z 100–550. The detector voltage was set at 2.20 kV for all samples.
2.5 On-tissue tandem mass spectrometry analysis
On-tissue tandem mass spectrometry was performed using iMScope QT instrument (Shimadzu, Kyoto, Japan). Tandem mass data was directly acquired from the transverse sections of SR deposited with selected matrix. Ions at m/z 271.0601 (baicalein, [M + H]+), 285.0757 (wogonin, [M + H]+), 447.0922 (baicalin, [M + H]+) and 461.1078 (wogonoside, [M + H]+) were selected as the precursors. Collision energy was set at 35 ± 15 V. Tandem mass spectrometry analysis of reference standards was also carried out, serving as a reference for the fragmentation patterns of the analytes.
2.6 Data analysis
The software ImageReveal MS was employed to process and visualize MSI data. In image registration step, the optical image of a sample was aligned with the mass image. Then regions of interest (ROI) were mapped out according to the optical images. Mass data collected from pixels within the ROIs were calculated and processed. Afterwards, ion images of different chemicals were reconstructed. Putative identification of detected compounds was carried out basing on the accurate m/z value with reference to previous literatures.
3 Results
3.1 In situ profiling of phytochemicals in Scutellariae Radix and Scutellariae Amoenae Radix
According to the basic knowledge of plant development, successive increments of secondary xylem and phloem result in the diametric growth of root. In hence, average mass spectrum generated from a 90° sector of the transverse section should be capable of representing the chemical composition of the intact sample section. Mass data collected from each coordinate within the defined area were calculated into an average spectrum of the sample. The representative average mass spectra of SAR and SR samples were displayed in Fig. 1.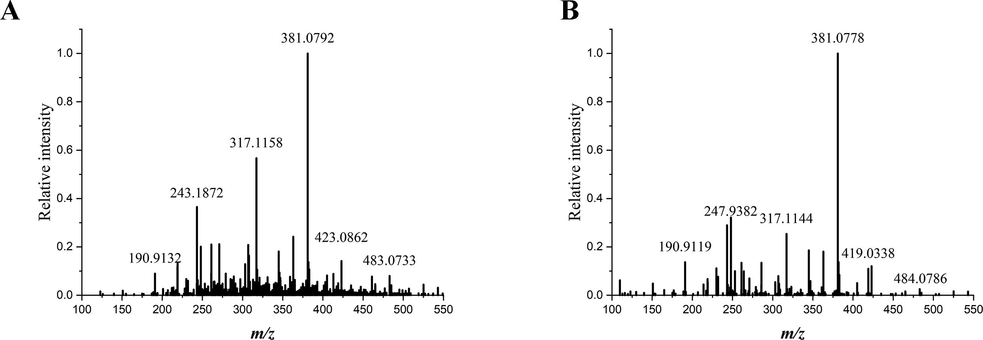
Typical average mass spectra of Scutellariae Amoenae Radix (A) and Scutellariae Radix (B). Mass spectra were generated at mass range of m/z 100–550 using MALDI-Q-TOF-MS.
Mass peaks of six average mass spectra generated from SR and SAR samples were extracted and then combined into a template. Later on, mass images of components contained in the template were constructed. By comparing the ion image with corresponding optical image, the accumulation site of a target compound could be readily obtained. Putative identification results of detected compounds were listed in Table 1.
No.
Compound name
Formula
Adduct ion
Theoretical m/z
Measured m/z
Mass error (ppm)
Ref
1
(2R,3R)-3,5,7,2′,6′-Pentahydroxyflavanone/Trans-5,7,2′,6′-tetrahydroxyflavanonol/3,6,7,2′,6′-Pentahydroxyflavanonol/DihydroviscidulinⅠ
C15H12O7
M + Na
327.0475
327.0473
0.64
(Ji et al., 2015; Takagi et al., 1981; Tomimori et al., 1981)
2
(2S)-5,6,3′,4′-Tetrahydroxyflavanone/7-O-β-d-glucuronide/(2S)-5,8,3′,4′-Tetrahydroxyflavanone-7-O-β-d-glucuronide
C21H20O13
M + Na
503.0796
503.0799
0.54
(Liu et al., 2011)
3
(2S)-5,7,4′-Trihydroxy-6-methoxyflavanone/(2S)-7,2′,6′-Trihydroxy-5-methoxyflavanone/2,6,2′,4′-Tetrahydroxy-6′-methoxychalcone/5,7,4′-Trihydroxy-6-methoxyflavanone/5,7,4′-Trihydroxy-8-metoxyflavanone
C16H14O6
M + Na
325.0683
325.0680
1.17
(Takagi et al., 1980; Tomimori et al., 1984; Zhou et al., 2000)
4
(2S)-5-Hydroxy-6-methoxyflavanone-7-O-β-d-glucoside
C22H24O10
M + Na
471.1262
471.1268
1.17
(Miyaichi et al., 1995)
5
3-Caffeoylquinic acid/Chlorogenetic acid
C16H18O9
M + Na
377.0843
377.0826
4.56
(Wang et al., 2009; Xiong et al., 2022)
6
4-O-β-d-glucosyl-trans-p-coumaric acid/4-O-β-d-glucosyl-cis-p-coumaric acid
C15H18O8
M + Na
349.0894
349.0892
0.57
(Liu et al., 2009)
7
5-(2-hydroxyethyl)-2-methoxyphenol
C9H12O3
M + K
207.0424
207.0426
1.16
(Syrjänen et al., 2000)
8
5,2′,5′-Trihydroxy-6,7,8-trimethoxyflavone
C18H16O8
M + K
399.0482
399.0467
3.71
(Tomimoriet al., 1984)
9
5,6,7-Trihydroxy-4′-methoxyflavone/5,7,2′-Trihydroxy-6′-methoxyflavone/5,7,2′-Trihydroxy-6-methoxyflavone/5,7,2′-Trihydroxy-8-methoxyflavone/5,7,4′-Trihydroxy-8-methoxyflavone/5,8,2′-Trihydroxy-7-methoxyflavone/TenaxinⅡ/5,7,4′-Trihydroxy-6-methoxyflavone/4′-Hydroxywogonin/5,7,6′-Trihydroxy-2′-methoxyflavone/Scutevulin /5,8,2′-Trihydroxy-7-methoxyflavone
C16H12O6
M + K
339.0271
339.0265
1.68
(Takagi et al., 1980; Tomimori et al., 1983; Tomimori et al., 1984; Xiao et al., 2003)
10
5,6′-Dihydroxy-6,7,8-trimethoxyflavone-2′-O-β-d-glucoside
C24H26O13
M + Na
545.1266
545.1274
1.47
(Ishimaru et al., 1995)
11
5,6′-Dihydroxy-7,8-dimethoxyflavone-2′-O-β-d-glucoside/5,6′-Dihydroxy-6,7-dimethoxyflavone-2′-O-β-d-glucoside
C23H24O12
M + K
531.0905
531.0899
1.13
(Miyaichi et al., 1995; Ishimaru et al., 1995)
12
5,6-Dihydroxy-7-methoxyflavone/Methoxybaicalein/Oroxylin A/Wogonin/5, 8-Dihydroxy-7-methoxyflavone/Genkwanin
C16H12O5
M + K
323.0322
323.0309
4.06
(Takagi et al., 1980; Popova et al., 1973; Wang et al., 2016)
13
5,7,2′-Trihydroxy-6,8-dimethoxyflavone/5,8,2′-Trihydroxy-6,7-dimethoxyflavone/5,7,6′-Trihydroxy-8,2′-dimethoxyflavone/5,7,2′-trihydroxy-8,6′-dimethoxyflavone/ViscidulinⅡ/5,8,2′-Trihydroxy-6,7-dimethoxyflavone/5,6′,2′-Trihydroxy-7,8-methoxyflavone
C17H14O7
M + K
369.0377
369.0384
1.76
(Takagi et al., 1980; Tomimori et al., 1984)
14
5,7-Dihydroxy-6,8-dimethoxyflavone/5, 8-Dihydroxy-6,7-dimethoxyflavone/SkullcapflavoneⅠ/5, 8-Dihydroxy-6,7-dimethoxyflavone
C17H14O6
M + K
353.0428
353.0425
0.85
(Takagi et al., 1980; Ma et al., 2013; Takido et al., 1979)
15
5,7-Dihyroxy-6,8-dimethoxyflavone-7-O-glucuronide
C23H22O12
M + K
529.0748
529.0724
4.59
(Liu et al., 2012)
16
6′-Hydroxy-5,6,7,8,2′-pentamethoxyflavone
C20H20O8
M + H
389.1231
389.1249
4.73
(Han et al., 2010)
17
Adipic acid dioctyl ester
C22H42O4
M + K
409.272
409.2705
3.76
(Yang et al., 1999)
18
Amoenin B
C22H22O12
M + Na
501.1004
501.0982
4.33
(Zhou et al., 2000)
19
Amoenin C/(2S)-5,7,6′-Trihydroxyflavanone-2′-O-β-d-glucoside
C21H22O11
M + Na
473.1054
473.1045
1.90
(Zhou et al., 2000)
20
Amoenin D/Amoenin E
C21H22O12
M + Na
489.1004
489.0986
3.76
(Zhou et al., 2000)
21
Apigenin-7-O-β-d-glucoside/5,6-Dihydroxy-7-O-glucosideflavone/Baicalein-7-O-β-d-glucoside
C21H20O10
M + Na
455.0949
455.0965
3.60
(Tomimori et al., 1984; Ma et al., 2013)
22
Arginine
C6H14N4O2
M + K
213.0755
213.0761
2.68
(Nie et al., 2021)
23
Baicalein/Norwogonin/Apigenin/2′-Hydroxychrysin
C15H10O5
M + H
271.0601
271.0590
4.06
(Tomimori et al., 1984; Popova et al., 1973; Ma et al., 2013)
24
Baicalin/Norwogonin-7-O-β-d-glucuronide/Apigenin-7-O-β-d-glucuronide
C21H18O11
M + K
485.0486
485.0478
1.59
(Ji et al., 2015; Ishimaru et al., 1995; Cha et al., 2006)
25
Chrysin
C15H10O4
M + K
293.0216
293.0208
2.83
(Takagi et al., 1980)
26
Chrysin-6-C-β-d-glucoside-8-C-α-l-arabinopyranoside/Chrysin-6-C-α-l-arabinopyranoside-8-C-β-d-glucoside/Chrysin-6-C-β-l-arabinopyranoside-8-C-β-d-glucoside/Chrysin-6-C-β-d-glucoside-8-C-β-l-arabinopyranoside/Chrysin-6-C-β-arabinofuranoside-8-C-β-d-glucoside/Chrysin-6-C-β-d-glucoside-8-C-β-l-arabinofuranoside/Chrysin-3-C-α-arabinopyranoside-8-C-β-d-glucoside
C26H28O13
M + H
549.1603
549.1591
2.19
(Zhou et al., 1997; Lin et al., 2013)
27
Chrysin-7-O-β-d-glucuronide
C21H18O10
M + K
469.0537
469.0533
0.77
(Ma et al., 2013)
28
Chrysin-8-C-β-d-glucoside/Chrysin-6-C-β-d-glucoside
C21H20O9
M + H
417.118
417.1171
2.09
(Miyaichi et al. 1994)
29
Darendoside A
C19H28O11
M + K
471.1269
471.1268
0.32
(Miyaichi et al., 1995)
30
Ferulic acid methyl ester
C11H12O4
M + K
247.0373
247.0380
2.75
(Xu et al. 2016)
31
Fructose/Galactose/Glucose/Mannose/Inositol
C6H12O6
M + K
219.0271
219.0271
0.05
(Kim et al. 2014)
32
Isocarthamidin/Carthamidin/(+)-Eriodictyol/(2S)-5,7,2′,6′-Tetrahydroxyflavanone/5,7,2′,6′-Tetrahydroxyflavone/Carthamidin/Isocarthamidin
C15H12O6
M + Na
311.0526
311.0517
2.99
(Takido et al. 1976; Kubo et al. 1981; Zheng et al. 1998)
33
Isoscutellarein-8-O-β-d-glucuronide
C24H24O12
M + Na
527.116
527.1170
1.97
(Nagai et al. 1998)
34
Jatrorrhizine
C20H20NO4
M + Na
361.1285
361.1268
4.79
(Deng et al. 2008)
35
Lamivudine
C8H11N3O3S
M + K
268.0158
268.0160
0.56
(Kenney et al. 2000)
36
p-Coumaric acid
C9H8O3
M + H
165.0546
165.0545
0.42
(Kim et al. 2014)
37
phthalic acid decyl hexyl ester/phthalic acid bis(2-ethyhexyl) ester
C24H38O4
M + K
429.2407
429.2402
1.28
(Yang et al., 1999)
38
phthalic acid isodecyl ester/phthalic acid decyl octyl ester
C26H42O4
M + K
457.272
457.2721
0.18
(Yang et al., 1999)
39
Quinic acid
C7H12O6
M + K
231.0271
231.0260
4.67
(Kim et al. 2014)
40
Raffinose
C18H32O16
M + K
543.1328
543.1309
3.57
(Kim et al. 2014)
41
Salicylic acid/p-Hydroxybenzoic acid
C7H6O3
M + H
139.039
139.0394
3.16
(Kim et al. 2014)
42
Salidroside
C14H20O7
M + K
339.0846
339.0850
1.30
(Zhou et al., 1997)
43
Scutellarein/Isoscutellarein/5,7,2′,5′-Tetrahydroxyflavone/5,7,2′,6′-Tetrahydroxyflavone
C15H10O6
M + K
325.0115
325.0114
0.26
(Tomimori et al., 1984; Ma et al., 2013; Zhang et al. 1994)
44
SkullcapflavoneⅡ/5,4′-Dihydroxy-6,7,3′,5′-tetramethoxyflavone/5,2′-Dihydroxy-6,7,8,3′-tetramethoxyflavone/5,7-Dihydroxy-8,2′,3′,6′-tetramethoxyflavone/6,6′-Dihydroxy-5,7,8,2′-tetramethoxyflavone
C19H18O8
M + K
413.0639
413.0631
1.84
(Ishimaru et al., 1995; Ma et al., 2013; Long et al. 2015; Nishikawa et al. 1999)
45
Sucrose/Cellobiose/Trehalose
C12H22O11
M + K
381.0799
381.0793
1.52
(Kim et al. 2014)
46
TenaxinⅠ/Rivularin
C18H16O7
M + K
383.0533
383.0519
3.79
(Tomimori et al., 1983; Zhou et al., 1997)
47
Tryptophan
C11H12N2O2
M + K
243.0536
243.0532
1.52
(Kim et al. 2014)
48
Vanillic acid
C8H8O4
M + K
207.006
207.0061
0.29
(Kim et al. 2014)
49
ViscidulinⅠ/2′,3,5,6′,7-Pentahydroxyflavone
C15H10O7
M + K
341.0064
341.0059
1.55
(Tomimori et al., 1984)
50
Wogonoside/Oroxylin A-7-O-β-d-glucuronide
C22H20O11
M + K
499.0643
499.0630
2.69
(Ishimaru et al., 1995; Zhang et al. 1997)
51
ViscidulinIII-6′-O-β-d-glucoside/ViscidulinIII-2′-O-β-d-glucopyranoside
C23H24O13
M + K
547.0854
547.0849
0.88
(Takagi et al., 1980; Zhou et al., 1997)
3.2 On-tissue tandem mass spectrometry analysis of major flavonoids in Scutellariae Radix and Scutellariae Amoenae Radix
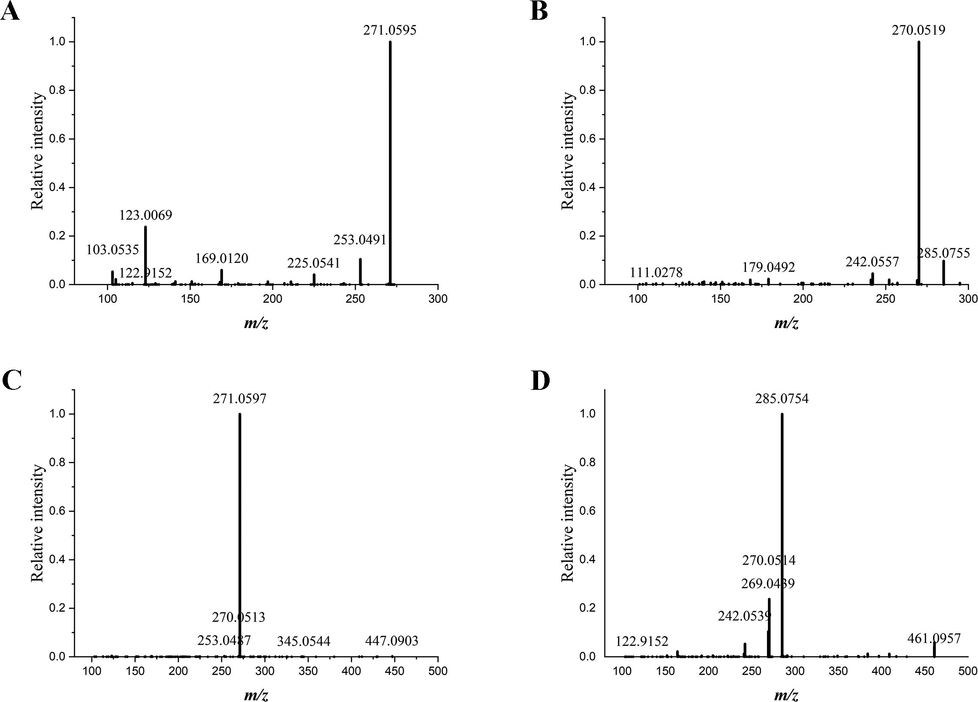
Collision induced dissociation usually brings about C-ring cleavage of flavonoids, producing characteristic fragments of flavonoids. When tandem mass spectrometry is performed, MS/MS spectra of protonated flavonoids tend to yield fragments contained either intact A ring or intact B ring, namely 1,3A+, 1,3B+, 0,2B+ and 0,4B+ (Wolfender et al., 2000). The general rules of nomenclature for product ions generated from flavonoids were illustrated in Fig. 2 (Cuyckens and Claeys, 2004; Ma et al., 1997). Structures of four major flavonoids were presented in Fig. 3. Tandem mass spectra generated from the precursor ions of four flavonoids in SR tissues were displayed in Fig. 4. Meanwhile, tandem mass spectrometry analysis of reference standards of four major flavonoids was also performed, the results of which were shown in Fig. 5.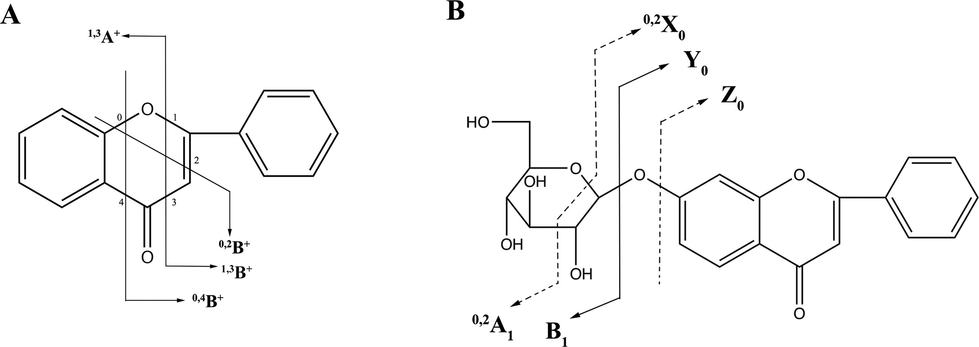
Nomenclature and diagnostic product ions of protonated flavonoid (A) and flavonoid glycoside (B).
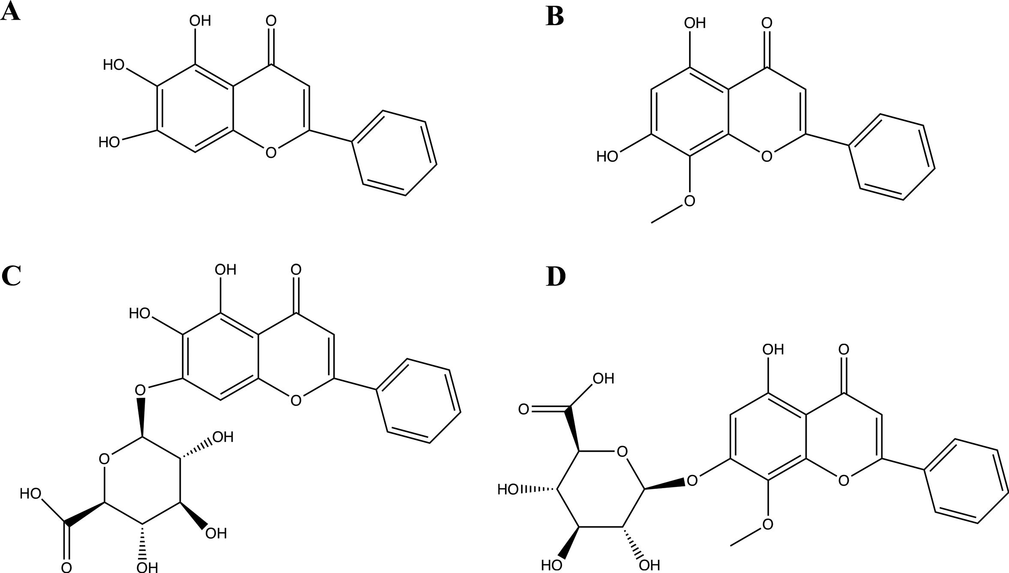
Chemical structures of four major components, including baicalein (A), wogonin (B), baicalin (C) and wogonoside (D).
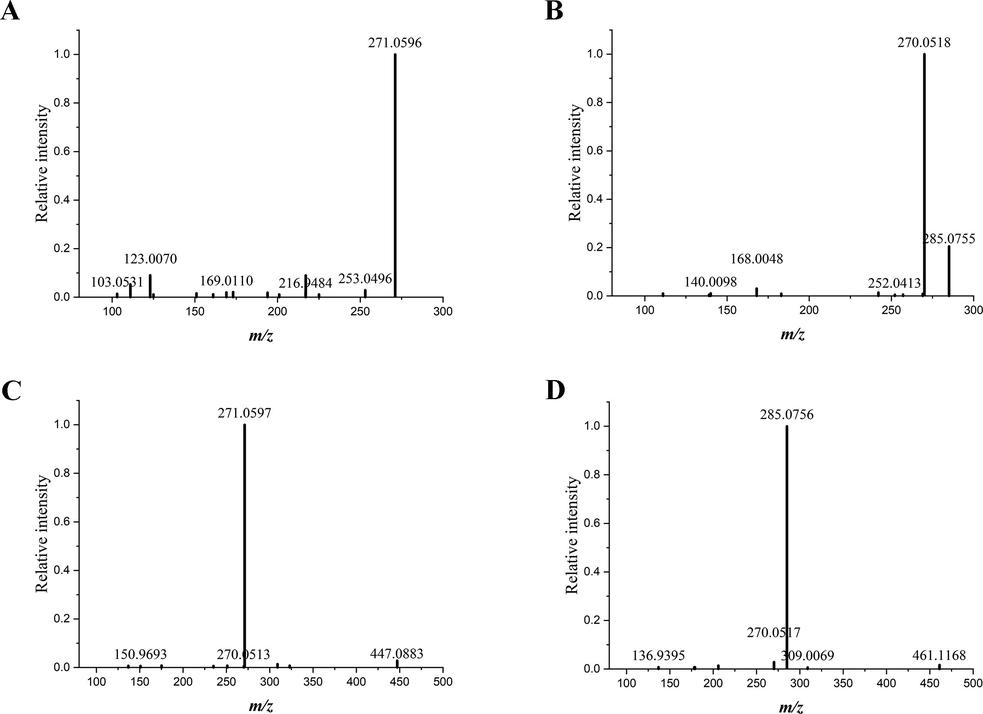
Tandem mass spectra of baicalein (A), wogonin (B), baicalin (C) and wogonoside (D) in Scutellariae Radix. The spectra were directly acquired from the transverse section of Scutellariae Radix.
Tandem mass spectra generated from the reference standards of baicalein (A), wogonin (B), baicalin (C) and wogonoside (D).
Baicalein was trihydroxylated on A ring, the characteristic ions of which were the 1,3A+ fragment and 1,3B+ fragment. In tandem mass spectrum generated from the cross section of SR displayed in Fig. 4, product ions of protonated baicalein was detected at m/z 169.0110 attributed to the 1,3A+ fragment and m/z 103.0531 attributed to the 1,3B+ fragment. The ion at m/z 123.0070 was assigned to the 0,4A+ fragment. Another product ion resulted from neutral loss of H2O was found at m/z 253.0496.
For the structure of wogonin, a methoxy group and two hydroxyl groups were distributed on different positions of A ring. The loss of a methoxy group from wogonin gave rise to the product ion at m/z 270.0518. Fragment at m/z 168.0048 was assigned to (1,3A+–CH3) ion dissociated from wogonin. Continuous loss of CO brought about the presence of (1,3A+–CH3-CO) at m/z 140.0098.
Baicalin and wogonoside are the glucuronides of baicalein and wogonin, respectively. The cleavage of glucosidic bond led to the neutral loss of a glucuronic acid, producing the Y0+ ion. The informative Y0+ fragment of baicalin showed presence at m/z 271.0597, and Y0+ fragment of wogonoside was detected at m/z 285.0756.
In order to confirm the fragmentation patterns of baicalein, wogonin, baicalin and wogonoside, reference standards of these four flavonoids were also analyzed using on-tissue tandem mass spectrometry. Characteristic fragments of the four reference standards were found to be in consistence with the fragments detected from the flavonoids on sample surface. For instance, the 1,2A+ and 0,4A+ fragments of baicalein were also detected at m/z 169.0110 and m/z 123.0069, matching with the fragments observed in tandem spectrum that was directly acquired from the transverse section of SR.
3.3 Differential distribution patterns of phytochemicals in Scutellariae Radix and Scutellariae Amoenae Radix
Phytochemicals presenting various distribution patterns in SAR and SR were classified into four different groups. The detailed information of distribution pattern was listed in Table 2. The optical images of each sample were shown in Fig. 6. Typical mass images representing each distribution pattern were displayed under each category. The color band attached to each mass image offered a reference for the evaluation of relative abundance of visualized components in sample tissues. In a mass image, as the color changed in the order of white, red, yellow, green, blue and black, the content of an extracted ion presented a descending trend. Therefore, the distribution and relative concentration of metabolites in plant tissues were intuitively revealed in the form of colorful images.
Distribution pattern
Compound name
1
Unknown (m/z 433.3448)
Unknown (m/z 461.3752)
Unknown (m/z 477.3728)
2
Unknown (m/z 385.0347)
5,2′,5′-Trihydroxy-6,7,8-trimethoxyflavone
Unknown (m/z 400.0450)
Unknown (m/z 407.9619)
Unknown (m/z 412.0695)
SkullcapflavoneⅡ/5,4′-Dihydroxy-6,7,3′,5′-tetramethoxyflavone/5,2′-Dihydroxy-6,7,8,3′-tetramethoxyflavone/5,7-Dihydroxy-8,2′,3′,6′-tetramethoxyflavone/6,6′-Dihydroxy-5,7,8,2′-tetramethoxyflavone
Unknown (m/z 421.9798)
Unknown (m/z 429.0534)
Unknown (m/z 451.0341)
5,6′-Dihydroxy-7,8-dimethoxyflavone-2′-O-β-d-glucoside/5,6′-Dihydroxy-6,7-dimethoxyflavone 2′-O-β-d-glucoside
ViscidulinIII −6′-O-β-d-glucoside/ViscidulinIII −2′-O-β-d-glucopyranoside
3
5,6-Dihydroxy-7-methoxyflavone /Methoxybaicalein/Oroxylin A/Wogonin/5,8-Dihydroxy-7-methoxyflavone/Genkwanin
5,6,7-Trihydroxy-4′-methoxyflavone/5,7,2′-Trihydroxy-6′-methoxyflavone/5,7,2′-Trihydroxy-6-methoxyflavone/5,8,2′-Trihydroxy-7-methoxyflavone/5,7,4′-Trihydroxy-6-methoxyflavone/5,7,6′-Trihydroxy-2′-methoxyflavone/TenaxinⅡ/4′-Hydroxywogonin/Scutevulin
5,7,2′-Trihydroxy-6,8-dimethoxyflavone/5,8,2′-Trihydroxy-6,7-dimethoxyflavone/5,7,6′-Trihydroxy-8,2′-dimethoxyflavone/5,7,2′-trihydroxy-8,6′-dimethoxyflavone/ViscidulinⅡ/5,8,2′-Trihydroxy-6,7-dimethoxyflavone/5,6′,2′-Trihydroxy-7,8-methoxyflavone
TenaxinⅠ/Rivularin
Amoenin D/Amoenin E
4
(2S)-5,6,3′,4′-Tetrahydroxyflavanone-7-O-β-d-glucuronide/(2S)-5,8,3′,4′-Tetrahydroxyflavanone-7-O-β-d-glucuronide
Baicalein/Norwogonin/Apigenin/2′-Hydroxychrysin
(2R,3R)-3,5,7,2′,6′-Pentahydroxyflavanone/Trans-5,7,2′,6′-tetrahydroxyflavanonol/3,6,7,2′,6′-Pentahydroxyflavanonol/DihydroviscidulinⅠ
2,5,6′-Trihydroxy-7,8-dimethoxyflavone-2′-O-glucuronide
3-Caffeoylquinic acid/Chlorogenetic acid
4-O-β-d-glucosyl-trans-p-coumaric acid/4-O-β-d-glucosyl-cis-p-coumaric acid
5,7-Dihyroxy-6,8-dimethoxyflavone-7-O-glucuronide
Apigenin-7-O-β-d-glucoside/5,6-Dihydroxy-7-O-glucosideflavone/Baicalein-7-O-β-d-glucoside
Baicalin/Norwogonin-7-O-β-d-glucuronide/Apigenin-7-O-β-d-glucuronide
Chrysin-7-O-β-d-glucuronide
Chrysin-8-C-β-d-glucoside/Chrysin-6-C-β-d-glucoside
Isoscutellarein-8-O-β-d-glucuronide
Raffinose
Scutellarein/Isoscutellarein/5,7,2′,5′-Tetrahydroxyflavone/5,7,2′,6′-Tetrahydroxyflavone
Sucrose/Cellobiose/Trehalose
ViscidulinⅠ/2′,3,5,6′,7-Pentahydroxyflavone
Wogonoside/Oroxylin A-7-O-β-d-glucuronide
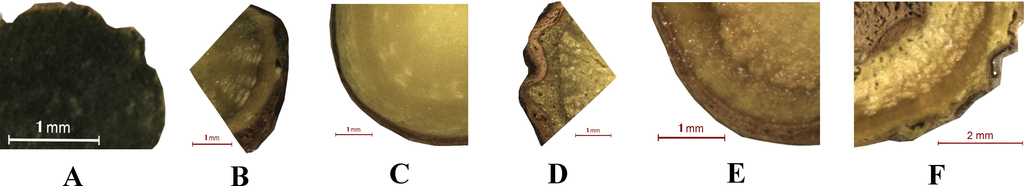
Optical images of Scutellariae Amoenae Radix and Scutellariae Radix. Samples of Scutellariae Amoenae Radix were collected from Chuxiong, Yunnan (A) and Dali, Yunnan (B). Samples of Scutellariae Radix was collected from Hebei (C), Shanxi (D), Shandong (E) and Neimenggu (F).
3.3.1 Pattern 1
Phytochemicals with m/z values of 433.3448, 461.3752 and 477.3728 were found to show a preferential occurrence in the corks of six samples. The corks here referred to not only corks in normal periderms, but also corks in the abnormal structures, including the interxylary cork and rhytidome.
Interxylary cork and rhytidome were not found in two samples of SAR. As can be seen from Fig. 7, chemicals of Pattern 1 presented strong signals in the form of circular curves along the outer periderm of six samples. Besides, in Samples B-E, the intense signals marked out parallel curves along the border of root sections, indicating that a duplicated structure might be developed during root growth. Using Zeiss Axio Scan.Z1 automatic digital slide scanning system, double layers of corks were observed in Samples B-E, and a typical scanning image was provided in Fig. 8. As a result, the presence of rhytidome in these samples was confirmed. For Sample F collected from Neimenggu, intense signals were found not only around the border of root section, but also at the edge of interxylary cork.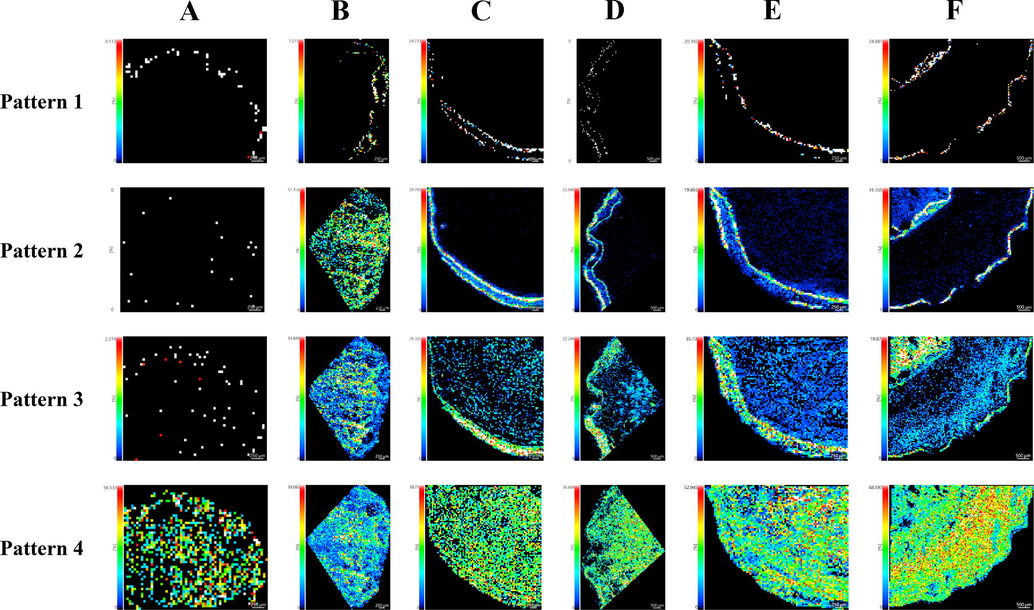
Mass images representing different distribution patterns of phytochemicals in Scutellariae Radix and Scutellariae Amoenae Radix. Representative mass images of Pattern 1, Pattern 2, Pattern 3 and Pattern 4 were extracted at m/z 433.3448 (unknown compound), m/z 413.0631 (identified as skullcapflavone II and/or its isomers), m/z 339.0265 (identified as scutevulin and/or its isomers) and m/z 303.0473 (identified as viscidulin I and/or its isomers) respectively. Samples of Scutellariae Amoenae Radix were collected from Chuxiong, Yunnan (A) and Dali, Yunnan (B). Samples of Scutellariae Radix was collected from Hebei (C), Shanxi (D), Shandong (E) and Neimenggu (F).
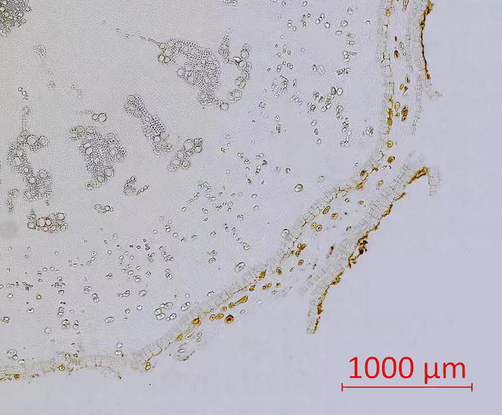
A representative scanning image of a root sample containing rhytidome structure. The image was taken by Zeiss Axio Scan.Z1 automatic digital slide scanning system.
3.3.2 Pattern 2
Phytochemicals of Pattern 2 showed different distribution features in SAR and SR (see Fig. 7). Mass signals of detected metabolites appeared especially high intensities in the cork regions of SR, including the interxylary cork and sequent corks of rhytidome. In contrast, these chemicals presented no preferential accumulation in the corks of SAR. Such phenomena illustrated by mass images could be utilized to quickly differentiate between SAR and SR. As listed in Table 2, a number of components were included in the classification of Pattern 2, some were identified by comparing the measured m/z values with theoretical m/z values of known compounds, while the others remained unknown.
3.3.3 Pattern 3
Phytochemicals of Pattern 3 followed a similar distribution mode to Pattern 2, the slight difference was that these chemicals were observed to show an intense signal in the dead phloem or dead xylem associated with the development of abnormal structures. As displayed in Fig. 7, especially high intensity of detected compounds was found in dead phloem tissues in between the successive corks of rhytidome or in dead xylem tissues within the interxylary cork of SR. However, these chemicals presented a uniform distribution mode in the root sections of SAR.
3.3.4 Pattern 4
As illustrated in Fig. 7, phytochemicals falling into this category were observed to be widely distributed in the root sections of six samples, showing no apparent distribution difference. A group of natural compounds, including knowns and unknowns, were found to show a homogenous distribution in both SAR and SR.
3.4 Visualization of four major flavonoids in Scutellariae Radix and Scutellariae Amoenae Radix
Baicalein, wogonin, baicalin and wogonoside are four pharmaceutically important flavonoids in SR. As shown in Fig. 9, baicalein and wogonin were widely distributed in the whole transverse section, with an extremely high intensity along the edge of rhytidome or interxylary cork. For the distribution of wogonoside and baicalin, no apparent accumulation in specific area was observed. The localization of two glucuronides appeared a quite uniform pattern within the root tissues.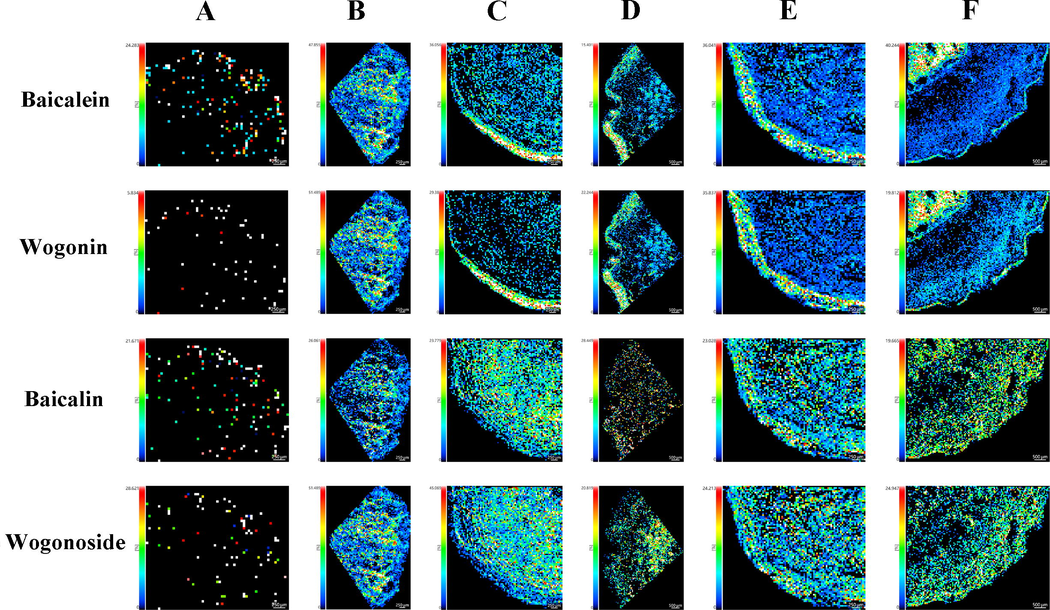
Visualization of four major flavonoids in Scutellariae Radix and Scutellariae Amoenae Radix. The potassium adducts of baicalein, wogonin, baicalin and wogonoside were extracted at m/z 309.0160, m/z 323.0309, m/z 485.0478 and m/z 499.0630 respectively. Samples of Scutellariae Amoenae Radix were collected from Chuxiong, Yunnan (A) and Dali, Yunnan (B). Samples of Scutellariae Radix was collected from Hebei (C), Shanxi (D), Shandong (E) and Neimenggu (F).
4 Discussion
4.1 Optimization of experimental conditions
Three matrices, including 2,5-dihydroxybenzoic acid (DHB), α-cyano-4-hydroxycinnamic acid (CHCA) and 2-nitrophloroglucinol (NPG), were tested for the MALDI-Q-TOF-MS detection of natural compounds in SAR and SR. Different matrix solution was mixed with the reference solution of baicalein, baicalin, wogonin and wogonoside. The mixed solution was deposited onto a steel plate and then analyzed using MALDI-Q-TOF-MS. Mass spectra generated from droplets containing different matrix solution and reference solution were compared with each other. The intensities of protonated flavonoids showed highest intensity when NPG was used as the matrix. As a result, NPG was selected as the optimum matrix for MSI analysis of SR and SAR.
The parameters of laser setup were optimized basing on the test firing function of Imaging MS Solution. The laser energy and laser diameter were tested by performing imaging acquisition at different regions of root sections. According to the signal intensity of mass acquisition, the optimum diameter of laser spots was set at 25 μm, and laser intensity was kept at 76.5 (arbitrary unit in iMScope).
As for tandem mass spectrometry, optimization of collision energy was carried out by analyzing the reference solution that was deposited on a steel plate. The collision energy set at 35 ± 15 V brought about the presence of abundant fragments, and was selected as the appropriate collision energy for tandem mass spectrometry analysis of four major flavonoids.
4.2 In situ profiling of phytochemicals in Scutellariae Radix and Scutellariae Amoenae Radix
Though MSI visualization of a target compound might be interfered by its possible isomers, the imaging results were still capable of supporting the differentiation of SAR and SR. According to the distribution patterns of chemicals in SAR and SR, extracted mass images were divided into four groups. Different distribution patterns of phytochemicals in SAR and SR not only provided support for the quick differentiation of two species, but also brought new thoughts on the exploration of plant anatomy and plant physiology.
Constituents belonging to Pattern 1 were found to show an especially high intensity in the corks of SR and SAR. In plant anatomy, the cork usually referred to an outer protective tissue of roots, and was included in the periderm structure (Charles, 2010). Parenchyma cells in secondary phloem exhibit meristematic ability and form the phellogen (cork cambium). Continuous differentiation of phellogen brings about the formation of phelloderm and phellem (cork). Subsequently, the first periderm is constructed (Boher et al., 2018). Abnormal structures such as interxylary cork and rhytidome may also occur during cork development. Rhytidome is composed of successively formed periderms and in-between tissues (Li et al., 2018). When rhytidome structure was formed, parenchyma cells in the deeper tissue of secondary phloem recover the capability of meristems, producing a new periderm. Finally, an anomalous structure of plant is developed (Han et al., 2021). Aside from rhytidome, interxylary cork is also an anomalous structure of root. At the beginning of interxylary cork development, some xylem vessels are gradually filled with tylosis or other substances. Soon, the tylosis begins to appear in parenchyma cells adjacent to these abnormal vessels. Then, normal parenchyma cells around the abnormal tissues regain their meristematic ability, forming a new phellogen in the phloem area. As the phellogen grows in a tangential direction, a cork layer is developed inwards. After that, healthy tissues were separated from the abnormal parenchyma cells and vessels by the interxylary cork (Wang et al., 2020). As was shown in Fig. 7, phytochemicals belonging to Pattern 1 were found to show an especially high intensity in the cork regions of SAR and SR. Interestingly, in Sample B-E, chemicals of Pattern 1 presented high abundance in the form of successive curves along the edge of root sections. The duplicated signals indicated that a repetition of certain structure emerged during root development. By conducting digital scanning of root sections, doubled corks were found in these samples. A typical microscopic image of the abnormal structure was displayed in Fig. 8. According to botanical knowledge, this special structure could be possibly assigned as rhytidome. Apart from rhytidome, interxylary cork was also found in one of the analyzed samples. In Sample F collected from Neimenggu, the high intensity of signals showed presence not only in the outer cork, but also around the border of interxylary cork. While the formation of interxylary cork in SR has been reported in many literatures, the presence of rhytidome in SR was seldom reported. Our findings suggested that MSI was capable of offering intuitive clues for deeper exploration of plant structures.
Natural components falling into the categories of Pattern 2 showed different spatial localization features in SR and SAR. In SR, these chemicals were found to exhibit especially strong intensity along the corks of interxylary cork or rhytidome. However, in SAR, such metabolites presented no preferential occurrence in cork regions. The localization features of these phytochemicals could be utilized to differentiate SR from SAR.
Mass images of Pattern 3 elucidated that quite a few metabolites were abundantly stored in the dead phloem of rhytidome and the dead xylem of interxylary cork. Nevertheless, in the transverse sections of SAR, components of Pattern 3 were not found to exhibit especially high intensity in dead phloem surrounded by subsequnt corks of rhytidome or dead xylem encircled by interxylary cork. The above phenomenon could also be employed to distinguish between SAR and SR.
Conventional analytical tools such as LC-MS, gas chromatography coupled with mass spectrometry (GC–MS) and high performance liquid chromatography (HPLC) were capable of unveiling the chemical composition of a plant sample. However, these conventional methods lacked the ability to provide spatial information of detected compounds. When conventional analytical methods were applied to elucidate the material basis of an herb, plant materials were usually pulverized into powder before the extraction of pharmaceutical components. During the homogenization process, spatial information of natural compounds was lost. The employment of MSI avoided the drawback of conventional analytical methods. Without any homogenization or extraction procedure, natural compounds in root tissues of medicinal plants were directly mapped out. Based on the spatial information uncovered by MSI, a quick method for the differentiation of SR and SAR was established. As mentioned above, though compounds belonging to Pattern 2 and Pattern 3 showed existence in both species, MSI was still able to achieve the distinguishment of SR and SAR according to distribution features of chemicals within root tissues. In other words, MSI provided a new dimension for the comprehension of natural compounds within medicinal plants, and made up for the shortage of classic analytical tools.
4.3 On-tissue tandem mass spectrometry analysis
As stated before, the visualization of a target compound may be interfered by its possible isomers. In order to make a more precise observation of major flavonoids within SR samples, on-tissue tandem mass spectrometry analysis was carried out using MALDI-Q-TOF-MS. Protonated molecules of baicalein, wogonin, baicalin and wogonoside, together with the possible isomers of each flavonoid, were directly dissociated from the surface of roots sections. The reference standards of interest flavonoids were also analyzed using MALDI-Q-TOF-MS to provide referential information.
Norwogonin, apigenin and 2′-hydroxychrysin were the constitutional isomers of baicalein (Tomimori et al., 1984; Popova et al., 1973; Ma et al., 2013). Both baicalein and norwogonin were trihydroxylated on A ring. For apigenin and 2′-hydroxychrysin, two hydroxyl groups were distributed on A ring, and another one on B ring. When cleavage of C—C bond at position 1/3 of flavonoids was triggered, different hydroxylated positions on A ring and B ring of flavonoid skeleton led to the formation of different 1,3A+ fragments. Baicalein and norwogonin produced 1,3A+ ion at m/z 169.0137, while apigenin and 2′-hydroxychrysin produced 1,3A+ ion at m/z 153.0188. On-tissue dissociation of the precursor ion at m/z 271.0601 brought about the presence of fragment ions at m/z 169.0110, providing evidence for the existence of baicalein and norwogonin. Since baicalein and norwogonin had very similar chemical structure as well as fragmentation patterns, results supplied by tandem mass spectrometry were not sufficient enough to tell baicalein from norwogonin. The characteristic fragment of apigenin and 2′-hydroxychrysin, was not observed at m/z 153.0188. Therefore, apigenin and 2′-hydroxychrysin were likely to be absent from the chemical composition of analyzed SR sample. In conclusion, the mass image extracted at m/z 271.0601 (baicalein, [M + H]+) was possibly a combined result of baicalein and norwogonin. It was stated in a previous article that norwogonin in SR presented much lower content compared to baicalein (Yan et al., 2014), the distribution of baicalein should be considered as a dominant participant in the mass image extracted at m/z 271.0601. In other words, the spatial distribution of baicalein uncovered by MSI was still considered a reliable result.
In the same manner, the fragmentation pattern of wogonin and its isomers was investigated. Oroxylin A, 5,6-dihydroxy-7-methoxyflavone and wogonin were flavonoids of similar structure, with a methoxy group and two hydroxyl groups locating on different positions of A ring. The structure of genkwanin was quite different from the three flavonoids mentioned above, two hydroxyl groups were separately distributed on A ring and B ring, and the methoxy group were distributed on A ring (Li et al., 2010). The (1,3A+–CH3) ion of wogonin, oroxylin A and 5, 6-dihydroxy-7-methoxyflavone were observed at m/z 168.0053, whereas the diagnostic fragments of genkwanin, (1,3A+–CH3-CO) and (1,3A+–CH3), were not detected.
Reported isomers of baicalin were norwogonin-7-O-β-d-glucuronide and apigenin-7-O-β-d-glucuronide (Ji et al., 2015; Ishimaru et al., 1995; Cha et al., 2006). The isomeric glycoside of wogonoside was oroxylin A-7-O-β-d-glucuronide (Ishimaru et al., 1995; Zhang et al. 1997). Characteristic fragments of flavonoid glucuronides were readily detected after the loss of glucuronic acid. Nevertheless, tandem mass spectrometry analysis carried out using MALDI-Q-TOF-MS was still unable to separate glucuronides from their isomers.
Overall, by performing tandem mass spectrometry, diagnostic fragments of protonated baicalein, wogonin, baicalin and wogonoside were successfully detected in the tandem mass spectra of SR. In the meantime, characteristic fragments of some possible isomers were not observed in tandem mass results, thus the existence of these possible isomers was rejected. Additionally, though the in situ dissociation of natural compounds could be achieved using tandem mass imaging, the intensity of produced fragments was not strong enough to construct ion images of high quality. At last, it was still a difficult task to distinguish between isomers sharing almost the same fragmentation patterns. More recently, ion mobility has been proven to be a successful method for the separation and detection of different structural isomers (Kiss et al., 2011). Hopefully, the combination of ion mobility and MSI may enhance the detailed exploration of in situ metabolites.
4.4 Visualization of four major flavonoids in Scutellariae Radix and Scutellariae Amoenae Radix
Baicalein, wogonin, baicalin and wogonoside are four pharmaceutically important flavonoids in SR and SAR. As illustrated in Fig. 9, baicalein and wogonin were widely distributed in the whole transverse section of SAR, while in SR, an extremely high intensity was found in the dead phloem surrounded by subsequently formed corks of rhytidome or dead xlem encircled by interxylary cork.
The development of rhytidome and interxylary cork had a close connection with dead tissues. A previous literature stated that baicalein had close relationship with the programmed cell death of plants (Hirunuma et al., 2011). Now that both baicalein and wogonin were observed to present high content in dead phloem and xylem, it was reasonable to assume that wogonin was also an important metabolite associated with programmed cell death. Besides, it was widely acknowledged that flavonoids played a role in plant resistance against pathogenic bacteria and fungi (Mierziak et al., 2014). Therefore, the phenomena that wogonin and baicalein showed preferential accumulation along the edge of root sections provided validation for the plant defense function of endogenous flavones. Taken together, the application of MSI assisted in the exploration of physiological function of natural compounds.
Furthermore, accumulation sites of wogonin and baicalein uncovered by MSI could serve as a guidance for the high-efficiency extraction of major components from SR. Firstly, since rhytidome and interxylary cork were secondary structures that tended to appear in older roots, when selecting raw materials for the extraction of baicalein or wogonin, SR at older ages should be a better choice. Secondly, region-specific extraction could be utilized to arouse the efficiency of extraction. In Chinese Pharmacopoeia, before the clinical application of SR, it was required that the coarse bark of roots be removed (Chinese Pharmacopoeia Commission, 2020). However, MSI results suggested that high contents of wogonin and baicalein were distributed at the outer cork. Consequently, it was worth reconsidering whether the outer bark of SR should be removed during therapeutic application.
For the distribution of wogonoside and baicalin, no apparent accumulation in specific areas of roots was observed. The localization of two glucuronides presented a quite uniform distribution within the root tissues. Baicalin and wogonoside were the downstream product of baicalein and wogonin during the biosynthetic process. The wide distribution of two glucuronides indicated that enzymes which transformed free aglycones into corresponding glucuronides were also widely expressed in the root.
Based on the spatial distribution of baicalein, wogonin and their glucuronides, it was possible to hypothesize that when cell death was triggered, the activities of glucosyltransferase in dying tissues might sharply decrease. Meanwhile, the enzymes in living tissues were still capable of transforming aglycones into glucuronides. Therefore, abnormal xylem and parenchyma cells in the interxylary cork, as well as dead phloem tissues locating in successively formed periderms of rhytidome, appeared especially higher abundance of wogonin and baicalein. The other hypothesis may also explain why different spatial localization modes occurred between free flavonoids and their glucuronides. When cells were undergoing apoptosis process, enzymes responsible for hydrolyzing baicalin and wogonoside into their aglycones were activated, leading to increased contents of baicalein and wogonin in dying tissues. It was demonstrated in an earlier research that baicalein was a stress inducible metabolite which was generally maintained at a quite low level in the roots of SR, whereas baicalin was abundantly stored as a precursor for the future release of baicalein. When plant tissues were wounded, hydrolysis of baicalin was triggered, giving rise to a higher level of baicalein in plant cells. It was found out that baicalein was able to translocate into the nucleus and then induce cell apoptosis through DNA oxidation, whereas its glucuronide, the baicalin, lacked the ability to move into the nucleus (Hirunuma et al., 2011). As a result, baicalein was more likely to accumulate in dead phloem or dead xylem of SR, while baicalin was evenly distributed in other areas. The transformation between wogonin and wogonoside may follow the same regulation as baicalein and baicalin. The two hypotheses stated above were not contradictory, one involving the consumption of baicalein and wogonin in living tissues and the other the hydrolyzation of baicalin and wogonoside in dying tissues, both contributed to a relatively higher abundance of wogonin and baicalein in dead tissues.
5 Conclusions
Visualization of phytochemicals in Scutellariae Amoenae Radix and Scutellariae Radix were readily achieved using microscopic MSI. Distribution modes of natural compounds within two kinds of medicinal plants were divided into four groups. Quite a number of plant metabolites were found to distribute differently in SAR and SR. The results indicated that microscopic MSI was a potential tool for the quick differentiation of phylogenetically similar species. Moreover, spatial information of pharmaceutically important components provided new perspectives for the exploration of medicinal plants.
It was also feasible to carry out on-tissue tandem mass spectrometry analysis using the MALDI-Q-TOF-MS. Four important flavonoids, including baicalein, wogonin, baicalin and wogonoside, were directly dissociated from the transverse sections of SR. Fragments of flavonoids in native tissues matched with the characteristic ions generated from reference standards.
In the future, it would be an interesting and meaningful work to identify the unknown phytochemicals that presented different localization modes in SAR and SR. Besides, the combination of MSI with ion mobility could be employed to clarify the specific localization of target compounds from possible isomers.
Author Contributions
Lieyan Huang and Lixing Nie designed and performed the experiments, analyzed the data, and wrote the manuscript. Jing Dong, Lingwen Yao and Zhong Dai assisted in performing the experiments. Shuai Kang collected and authenticated the medicinal materials of Scutellariae Radix and Scutellariae Amoenae Radix. Feng Wei and Shuangcheng Ma revised the manuscript. All authors read and approved the final manuscript.
Declaration of Competing Interest
The authors declare that they have no known competing financial interests or personal relationships that could have appeared to influence the work reported in this paper.
References
- Mass spectrometry imaging of plant metabolites-principles and possibilities. Nat. Prod. Rep. 2014
- [CrossRef] [Google Scholar]
- A comparative transcriptomic approach to understanding the formation of cork. Plant Mol. Biol.. 2018;96:103-118.
- [CrossRef] [Google Scholar]
- Antioxidant and anti-allergic activity of compounds from the aerial parts of Scutellaria baicalensis Georgi. J. Pharm. Soc. Korea.. 2006;50:136-143.
- [Google Scholar]
- An Introduction to Plant Structure and Development Plant Anatomy for the Twenty-First Century (second ed.). UK: Cambridge; 2010.
- Chinese Pharmacopoeia Commission, 2020. Pharmacopoeia of People’s Republic of China, first ed. Beijing, China, 2020
- Next - generation pathology practices with mass spectrometry imaging. Mass Spectrom. Rev.. 2022;e21795:1-20.
- [CrossRef] [Google Scholar]
- Mass spectrometry in the structural analysis of flavonoids. J. Mass Spectrom.. 2004;39:1-15.
- [CrossRef] [Google Scholar]
- Simultaneous determination of berberine, palmatine and jatrorrhizine by liquid chromatography–tandem mass spectrometry in rat plasma and its application in a pharmacokinetic study after oral administration of coptis-evodia herb couple. J. Chromatogr. B: Anal. Technol. Biomed. Life Sci.. 2008;863:195-205.
- [CrossRef] [Google Scholar]
- Visual authentication of steroidal saponins in Allium macrostemon Bge. and Allium chinense G. Don using MALDI-TOF imaging mass spectrometry and their structure activity relationship. Arabian J. Chem.. 2022;104138:1-14.
- [CrossRef] [Google Scholar]
- Ambient mass spectrometry imaging: Plasma assisted laser desorption ionization mass spectrometry imaging and its applications. Anal. Chem.. 2014;86:4164-4169.
- [CrossRef] [Google Scholar]
- Assessing the spatial distribution of key flavonoids in Mentha × piperita Leaves: an application of desorption electrospray ionization mass spectrometry imaging (DESI-MSI) J. Braz. Chem. Soc.. 2019;30:1437-1446.
- [CrossRef] [Google Scholar]
- Isolation and identification of polymethoxyflavones from the hybrid citrus, hallabong. J. Agric. Food Chem.. 2010;58:9488-9491.
- [CrossRef] [Google Scholar]
- Programmed cell death during the formation of rhytidome and interxylary cork in roots of Astragalus membranaceus (Leguminosae) Microsc. Res. Tech.. 2021;84:1400-1413.
- [CrossRef] [Google Scholar]
- Flavone-catalyzed apoptosis in Scutellaria baicalensis. Phytochemistry. 2011;72:752-760.
- [CrossRef] [Google Scholar]
- Huang, H.Z., Tan, P., Li, M.Q., Tan, Q.C., Gao, J.H., Bao, X.M., Fan, S.H., M, T.G., Mao, W.M., Lin, F., Han, L., Zhang, D.K., Lin, J.Z., 2022a. Quality analysis combined with mass spectrometry imaging reveal the difference between wild and cultivated Phyllanthus emblica Linn.: From chemical composition to molecular mechanism. Arabian J. Chem. 103790, 1–17. https://doi.org/10.1016/j.arabjc.2022.103790
- The application of mass spectrometry imaging in traditional Chinese medicine: a review. Chinese Med. (United Kingdom). 2022;17:1-20.
- [CrossRef] [Google Scholar]
- Differential distribution of characteristic constituents in root, stem and leaf tissues of Salvia miltiorrhiza using MALDI mass spectrometry imaging. Diam. Relat. Mater.. 2020;146:108139
- [Google Scholar]
- Huynh, D.L., Sharma, N., Kumar Singh, A., Singh Sodhi, S., ZHANG, J.J., Mongre, R.K., Ghosh, M., Kim, N., Ho Park, Y., Kee Jeong, D., 2017. Anti-tumor activity of wogonin, an extract from Scutellaria baicalensis, through regulating different signaling pathways. Chin. J. Nat. Med. 15, 15–40. https://doi.org/10.1016/S1875-5364(17)30005-5
- Two flavone 2’-glucosides from Scutellaria baicalensis. Phytochemistry.. 1995;40:279-281.
- [CrossRef] [Google Scholar]
- Anti-H1N1 virus, cytotoxic and Nrf2 activation activities of chemical constituents from Scutellaria baicalensis. J. Ethnopharmacol.. 2015;176:475-484.
- [CrossRef] [Google Scholar]
- Structural diversity and state of knowledge of flavonoids of the Scutellaria L. Genus. Russ. J. Bioorganic Chem.. 2017;43:691-711.
- [CrossRef] [Google Scholar]
- Simultaneous determination of zidovudine and lamivudine in human serum using hplc with tandem mass spectrometry. J. Pharm. Biomed. Anal.. 2000;22:967-983.
- [CrossRef] [Google Scholar]
- Comparative analysis of flavonoids and polar metabolites from hairy roots of Scutellaria baicalensis and Scutellaria lateriflora. World J. Microbiol. Biotechnol.. 2014;30:887-892.
- [CrossRef] [Google Scholar]
- Size, weight and position: ion mobility spectrometry and imaging MS combined. Anal. Bioanal. Chem.. 2011;399:2623-2634.
- [CrossRef] [Google Scholar]
- Kubo, M., Kimura, Y., Odani, T., Tani, T., Namba, K., 1981. Studies on Scutellariae Radix. Part Ⅱ: the antibacterial substance. Planta Medica. 43, 194–201. https://doi.org/10.1055/s-2007-971499.
- Mass spectrometry imaging guided molecular networking to expedite discovery and structural analysis of agarwood natural products. Anal. Chim. Acta. 2019;1080:95-103.
- [CrossRef] [Google Scholar]
- A novel Daphnane-type Diterpene from the flower bud of Daphne Genkwa. Chem. Nat. Compd.. 2010;46:380-382.
- [Google Scholar]
- Developmental anatomy of anomalous structure and classification of commercial specifications and grades of the astragalus membranaceus Var. Mongholicus. Microsc. Res. Tech.. 2018;81:1165-1172.
- [Google Scholar]
- Structural identification of chemical constituents from Scutellaria baicalensis by HPLC-ESI-MS/MS and NMR spectroscopy. Asian J Chem.. 2013;25:3799-3805.
- [CrossRef] [Google Scholar]
- Research on the differentiation of Scutellaria baialensis Georgi and Scutellaria amoena C.H.Wright. J. Chinese Med. Mater.. 2016;39:2412-2416.
- [Google Scholar]
- The fascinating effects of baicalein on cancer: a review. Int. J. Mol. Sci.. 2016;17:1-18.
- [CrossRef] [Google Scholar]
- Chemical constituents from Scutellaria baicalensis Georgi. Chin. J. Med. Chem.. 2009;19:59-62.
- [Google Scholar]
- Investigation of flavonoid profile of Scutellaria bacalensis Georgi by high performance liquid chromatography with diode array detection and electrospray ion trap mass spectrometry. J. Chromatogr. A. 2009;1216:4809-4814.
- [CrossRef] [Google Scholar]
- Identification of flavonoids in the stems and leaves of Scutellaria baicalensis Georgi. J Chromatogr. B, Anal Technol Biomed Life Sci.. 2011;879:1023-1028.
- [CrossRef] [Google Scholar]
- Phytochemical constituents from Scutellaria baicalensis in soluble epoxide hydrolase inhibition: Kinetics and interaction mechanism merged with simulations. Int. J. Biol. Macromol.. 2019;133:1187-1193.
- [CrossRef] [Google Scholar]
- Utility of uplc-esi-tof/ms for rapid analysis of the constituents in scutellariae radix. Chin. J. Inf. Tradit. Chin. Med.. 2012;29:20-24.
- [CrossRef] [Google Scholar]
- Two new flavonoids from the roots of Scutellaria baicalensis. J. Asian Nat. Prod. Res.. 2015;17:756-760.
- [CrossRef] [Google Scholar]
- Study on chemical constituents from stems and leaves of Scutellaria baicalensis. Chin. J. Exp. Trad. Med. Formulae. 2013;19:147-149.
- [CrossRef] [Google Scholar]
- Characterization of flavone and flavonol aglycones by collision-induced dissociation tandem mass spectrometry. Rapid Commun. Mass Spectrom.. 1997;11:1357-1364.
- [Google Scholar]
- A multi-omics strategy resolves the elusive nature of alkaloids in Podophyllum species. Mol. Biosyst.. 2014;10:2838-2849.
- [CrossRef] [Google Scholar]
- Mass spectrometry imaging in cancer research: future perspectives. Adv. Cancer Res.. 2017;134:283-290.
- [CrossRef] [Google Scholar]
- Medical Products Administration of Yunnan Province, 2005. Yunnan Standard of Chinese Materia Medica. first ed. Kunming, China
- Flavonoids as important molecules of plant interactions with the environment. Molecules. 2014;19:16240-16265.
- [Google Scholar]
- Studies on the constituents of Scutellaria species XVI phenol glycosides of the root of Scutellaria baicaleinsis Georgi. J. Nat. Med.. 1994;48:215-218.
- [Google Scholar]
- Studies on the constituents of Scutellaria Species XVⅡ: phenol glycosides of the root of Scutellaria baicalensis Georgi. J. Nat. Med.. 1995;49:350-353.
- [Google Scholar]
- Inhibition of mouse liver sialidase by plant flavonoids. Biochem. Biophys. Res. Commun.. 1998;163:25-31.
- [Google Scholar]
- Microscopic mass spectrometry imaging reveals the distribution of phytochemicals in the dried root of isatis tinctoria. Front. Pharmacol.. 2021;12:685575
- [CrossRef] [Google Scholar]
- Flavone production in transformed root cultures of Scutellaria baicalensis Georgi. Phytochemistry. 1999;52:885-890.
- [CrossRef] [Google Scholar]
- Flavones of the roots of Scutellaria baicalensis. Chem. Nat. Compd.. 1973;9:699-702.
- [CrossRef] [Google Scholar]
- A spatially-resolved approach to visualize the distribution and biosynthesis of flavones in Scutellaria baicalensis Georgi. Bioresour. Technol. Rep.. 2019;179:100310
- [Google Scholar]
- A targeted strategy to analyze untargeted mass spectral data: rapid chemical profiling of Scutellaria baicalensis using ultra-high performance liquid chromatography coupled with hybrid quadrupole orbitrap mass spectrometry and key ion filtering. J. Chromatogr. A. 2016;1441:83-95.
- [CrossRef] [Google Scholar]
- Advanced MALDI mass spectrometry imaging in pharmaceutical research and drug development. Curr. Opin. Biotechnol.. 2019;55:51-59.
- [CrossRef] [Google Scholar]
- Sturtevant, D., Lee, Y.J., Chapman, K.D., 2015. Matrix Assisted Laser Desorption/Ionization-Mass Spectrometry Imaging (MALDI-MSI) for Direct Visualization of Plant Metabolites. Curr. Opin. Biotechnol. 37, 53–60. https://doi.org/ 10.1016/j.copbio.2015.10.004.
- Wogonoside prevents colitis-associated colorectal carcinogenesis and colon cancer progression in inflammation-related microenvironment via inhibiting NF-κB activation through PI3K/Akt pathway. Oncotarget. 2016;7:34300-34315.
- [CrossRef] [Google Scholar]
- The identification of dilignols from dehydrogenation mixtures of coniferyl alcohol and apocynol [4-(1-Hydroxyethyl)-2-methoxyphenol] by LC-ES-MS/MS. J. Agric. Food Chem.. 2000;48:5211-5215.
- [CrossRef] [Google Scholar]
- Studies on the water-soluble constituents of the roots of Scutellaria baicalensis Georgi (wogon) J. Pharm. Soc. Jpn.. 1980;100:1220-1224.
- [CrossRef] [Google Scholar]
- Flavone Di C-glycosides from Scutellaria baicalensis. Phytochemistry. 1981;20:2443.
- [CrossRef] [Google Scholar]
- Studies on the constituents in the water extracts of crude drugs. Ⅱ. on the leaves of Scutellaria baicalensis Georgi. J. Pharm. Soc. Jpn.. 1976;96:381-383.
- [CrossRef] [Google Scholar]
- On the revised structure of skullcapflavone Ⅰ, a flavone compound in the roots of Scutellaria baicalensis Georgi (wogon) J. Pharm. Soc. Jpn.. 1979;99:443-444.
- [Google Scholar]
- Baicalin, the major component of traditional Chinese medicine Scutellaria baicalensis induces colon cancer cell apoptosis through inhibition of oncomiRNAs. Sci. Rep.. 2018;8:1-11.
- [CrossRef] [Google Scholar]
- On the flavonoid constituents from the roots of Scutellaria baicalensis Georgi. J. Pharm. Soc. Jpn.. 1981;101:899.
- [CrossRef] [Google Scholar]
- Studies on the constituents of Scutellaria species Ⅱ. On the flavonoid constituents of the roots of Scutellaria baicalensis Georgi. J. Pharm. Soc. Jpn.. 1983;103:607-611.
- [CrossRef] [Google Scholar]
- Studies on the constituents of Scutellaria species . On the flavonoid constituents of the root of Scutellaria baicalensis Georgi. J. Pharm. Soc. Jpn.. 1984;104:524-528.
- [CrossRef] [Google Scholar]
- Studies on the constituents of Scutellaria species Ⅳ on the flavonoid constituents of the root of Scutellaria baicalensis Georgi. J. Pharm. Soc. Jpn.. 1984;104:529.
- [CrossRef] [Google Scholar]
- Selective enrichment with “click oligo (ethylene glycol)” column and TOF–MS characterization of simple phenylpropanoids in the fruits of Forsythia suspensa. J. Sep. Sci.. 2009;32:2958-2966.
- [Google Scholar]
- A comprehensive review on phytochemistry, pharmacology, and flavonoid biosynthesis of scutellaria baicalensis. Pharm. Biol.. 2018;56:465-484.
- [CrossRef] [Google Scholar]
- The study on the formation and development of interxylary cork in roots of Scutellaria baicalensis. Acta Bot. Boreali-Occident. Sin.. 2020;40:1672-1678.
- [CrossRef] [Google Scholar]
- Chemical constituents from stems and leaves of Scutellaria baicalensis. Chin. J. Exp. Trad. Med. Formulae. 2016;22:41-44.
- [CrossRef] [Google Scholar]
- Evaluation of Q-TOF-MS/MS and multiple stage IT-MSn for the dereplication of flavonoids and related compounds in crude plant extracts. Analusis. 2000;28:895-906.
- [CrossRef] [Google Scholar]
- The isolation and identification of chemical constituents of Scutellaria amoena C.H.Wright. J. Shenyang Pharm. Univ.. 2003;20:181-183.
- [CrossRef] [Google Scholar]
- Study on phenolic acids of Lonicerae Japonicae Flos based on ultrahigh performance liquid chromatography-tandem mass spectrometry combined with multivariate statistical analysis. J. Sep. Sci.. 2022;45:2239-2251.
- [CrossRef] [Google Scholar]
- Non-flavonoid constituents from the roots of Scutellaria baicalensis Georgi. Chin. J. Med. Chem.. 2016;26:480-483.
- [CrossRef] [Google Scholar]
- Content Determination of 5 kinds of flavonoid aglycone in Scutellaria baicalensis from different sources by RP-HPLC. China Pharm.. 2014;25:1782-1784.
- [Google Scholar]
- Study on the volatile components in Scutellaria baicalensis Georgi. Tradit. Chin. Drug Res. Clin. Pharmacol.. 1999;4:15.
- [CrossRef] [Google Scholar]
- A new flavone C-glycoside from Scutellaria baicalensis. J. Chin. Pharm. Sci.. 1997;6:182-186.
- [Google Scholar]
- Development of the fingerprints for the quality evaluation of Scutellariae Radix by HPLC-DAD and LC-MS-MS. Chromatographia. 2007;66:13-20.
- [CrossRef] [Google Scholar]
- Scutellaria baicalensis, the golden herb from the garden of Chinese medicinal plants. Sci. Bull.. 2016;61:1391-1398.
- [CrossRef] [Google Scholar]
- Modern study and application of traditional Chinese medicine (first ed.). China: Beijing; 1998.
- Flavonoids and phenylethanoids from hairy root cultures of Scutellaria baicalensis. Phytochemistry. 1997;44:83-87.
- [CrossRef] [Google Scholar]
- Five new flavonoid glycosides in Scutellaria amoena C.H.Wright. Plant Diversity Resour.. 2000;22:475-481.
- [CrossRef] [Google Scholar]


