

Translate this page into:
Direct and accurate purity evaluation for isovanillin conversion to HMCA through aldol condensation by using RID and its comparison with UV detection
⁎Corresponding authors. wangzaihua@163.com (Zaihua Wang), yanrian813@126.com (Rian Yan)
-
Received: ,
Accepted: ,
This article was originally published by Elsevier and was migrated to Scientific Scholar after the change of Publisher.
Abstract
As an important intermediate of Advantame, 3-hydroxy-4-methoxy-cinnamaldehyde (HMCA) is derived from isovanillin by Aldol reaction. The HPLC-UV method was initially established in acetonitrile/water for the separation and quantification of two compounds. UV-chromophores rapidly reach plateauing effect and limit linear regression range below 1.00 mg/mL at UV 210,280 and 340 nm. HPLC-RID with wider range manner was established. The solubility assay of HMCA and isovanillin was investigated for working range limit for the RID under different mobile phase acetonitrile ratios. RID are sensitive enough as UV at micrograms level in methodology comparison. Wider working range and universal response of RID facilitate the purity evaluation. RID detection showed reliable and precise performance as UV in method precision, stability (as all RSDs < 2 %), and similar recovery for accuracy (99.99–101.94 %). The proposed RID method was applied for purity evaluation by using area for direct calculation. The actual purity values had a high correlation with the RID area response directly, and the wavelength complexity resulted in diverse purity evaluations in UV method.
Keywords
Chromophores
Plateauing effect
3-Hydroxy-4-Methoxy-cinnamaldehyde
Isovanillin
Universal detection

1 Introduction
Non-nutritive sweeteners are widely used in various foods and beverages as safe FDA-approved additives (Yang and Chen 2009, Shankar et al., 2013). Among them, aspartame is the most commonly used artificial sweeteners (Vetsch 1985). Recently, the International Agency for Research on Cancer (IARC) classified aspartame as possibly carcinogenic to humans (Group 2B) (Landrigan and Straif 2021, Goodman et al., 2023, Riboli et al., 2023). This prompted international public health authorities to revise the health risks of aspartame for the Acceptable Daily Intake (ADI) level, and safer alternative sweeteners should be considered. Advantame, about 110 times sweeter, has a lower ADI than aspartame, and well tolerated by both animals and humans,and has no systemic toxicity according to modern trials (Otabe et al., 2011, Warrington et al., 2011). As a derivative of isovanillin, 3-hydroxy-4-methoxy-cinnamaldehyde (HMCA) is synthesized by aldol condensation (Nielsen and Houlihan 2004) and serves as an important intermediate for the Advantame end product (Chen et al., 2020). However, the analytical method for the reaction and evaluation of the purity of the isovanillin to HMCA by aldol condensation has not yet been systematically described or established.
The selection of an efficient detector is critical to guarantee that all the designated components are detected (Wolfender 2009, Zhuang et al., 2023). HPLC-UV is the most commonly used technique (Sabourian et al., 2020), which has been mostly selected for quantifying components in food and pharmaceutical products for its high sensitivity and adaptability (Shen et al., 2023). HPLC-UV often searchs for more sensitivity for the detection of the target compounds in the longest wavelength but highly depends on the UV-absorbing chromophore (Dogra et al., 2023). The chemical diversity makes it hard to provide a universal response. To obtain a more universal response, other detectors have been developed. Charged aerosol detection (CAD) and semi-universal evaporative light-scattering detection (ELSD) (Dixon and Peterson 2002) require additional optimization in nitrogen pressure, drift tube, and nebulizer temperature to achieve maximum sensitivity. Detection problems could arise with compounds susceptible to thermal degradation when using elevated drift tube temperatures(Meile et al., 2022). Large chemical diversity is directly linked to high variability of intrinsic physicochemical properties that render its universal detection challenging.
The refractive index detector (RID) is the first, effective, simplest, and least expensive HPLC universal detector (Tiselius and Claesson 1942, Abid et al., 2022). Based on the fundamental property of light's refraction, the simple and nondestructive detection of non-UV-absorbing compounds became possible without having to resort to other complex or expensive detection methods.(Al-Sanea and Gamal 2022) It is the mass-specific detector of choice with wide range when compounds with limited or no UV absorption such as alcohols, carbohydrates, fatty acids, and polymers(Tiwari et al., 2023, Luo et al., 2024). Specifically, trace-level alcohols detection in sodium lauryl sulfate (Katakam and Dongala 2020), simultaneous quantification of glucose (GLC) and short-chain fatty acids (SCFA) (Petrisor and Chireceanu 2019, Serafim et al., 2021) were developed recently. Although many studies have focused on HPLC-UV detection, especially in reversed-phase chromatography on C18 material, HPLC-RID is also compatible with organic solvent–water systems (Liu et al., 2014). The sensitivity of RID can be the main limitation for its use in many analytical situations and is often combined with size exclusion chromatography (SEC) columns for the determination of molecular weight (Guadalupe et al., 2012) or limit in gradient elution approach and water-soluble compounds (Ho et al., 2008). However, the sensitivity of analytical method is not the major concern in the conversion of organic reaction. Due to the mass-dependent and universal response strategy, HPLC-RID is capable of capturing most of the intermediates of degradation (Supap et al., 2006). HPLC function is sensitive enough to monitor the conversion and the purity or degradation throughout the reaction to ensure consistent product quality(Liu et al., 2020).
In this work, we have attempted to develop a facilitating, reproducible analytical approach for the detection of HMCA and isovanillin by HPLC technique. The present work aims to perform a systematic comparison of HPLC-RID and HPLC-UV based methodology within research compounds. The application of HPLC-RID to solid-form organic compounds is expected to open up new opportunities for practice by providing a more sustainable and reliable analytical method for actual purity monitoring and food-related products.
2 Matertials and methods
2.1 Chemical reagents
Isovanillin (3-Hydroxy-4-methoxy-benzaldehyde, HPLC ≥ 98 %, C8H8O3, PubChem CID: 12127) was purchased from Acmec Biochemical Technology Co., Ltd (Shanghai, China). 3-Hydroxy-4-methoxy-cinnamaldehyde (HMCA, HPLC ≥ 98 %, C10H10O3, PubChem CID: 54025157) and acetonitrile suitable for HPLC (Gradient grade, ≥99.9 %)were purchased from Sigma–Aldrich (Shanghai) Trading Co., Ltd. The purified water for HPLC mobile phase and stock solutions preparation was obtained on a Milli-Q system (Millipore, USA). All other chemical reagents were of analytical grade.
2.2 Solubility determination
An analytical equilibrium method was used to measure the solubility of isovanillin and HMCA in acetonitrile/water. The solubility was determined by the gravimetric method according to the report with modification (Zhang et al., 2021, Zhang et al., 2023).
The acetonitrile–water solution with a ratio of 20 to 40 % (v/v) was previously degassed with ultrasound and stabilized at a certain temperature for more than 1 h. Excess amounts of isovanillin and HMCA were added with 10 mL of the binary solvents into a double-layer glass reactor with sealing vial. The temperature of the vessel was controlled with a Magnetic Hotplate Stirrer (SCI340-Pro, Rocky Hill, USA). The solutions in the vails were continuously agitated by a magnetic stirrer at 350 rpm for 6 h to reach solubility equilibrium, and then kept still for 2 h to settle completely. The mass of solute and solvent in acetonitrile–water solution could be calculated from the weight loss before and after drying. Each solubility experiment was performed in triplicate, and the arithmetic mean was considered as the final solubility.
2.3 Stock solutions preparation
Standard solutions of isovanillin and HMCA were diluted with 50 % acetonitrile/water (w/w), and an aliquot of the diluted solutions was analyzed.
A series of working standard solutions of isovanillin and HMCA were prepared at a concentration between 0.010–10.0 mg/ mL by diluting the stock solutions with the appropriate ratio of acetonitrile/water in the mobile phase.
2.4 Chromatographic conditions for HPLC measurement
The high-performance liquid chromatographic analysis was performed with an Agilent HPLC system (1260 Infinity). The Agilent Eclipse XDB-C18 (5 μm,4.6 × 250 mm) was used for compound separation. The mobile phase used for chromatography consisted of a mixture of acetonitrile and water at a flow rate of 0.8 mL/min and an injection volume of 5 μL. The column temperature was set to 30 °C. The wavelength of the UV detector was set at 210, 280, and 340 nm, respectively, to detect the response area and height of the compound. The RID 1260 refractive index detector was maintained at 30 °C to match the column temperature.
2.5 HPLC method validation
The HPLC analysis method with UV and RID detection was validated and compared in terms of linearity, limit of detection (LOD), limit of quantification (LOQ), precision, stability, and accuracy.(Baruah et al., 2024, Ristović et al., 2024).
The linearity of Isovanillin and HMCA was analyzed by linear regression using the least squares method to define the coefficient of determination (R2).
The limit of detection and quantification was calculated for compound concentration versus peak area relationships based on Eqs. (1) and (2):
The Precision of the methods was confirmed by intra-assay in solutions measurement (n = 6), and by inter-assay of 6 samples. One sample prepared from solutions was injected 12 times for 12 consecutive hours to observe stability.
The accuracies of the two methods were presented as recovery calculations on individual and mixed standards according to Eq. (3).
2.6 Statistical analysis
All data are presented as the means ± standard deviations. Origin 9.0 was used for the preparation of figures. Student's t-test is used to compare the difference between two HPLC means at probability level α < 0.05.
3 Result and discussion
3.1 HPLC-UV method for separation of HMCA and isovanillin
As the intermediate for Advantame synthesis, 3-hydroxy-4-methoxy-cinnamaldehyde (HMCA) was chemically derived from isovanillin for the phenolic hydroxyl and methoxy group on the benzene ring (Amino et al., 2008). In addition, with the aldehyde group existing in both components, HMCA can be synthesized by extending the carbon chain without changing the aldehyde through the aldol condensation reaction (Nielsen and Houlihan 2004). The aldehyde is the important functional group for the next step for the C-N couple in the final Advantame production (Zhang et al., 2019). Aldol condensation is one of the most important organic reactions, capable of forming new C–C bonds. However, Aldol condensation is a reverse reaction; hence the complete conversion of isovanillin to its kinetic product, HMCA, is not always guaranteed. Accordingly, the real-time and simultaneous monitoring, identification, and quantitation method of isovanillin conversion to HMCA is significant in intermediate production and quality assurance.
With both the presence of the phenolic hydroxyl group in HMCA and isovanillin, the UV absorption can be estimated at fairly high sensitivities. High sensitivity assays for UV detector should principally avoid the high absorbance of the mobile phase. Acetonitrile (ACN) and methanol are commonly used as solvents. Compared to methanol, HPLC-type acetonitrile has lower absorbance (particularly at UV-short wavelengths) and higher elution capacity. In addition, pressure for methanol increases significantly with the proportion of water in reverse phase C18 HPLC columns, and delivery pressure for water/acetonitrile mixture is much lower (Aburjai et al., 2011). Hence, the mixing ratio of acetonitrile/water was chosen as the mobile phase for the HMCA and isovanillin HPLC-UV method development.
The separation of HMCA and isovanillin in the HPLC-UV method was successfully established under the different proportions of ACN/water. A higher ratio of organic solvent (40 %) was initially adopted for the acquisition of chromatography data. Subsequently, the proportion of organic solvents is modified with a 5 % interval according to separation chromatography. As shown in Fig. 1A, all different proportions of organic solvent with water (ACN/water: 20–40 %) created distinguished fractionation of individual components with C18 column. Decreasing the proportion of acetonitrile resulted in slower elution but better separation (Fig. 1A). Compared to isovanillin, HMCA showed a longer retention time and this can be explained by the organic compound polarity (Poole 2019). With similar functional groups, the only difference is the alkyl chain lengths in the aldehyde group between these compounds. Longer alkyl chains in HMCA lower its polarity and thus increase the retention properties under the same separated conditions (Fan et al., 2022). A higher ratio of water in the mobile phase may lead to unacceptably long retention times and cause high system pressure during fractionation. Moreover, to save the cost of acetonitrile solvent and keep the single run within 10 min for rapid detection, elution with a mobile phase of 30 % acetonitrile was selected for further methodology development and validation.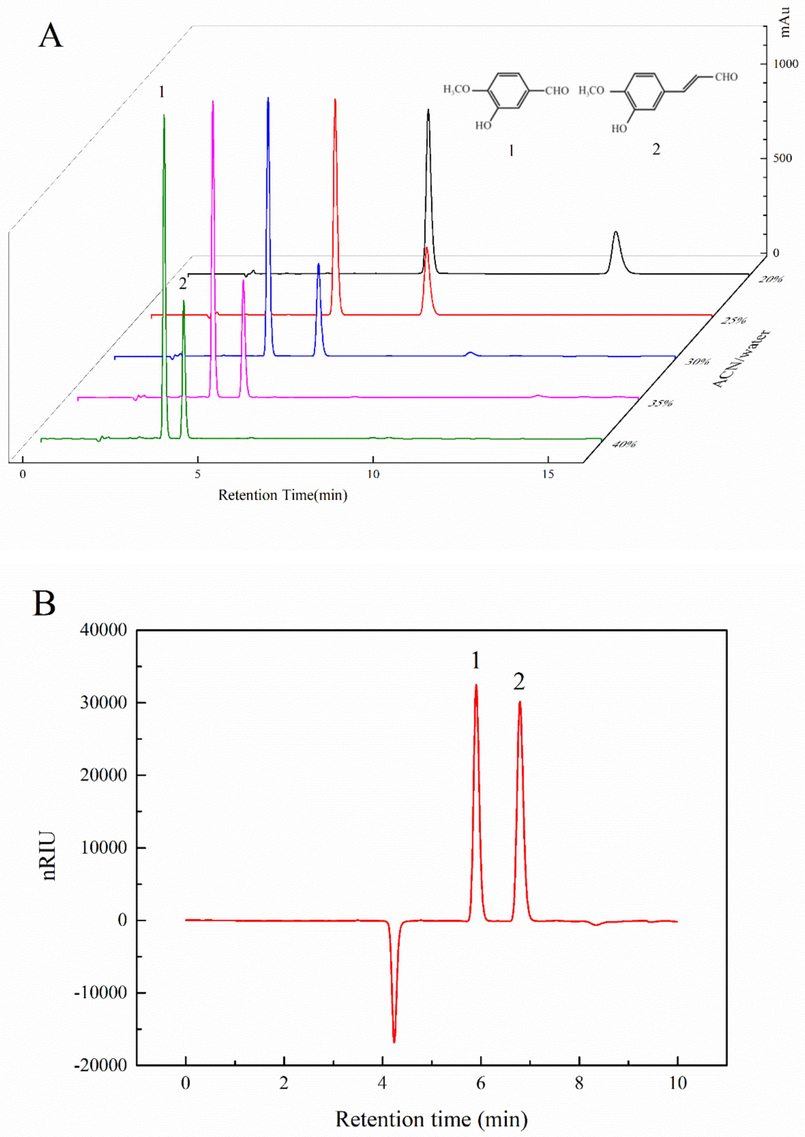
HPLC chromatograms of Iisovanillin and HMCA (A) UV-210 nm (B) RID (1: Isovanillin, 2: HMCA).
3.2 HPLC-UV quantitative analysis of HMCA and isovanillin
Conjugated groups exist in α, β-unsaturated aldehydes (HMCA), and aromatic aldehydes (Isovanillin). The UV spectral appearances due to the conjugated double bonds in the molecular structure are stable and dominating with low influence from other substituents (Sabourian et al., 2020). The wavelength range of 280–340 nm is characteristic for related aldehydes and ketones, and the longest wavelength of HMCA was reported at 340 nm (Chen et al., 2020). For evaluation of the isovanillin and HMCA chromatograms, the longest suitable wavelength was chosen at 280 and 340 nm, which allowed sufficient sensitivity for the aldehyde substances. To study possible interference with small impurities or solvents and record the details in the UV short-absorption region, a wavelength of 210 nm was also recorded for chromatogram comparison.
Wavelength selection is an effective strategy used for improving the quality of calibration methods. Fig. 2 A shown various wavelengths of absorption for HMCA and isovanillin. In the concentrations between 0.010 and 2.50 mg/mL, the linearity performance of isovanillin at 210, 280 nm was highly compromised in high concentrations. The same linear deflection phenomenon for HMCA was observed when UV wavelength was adjusted to 340 nm (longest wavelength of HMCA). The plateauing effect of isovanillin and HMCA at high absorbance values in UV spectroscopy could be observed directly from the peak height of two compounds (Fig. 2 B). When linear deflection of peak area occurs, peak height has correspondingly reached the absorption platform. The peak height of HMCA at 340 nm did not reach the same level as 210 or 280 nm of isovanillin for the higher energy in short wavelength of UV spectrum (Sekiguchi et al., 2017). While in the lower concentration, the peak area and concentration curve for the two compounds showed significant positive linear relationships at all wavelengths. UV detection at low concentration levels is more suitable for quantitative relationships to avoid lack of fit problems. The UV detector was engaged mainly to allow the quantification of low-concentration samples, which limits the linear fitting range. The more sensitive of wavelength, the easier to trigger the plateauing effect of UV detection. The maximum UV wavelength of the target substance is often chosen for analysis, while this may not usually get a wider working range, and even possible to shrink the quantitative interval or result in the lack of fit in the calibration curve.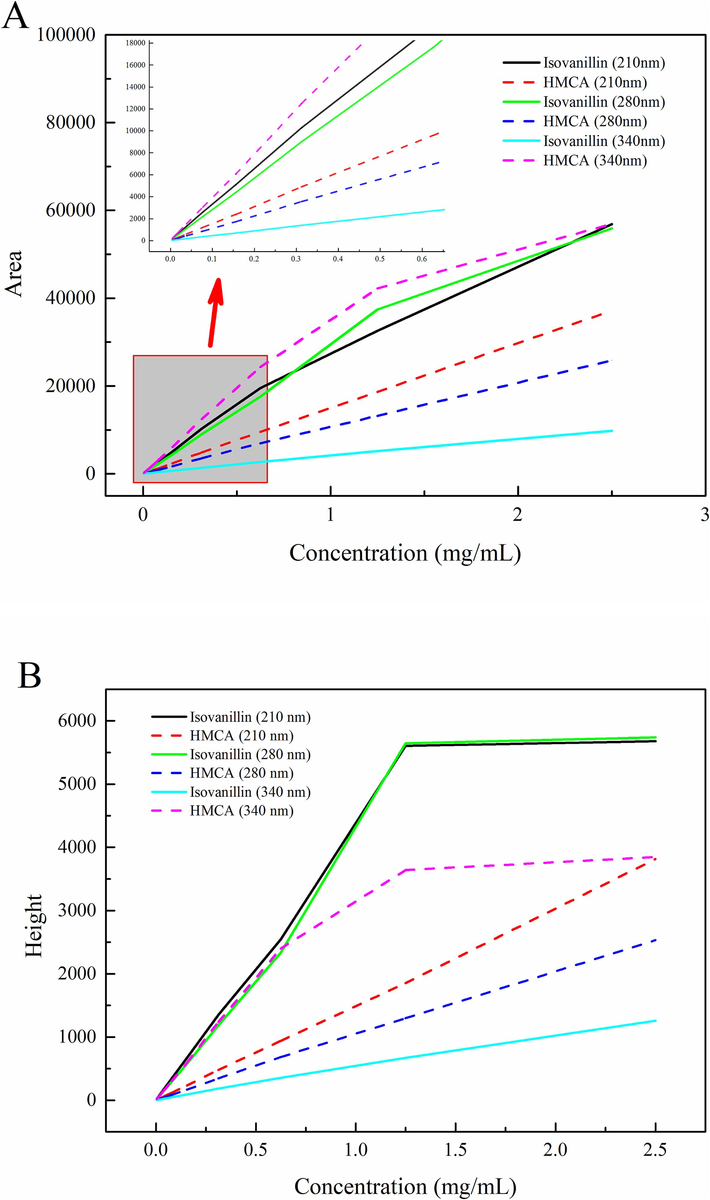
Peak area (A), Height (B) at UV-210,280,340 nm and (C) RID Area vs concentration graph response for isovanillin and HMCA.
Peak area (A), Height (B) at UV-210,280,340 nm and (C) RID Area vs concentration graph response for isovanillin and HMCA.
Necessity of more efficient and reliable analytical methods and data elaboration are required. Mass response factors are more consistent than when using UV detection, making relative quantitation of different compounds (e.g. area) easier and more accurate and consistent (Vervoort et al., 2008).
3.3 HPLC-RID method development and solubility measurement
RID detector is a mass-dependent detector, and its response generated is not restricted by the spectral properties of the analyte (Yilmaz et al., 2014). Strong UV chromophores can be analyzed by HPLC-UV, and sensitive detection will limit the total linear range and easy to reach the maximum absorption in a certain wavelength. To get rid of the plateauing effect in UV spectrum, the focus of the HPLC method for isovanillin and HMCA analysis was assigned to RID detection.
Isovanillin was reported as slightly soluble in water (Zhang et al., 2021). The derived HMCA with the extension of the C-C chain further alkylated the isovanillin, which may lead to lower solubility in water. Poor solubility of the target compound in organic/aqueous diluent is very often the limiting factor for the HPLC method. With the addition of organic solvents, the solubility for isovanillin and HMCA will increase considerably, which is a prerequisite for the HPLC-UV test.
With C18 column in UV detection, the HPLC-RID method at low analyte concentration was attempted to observe the separation and peaks of HMCA and isovanillin. As exhibited in Fig. 1B, the RID method showed high-resolution separation and perfect symmetrical peak shapes for two compounds. This demonstrated the feasibility of C18 with RID as solid organic compound determination. Moreover, almost similar peak areas were obtained in HPLC-RID elution. HMCA with lower polarity showed with a longer retention time and lower but wider peak shape. Compared with different absorptions in UV, RID presented a universal peak area response. Unlike UV detection in a low concentration range, RID detection has a wider range for sugar and other organic compounds and is suitable at high analyte concentrations (Gonzaga et al., 2019). To further study the proper working range of isovanillin and HMCA in RID detection, solubility has become an important parameter, as the organic/aqueous mobile phase should provide adequate aqueous solubility for solid-form samples.
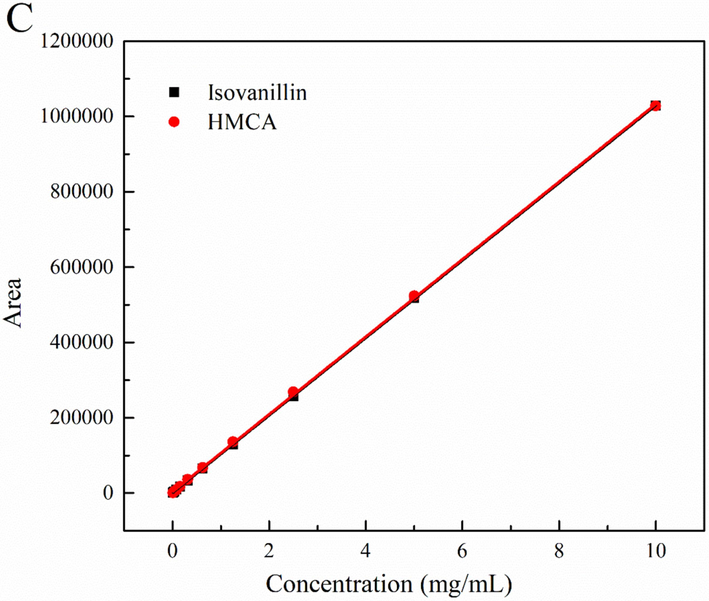
To study solid-form HMCA and isovanillin dissolution in the mobile phase, the solubility assay of research compounds was investigated by a gravimetric method. The solubility of isovanillin and HMCA in 20–40 % acetonitrile/H2O solvent was presented in Fig. 3A. The solubility graph shown that isovanillin has better solubility in organic/aqueous solvents compared to HMCA at all ratios. Higher amounts of acetonitrile can be introduced to increase the solubility of two compounds in an organic solvent/water mixture. It is even possible to use other organic solvents as mobile phase to provide sufficient solubility for targeted analyte in the HPLC-RID detection system. Although higher solubility of HMCA and isovanillin can be obtained by increasing the acetonitrile ratio, a corresponding increase of acetonitrile in the mobile phase is required, which results in large organic solvent consumption during sequential elution. As previous mobile phase condition in the UV method, 30 % ACN/water was employed for the solubility of HMCA and isovanillin both more than 10 mg/mL, which is high enough for the quantitative study of HPLC-RID.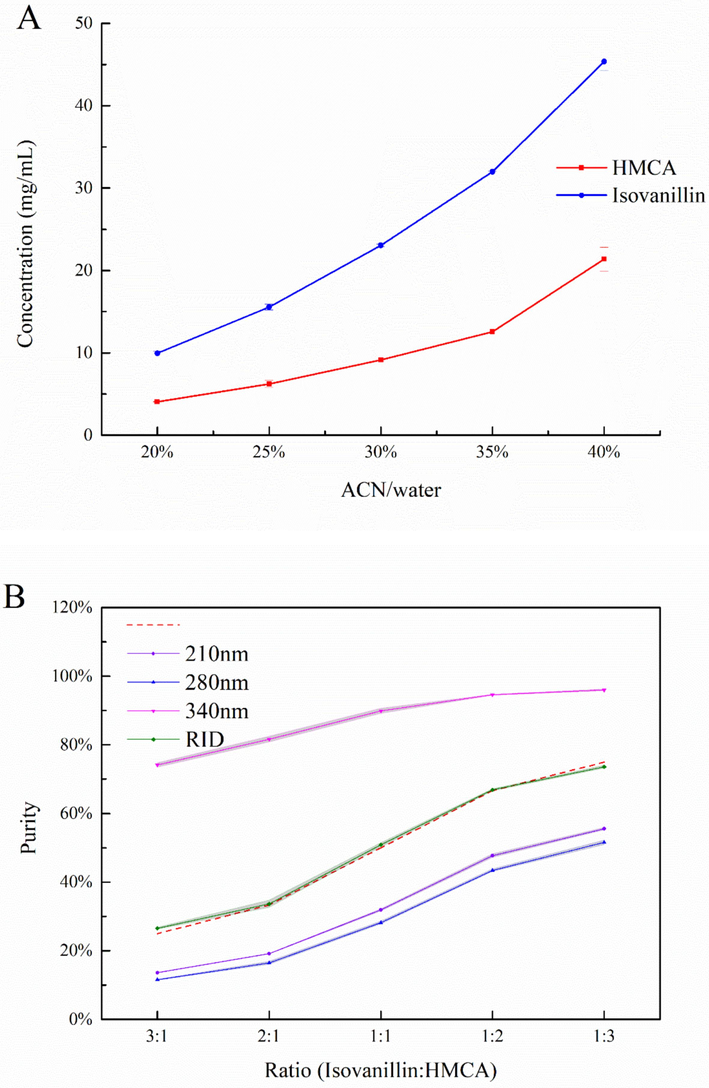
(A) Solubility of HMCA and isovanillin in ACN/water mixture (B) Purity evaluation for UV and RID detection.
With the solubility of 30 % ACN/water from 0.10-10.0 mg/mL, the RID response against concentration curves of isovanillin and HMCA was established and presented in Fig. 2C. Great linear regression relationship in the RID detection was obtained in a wider concentration detection range, which indicated that the plateauing effect in UV method can be avoided here. In addition, a wider working range in RID for HMCA and isovanillin could be estimated for their higher solubility (Fig. 3A) and separation (Fig. 1) in 40 % ACN/water. Moreover, isovanillin and HMCA showed two almost overlapping calibration curves for the peak area against analyte concentration, which is the universal response feature requested by precise and consistent quantification. This HPLC-RID approach with isovanillin and HMCA highlighted the availability of solubility models for solid-form compounds and generality of C18 in organic compound separation and extends the limit of RID application in carbohydrate, water-soluble or liquid compounds.
3.4 Comparison of sensitivity and method validation
To achieve a better understanding of the difference between UV and RID detection, HMCA and isovanillin were used to estimate the efficiency and variability of the two methods. The linear range, intercept, and slope of the calibration curves are given in Table 1 along with the regression coefficient for two methods.
Compound
Method
Linear range
Slope
Intercept
LOD mg/mL
LOQ mg/mL
R2
Isovanillin
UV-210 nm
0.010–0.625 mg/mL
31400.34
110.21
0.019
0.057
0.9994
HMCA
15357.60
2.82
0.009
0.027
0.9999
Isovanillin
UV-280 nm
28170.58
22.16
0.009
0.028
0.9999
HMCA
11143.29
1.08
0.008
0.025
0.9999
Isovanillin
UV-340 nm
4323.77
7.63
0.011
0.033
0.9998
HMCA
39012.52
26.20
0.010
0.029
0.9998
Isovanillin
RID
0.030–10.0 mg/mL
102860.07
727.95
0.034
0.104
0.9999
HMCA
RID
102943.20
3208.77
0.028
0.086
0.9999
The linear range of UV is restricted by its response to reach the plateauing effect, and various compounds or wavelengths differ the linear range. The UV calibration fitting curve linear range was 0.010–0.625 mg/mL, as substances plateauing effect when concentration exceeded 0.625 mg/ml (Fig. 2A, B). In comparison, the working range of RID detection, the solubility are the major concerns. The quantitative range can be extended with increasing acetonitrile ratio, but required to ensure that the elution separation can reach the maximum compound solubility and load of the C18 column. Therefore, HMCA and isovanillin measured at a dissolved concentration of 10 mg/mL in 30 % acetonitrile of HMCA will serve as the upper limit for the quantitative linearity range. Under the proper solubility, R2 values of fitting curves for analytes all reached 0.9990, in which all R2 of RID are greater than 0.9999. Regression coefficients revealed linear regression relationship for UV and RID detection is statistically significant.
RI detector was reported to have a lower sensitivity compared to UV detector, but better in sucrose analyses (Al-Sanea and Gamal 2022). The sensitivity of detection (as the limit of detection and quantification) of RI and UV detection was evaluated with isovanillin and HMCA for comparison. In all detected wavelengths, similar UV sensitivity can be obtained, which ranges from 0.008-0.019 mg/ml, and 0.25–0.057 mg/ml for LOD and LOQ, respectively. In RID detection, the better performance of LOD and LOQ were 0.028, and 0.086 in HMCA, respectively, and isovanillin got similar sensitivity. Under the given linear range, where two compounds had UV-absorbing chromophore, the UV detector still surpasses the RID in terms of detection sensitivity but is not very prominent for the two organic analytes here. The RID method can measure two compounds accurately at this sensitivity the same as UV at micrograms level (Al-Sanea and Gamal 2022). Furthermore, an indistinguishable slope was obtained by RID-detection (102860.07 and 102943.20), compared to the various values in UV, which is the attractive advantage of RID universal response.
The precision, stability (as relative standard deviation, RSD), and accuracy (as recovery) values for the determination of isovanillin and HMCA are summarized in Table 2. The precision and stability for all samples range from 0.5-1.7 % (n = 6). Excellent RSDs for measured compounds are below 2 %. There is no noticeable difference between the two methods in precision or stability. Accuracy is the closeness of the results to the true value or an accepted reference value. Student’s t-test was used for the comparison of two means. The difference is not significant (p > 0.05) for two detectors at induvial proper concentrations (0.10 and 1.00 mg/ml for UV and RID, respectively), which indicates that both methods provide similar accuracies on three levels of recovery experiments. In summary, both detectors were able to detect all studied compounds with sufficient sensitivity and accuracy needed in an analytical lab by methodology comparison. For non-UV analyte or mobile phase that is not UV compatible, UV detection is not an ideal option. Resorting to RID is a favorable solution even for UV-absorbing compounds, which provide a wide r range of linear dynamic range. Moreover, refractive index detection is more attractive for the benefits of universal detection with liquid chromatography, by which ideally standard independent calibration and analyte mass independent quantification becomes possible (Bandini et al., 2022). The values are means (SD), RSD.
Method a
Compound
(mg/mL)Precision
Stability (n = 12)
Recovery for accuracy
Intra assay (n = 6)
Inter assay (n = 6)
Nominal ratios
Standard add amount (n = 3)
Total recovery b (n = 9)
HPLC-RID
Isovanillin
1.031(10),1.0 %
1.054 (13),1.2 %
1.105(14),1.3 %
0.523
0.675
101.94(1),0.9 %
0.537
0.387
HMCA
1.008(9),0.9 %
1.041(18),1.7 %
1.118(20),1.8 %
0.511
0.662
99.99(1),1.3 %
0.531
0.377
HPLC-UV
(210 nm)Isovanillin
0.103(1),0.6 %
0.102(1),1.2 %
0.107(1),0.6 %
0.052
0.065
100.46(1),0.7 %
0.052
0.042
HMCA
0.102(2),0.5 %
0.101(2),1.5 %
0.110(1),1.1 %
0.054
0.065
101.04(1),0.8 %
0.052
0.042
3.5 Application in purity evaluation
Accurate and rapid identification and quantitation of the reaction products and starting ingredients to ensure better and continuous quality control. Organic synthesis is accompanied by the formation of new bonds and increment of molecular weight, and more importantly, the absorption wavelength of the substances may vary during the reaction. To monitor the completeness of Aldol reaction and/or post-synthesis purification is crucial. HPLC-UV detection is a commonly used method in purity evaluation, but one prerequisite is that the analyte of interest contains one or more UV-absorbing chromophores. However, it is laborious to verify the spectrum for the reaction product, especially when no commercially available standard for comparison. To characterize the target compound, it is necessary to purify chemical mixtures by preparative HPLC or common flash column chromatography. This work is often tedious and time-consuming, and yet may not provide convincing quantitation. Furthermore, the compound could be degraded during sample extraction and purification. There is, therefore, a considerable need to develop and validate new reliable and simple methods for determining product purity.
The area normalization method was simplified without detector response factor, using their area for direct purity evaluation (Azilawati et al., 2015). Specifically, the purity of HMCA was evaluated by area in HPLC by the following equation: where the AH is the Area of HMCA, and AI stands for the area of isovanillin in each method.
A critical evaluation of absolute purity determination by area signal was designed and presented in Fig. 3B. The actual purity values (3:1,2:1,1:1,1:2,1:3) exhibited with red dash line represent the portion of isovanillin (starting major component) and the amounts of HMCA added. The RID method always showed consistent purity results with actual purity. Calculated purity was lower than actual purity at 210 and 280 nm from peak area ratios, but much higher when shifting the wavelength to the max absorption of HMCA at 340 nm. For example, with only a 50 % conversion of isovanillin, the peak response of HMCA already reached a 90 % ratio in total area. If the aldol reaction is to be quenched here, it will be painstaking for the post-separation and purification of 50 % mixtures. The actual purity values had a high correlation with the RID area response directly, and the wavelength complexity resulted in diverse purity evaluations in UV method.
Wavelength selection problem and non-linear response behavior in a wide concentration range makes direct linear regression for make calibration curves inaccurate. When calculating the purity of a substance or monitoring the progress of a chemical reaction, it is always necessary to perform several linear calibrations for various standards and pre-examine the concentration interval suitable for UV quantification, which makes it hard to determine the conversion and calculate the purity through the direct ratio of the peak area. Furthermore, the detection of UV will become tricky when unknown substance or side reaction product is involved. In HMCA purity evaluation, the developed HPLC–RID method is a rapid and excellent approach for the completeness of conversion of isovanillin with a universal response manner. As compared to the UV analysis, RID does not require exact calibration and multiple dilutions to avoid plateauing effects. In terms of analysis and calculation simplicity, therefore, the HPLC–RID method is particularly favorable for the determination in this situation. Based on the results obtained, the proposed HPLC–RID is a straightforward and effective method with attractive analytical performance for the analysis of purity.
4 Conclusions
Different characteristics of UV and RI detector performance were methodically studied and compared with isovanillin and HMCA from the aldol reaction. RID was used often just limited in water-soluble compounds or macromolecules or as compensation for non-UV compound detection. The limitation in the analysis of aqueous soluble can be liberated by the C18 column with organic elution solvents (e.g., methanol/acetonitrile) for solubility Increment. UV-chromophore makes it easier to reach a plateauing effect and limits its linear regression range in UV detection. The proposed HPLC-RID with C18 column separation method reveals great potential of solid-form organic compound as a quantificational analyte with universal response and wider working range.
In the food and pharmaceutical industry, UV detection is often used as the preferred detection technique in HPLC analysis, when the compounds to be analyzed have a UV-absorbing chromophore present and the solvents or mobile phase additives used have a sufficiently low UV-cut-off value. If the ingredient does not have a UV-absorbing chromophore, or some of the impurities present lack a chromophore they will not be detected in HPLC analysis employing only a UV detector and alternative detection schemes have to be used. Decent trace detection is secured through mass spectrometry, which has been established as the most versatile, sensitive and selective analytical technique for trace analysis. Routine HPLC analysis employing only with UV or RID detector may not be inadequate for the accurate determination of analytes at low ppm levels. The RID method is not sensitive as UV detection in most cases, but sensitive enough for basic detection in microanalysis. The rapid and reliable purity evaluation in chemical mixtures requires the choice of a universal detector as RID.
The attractive feature of the RID technique generating a universal response factor is the potential use of a single, universal, standard for calibration against which all compounds or impurities can be quantified in a wider concentration range. This study mainly focuses on the mass response manner for HMCA and Isovanillin in RID without multi-component and complex analysis. Future efforts should be made to enhance its interior sensitivity and extend the applications of the detector. We anticipate its comprehensive application in food, cosmetics, fine chemicals, and pharmaceutical industrial processes required for fundamental substance exchange, reaction monitoring, and purity evaluation.
CRediT authorship contribution statement
Canbiao Zeng: Writing – review & editing, Writing – original draft, Validation, Resources, Methodology, Formal analysis, Data curation, Conceptualization. Jine Lai: Writing – review & editing, Writing – original draft, Software, Project administration, Data curation, Conceptualization. Huiting Lin: Writing – original draft, Resources, Methodology, Formal analysis. Guangying Ye: Writing – original draft, Project administration, Funding acquisition, Formal analysis. Yongsheng Chen: Visualization, Supervision, Project administration, Funding acquisition, Formal analysis. Feng Hu: Validation, Supervision, Project administration, Funding acquisition. Zaihua Wang: Writing – review & editing, Supervision, Project administration, Methodology, Investigation, Funding acquisition. Rian Yan: Writing – review & editing, Writing – original draft, Supervision, Project administration, Methodology, Funding acquisition, Data curation, Conceptualization.
Acknowledgements
This work was supported by the Yangxi Country Science and Technology Project , China (No. 21011), Special Project of Guangdong Provincial Department of Finance-Extraction and Product Development of Citrus maxima (Burm.) Osbeck, China (2022053), Guangdong Provincial Modern Agricultural Industry Technology System Innovation Team Project, China (2023KJ148).
Declaration of competing interest
The authors declare that they have no known competing financial interests or personal relationships that could have appeared to influence the work reported in this paper.
References
- Development and validation of a new analytical method for estimation of narasin using refractive index detector and its greenness evaluation. Microchem. J.. 2022;175:107149
- [CrossRef] [Google Scholar]
- Temperature and pressure behaviours of methanol, acetonitrile/water mixtures on chromatographic systems. Am. J. Anal. Chem.. 2011;2:934.
- [Google Scholar]
- Critical analytical review: Rare and recent applications of refractive index detector in HPLC chromatographic drug analysis. Microchem. J.. 2022;178:107339
- [Google Scholar]
- Development of New, Low Calorie Sweetener: New Aspartame Derivative. Sweetness and Sweeteners 2008:463-480.
- [Google Scholar]
- RP-HPLC method using 6-aminoquinolyl-N-hydroxysuccinimidyl carbamate incorporated with normalization technique in principal component analysis to differentiate the bovine, porcine and fish gelatins. Food Chem.. 2015;172:368-376.
- [Google Scholar]
- Hyphenating temperature gradient elution with refractive index detection through temperature-responsive liquid chromatography. Anal. Chim. Acta. 2022;1231:340441
- [CrossRef] [Google Scholar]
- RP-HPLC-RID analysis of InsP6 to InsP3 in Indian cereals, legumes, and their products: A comparative evaluation of PRP-1 Vs C18 column. J. Chromatogr. B. 2024;1245:124271
- [CrossRef] [Google Scholar]
- Purification, characterization, and identification of 3-hydroxy-4-methoxy benzal acrolein–an intermediate of synthesizing advantame. Food Sci. Nutr.. 2020;8:744-753.
- [CrossRef] [Google Scholar]
- Development and Testing of a Detection Method for Liquid Chromatography Based on Aerosol Charging. Anal. Chem.. 2002;74:2930-2937.
- [CrossRef] [Google Scholar]
- Derivatization, an applicable asset for conventional HPLC systems without MS detection in food and miscellaneous analysis. Crit. Rev. Anal. Chem.. 2023;53:1807-1827.
- [Google Scholar]
- Effect of spacer alkyl chain length on retention among three imidazolium stationary phases under various modes in high performance liquid chromatography. J. Chromatogr. A. 2022;1685:463646
- [Google Scholar]
- Green method using water for lactose and lactulose extraction and determination in milk by high-performance liquid chromatography with refractive index detection. Lwt-Food Science and Technology.. 2019;113
- [CrossRef] [Google Scholar]
- The role of study quality in aspartame and cancer epidemiology study reviews. Global Epidemiology.. 2023;5:100110
- [Google Scholar]
- Quantitative determination of wine polysaccharides by gas chromatography–mass spectrometry (GC–MS) and size exclusion chromatography (SEC) Food Chem.. 2012;131:367-374.
- [CrossRef] [Google Scholar]
- Analysis of Bioactive Triterpenes in <i>Eriobotrya japonica</i> LINDL. by High-Performance Liquid Chromatography. J. Food Drug Anal.. 2008;16:41-45.
- [Google Scholar]
- Analysis of mixtures of fatty acids and fatty alcohols in fermentation broth. J. Chromatogr. A. 2014;1323:66-72.
- [CrossRef] [Google Scholar]
- Determination and uncertainty estimation of tangeretin purity certified reference material. Microchem. J.. 2020;158:105205
- [CrossRef] [Google Scholar]
- Comparison of ELSD and RID combined with HPLC for simultaneous determination of six rare sugars in food components. Microchem. J.. 2024;201:110666
- [CrossRef] [Google Scholar]
- Discrimination of levoglucosan and its structural isomer in biomass pyrolysis products by iodometry, liquid chromatography, mass spectrometry. J. Anal. Appl. Pyrol.. 2022;166
- [CrossRef] [Google Scholar]
- The Aldol Condensation. Organic Reactions.. 2004;16:1-438.
- Advantame – An overview of the toxicity data. Food Chem. Toxicol.. 2011;49:S2-S7.
- [CrossRef] [Google Scholar]
- Organic acids and sugars profile of some grape cultivars affected by grapevine yellows symptoms. Romanian Biotechnological Letters.. 2019;24:1027-1033.
- [CrossRef] [Google Scholar]
- Influence of solvent effects on retention of small molecules in reversed-phase liquid chromatography. Chromatographia. 2019;82:49-64.
- [Google Scholar]
- Carcinogenicity of aspartame, methyleugenol, and isoeugenol. Lancet Oncol.. 2023;24:848-850.
- [Google Scholar]
- A simple and fast HPLC method for determining the composition of fructooligosaccharides and xylooligosaccharides obtained by fungal enzymes. J. Food Compos. Anal.. 2024;133:106459
- [CrossRef] [Google Scholar]
- HPLC methods for quantifying anticancer drugs in human samples: A systematic review. Anal. Biochem.. 2020;610:113891
- [Google Scholar]
- Combined sonochemical and short-wavelength UV degradation of hydrophobic perfluorinated compounds. Ultrason. Sonochem.. 2017;39:87-92.
- [Google Scholar]
- Fast Determination of Short-Chain Fatty Acids and Glucose Simultaneously by Ultraviolet/Visible and Refraction Index Detectors via High-Performance Liquid Chromatography. Food Anal. Methods. 2021;14:1387-1393.
- [CrossRef] [Google Scholar]
- Non-nutritive sweeteners: Review and update. Nutrition. 2013;29:1293-1299.
- [CrossRef] [Google Scholar]
- Rapid detection of serum calcium based on supramolecular aggregates of a cationic perylene in vitro. J. Photochem. Photobiol. A Chem.. 2023;442:114771
- [CrossRef] [Google Scholar]
- Analysis of monoethanolamine and its oxidative degradation products during CO2 absorption from flue gases: A comparative study of GC-MS, HPLC-RID, and CE-DAD analytical techniques and possible optimum combinations. Ind. Eng. Chem. Res.. 2006;45:2437-2451.
- [Google Scholar]
- Adsorption analysis by means of interferometric study. Arkiv Kemi Minearl Geol.. 1942;15:1-6.
- [Google Scholar]
- A Validated HPLC-RID Method for Quantification and Optimization of Total Sugars: Fructose, Glucose, Sucrose, and Lactose in Eggless Mayonnaise. SEPARATIONS.. 2023;10
- [CrossRef] [Google Scholar]
- Performance evaluation of evaporative light scattering detection and charged aerosol detection in reversed phase liquid chromatography. J. Chromatogr. A. 2008;1189:92-100.
- [CrossRef] [Google Scholar]
- Aspartame: technical considerations and predicted use. Food Chem.. 1985;16:245-258.
- [Google Scholar]
- Acute and multiple-dose studies to determine the safety, tolerability, and pharmacokinetic profile of advantame in healthy volunteers. Food Chem. Toxicol.. 2011;49:S77-S83.
- [CrossRef] [Google Scholar]
- HPLC in Natural Product Analysis: The Detection Issue. Planta Med.. 2009;75:719-734.
- [CrossRef] [Google Scholar]
- Simultaneous Determination of Nonnutritive Sweeteners in Foods by HPLC/ESI-MS. J. Agric. Food Chem.. 2009;57:3022-3027.
- [CrossRef] [Google Scholar]
- Steady, dynamic and creep rheological analysis as a novel approach to detect honey adulteration by fructose and saccharose syrups: Correlations with HPLC-RID results. Food Res. Int.. 2014;64:634-646.
- [CrossRef] [Google Scholar]
- Engineered C-N Lyase: Enantioselective Synthesis of Chiral Synthons for Artificial Dipeptide Sweeteners. Angew. Chem. Int. Ed.. 2019;59:429-435.
- [CrossRef] [Google Scholar]
- Solubility determination, model evaluation and solution thermodynamics of isovanillin in 15 pure solvents and 4 binary solvents. J. Mol. Liq.. 2021;340
- [CrossRef] [Google Scholar]
- Solubility determination, model evaluation and solution thermodynamics of isovanillin in 15 pure solvents and 4 binary solvents. J. Mol. Liq.. 2021;340:116847
- [CrossRef] [Google Scholar]
- Determination and Correlation of the Solubility of 1,3-Cyclohexanedione Form I in Fourteen Pure Solvents at Temperatures from 288.15 to 333.15 K. J. Chem. Eng. Data. 2023;68:2742-2750.
- [CrossRef] [Google Scholar]
- Determination of γ-aminobutyric acid in fermented soybean products by HPLC coupled with pre-column derivatization. J. Food Compos. Anal.. 2023;119:105248
- [CrossRef] [Google Scholar]


