

Translate this page into:
Discovery of quality markers in the rhizome of Atractylodes chinensis using GC–MS fingerprint and network pharmacology
⁎Corresponding authors at: Chengdu University of Traditional Chinese Medicine, 1166 Liutai Avenue, Wenjiang District, Chengdu, Sichuan 611137, China. dr.jinzhao@163.com (Zhao Jin), chenlu@cdutcm.edu.cn (Lu Chen)
-
Received: ,
Accepted: ,
This article was originally published by Elsevier and was migrated to Scientific Scholar after the change of Publisher.
Peer review under responsibility of King Saud University.
Abstract
Background
The rhizome of Atractylodes chinensis (RAC), also known as “Cangzhu”, is a well-known Chinese herbal medicine (CHMs). Due to the scarcity of wild resources, cultivated RAC and counterfeit products derived from the rhizome of Atractylodes japonica (RAJ) are also prevalent on the market. Diverse origins lead to varying quality. At present, the Chinese Pharmacopoeia (2020 edition) uses atractylodin as the only quantitative index component for RAC, and there is a lack of research on quality markers (Q-markers) that are closely related to efficacy.
Purpose
This work aims to discover the Q-markers of RAC based on chemical and pharmacological strategies.
Methods
The chemical composition of RAC was analyzed and identified through gas chromatography-mass spectrometry (GC–MS). The ″Chromatographic Fingerprint Similarity Evaluation System for Traditional Chinese Medicine″ was utilized to assess the similarity of the samples and identify the characteristic peaks. Network pharmacology was employed to screen targets and pathways for characteristic components of the RAC, construct “active ingredients–targets–pathways” network diagrams, and predict the Q-markers. The Q-markers for RAC were identified through an integrated analysis of the chemical components, network pharmacology, pharmacological activities and clinical applications. In addition, a preliminary evaluation of 28 batches of “Cangzhu” from different origins were conducted by GC–MS and chemical pattern recognition.
Results
A total of 16 specific components of RAC were identified by GC–MS fingerprint. The network pharmacology study found that these 16 components primarily function through 29 core targets and 23 pathways. Three compounds, hinesol, atractylon, and β-eudesmol were identified as the potential Q-markers for RAC. The evaluation of 28 batches of “Cangzhu” showed that these three Q-markers could effectively distinguish RAC from RAJ, and RAJ could not be used as a substitute for RAC. There was no significant difference between cultivated RAC and wild RAC, and the quality of cultivated RAC was more uniform than wild RAC.
Conclusion
This study identified and verified three potential Q-markers for RAC by using a comprehensive strategy combing of “GC–MS fingerprinting – network pharmacology – chemical pattern recognition”. It provides a basis for the establishment of a more reasonable RAC quality evaluation system. Furthermore, it provides a reference for the discovery of Q-markers in other CHMs.
Keywords
Atractylodes chinensis
Quality markers
Fingerprint
Network pharmacology

1 Introduction
Chinese herbal medicines (CHMs) have been used in clinical practice for thousands of years in China (Liu et al., 2018). Due to the remarkable efficacy, CHMs have received extensive attention worldwide (Liu et al., 2022; Wang et al., 2018). Quality is the basis to ensure the safety and effectiveness of CHMs. However, it is challenging to control the quality as the chemical composition of CHMs is complex and susceptible to multiple factors, including the growth environment, harvesting, processing, storage and so on (Zhang et al., 2018, Ren et al., 2020).
The modernization and globalization of traditional Chinese medicine (TCM) necessitate the establishment of quality control based on standardization. In recent decades, with the unremitting efforts of Chinese scholars, some quality control method for CHMs have been established, such as quantitative analysis of components based on chromatograph (Zheng et al., 2021, Ren et al., 2022). Researchers often choose one or several chemical components as the index to determine the contents, so as to evaluate the quality of CHMs (Langer et al., 2018, Zhang et al., 2018). However, these methods only focus on the chemical properties of CHMs and disregard the pharmacological activity and clinical efficacy. Therefore, it is urgent to establish a more reasonable quality control system for CHMs, which is closely related to the efficacy.
In this case, the Chinese scholar Changxiao Liu proposed the concept of “quality markers” (Q-markers), which opened up a new promising research avenue for the quality evaluation of CHMs (Liu et al., 2016). Q-Marker is an integrated and open concept, which is associated with effectiveness and safety, has source traceability and industrial process transferability, can cover and integrate various quality control indicators and methods, and has the characteristics of integrity and multi-faceted (Yang et al., 2021, Lu et al., 2022, Wang et al., 2023). The research of Q-markers should be based on the “five principles” of specificity, measurability, effectiveness, transmissibility and theoretical relevance of TCM (Zhang et al., 2018, Zhang et al., 2022). At present, the most common strategy for identifying Q-markers is to combine chemical composition analysis with pharmacological studies (Luo et al., 2019, Li et al., 2022, Ma et al., 2023). The Q-markers are not only specific and measurable, but they also reflect a close relationship with effectiveness. In recent years, based on this idea, researchers have carried out Q-markers screening and quality evaluation for some CHMs, such as Raspberry (Zhou et al., 2021) and Corni Fructus (Wang et al., 2022).
The rhizome of Atractylodes chinensis (RAC), also known as “Cangzhu”, is a well-known CHM in China for treating digestive system diseases, rheumatic diseases, and influenza (Zhang et al., 2021). RAC is rich in a variety of active compounds, such as atractylon, atractylodin, hinesol, and β-eudesmol (Sun et al., 2022). In recent years, due to the continuous reduction of wild resources and the increasing demand, many regions began to develop cultivated RAC (Zhu et al., 2020). In some regions, the rhizome of A. japonica (RAJ), referred to as ″Guan Cangzhu″, is used as a substitute for RAC, which is similar in appearance to RAC and lower in price (Li et al., 2022, Fei et al., 2023), as shown in Fig. 1. These “Cangzhu” from different growth modes, different producing areas and different species origins have great differences in chemical composition and uneven quality. However, the Chinese Pharmacopoeia (2020 edition) only uses atractylodin as the sole quantitative index of RAC, and there is a lack of Q-markers research that is closely related to effectiveness. Moreover, studies have found that the content of atractylodin in “Nan Cangzhu”, which has been considered to be the genuine medicinal material of “Cangzhu” and be of superior quality since ancient times, is relatively low, often fails to meet the standards of pharmacopoeia(Liu et al., 2021, 2022; Zhu et al., 2017). This indicates that it is unreasonable to use atractylodin as an indicator. Therefore, it is crucial to discover Q-markers and develop a more reasonable quality evaluation methods for RAC.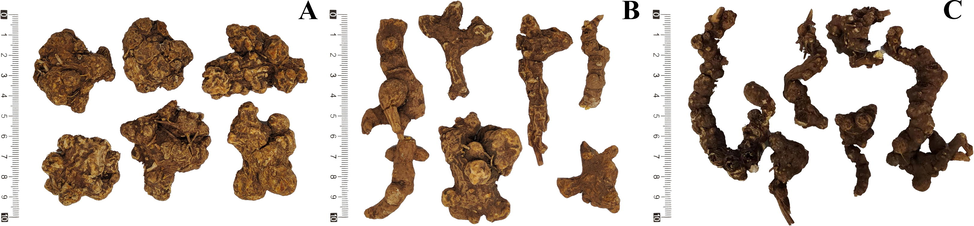
Samples of the rhizome of Atractylodes chinensis (RAC) and Atractylodes japonica (RAJ). (A) Cultivated RAC (Hebei, China). (B) Wild RAC (Inner Monggol, China). (C) Wild RAJ (Heilongjiang, China).
Considering the principal active components in RAC are polyacetylenes and sesquiterpenes (Xu et al., 2022, Lei et al., 2023, Song et al., 2023), and gas chromatography (GC) has a higher sensitivity for these two types of components than high performance liquid chromatography (HPLC). Therefore, in this study, a comprehensive strategy combining GC–MS fingerprint, network pharmacology and literature analysis was used to identify Q-markers of RAC for the first time. In addition, using the selected Q-markers as index, the quality of 28 batches of “Cangzhu”, including 7 batches of wild RAC, 11 batches of cultivated RAC and 10 batches of RAJ, were evaluated by GC–MS technique, cluster analysis (HCA), principal component analysis (PCA) and one-way analysis of variance (ANOVA). This study not only discovered the Q-markers, but also evaluated the resources of RAC, and verified the feasibility of Q-markers for quality control. Our research can lay a foundation for establishing a more reasonable quality evaluation system for “Cangzhu”, and can also be used as a reference for the study of Q-markers of other CHMs.
2 Materials and methods
2.1 Plant material, chemicals, and reagents
Table 1 provides information on the 28 batches of RAC and 10 batches of RAJ collected from various origins. All samples were identified by Fei Long, an associate professor at the State Key Laboratory of Southwestern Chinese Medicine Resources (Chengdu University of TCM). Voucher specimens were deposited in the pharmacy building of the Chengdu University of Traditional Chinese Medicine. Hexane (lot 211164) was manufactured by Thermo Fisher Scientific (China) Co., Ltd. (Shanghai, China). Other reagents were of various analytical grades.
Sample ID
Species
Growth mode
Place of origin
Batch number
RAC01
A. chinensis (DC.) Koidz.
unknown
Medicinal market, China
2021B001
RAC02
A. chinensis (DC.) Koidz.
unknown
Medicinal market, China
2021B002
RAC03
A. chinensis (DC.) Koidz.
unknown
Medicinal market, China
2021B003
RAC04
A. chinensis (DC.) Koidz.
unknown
Medicinal market, China
2021B004
RAC05
A. chinensis (DC.) Koidz.
unknown
Medicinal market, China
2021B005
RAC06
A. chinensis (DC.) Koidz.
unknown
Medicinal market, China
2021B006
RAC07
A. chinensis (DC.) Koidz.
unknown
Medicinal market, China
2021B007
RAC08
A. chinensis (DC.) Koidz.
unknown
Medicinal market, China
2021B008
RAC09
A. chinensis (DC.) Koidz.
unknown
Medicinal market, China
2021B009
RAC10
A. chinensis (DC.) Koidz.
unknown
Medicinal market, China
2021B010
RAC11
A. chinensis (DC.) Koidz.
cultivated
Hebei, China
2021B011
RAC12
A. chinensis (DC.) Koidz.
cultivated
Hebei, China
2021B012
RAC13
A. chinensis (DC.) Koidz.
cultivated
Hebei, China
2021B013
RAC14
A. chinensis (DC.) Koidz.
cultivated
Inner Monggol, China
2021B014
RAC15
A. chinensis (DC.) Koidz.
cultivated
Inner Monggol, China
2021B015
RAC16
A. chinensis (DC.) Koidz.
cultivated
Inner Monggol, China
2021B016
RAC17
A. chinensis (DC.) Koidz.
cultivated
Inner Monggol, China
2021B017
RAC18
A. chinensis (DC.) Koidz.
cultivated
Inner Monggol, China
2021B018
RAC19
A. chinensis (DC.) Koidz.
cultivated
Inner Monggol, China
2021B019
RAC20
A. chinensis (DC.) Koidz.
cultivated
Inner Monggol, China
2021B020
RAC21
A. chinensis (DC.) Koidz.
cultivated
Inner Monggol, China
2021B021
RAC22
A. chinensis (DC.) Koidz.
wild
Hebei, China
2021B022
RAC23
A. chinensis (DC.) Koidz.
wild
Hebei, China
2021B023
RAC24
A. chinensis (DC.) Koidz.
wild
Hebei, China
2021B024
RAC25
A. chinensis (DC.) Koidz.
wild
Hebei, China
2021B025
RAC26
A. chinensis (DC.) Koidz.
wild
Hebei, China
2021B026
RAC27
A. chinensis (DC.) Koidz.
wild
Hebei, China
2021B027
RAC28
A. chinensis (DC.) Koidz.
wild
Liaoning, China
2021B028
RAJ01
A. japonica Koidz. ex Kitam.
wild
Heilongjiang, China
2021G001
RAJ02
A. japonica Koidz. ex Kitam.
wild
Heilongjiang, China
2021G002
RAJ03
A. japonica Koidz. ex Kitam.
wild
Heilongjiang, China
2021G003
RAJ04
A. japonica Koidz. ex Kitam.
wild
Heilongjiang, China
2021G004
RAJ05
A. japonica Koidz. ex Kitam.
wild
Jilin, China
2021G005
RAJ06
A. japonica Koidz. ex Kitam.
wild
Jilin, China
2021G006
RAJ07
A. japonica Koidz. ex Kitam.
wild
Liaoning, China
2021G007
RAJ08
A. japonica Koidz. ex Kitam.
wild
Liaoning, China
2021G008
RAJ09
A. japonica Koidz. ex Kitam.
wild
Liaoning, China
2021G009
RAJ10
A. japonica Koidz. ex Kitam.
wild
Inner Monggol, China
2021G010
2.2 Fingerprint and chemical composition analysis
2.2.1 Test conditions for GC–MS
The analysis was carried out using a gas chromatography–mass spectrometry system (GC–MS 7890A-5975C, Agilent, Santa Clara, CA, USA) and the NIST14.L mass spectrometry search database. The chromatographic column was HP-5 MS (Agilent, Santa Clara, CA, USA, 30 m × 0.25 mm × 0.25 µm) with the following parameters: injection port temperature of 280 °C; the carrier gas was high purity helium (He); injection volume of 1 μL; the split ratio of 10:1 (v:v); flow rate of 1 mL·min−1; programmed ramp-up: initial temperature of 100 °C; ramp-up to 135 °C at 10 °C·min−1; and ramp-up to 250 °C at 0.5 °C·min−1. An electron ionization (EI) source was used with an ionization energy of 70 eV, an ion source temperature of 230 °C, a quadrupole temperature of 150 °C, full wavelength scanning, and a solvent delay period of 3 min.
2.2.2 Preparation of samples
All samples were ground to powder and screened with a 50-mesh sieve. Then, 1.00 g of RAC powder was suspended in a cone bottle with 5 mL of n-hexane solution. The sample solution was obtained after ultrasonic extraction for 30 min. After making up the lost weight with n-hexane, the solution was filtered through a 0.22 μm microporous membrane.
2.2.3 Methodological validation
The developed GC–MS method for qualitative analysis of RAC was validated in terms of precision, stability, and repeatability under the optimized conditions described above. Six consecutive injections of a sample solution were performed to verify the accuracy. Six independent replicates of the same sample solution were prepared to measure repeatability. Stability was determined by testing the same sample solutions under the same conditions at 0, 2, 4, 6, 12, and 24 h. The RSD values of the RPA and RRT of the common peaks were calculated for each test.
2.2.4 Data analysis
The RAC fingerprint was established by GC. Combining the reference substance and the GC–MS NIST14.L database, the common peaks with large peak areas and good resolution in the fingerprint were identified, and the characteristic spectrum of RAC was determined. The “Chromatographic Fingerprint Similarity Evaluation System for Traditional Chinese Medicine” (2012 version) was used to evaluate the similarity of the GC fingerprint of RAC to determine its overall quality. The software SIMCA-P 14.1 (Umetrics, Umeå, Sweden) was used to perform HCA, PCA, and OPLS-DA. SPSS 26.0 (SPSS Inc., Chicago, IL, USA) was used to calculate the variance and correlation analysis. The bioinformatics online website (https://www.bioinformatics.com.cn/) was used to create the box diagram.
2.3 Network pharmacology analysis
2.3.1 Screening of RAC targets
The Canonical SMILES format of compounds in RAC was searched in the PubChem database (https://pubchem.ncbi.nlm.nih.gov/), and imported to the Swiss Target Prediction (https://www.swisstargetprediction.ch/), to predict potential targets for the compound. Remove duplicates and targets with a “Probability” of “0” and construct compounds–targets network diagram using Cytoscape 3.9.0 software.
2.3.2 Construction of PPI network
The protein–protein interaction (PPI) network plays a key role in predicting the function of target proteins and the drug ability of molecules, which handle a wide range of biological processes, including cell-to-cell interactions and metabolic and developmental control. The STRING database (https://cn.string-db.org/) was used to analyze the interaction between each target using default parameters, with species selection “Homo sapiens” and the “minimum required interaction score” ≥ 0.700. Remove unrelated independent targets from the PPI network. The PPI network was analyzed using Cytoscape’s built-in plug-in, and targets above mean degree centrality (DC), betweenness centrality (BC), and closeness centrality (CC) were selected as core targets. These are the primary targets for the chemical components in RAC to exert their pharmacological effects. DC is equal to the number of links to a node and reflects how often a node interacts with others. BC represents the number of shortest paths through a given node. The higher the BC value, the more powerful the node is at controlling other nodes in a network. CC represents the average shortest path from one node to all other nodes. The higher the CC of a node, the easier it is for other nodes to reach it and for it to reach out to other nodes.
2.3.3 KEGG pathway enrichment analysis
The Kyoto Encyclopedia of Genes and Genomes (KEGG) pathway enrichment analysis was used to identify key genes and pathways involved in RAC. The DAVID 6.8 database (https://david.ncifcrf.gov/) was used for KEGG pathway enrichment analysis of RAC targets, and p ≤ 0.05 was used as the screening criterion. Meanwhile, fold enrichment was introduced to demonstrate the significance of the pathway. The greater the fold enrichment, the greater the gene enrichment. Finally, the pathways were visualized using an online bioinformatics website.
2.3.4 Compounds–targets–pathways network
The “active ingredients–targets–pathways” network was constructed using the Cytoscape 3.9.0 software. Nodes in the network represent components, core targets, or core pathways, and edges represent interactions between them. Moreover, the network was analyzed using three thresholds, CC, BC, and CC, to screen the components, targets, and pathways that contributed most to the network.
3 Results and discussion
3.1 Analysis of chemical components
CHMs are characterized by multiple species and growing regions, resulting in the composition of different samples to vary. Chromatographic fingerprint can provide an overall view of all components in CHMs and demonstrate both “similarities” and “differences” between samples (Song et al., 2023). Polyacetylenes and sesquiterpenes are the primary active components in RAC (Ouyang et al., 2012), and GC reacts more strongly to these two components than HPLC does. Therefore, in this study, GC fingerprinting was used to analyze 10 batches of RAC collected from Chinese medicinal markets, and the common components were obtained as Q-markers candidate compounds.
3.1.1 Establishment of the GC fingerprint of RAC
The GC fingerprints of the 10 batch samples are shown in Fig. 2. The similarity analysis results were obtained by importing the chromatogram data into the “Chinese Medicine Chromatographic Fingerprint Similarity Evaluation System ”. The fingerprint contained 20 characteristic peaks that were used to calculate the similarity indices. The similarity analysis results in Table S1 showed that the similarity was greater than 0.923, indicating that each sample had a good consistency and stable quality. By comparing the mass spectra obtained from the analyses with those from NIST14.L, reference standards, and published reports, we were able to identify 16 of the 20 common ingredients (Table 2). As shown in Table S2, the relative percentage content of 16 chemical components in batches of RAC exceeded 70% (70.98%–89.96%). These 16 components were considered potential Q-markers and were used in the subsequent analysis.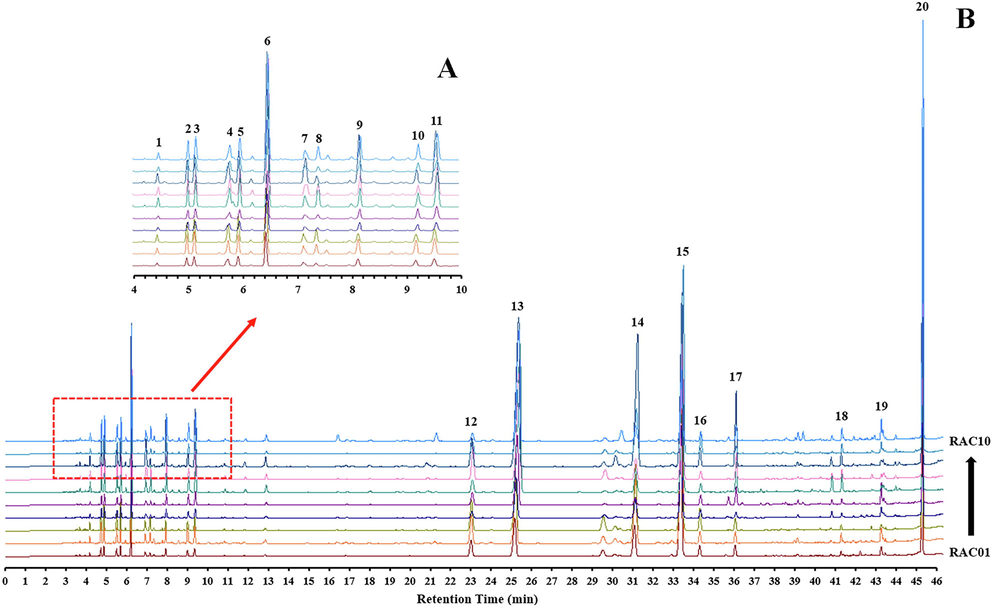
GC chromatographic fingerprint of 10 batches of the rhizome of Atractylodes chinensis (RAC). (A) Local magnification of retention time of 4–10 min in GC fingerprint, a total of 9 common peaks in this interval. (B) The GC global fingerprint, a total of 9 common peaks were labeled in retention time intervals of 24 to 46 min. Detailed information on the common compounds is shown in Table 2.
Peak NO.
Compound Name
Retention time (min)
Molecular formula
Relative amount (%)
1
α-guaiene
4.50
C15H24
0.18 ± 0.04
2
modhephene
5.02
C15H24
0.54 ± 0.10
3
berkheyaradulene
5.17
C15H24
0.63 ± 0.12
4
longifolene-(V4)
5.79
C15H24
0.69 ± 0.16
5
caryophyllene
5.97
C15H24
0.70 ± 0.17
6
γ-elemene
6.48
C15H24
3.10 ± 0.97
7
humulene
7.17
C15H24
0.52 ± 0.17
8
γ-curcumene
7.41
C15H24
0.35 ± 0.20
9
β-selinene
8.17
C15H24
0.80 ± 0.27
10
β-sesquiphellandrene
9.23
C15H24
0.60 ± 0.16
11
valencene
9.57
C15H24
1.06 ± 0.41
12
elemol
23.05
C15H26O
1.88 ± 1.10
13
atractylon
25.34
C15H20O
12.63 ± 4.89
14
hinesol
31.07
C15H20O
4.79 ± 3.65
15
β-eudesmol
33.55
C15H26O
16.12 ± 11.32
16
unknown
34.20
–
0.94 ± 0.46
17
unknown
35.89
–
1.36 ± 1.07
18
unknown
41.04
–
0.64 ± 0.43
19
unknown
43.18
–
0.52 ± 0.42
20
atractylodin
44.96
C15H26O
17.18 ± 6.98
3.1.2 Validation of the GC fingerprint method
For the precision study, the relative retention time (RRT) and relative peak area (RPA) of peak 20 (atractylodin) were chosen as the reference, and the RRT and RPA of the 20 common peaks of each sample were calculated. The relative standard deviation (RSD) of the RPA of each common peak were < 5.00%, and the RRT of each common peak was < 0.30% (Table 3). In the repeatability test, the RSD of RPA for each peak were < 5.00%, and the RSD of RRT were < 0.20%. For the stability test, the sample solution was measured at 0, 2, 4, 6, 12, and 24 h after preparation, and then the RRT and RPA were calculated. The RSD of RRT was < 0.40%. The RSD of RPA was < 5.00%. The above results indicate that the precision and repeatability of the GC method were satisfactory. Additionally, the RAC sample solution was stable within 24 h.
Peak NO.
Precision
Repeatability
Stability
RRT
RSD (%)
RPA
RSD (%)
RRT
RSD (%)
RPA
RSD (%)
RRT
RSD (%)
RPA
RSD (%)
1
0.100
0.00
0.027
1.48
0.100
0.00
0.025
3.64
0.100
0.28
0.028
2.93
2
0.112
0.00
0.073
0.54
0.112
0.00
0.067
4.10
0.112
0.36
0.075
2.20
3
0.115
0.00
0.079
1.17
0.115
0.11
0.074
4.66
0.115
0.28
0.081
2.22
4
0.129
0.00
0.095
0.44
0.129
0.10
0.091
4.48
0.129
0.35
0.099
2.69
5
0.133
0.01
0.084
0.85
0.133
0.00
0.078
4.01
0.133
0.30
0.086
2.98
6
0.145
0.08
0.367
0.64
0.144
0.06
0.346
3.23
0.145
0.34
0.375
3.14
7
0.161
0.00
0.096
1.03
0.160
0.07
0.088
1.52
0.161
0.33
0.098
3.67
8
0.165
0.00
0.020
2.09
0.165
0.06
0.019
1.83
0.165
0.33
0.020
2.24
9
0.183
0.25
0.256
0.61
0.182
0.05
0.231
2.38
0.182
0.34
0.259
2.68
10
0.206
0.00
0.072
3.34
0.206
0.06
0.069
3.65
0.206
0.34
0.074
3.00
11
0.214
0.00
0.239
0.82
0.213
0.04
0.223
4.91
0.214
0.32
0.244
3.13
12
0.513
0.02
0.038
1.31
0.512
0.05
0.038
2.30
0.513
0.20
0.039
4.52
13
0.564
0.02
2.727
0.72
0.563
0.05
2.600
3.88
0.564
0.21
2.781
2.94
14
0.689
0.01
0.103
1.93
0.689
0.03
0.097
4.27
0.689
0.14
0.106
2.91
15
0.739
0.02
0.435
0.69
0.738
0.03
0.421
3.09
0.738
0.10
0.446
3.11
16
0.760
0.01
0.039
1.23
0.760
0.02
0.038
3.50
0.760
0.06
0.039
2.91
17
0.799
0.02
0.420
0.51
0.798
0.02
0.418
3.45
0.799
0.06
0.429
3.28
18
0.913
0.00
0.066
1.48
0.913
0.01
0.057
2.47
0.913
0.03
0.067
1.56
19
0.958
0.01
0.024
4.85
0.958
0.02
0.026
3.83
0.958
0.01
0.024
4.99
20
1.000
0.00
1.000
0.00
1.000
0.00
1.000
0.00
1.000
0.00
1.000
0.00
3.2 Network pharmacology
3.2.1 Target network analysis of RAC
A total of 135 targets of 16 constituents (Table S3) were obtained in Swiss Target Prediction. Based on these data, the ingredients–targets network was constructed, as shown in Fig. 3A. The network had 150 nodes and 268 interactions, indicating that RAC exerted pharmacological effects via multiple components and targets. In particular, the number of gene targets corresponding to atractylon, hinesol, β-eudesmol, elemol, atractylodin, and valencene were 54, 53, 29, 26, 25, and 17, respectively, indicating that the above components are closely related to the pharmacological activity of RAC.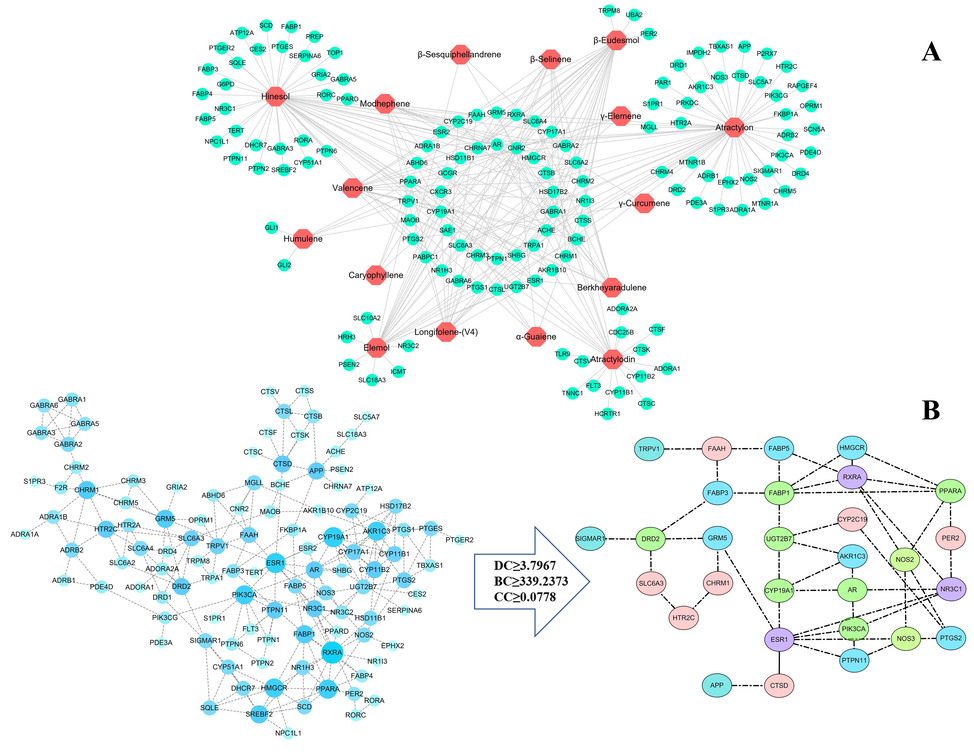
Target network analysis of the rhizome of Atractylodes chinensis (RAC). (A) “Ingredients–targets” network consisting of 16 components in RAC and 135 targets. (The hexagon is the ingredient and the circle is the target.) (B) PPI network and interaction diagram of core targets. The PPI network consisting of 135 targets was further analyzed and 29 core targets were identified based on the thresholds of DC ≥ 3.80, BC ≥ 339.24, and CC ≥ 0.08. (The size and color were correlated to the degrees of targets in network: the big size and deep color with blue means high degree of this target.).
The PPI network was created using the STRING database to analyze the potential relationship between 135 targets. After removing an unconnected node, the PPI network contained 135 nodes and 224 edges, with an average node degree of 3.32 and an average local clustering coefficient of 0.528, p < 1.0 × 10⁻¹⁶. Based on the threshold values for DC ≥ 3.80, BC ≥ 339.24, and CC ≥ 0.08, 29 core targets were identified (Fig. 3B). The above targets are critical for RAC to exert pharmacological effects. At the same time, the targets were found to interact with each other, indicating that RAC exerts its drug effect through the synergistic effect of multiple targets.
3.2.2 Pathway enrichment and components–targets–pathways network analysis
To further elucidate the mechanism and efficacy of RAC, we analyzed 29 key target genes interacting with the KEGG pathway using the data extracted from the DAVID database. There were 23 pathways with p < 0.05, as shown in Fig. 4A. These pathways can be divided into five broad categories: cellular processes, metabolism, environmental information processing, organismal systems, and human diseases. Metabolism includes steroid hormone biosynthesis and arachidonic acid metabolism. Environmental information processing includes neuroactive ligand-receptor interaction and calcium signaling, VEGF signaling, and cAMP signaling pathways. Organismal systems include the PPAR signaling pathway, serotonergic synapse, estrogen signaling pathway, ovarian steroidogenesis, adipocytokine signaling pathway, bile secretion, inflammatory mediator regulation of TRP channels, and C-type lectin receptor signaling pathway. In addition, pathway enrichment analysis shows that RAC is closely related to human diseases including insulin resistance, diabetic cardiomyopathy, Alzheimer’s disease, and cancer.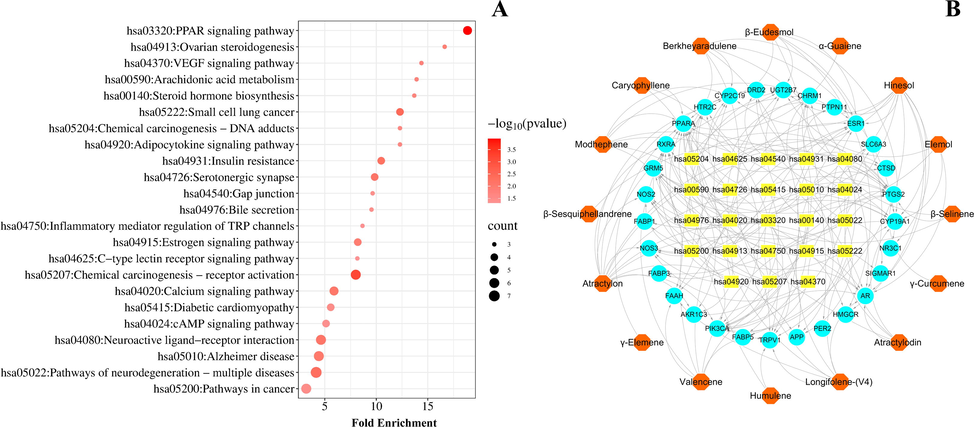
Network pharmacology diagrams of RAC: (A) Kyoto Encyclopedia of Genes and Genomes (KEGG) pathway analysis involved in 29 core targets. (The bubble size represents the number of enriched genes in the pathway, and the larger the bubble, the more enriched genes there are; the color of the bubble represents the significance of enrichment, i.e., p-value, and the darker the color, the more significant the enrichment of the pathway.) (B) Active components–targets–pathways network consisting of 16 components, 29 core targets and 23 pathways. (The hexagon is the active ingredient, the circle is the target, and the rectangle is the pathway.).
A comprehensive “components-targets-pathways” network was built by entering 16 components, 29 core targets, and 23 pathways into Cytoscape to investigate the relationship between active components and pathways in RAC. As shown in Fig. 4B, the network diagram consisted of 68 nodes and 177 edges, indicating the intricate correlations between different compounds and targets. Based on the threshold values of DC ≥ 5.13, BC ≥ 143.52, and CC ≥ 0.35, atractylon (DC = 14.00, BC = 803.79, and CC = 0.45), hinesol (DC = 12.00, BC = 614.95, and CC = 0.42), and β-eudesmol (DC = 7.00, BC = 199.83, and CC = 0.35) as the primary bioactive ingredients in RAC, thereby designating them as candidate Q-markers. These ingredients act principally on PPARA, PIK3CA, PTGS2, CYP19A1, AR, ESR1, CYP2C19, and RXRA, affecting primary pathways such as neurogenesis, cancer, calcium signaling, and PPAR signaling pathways.
According to the above research, the candidate Q-marker screened by network pharmacology does not include atractylodin, which is the only index component recorded in Chinese pharmacopoeia for quantitative detection. Numerous studies have demonstrated that atractylodin is unsuitable for use as a test index (Liu et al., 2022; Zhao et al., 2022). The rhizome of A. lancea, which traditionally believed to be of superior quality, is deficient in atractylodin, rendering it inadequate for meeting the standards of pharmacopoeia. Conversely, the rhizome of A. chinensis considered to be of inferior quality, often contains more atractylodin (Zhang et al., 2010, Chen et al., 2013). The present study also established that the quality of Cangzhu was not highly correlated with atractylodin.
3.3 Pharmacological effects of potential Q-markers
Using fingerprint analysis and target network pharmacology, three compounds were identified as potential Q-markers in RAC, including atractylon, β-eudesmol and hinesol. These sesquiterpenoids are the main composition of RAC, which is consistent with previous studies (Takeda et al., 1996, Tsusaka et al., 2019), with relatively high content and significant pharmacological activity.
Atractylon, a eucalyptane-type sesquiterpene with anti-inflammatory, antinociceptive, antiviral and neuroprotective activities. It has been reported that atractylon can significantly inhibit NO and PGE2 production as well as the expression of inducible NO synthase and cyclooxygenase-2 in lipopolysaccharide-induced RAW 264.7 cells. Furthermore, atractylon (40 mg/kg) significantly reduced the acetic-acid–induced writhing response, carrageenan-induced paw edema, and hot-plate latent pain response in mice (Chen et al., 2016). Moreover, atractylon have demonstrated significant antiviral activity by attenuating lung injury caused by influenza A virus (IAV) and regulating the TLR7 signaling pathway, as well as decreased serum IL-6, TNF-α, and IL-1β levels and increased IFN-β levels (Cheng et al., 2016). Besides, it has been shown to activate DRD2, attenuate motor deficits and gait disturbances, as well as protected dopaminergic neurons in Parkinson's disease mice (Li et al., 2022). This demonstrates the potential of atractylon as a neuroprotective agent.
β-Eudesmol is a well-studied component of RAC. Both in vitro and in vivo studies have shown that β-eudesmol has potent anti-angiogenic effect (Tsuneki et al., 2005). Studies have shown that β-eudesmol can significantly downregulate the expression of VEGFA and its receptor VEGFR2 in a concentration-dependent manner, thereby exerting its anti-angiogenic effects (Tshering et al., 2021). Moreover, β-eudesmol has certain anti-allergic and anti-inflammatory properties. β-Eudesmol inhibited the production and expression of IL-6 and suppressed the activation of p38 MAPKs and NF-κB in mast cell-mediated inflammation (Seo et al., 2011). In other studies, β-eudesmol was found to significantly inhibit mast cell migration and reduce F-actin formation in a concentration-dependent manner (Nam et al., 2017). These findings indicate that β-eudesmol exerts anti-allergic inflammatory effects by inhibiting mast cell migration and the production of inflammatory cytokines. Moreover, it was demonstrated that β-eudesmol has a bidirectional effect on gastrointestinal motility. It can inhibit neostigmine–induced gastrointestinal hyperactivity in mice. In addition, it can increase the body weight and improve the signs of spleen deficiency mice, thereby inhibiting the gastrointestinal motility of spleen deficient mice, counteracts diarrhea and stabilizes their gastrointestinal motility (Wang et al., 2002).
Hinesol is a unique sesquiterpene component of ″Cangzhu″. Kanako Satoh et al. have concluded that hinesol is a relatively specific inhibitor of H+, K+-ATPase. It was found that hinesol could react with enzymes in the E1 state in the presence of ATP and Mg2+ and forms the complex hinesol-H+ · E1-ATP or hinesol · E1-P, blocking the conformational change to the E2 state. In addition, hinesol enhanced the inhibitory effect of omeprazole on H+, K+-ATPase (Satoh et al., 2000). Therefore, it was inferred that the anti-gastric ulcer effect of ″Cangzhu″ may be attributed to the inhibitory effect of hinesol on H+, K+-ATPase activity. Hinesol also exhibited selective and potent antitrypsin activity and cytotoxicity (Otoguro et al., 2011), which were responsible for its anthelmintic activity.
In summary, atractylon, β-eudesmol and hinesol exhibit a range of pharmacological activities, including regulation of gastrointestinal motility, anti-gastric ulcer, anti-inflammatory, anthelmintic, anti-allergic, anti-viral, antinociceptive and neuroprotective effects, which are closely related to the traditional efficacy of RAC in the treatment of gastrointestinal diseases, colds and rheumatic diseases. In addition, all three potential Q-markers in RAC have been reported to possess antitumor effects. Atractylon has mayinduce apoptosis in glioblastoma and hepatocellular carcinoma cells (Cheng et al., 2019, Sun et al., 2022). Hinesol can induce cell cycle arrest and apoptosis in human lung cancer A549 cells (Guo et al., 2019). β-Eudesmol induces tumor cells apoptosis via the mitochondrial apoptotic pathway in human leukemia HL60 cells (Li et al., 2013). These findings indicate that atractylon, hinesol and β-eudesmol may be potential candidates for the treatment of cancer. This opens up a new avenue for the study of active ingredients in RAC.
3.4 RAC resource evaluation analysis
Through previous research, we have identified three ingredients with a high correlation with RAC efficiency as potential Q-markers. To determine whether the Q-markers we screened were effective in quality evaluation of RAC and distinguish between genuine and counterfeit herbs, we analyzed the chemical composition of 18 batches of RAC and 10 batches of RAJ from various origins. Evaluation of RAC resources attempted to use the relative percentages of the three components.
The results of the relative content determination are shown in Table 4. The atractylon concentration in RAC ranged from 2.64 to 11.50%; the hinesol concentration ranged from 0.73 to 4.71%; and the β-eudesmol concentration ranged from 3.20 to 12.22%. In RAJ, the atractylon concentration ranged from 14.86 to 30.55%; the hinesol concentration ranged from 0.03 to 4.27%; and the β-eudesmol concentration ranged from 0.76 to 4.55%. It is noteworthy that the composition of index components in different batches of samples varied significantly. Therefore, we further used HCA and PCA to classify them.
Sample ID
Group
Relative percentage content (%)
Average relative contents (%)
atractylon
hinesol
β-eudesmol
atractylon
hinesol
β-eudesmol
RAC11
cultivated-RAC
4.45
2.64
11.33
6.89 ± 2.82
2.51 ± 0.95
8.64 ± 1.93
RAC12
6.45
3.89
10.01
RAC13
4.05
2.19
6.01
RAC14
6.19
2.30
9.69
RAC15
11.50
1.84
7.99
RAC16
6.06
1.03
5.55
RAC17
6.69
1.95
9.38
RAC18
11.47
2.70
9.52
RAC19
2.64
4.12
10.07
RAC20
7.53
1.68
6.12
RAC21
8.71
3.30
9.36
RAC22
wild-RAC
4.83
4.43
12.22
5.97 ± 1.91
2.46 ± 1.63
7.10 ± 3.28
RAC23
5.47
0.82
7.35
RAC24
3.21
1.88
3.76
RAC25
7.48
2.98
5.79
RAC26
9.19
0.73
7.05
RAC27
5.79
1.66
3.20
RAC28
5.85
4.71
10.30
RAJ01
RAJ
25.70
1.60
2.39
22.17 ± 5.87
1.60 ± 1.19
2.45 ± 1.12
RAJ02
29.83
0.92
1.49
RAJ03
18.01
2.03
3.18
RAJ04
30.55
0.03
1.70
RAJ05
28.69
1.72
2.85
RAJ06
17.21
4.27
4.55
RAJ07
18.89
1.40
2.08
RAJ08
14.86
2.54
3.62
RAJ09
19.07
1.12
1.84
RAJ10
18.90
0.40
0.76
3.4.1 HCA and PCA analysis
HCA, also known as unsupervised learning or exploratory data analysis, deconstructs a limited data set into a finite, discrete set of “natural” hidden data structures (Cao et al., 2019). In this study, HCA was performed on 18 batches of RAC and 10 batches of RAJ using SIMCA software and RPA of three components as variables. Based on the results of cluster analysis displayed in Fig. 5A. It can be concluded that all samples can be roughly divided into two categories, with RAJs comprising cluster I and wild and cultivated RACs comprising cluster II.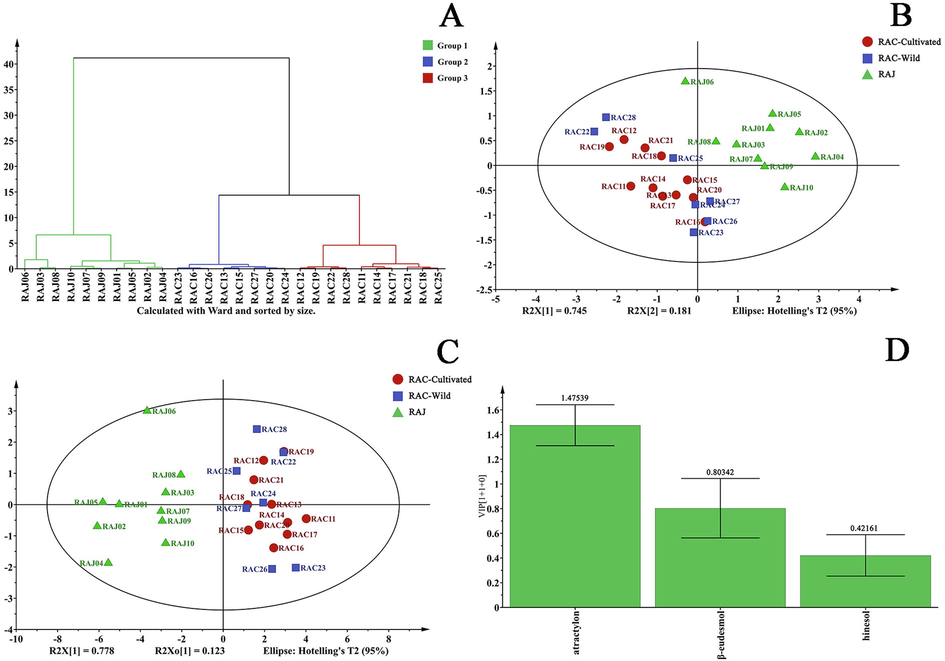
Chemometrics analysis of the rhizome of Atractylodes chinensis (RAC) samples. (A) Hierarchical cluster analysis (HCA). All samples can be roughly divided into two categories, with RAJs comprising cluster I and wild and cultivated RACs comprising cluster II. (B) Principal component analysis (PCA). (C) Orthogonal partial least squares–discriminant analysis (OPLS-DA). (D) Variable importance of the projection (VIP) values. The VIP values of atractylon, β-eudesmol, and hinesol were 1.48, 0.80, and 0.42, respectively.
Through data analysis and visualization, PCA can reduce data by geometrically projecting it onto smaller dimensions known as principal components (PCs) (Tan et al., 2020). The goal is to find the best summary of date using a small number of PCs. To evaluate and distinguish RAJ and RAC with two different growth patterns, we used PCA analysis with standard data consisting of three components. The PCA′s two-dimensional score plot is shown in Fig. 5B. The first two PCs accounted for 74.50% and 18.10% of the variance, respectively. The tasted samples were divided into two groups, which are similar to the HCA results. Orthogonal partial least squares–discriminant analysis (OPLS-DA) is a supervised discriminant analysis statistical method, which is different from the PAC method. In the model, the first two components described 100.0% of the variation in X (R2X = 1.000) and 87.6% of the variation in Y (R2Y = 0.876); Q2 was 0.837. These results demonstrate the appropriateness of the model. The OPLS-DA analysis yielded the same results as the PCA analysis (Fig. 5C). Moreover, the separation between the two sample types was more apparent in the OPLS-DA model.
Variable Importance in Projection (VIP) scores estimate the importance of each variable in the projection used in a partial least-squares (PLS) model and are often used for variable selection (Zhou et al., 2022). In a given model, a variable with a VIP score close to or greater than 1 may be considered significant. As shown in Fig. 5D, the VIP values of atractylon, β-eudesmol, and hinesol were 1.48, 0.80, and 0.42, respectively. Thus, atractylon and β-eudesmol were identified as the main substances causing RAC variability from various origins. The results showed that multiple components, rather than a single component, influenced the variability of RAC quality.
The above results show that the three Q-markers can clearly distinguish RAJ and RAC, which is important for identifying RAC and its counterfeit products. However, there is still overlap, which may indicate there is a separation trend between cultivated and wild RAC, but this is not obvious. In addition, we found that the spots representing cultivated RAC is more concentrated, whiles the distribution of the spots of wild RAC is more scattered, suggesting that the quality of artificially grown RAC is more stable. To further differentiate RAC samples with two different growth modes, the contents of components were analyzed using a box diagram and an ANOVA.
3.4.2 Content difference and correlation analysis
The HCA and PCA demonstrated that the 28 batches of “Cangzhu” were divided into two groups, indicating that the three index components from various sources had different compositions. Therefore, ANOVA was used to analyze variations in Q-markers content. In addition, the Pearson correlation (PC) was used to investigate the relationships between the three components of RAC.
Box plot is an analytical method that uses interval scale measurement data. It is mainly used to indicate if the distribution is skewed and if there are outliers in the data set (Williamson et al., 1989). In this study, a two-by-two comparison of wild RAC, cultivated RAC and RAJ was performed by box plots to analyze the differences between RAC and RAJ and the differences between RACs of two different growth patterns. As shown in Fig. 6, the relative percentages of atractylon, hinesol, and β-eudesmol in the RAC in artificial cultivation were 6.89 ± 2.82%, 2.51 ± 0.95%, and 8.64 ± 1.93%, respectively, whereas the relative percentages in the wild RAC were 5.97 ± 1.91%, 2.46 ± 1.63%, and 7.10 ± 3.28%, respectively. In RAJ, the relative percentages of the three ingredients were 22.17 ± 5.87%, 1.60 ± 1.19%, and 2.45 ± 1.12%, respectively. The two components of RAJ, atractylon, and β-eudesmol, differed significantly from RAC. The relative content of atractylon in RAJ was more than twice that of RAC, and the relative content of β-eudesmol was significantly lower than that of RAC, indicating a significant difference in the quality of the two “Cangzhu”. Additionally, the contents of the three components in RAC grown using two different methods were approximately the same, and the statistical results revealed that none of the three components in either of them had significant differences, even though wild RAC is traditionally considered to be of superior quality. Moreover, the box plot and PCA results revealed that the relative contents of the marker components in wild RAC samples varied significantly, especially the contents of hinesol, and β-eudesmol. This could suggest that the quality of wild RAC is more variable, while cultivated RAC is more homogeneous. This maybe because the natural environment of wild RAC is more volatile than the growth environment of cultivated RAC, which is more stable.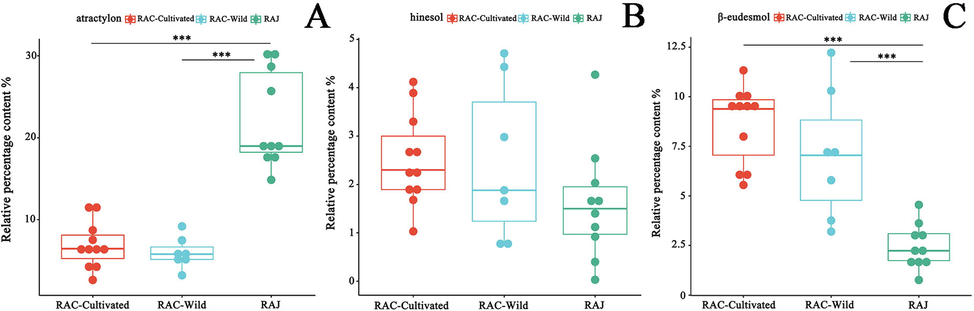
Variation analysis of relative percentage contents in 18 batches of the rhizome of Atractylodes chinensis (RAC) and 10 batches of Atractylodes japonica (RAJ). (A) atractylon. (B) hinesol. (C) β-eudesmol. *** p < 0.001, ** p < 0.01, * p < 0.05, no was considered no significant difference.
Meanwhile, we examined the correlation among three components in 18 batches of RAC. The results are presented in Table 5, which demonstrate a highly significant positive correlation between hinesol and β-eudesmol in RAC, with a PC coefficient of 0.625 (p < 0.01). This finding is congruent with previous research, potentially due to the analogous chemical structures of hinesol and β-eudesmol, both of which possess two alicyclic rings and an isopropyl hydroxyl group, and consequently may have similar biochemical synthesis pathways (Wu et al., 2008). Overall, the RAC volatile oil fractions of hinesol and β-eudesmol manifest a synergistic variability and warrant further investigation. Note: *** p < 0.001, ** p < 0.01, *p < 0.05, no was considered no significant difference.
Components
atractylon
hinesol
β-eudesmol
atractylon
1.000
–
–
hinesol
− 0.220
1.000
–
β-eudesmol
0.038
0.625 **
1.000
4 Conclusion
In this study, a comprehensive strategy combing of “GC–MS fingerprinting – network pharmacology – chemical pattern recognition” was used to identify and verify the Q-markers for RAC volatile oil parts with the first time. Three compounds, atractylon, β-eudesmol and hinesol have been identified as potential Q-markers for RAC. Using these three Q-markers to evaluate the RAC samples of various origins, the results indicated that RAJ could not be used as a substitute for RAC and that the quality of cultivated RAC may be more consistent than that of wild RAC. In addition, we also found a correlation in the content of two components, β-eudesmol and hinesol, in RAC. This study provides valuable information for the quality evaluation of RAC, which can also serve as a reference for the discovery of Q-markers for other CHMs. The pharmacological activity study of the screened Q-markers should be continued to further reveal the coherence between Q-markers and the curative effect of RAC. In addition, due to the diversity of the chemical composition of RAC from different origins, the correlation between the external growth modes, growing environment, growing years and the internal chemical composition will be further studied, so as to provide a basis for the production of excellent quality RAC.
5 Author’s contributions
Wei Wang conducted the analysis of GC–MS and wrote this manuscript. Yuanyuan Jiang and Baohong Song performed the network pharmacology analysis. Hongfei Wu conducted the statistical analysis. Xuemei Tang revise the manuscript and provided valuable feedback to this conception. The corresponding authors, Zhao Jin and Lu Chen conceived and organized this study.
Funding
This article was supported by Sichuan Natural Science Foundation of China, China (no. 23NSFSC6420), the First Batch of Key Projects of TCM Discipline Construction in Sichuan Province: Pharmaceutical Botany, China (no. [2020] 84), “XingLin Scholars” Research Promotion Plan of Chengdu University of TCM (no. QJRC2022017), the Fund of Project of Inheritance Studio of National Famous Experts of State Administration of TCM, China (no. [2019] 41).
Declaration of Competing Interest
The authors declare that they have no known competing financial interests or personal relationships that could have appeared to influence the work reported in this paper.
References
- Comparative investigation for rotten Xylem (kuqin) and strip types (tiaoqin) of Scutellaria baicalensis Georgi based on fingerprinting and chemical pattern recognition. Molecules. 2019;24:2431.
- [CrossRef] [Google Scholar]
- Anti-inflammatory and antinociceptive constituents of Atractylodes japonica Koidzumi. J. Agric. Food Chem.. 2016;64:2254-2262.
- [CrossRef] [Google Scholar]
- Study on the fingerprints of Atractylodes lancea from different habitats and the determination of Atractylodin by HPLC. Chinese J. Experimental Trad. Med. Formulae. 2013;19:125-127.
- [Google Scholar]
- Antiviral activities of atractylon from Atractylodis Rhizoma. Mol. Med. Rep.. 2016;14:3704-3710.
- [CrossRef] [Google Scholar]
- Atractylon induces apoptosis and suppresses metastasis in hepatic cancer cells and inhibits growth in vivo. Cancer Manag. Res.. 2019;11:5883-5894.
- [CrossRef] [Google Scholar]
- Discussion on improving the quality standard of Atractylodis Rhizoma and decoction pleces. Chinese J. Hospital Pharm.. 2023;43:887-891.
- [CrossRef] [Google Scholar]
- The antitumor effect of hinesol, extract from Atractylodes lancea (Thunb.) DC. by proliferation, inhibition, and apoptosis induction via MEK/ERK and NF-kappaB pathway in non-small cell lung cancer cell lines A549 and NCI-H1299. J. Cell Biochem.. 2019;120:18600-18607.
- [CrossRef] [Google Scholar]
- Quality standards for herbal drugs and herbal drug preparations - Appropriate or improvements necessary? Planta Med.. 2018;84:350-360.
- [CrossRef] [Google Scholar]
- HS-SPME coupled with GC-MS for elucidating differences between the volatile components in wild and cultivated Atractylodes chinensis. Phytochem. Anal.. 2023;34:317-328.
- [CrossRef] [Google Scholar]
- Li, D. F., J. S. Liang, Y. J. Pan, et al., 2022. Comparative Studies on High-performance Thin-layer Chromatographic Fingerprints of Atractylodes chinensis and Atractylodes japonica Traditional Chinese Drug Research and Clinical Pharmacology. 33, 97-104. https://doi.org/10.19378/j.issn.1003-9783.2022.01.014
- beta-Eudesmol induces JNK-dependent apoptosis through the mitochondrial pathway in HL60 cells. Phytother. Res.. 2013;27:338-343.
- [CrossRef] [Google Scholar]
- Bioactive-chemical quality markers revealed: an integrated strategy for quality control of chicory. Front. Nutr.. 2022;9:934176
- [CrossRef] [Google Scholar]
- Atractylon, a novel dopamine 2 receptor agonist, ameliorates Parkinsonian like motor dysfunctions in MPTP-induced mice. Neurotoxicology. 2022;89:121-126.
- [CrossRef] [Google Scholar]
- A new concept on quality marker of Chinese materia medica: Quality control for Chinese medicinal products. Chinese Trad. Herb. Drugs. 2016;47:1443-1457.
- [CrossRef] [Google Scholar]
- Quality marker of TCMs: concept and applications. Phytomedicine. 2018;44:85-86.
- [CrossRef] [Google Scholar]
- The research on the effects of different drying methods and picking time on Atractylodis Rhizoma medicinal quality. Lishizhen Med. Mater. Med. Res.. 2021;32:606-609.
- [Google Scholar]
- Thoughts on current quality standard of Atractylodis Rhizoma based on genuine advantages of traditional Chinese medicine. Chin. J. Exp. Tradit. Med. Formulae. 2022;28:212-219.
- [Google Scholar]
- Prevention, treatment and potential mechanism of herbal medicine for Corona viruses: A review. Bioengineered. 2022;13:5480-5508.
- [CrossRef] [Google Scholar]
- Multimodal integrated strategy for the discovery and identification of quality markers in traditional Chinese medicine. J. Pharm. Anal.. 2022;12:701-710.
- [CrossRef] [Google Scholar]
- Study on the material basis of Houpo Wenzhong decoction by HPLC fingerprint, UHPLC-ESI-LTQ-Orbitrap-MS, and network pharmacology. Molecules. 2019;24
- [CrossRef] [Google Scholar]
- Exploration of the anti-inflammatory mechanism of Lanqin oral solution based on the network pharmacology analysis optimized by Q-markers selection. Comput. Biol. Med.. 2023;154:106607
- [CrossRef] [Google Scholar]
- Betaeta-eudesmol reduces stem cell factor-induced mast cell migration. Int. Immunopharmacol.. 2017;48:1-7.
- [CrossRef] [Google Scholar]
- In vitro antitrypanosomal activity of plant terpenes against Trypanosoma brucei. Phytochemistry. 2011;72:2024-2030.
- [CrossRef] [Google Scholar]
- Identification and quantification of sesquiterpenes and polyacetylenes in Atractylodes lancea from various geographical origins using GC-MS analysis. Rev. Bras. 2012;22:957-963.
- [CrossRef] [Google Scholar]
- A precise efficacy determination strategy of traditional Chinese herbs based on Q-markers: Anticancer efficacy of Astragali radix as a case. Phytomedicine. 2022;102:154155
- [CrossRef] [Google Scholar]
- Analytical strategies for the discovery and validation of quality-markers of traditional Chinese medicine. Phytomedicine. 2020;67:153165
- [CrossRef] [Google Scholar]
- Inhibition of H+, K+ -ATPase by hinesol, a major component of So-jutsu, by interaction with enzyme in the E1 state. Biochem. Pharmacol.. 2000;59:881-886.
- [CrossRef] [Google Scholar]
- The regulatory mechanism of beta-eudesmol is through the suppression of caspase-1 activation in mast cell-mediated inflammatory response. Immunopharmacol. Immunotoxicol.. 2011;33:178-185.
- [CrossRef] [Google Scholar]
- Geographic differentiation of essential oil from rhizome of cultivated Atractylodes lancea by using GC-MS and chemical pattern recognition analysis. Molecules. 2023;28:2216.
- [CrossRef] [Google Scholar]
- Influence of nutrient (NPK) factors on growth, and pharmacodynamic component biosynthesis of Atractylodes chinensis: An insight on Acetyl-CoA Carboxylase (ACC), 3-Hydroxy-3-Methylglutaryl-CoA Reductase (HMGR), and Farnesyl Pyrophosphate Synthase (FPPS) signaling responses. Front. Plant Sci.. 2022;13:799201
- [CrossRef] [Google Scholar]
- Atractylon inhibits the tumorigenesis of glioblastoma through SIRT3 signaling. Am. J. Cancer Res.. 2022;12:2310-2322.
- [Google Scholar]
- A comparative study on essential oil components of wild and cultivated Atractylodes lancea and A. chinensis. Planta Med.. 1996;62:444-449.
- [CrossRef] [Google Scholar]
- Comparative analysis of the main active constituents from different parts of Leonurus japonicus Houtt. and from different regions in China by ultra-high performance liquid chromatography with triple quadrupole tandem mass spectrometry. J. Pharmaceut. Biomed.. 2020;177
- [CrossRef] [Google Scholar]
- Anti-angiogenic effects of beta-eudesmol and atractylodin in developing zebrafish embryos. Comp. Biochem. Physiol. C Toxicol. Pharmacol.. 2021;243:108980
- [CrossRef] [Google Scholar]
- Antiangiogenic activity of beta-eudesmol in vitro and in vivo. Eur. J. Pharmacol.. 2005;512:105-115.
- [CrossRef] [Google Scholar]
- Genetic and environmental factors influencing the contents of essential oil compounds in Atractylodes lancea. PLoS One. 2019;14:e0217522.
- [Google Scholar]
- HPLC-DVD combined with chemometrics to analyze the correlation between the Q-marker content and color of Corni Fructus. Food Funct.. 2022;13:5455-5465.
- [CrossRef] [Google Scholar]
- Development of a three-step-based novel strategy integrating DMPK with network pharmacology and bioactivity evaluation for the discovery of Q-markers of traditional Chinese medicine prescriptions: Danlou tablet as an example. Phytomedicine. 2023;108:154511
- [CrossRef] [Google Scholar]
- An update on Chinese herbal medicines as adjuvant treatment of anticancer therapeutics. Biosci. Trends. 2018;12:220-239.
- [CrossRef] [Google Scholar]
- Effects of β-eudesmol, an active constituent from Rhizoma Atractylodis on small intestine movement in rats. Chin. Pharm. J.. 2002;4:266-268.
- [Google Scholar]
- The box plot: a simple visual method to interpret data. Ann. Intern. Med.. 1989;110:916-921.
- [CrossRef] [Google Scholar]
- Wu, B. C., Y. L. Wei, X. Gao, et al., 2008. Studies on Correlations between Components of Essential Oil and Mass of Fresh Rhizome of Atractylodes lancea (Thunb.) DC. from Mt. Maoshan. Chemistry and Industry of Forest Products. 84-88.
- Comparative analysis in different organs and tissue-specific metabolite profiling of Atractylodes lancea from four regions by GC-MS and laser microdissection. J. Sep. Sci.. 2022;45:1067-1079.
- [CrossRef] [Google Scholar]
- Yang, C., Y. P., L. L. H., et al., 2021. Research progress on Q-Marker of traditional Chinese medicine and thoughts on quality research of Chinese materia medica. Chinese Traditional and Herbal Drugs. 52, 2519-2526.
- The method of quality marker research and quality evaluation of traditional Chinese medicine based on drug properties and effect characteristics. Phytomedicine. 2018;44:204-211.
- [CrossRef] [Google Scholar]
- Simultaneous determ ination of atractylone, hinesol, β-eudesmol, atrctylodin in Atractylodes lancea and hierarchical cluster analysis. China J. Chinese Mater. Med.. 2010;35:725-728.
- [Google Scholar]
- Research progress on quality markers of traditional Chinese medicine. J. Pharm. Biomed. Anal.. 2022;211:114588
- [CrossRef] [Google Scholar]
- Atractylodis Rhizoma: A review of its traditional uses, phytochemistry, pharmacology, toxicology and quality control. J. Ethnopharmacol.. 2021;266:113415
- [CrossRef] [Google Scholar]
- Discovery of quality control markers from traditional Chinese medicines by fingerprint-efficacy modeling: Current status and future perspectives. J. Pharm. Biomed. Anal.. 2018;159:296-304.
- [CrossRef] [Google Scholar]
- Zhao, Y. Y., J. Y. Zhang, K. Y. Zheng, et al., 2022. Optimization of Extraction Process of Beicangzhu (Atractylodes chinensis) by Combination of Response Surface Methodology with Information Entropy Weight Method. Chinese Archives of Traditional Chinese Medicine. 40, 86-90+278. https://doi.org/10.13193/j.issn.1673-7717.2022.06.018.
- Quality evaluation of Atractylodis Macrocephalae Rhizoma based on combinative method of HPLC fingerprint, quantitative analysis of multi-components and chemical pattern recognition analysis. Molecules. 2021;26:7124.
- [CrossRef] [Google Scholar]
- Qualitative analysis and componential differences of chemical constituents in Lysimachiae Herba from different habitats (Sichuan Basin) by UFLC-triple TOF-MS/MS. Molecules. 2022;27
- [CrossRef] [Google Scholar]
- Discovery of quality markers in Rubus Chingii Hu using UPLC-ESI-QTOF-MS. J. Pharm. Biomed. Anal.. 2021;203:114200
- [CrossRef] [Google Scholar]
- Grade standard and quality evaluation of Atractylodes chinensis. Chinese Trad. Patent Med.. 2020;42:1536-1543.
- [Google Scholar]
- Regionalization of Chinese material medical quality based on maximum entropy model: A case study of Atractylodes lancea. Sci. Rep.. 2017;7:42417.
- [CrossRef] [Google Scholar]
Appendix A
Supplementary material
Supplementary data to this article can be found online at https://doi.org/10.1016/j.arabjc.2023.105114.
Appendix A
Supplementary material
The following are the Supplementary data to this article:Supplementary data 1
Supplementary data 1
Supplementary data 2
Supplementary data 2


