

Translate this page into:
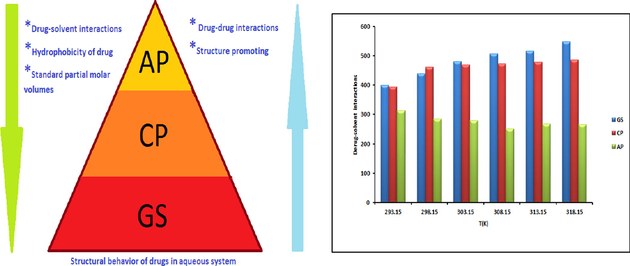
Drug-drug and drug-solvent interaction studies of Chloroquine phosphate, Acefylline piperazine and Gentamicin sulfate in polymeric systems
⁎Corresponding author. smasood@uok.edu.pk (Summyia Masood),
-
Received: ,
Accepted: ,
This article was originally published by Elsevier and was migrated to Scientific Scholar after the change of Publisher.
Peer review under responsibility of King Saud University.
Abstract
Abstract
The densities of three pharmacologically significantly used drugs i.e., Chloroquine phosphate (CP), Acefylline piperazine (AP) and Gentamicin sulfate (GS) have been carried out in aqueous (aq), aqueous polyethylene glycol (aq-PEG) and aqueous polyvinyl pyrrolidone (aq-PVP) solvent systems within concentration range (0.02–0.1 ± 0.001 mol.dm−3) at different temperatures (293.15–318.15 K) with the interval of 5 K. Density data were used to evaluate volumetric properties of drugs (CP, AP and GS) by apparent molar volume, partial molar volumes, molar expansibilities and isothermal expansion coefficient. provides information about the absence or presence of a caging or packing effect. Partial molar transfer volume was also calculated to study the hydrophilic/hydrophobic interactions in aq-PEG and aq-PVP solvent systems. The results are interpreted in terms of drug–solvent and drug-drug interactions and structure making or breaking abilities of drugs in aq, aq-PEG and aq-PVP solvent systems.
Keywords
Chloroquine phosphate
Acefylline piperazine
Gentamicin sulfate
Volumetric properties
Drug-solvent interactions
Structure making/breaking properties

1 Introduction
In pharmaceutical and medicinal chemistry, information about the intermolecular interaction of drugs and its physicochemical behavior plays an important role, which gives understanding about drug action. During drug development and design of pharmaceutical dosage forms physicochemical properties of drugs such as the solubility, density and volumes occupied by drug molecules and other components in solution play a significant role (Martin and Bustamante, 1993).
For pharmadynamics and pharmacokinetics, such as the diffusion, transmission, distribution and absorption of the drug in vivo, are also due to physicochemical interactions which may include interactions (ionic or covalent, charge transfer, ion-dipole, hydrogen bonding, or hydrophobic) existing between the drug and molecules in the living organism (Kaur and Adhikari, 2015; Li and Ren, 2013). When a drug entity enters the body, it will interact with one or more biopolymers that are present in the extracellular fluid, in the cell membrane, and within cells. The type and the extent of these interactions will depend on the nature and number of chemically reactive functional groups and the polarity of the drug molecule. The drug-biopolymer interactions involve weak forces such as ionic bonds, hydrogen bonds, Van der Waals forces, dipole-ion, and dipole-dipole forces which can be interpreted from the physicochemical study of drug solutions (Masood and Khan, 2020).
Chloroquine phosphate is widely used as an antimalarial as well as an antiamoebic and autoimmune disease drug, belongs to the 4-aminoquinoline class of compounds and considers as the first choice drug for the attack of vivax malaria (Bajpai and Jyoti Choubey, 2006). For the treatment of lupus erythematosus and rheumatoid arthritis CP is considered as an efficient anti-inflammatory agent. Several recent studies (Colson et al., 2020; Gao et al., 2020; Wang et al., 2020) on the effectiveness of CP divulged that this drug has been reported as a potential broad-spectrum antiviral drug. As it has capability to prevent virus infection by increasing endosomal pH required for virus /cell fusion, furthermore interfering with glycosylation of cellular receptors of sever acute respiratory syndrome CoV (SARS-CoV). Its immune-modulating activity can enhance its in vivo antiviral efficacy. CP is a cheap and safe drug and it is potentially clinically applicable to combat against 2019-nCoV. As CP can distribute evenly in the body including lungs. CP at an EC50 of 1.1 µM, were found to be effective in preventing replication of 2019-nCoV. Acefylline piperazine (AP) is one of the derivatives of theophylline and belongs to the xanthene class of drugs. AP serves as an anti-asthmatic, bronchodilator, cardiac stimulant and also diuretic (Masood and Rehman, 2018). While Gentamicin sulfate (GS) is an important drug that is used to control various infections that are caused by Gram-positive and Gram-negative bacteria as it is an aminoglycoside based broad-spectrum antibiotic (Graheka and Zupan, 2009). (Jia et al., 2008) The work on the development and estimation of the physicochemical properties of gentamicin in the delivery system has been done.
Controlled release technology along with drug delivery has been received the great attention of chemists and chemical engineers due to its number of advantages over conventional therapy include augmented efficacy, improved patient convenience and reduced side effects (Kaur and Adhikari, 2015). Development of a safe drug delivery system (DDS) with control rate and target specification, such as provide therapeutic levels of drugs in particular organs, tissues or cellular structures are of the main interest of researchers nowadays. Traditional medicines reach to the target by progressive drug-flooding of the body are no longer effective for developing most of the synthetic and biotechnological therapeutic molecules because of instability, toxicity and hindrances to reach to the target. Thus, DDS can release an active molecule at a determined rate and at the targeted site is greatly demanded, so biocompatible materials are used which are sensitive to certain physiological variables or external physicochemical stimuli (Lorenzo and Bromberg, 2009). As drugs are made up of different components such as drug (active ingredients), polymer matrix and other additives (inactive ingredients/excipients) which can improve the stability, compact ability, consistency, taste and color of the tablet. Polymers are used to control the drug release rate and act as an inert excipient (Wray and Chan, 2008). The drug release properties of the polymer have been studied on Ibuprofen microparticles that are encapsulated into polysaccharide (Qiu et al., 2001). The researcher worked on polymer-based colloids and studied the release of drugs from colloids and physicochemical features of the drug delivery system (Yang et al., 2000).
The most accurate feature to confer the solution properties of drug molecules is the inference of hydrophobic and charge contributions. In an aqueous system, the polar groups are hydrated and favor the limited aqueous solubilization of drug molecules, facing intermolecular aggregation through their hydrophobic groups and it is probably comparable to the micellization. However, the addition of any non-aqueous component greatly affects the aggregation propensity. As polymers contain both hydrophobic and hydrophilic tails so a complex self-association behavior is observed (Munir and Ali, 2014). Density studies of the solutions provide understanding about the different interactions such as drug-drug and drug-solvent interactions. The drug-solvent interaction is a crucial tool to compensate for different practical problems related to mass transport, energy transport and fluid flow. The effect of solvent composition and temperature variation on the volumetric properties of the amlodipine besylate (drug) in aqueous and aqueous + mix systems has studied (Munir and Ali, 2014). Few researchers have studied the drug’s interaction with temperature variation in aqueous and mixed solvent systems (Pal et al., 2012; Saeed et al., 2009; Affandi et al., 2016; Delgadoet al., 2010; Iqbal and Chaudhry, 2009a,b; Sharma et al., 2008).
In the present study, the physicochemical properties of drugs (CP, AP and GS) are taken into consideration which was done by density measurement for drugs CP, AP and GS solutions for different concentrations in aq-PEG and aq-PVP solvent systems. This novel study of three significantly used drugs has been done to evaluate the effect of temperature and nature of the solvent on the intermolecular interactions (drug-drug and drug-solvent) of these drugs in water-soluble polymer systems.
2 Experimental
All glassware was used are of Pyrex A grade quality to prepare standard solutions. Drugs Chloroquine phosphate, Acefylline piperazine and Gentamicin sulfate were obtained from the Nabi Qasim pharmaceutical industry was used (minimum assay mass fraction purity 0.995). De-ionized water having specific conductivity < 10-6 S.cm−1 was used for the preparation of solutions preparation. Water-soluble polymers i.e., Polyvinyl pyrrolidone of Sigma-Aldrich and Polyethylene glycol of BDH were used for experimental purpose. Stock solutions of 0.1 mol.dm−3 concentration of drugs Chloroquine phosphate, Acefylline piperazine and Gentamicin sulfate were prepared in aq, aq-PEG and aq-PVP. Different dilutions from stock solutions were prepared ranges from 2.0 to 10.0 × 10⁻² ± 0.001 mol.dm−3 in aq, aq-PEG (1.0 %w/v) and aq-PVP (1.0 %w/v) solvent systems. The experimental data for densities of solvents and solutions were measured by using a relative density bottle having a capacity of 10 cm−3 at different temperatures. Experimental densities were measured at different temperature ranges from 293.15 to 318.15 K with (5 K intervals ± 0.01 K) by using a thermostatic water bath (type VWP Scientific, model 1120, SER 9143791). A Shimadzu, AUW220 weighing balance was used for the mass determination with the uncertainty in the experimental data on the density was found to be ±0.0001 g.cm−3. To ensure the reproducibility of the results, all measurements were done thrice.
2.1 Statistical analysis
The reproducibility of the results has been checked by triplicate measurements for each set of data and the results were statistically analyzed by using a software, Statistical package for social sciences (SPSS version 20.0 USA). Analysis of variance (ANOVA) was performed using Duncan’s multiple range tests to compare treatment means and t-test was used to compare two mean values. The confidence level 95% was defined as p < 0.05.
3 Results and discussion
The experimental values of densities for Chloroquine phosphate, Acefylline piperazine and Gentamicin sulfate drugs solutions in aq, aq-PEG (1.0 %w/v) and aq-PVP (1.0 %w/v) within the concentration range from 0.02 to 0.1 ± 0.001 mol.dm−3 in polymeric solvent systems at different temperatures (293.15 to 318.15 K) with a difference of 5 K are tabulated in Tables 1–3. The data show that the densities increased with the increase in drug concentration indicating the existence of attractive molecular interactions (drug-solvent) in the aq, aq-PEG and aq-PVP solvent systems (Thiumaran and George, 2013). Values are the mean of three difference replications. Different alphabets within each column are significantly different at p < 0.05.
m (mol.kg−1)
‘ρ’ × 102, (g/ml)at different temperatures (K)
293.15
298.15
303.15
308.15
313.15
318.15
Chloroquine phosphate
0.0203
100.103 ± 0.013f
099.894 ± 0.010e
099.754 ± 0.011d
099.578 ± 0.011c
099.391 ± 0.002b
099.185 ± 0.005a
0.0408
100.403 ± 0.013f
100.249 ± 0.010e
100.105 ± 0.011d
099.931 ± 0.011c
099.739 ± 0.002b
099.519 ± 0.005a
0.0616
100.770 ± 0.013f
100.584 ± 0.010e
100.440 ± 0.011d
100262 ± 0.011c
100.070 ± 0.002b
099.855 ± 0.005a
0.0827
101.093 ± 0.013f
100.977 ± 0.010e
100.808 ± 0.011d
100.631 ± 0.011c
100.432 ± 0.002b
100.205 ± 0.005a
0.1042
101.440 ± 0.013f
101.303 ± 0.010e
101.153 ± 0.011d
100.958 ± 0.011c
100.758 ± 0.002b
100.555 ± 0.005a
Acefylline piperazine
0.0202
099.899 ± 0.001f
099.796 ± 0.021e
099.676 ± 0.011d
099.524 ± 0.002c
099.349 ± 0.000b
099.162 ± 0.001a
0.0406
100.009 ± 0.001f
099.899 ± 0.021e
099.792 ± 0.011d
099.661 ± 0.002c
099.487 ± 0.000b
099.323 ± 0.001a
0.0612
100.109 ± 0.001f
100.012 ± 0.021e
099.913 ± 0.011d
099.788 ± 0.002c
099.628 ± 0.000b
099.485 ± 0.001a
0.0821
100.211 ± 0.001f
100.119 ± 0.021e
100.033 ± 0.011d
099.923 ± 0.002c
099.779 ± 0.000b
099.648 ± 0.001a
0.1032
100.319 ± 0.001f
100.231 ± 0.021e
100.165 ± 0.011d
100.078 ± 0.002c
099.927 ± 0.000b
099.836 ± 0.001a
Gentamicin sulfate
0.0203
100.242 ± 0.004f
100.071 ± 0.001e
099.884 ± 0.011d
099.681 ± 0.013c
099.468 ± 0.000b
099.241 ± 0.001a
0.0408
100.712 ± 0.004f
100.516 ± 0.001e
100.349 ± 0.011d
100.104 ± 0.013c
099.851 ± 0.000b
099.568 ± 0.001a
0.0616
101.225 ± 0.004f
101.004 ± 0.001e
100.834 ± 0.011d
100.562 ± 0.013c
100.262 ± 0.000b
099.931 ± 0.001a
0.0827
101.761 ± 0.004f
101.546 ± 0.001e
101.377 ± 0.011d
101.117 ± 0.013c
100.791 ± 0.000b
100.521 ± 0.001a
0.1039
102.342 ± 0.004f
102.129 ± 0.001e
101.963 ± 0.011d
101.694 ± 0.013c
101.238 ± 0.000b
101.008 ± 0.001a
m (mol.kg−1)
‘ρ’ × 102, (g/ml)at different temperatures (K)
293.15
298.15
303.15
308.15
313.15
318.15
Chloroquine phosphate
0.0202
100.359 ± 0.014f
100.248 ± 0.011e
100.201 ± 0.010d
099.902 ± 0.013c
099.743 ± 0.011b
099.604 ± 0.002a
0.0406
100.791 ± 0.014f
100.665 ± 0.011e
100.587 ± 0.010d
100.279 ± 0.013c
100.108 ± 0.011b
099.964 ± 0.002a
0.0613
101.291 ± 0.014f
101.119 ± 0.011e
100.997 ± 0.010d
100.676 ± 0.013c
100.518 ± 0.011b
100.334 ± 0.002a
0.0822
101.825 ± 0.014f
101.617 ± 0.011e
101.436 ± 0.010d
101.119 ± 0.013c
100.938 ± 0.011b
100.779 ± 0.002a
0.1033
102.329 ± 0.014f
102.191 ± 0.011e
101.963 ± 0.010d
101.662 ± 0.013c
101.406 ± 0.011b
101.221 ± 0.002a
Acefylline piperazine
0.0201
100.258 ± 0.010f
100.147 ± 0.001e
100.083 ± 0.014d
099.759 ± 0.003c
099.583 ± 0.021b
099.446 ± 0.003a
0.0404
100.404 ± 0.010f
100.301 ± 0.001e
100.246 ± 0.014d
099.891 ± 0.003c
099.698 ± 0.021b
099.532 ± 0.003a
0.0609
100.582 ± 0.010f
100.501 ± 0.001e
100.429 ± 0.014d
100.061 ± 0.003c
099.825 ± 0.021b
099.629 ± 0.003a
0.0816
100.790 ± 0.010f
100.699 ± 0.001e
100.609 ± 0.014d
100.217 ± 0.003c
099.956 ± 0.021b
099.727 ± 0.003a
0.1025
100.971 ± 0.010f
100.891 ± 0.001e
100.784 ± 0.014d
100.361 ± 0.003c
100.079 ± 0.021b
099.815 ± 0.003a
Gentamicin sulfate
0.0193
104.748 ± 0.004f
104.653 ± 0.021e
104.589 ± 0.013d
104.271 ± 0.002c
104.108 ± 0.010b
103.989 ± 0.001a
0.0390
105.119 ± 0.004f
104.977 ± 0.021e
104.797 ± 0.013d
104.465 ± 0.002c
104.301 ± 0.010b
104.186 ± 0.001a
0.0589
105.491 ± 0.004f
105.384 ± 0.021e
105.286 ± 0.013d
104.958 ± 0.002c
104.749 ± 0.010b
104.517 ± 0.001a
0.0791
105.922 ± 0.004f
105.855 ± 0.021e
105.754 ± 0.013d
105.416 ± 0.002c
105.243 ± 0.010b
105.124 ± 0.001a
0.0996
106.404 ± 0.004f
106.276 ± 0.021e
106.148 ± 0.013d
105.844 ± 0.002c
105.652 ± 0.010b
105.521 ± 0.001a
m (mol.kg−1)
‘ρ’ × 102, (g/ml)at different temperatures (K)
293.15
298.15
303.15
308.15
313.15
318.15
Chloroquine phosphate
0.0193
104.998 ± 0.010f
104.704 ± 0.001e
104.589 ± 0.010d
104.451 ± 0.012c
104.248 ± 0.003b
104.015 ± 0.021a
0.0389
105.024 ± 0.010f
104.928 ± 0.001e
104.823 ± 0.010d
104.561 ± 0.012c
104.405 ± 0.003b
104.202 ± 0.021a
0.0588
105.373 ± 0.010f
105.264 ± 0.001e
105.099 ± 0.010d
104.904 ± 0.012c
104.746 ± 0.003b
104.549 ± 0.021a
0.0789
105.773 ± 0.010f
105.676 ± 0.001e
105.498 ± 0.010d
105.289 ± 0.012c
105.129 ± 0.003b
104.934 ± 0.021a
0.0993
106.198 ± 0.010f
106.064 ± 0.001e
105.906 ± 0.010d
105.740 ± 0.012c
105.570 ± 0.003b
105.363 ± 0.021a
Acefylline piperazine
0.0201
100.224 ± 0.004f
100.116 ± 0.003e
099.994 ± 0.015d
099.870 ± 0.010c
099.698 ± 0.002b
099.491 ± 0.000a
0.0405
100.448 ± 0.004f
100.311 ± 0.003e
100.155 ± 0.015d
099.991 ± 0.010c
099.791 ± 0.002b
099.555 ± 0.000a
0.0610
100.671 ± 0.004f
100.509 ± 0.003e
100.312 ± 0.015d
100.112 ± 0.010c
099.881 ± 0.002b
099.619 ± 0.000a
0.0817
100.894 ± 0.004f
100.702 ± 0.003e
100.463 ± 0.015d
100.231 ± 0.010c
099.971 ± 0.002b
099.678 ± 0.000a
0.1027
101.108 ± 0.004f
100.891 ± 0.003e
100.608 ± 0.015d
100.347 ± 0.010c
100.048 ± 0.002b
099.736 ± 0.000a
Gentamicin sulfate
0.0198
102.124 ± 0.002f
102.068 ± 0.011e
102.008 ± 0.002d
101.963 ± 0.000c
101.848 ± 0.001b
101.697 ± 0.011a
0.0393
104.228 ± 0.002f
104.163 ± 0.011e
104.126 ± 0.002d
104.069 ± 0.000c
103.943 ± 0.001b
103.779 ± 0.011a
0.0590
105.166 ± 0.002f
105.148 ± 0.011e
105.105 ± 0.002d
105.033 ± 0.000c
104.905 ± 0.001b
104.748 ± 0.011a
0.0792
105.701 ± 0.002f
105.683 ± 0.011e
105.632 ± 0.002d
105.551 ± 0.000c
105.432 ± 0.001b
105.273 ± 0.011a
0.0998
106.037 ± 0.002f
106.003 ± 0.011e
105.963 ± 0.002d
105.899 ± 0.000c
105.782 ± 0.001b
105.629 ± 0.011a
Densities of drugs were also found to be increased by the addition of polymer as higher molecular weight substances causing increased in densities. The density data were used to evaluate partial molar volumes and apparent molar volumes of drugs in respective solvent systems (Sharma et al., 2008).
Apparent molar volume ‘
’ is the sum of the volume of solute and the change in volume of solvent is due to solute-solvent interaction and is calculated by using Eq. (1),
Values are the mean of three difference replications. Different alphabets within each column are significantly different at p < 0.05.
m (mol.kg−1)
× 10-1, m3.mol-1at different temperatures (K)
293.15
298.15
303.15
308.15
313.15
318.15
Chloroquine phosphate
0.0203
37.511 ± 0.005a
42.011 ± 0.00b
42.567 ± 0.001c
42.953 ± 0.001d
43.381 ± 0.007e
43.771 ± 0.003f
0.0408
37.080 ± 0.005a
37.982 ± 0.001b
38.381 ± 0.001c
38.541 ± 0.001d
38.922 ± 0.007e
39.489 ± 0.003f
0.0616
35.821 ± 0.005a
36.970 ± 0.001b
37.252 ± 0.001c
37.442 ± 0.001d
37.720 ± 0.007e
38.041 ± 0.003f
0.0827
35.741 ± 0.005a
35.733 ± 0.001b
36.273 ± 0.001c
36.421 ± 0.001d
36.721 ± 0.007e
37.142 ± 0.003f
0.1042
35.452 ± 0.005a
35.656 ± 0.001b
35.911 ± 0.001c
36.219 ± 0.001d
36.493 ± 0.007e
36.590 ± 0.003f
Acefylline piperazine
0.0202
28.531 ± 0.000f
27.722 ± 0.001e
27.251 ± 0.004d
26.391 ± 0.002c
26.189 ± 0.003b
25.590 ± 0.001a
0.0406
27.756 ± 0.000f
27.541 ± 0.001e
27.010 ± 0.004d
26.560 ± 0.002c
25.956 ± 0.003b
25.111 ± 0.001a
0.0612
27.667 ± 0.000f
27.320 ± 0.001e
26.833 ± 0.004d
26.291 ± 0.002c
25.831 ± 0.003b
24.931 ± 0.001a
0.0821
27.590 ± 0.000f
27.281 ± 0.001e
26.756 ± 0.004d
26.053 ± 0.002c
25.650 ± 0.003b
24.829 ± 0.001a
0.1032
27.491 ± 0.000f
27.212 ± 0.001e
26.591 ± 0.004d
25.811 ± 0.002c
25.562 ± 0.003b
24.510 ± 0.001a
Gentamicin sulfate
0.0203
36.533 ± 0.002a
39.135 ± 0.001b
42.048 ± 0.002c
43.780 ± 0.001d
45.523 ± 0.002e
46.978 ± 0.001f
0.0408
35.331 ± 0.002a
37.279 ± 0.001b
38.257 ± 0.002c
40.209 ± 0.001d
42.121 ± 0.002e
44.302 ± 0.001f
0.0616
34.212 ± 0.002a
35.942 ± 0.001b
36.658 ± 0.002c
38.431 ± 0.001d
40.517 ± 0.002e
42.804 ± 0.001f
0.0827
33.365 ± 0.002a
34.596 ± 0.001b
35.131 ± 0.002c
36.323 ± 0.001d
38.228 ± 0.002e
39.189 ± 0.001f
0.1039
32.406 ± 0.002a
33.378 ± 0.001b
33.783 ± 0.002c
34.837 ± 0.001d
37.681 ± 0.002e
38.060 ± 0.001f
m (mol.kg−1)
× 10-2, m3.mol−1 at different temperatures (K)
293.15
298.15
303.15
308.15
313.15
318.15
Chloroquine phosphate
0.0202
3.044 ± 0.001a
3.313 ± 0.001b
3.424 ± 0.007c
3.519 ± 0.002d
3.584 ± 0.002e
3.769 ± 0.002f
0.0406
2.989 ± 0.001a
3.195 ± 0.001b
3.329 ± 0.007c
3.403 ± 0.002d
3.469 ± 0.002e
3.575 ± 0.002f
0.0613
2.839 ± 0.001a
3.094 ± 0.001b
3.257 ± 0.007c
3.331 ± 0.002d
3.355 ± 0.002e
3.494 ± 0.002f
0.0822
2.708 ± 0.001a
2.986 ± 0.001b
3.185 ± 0.007c
3.238 ± 0.002d
3.285 ± 0.002e
3.359 ± 0.002f
0.1033
2.651 ± 0.001a
2.849 ± .0001b
3.053 ± 0.007c
3.081 ± 0.002d
3.195 ± 0.002e
3.281 ± 0.002f
Acefylline piperazine
0.0201
1.654 ± 0.003a
1.901 ± 0.007b
2.096 ± 0.006c
2.313 ± 0.002d
2.462 ± 0.004e
2.636 ± 0.004f
0.0404
2.085 ± 0.003a
2.188 ± 0.007b
2.264 ± 0.006c
2.429 ± 0.002d
2.573 ± 0.004e
2.734 ± 0.004f
0.0609
2.175 ± 0.003a
2.208 ± 0.007b
2.287 ± 0.006c
2.437 ± 0.002d
2.589 ± 0.004e
2.749 ± 0.004f
0.0816
2.182 ± 0.003a
2.219 ± 0.007b
2.302 ± 0.006c
2.446 ± 0.002d
2.593 ± 0.004e
2.755 ± 0.004f
0.1025
2.214 ± 0.003a
2.233 ± 0.007b
2.316 ± 0.006c
2.464 ± 0.002d
2.603 ± 0.004e
2.768 ± 0.004f
Gentamicin sulfate
0.0193
−182.91 ± 0.002a
−181.40 ± 0.011b
−179.42 ± 0.002c
−178.44 ± 0.003d
−177.72 ± 0.002e
−177.01 ± 0.002f
0.0390
−71.95 ± 0.002a
−69.99 ± 0.011b
−66.13 ± 0.002c
−65.06 ± 0.003d
−64.73 ± 0.002e
−64.49 ± 0.002f
0.0589
−34.97 ± 0.002a
−34.24 ± 0.011b
−33.03 ± 0.002c
−32.35 ± 0.003d
−31.36 ± 0.002e
−29.23 ± 0.002f
0.0791
−17.22 ± 0.002a
−17.17 ± 0.011b
−16.22 ± 0.002c
−15.56 ± 0.003d
−15.26 ± 0.002e
−15.07 ± 0.002f
0.0996
−7.077 ± 0.002a
−6.421 ± 0.011b
−5.390 ± 0.002c
−5.185 ± 0.003d
−4.739 ± 0.002e
−4.463 ± 0.002f
m (mol.kg−1)
× 10-1, m3.mol−1 at different temperatures (K)
293.15
298.15
303.15
308.15
313.15
318.15
Chloroquine phosphate
0.0193
−19.88 ± 0.014a
−18.83 ± 0.011b
−18.671 ± 0.002c
−18.441 ± 0.009d
−18.151 ± 0.014e
−17.921 ± 0.001f
0.0389
−7.427 ± 0.014a
−7.393 ± 0.011b
−7.336 ± 0.002c
−6.912 ± 0.009d
−6.881 ± 0.014e
−6.836 ± 0.001f
0.0588
−3.813 ± 0.014a
−3.768 ± 0.011b
−3.629 ± 0.002c
−3.457 ± 0.009d
−3.432 ± 0.014e
−3.409 ± 0.001f
0.0789
−2.070 ± 0.014a
−2.051 ± 0.011b
−1.929 ± .002c
−1.782 ± 0.009d
−1.759 ± 0.014e
−1.744 ± 0.001f
0.0993
−1.049 ± 0.014a
−0.996 ± 0.011b
−0.919 ± 0.002c
−0.843 ± 0.009d
−0.814 ± 0.014e
−0.789 ± 0.001f
Acefylline piperazine
0.0201
2.074 ± 0.003a
2.215 ± 0.005b
2.428 ± 0.002c
2.600 ± 0.0011d
2.764 ± 0.002e
2.905 ± 0.001f
0.0405
2.099 ± 0.003a
2.243 ± 0.005b
2.435 ± 0.002c
2.623 ± 0.001d
2.777 ± 0.002e
2.923 ± 0.001f
0.0610
2.109 ± 0.003a
2.247 ± 0.005b
2.444 ± 0.002c
2.630 ± 0.001d
2.786 ± 0.002e
2.929 ± 0.001f
0.0817
2.114 ± 0.003a
2.255 ± 0.005b
2.456 ± 0.002c
2.637 ± 0.001d
2.791 ± 0.002e
2.938 ± 0.001f
0.1027
2.126 ± 0.003a
2.264 ± 0.005b
2.469 ± 0.002c
2.643 ± 0.001d
2.807 ± 0.002e
2.945 ± 0.001f
Gentamicin sulfate
0.0198
−4.914 ± 0.007f
−5.038 ± 0.002b
−5.142 ± 0.001d
−5.372 ± 0.001c
−5.505 ± 0.003b
−5.651 ± 0.002a
0.0393
−4.839 ± 0.007f
−4.932 ± 0.002c
−4.992 ± 0.001d
−5.079 ± 0.001c
−5.121 ± 0.003b
−5.171 ± 0.002a
0.0590
−2.870 ± 0.007f
−2.976 ± 0.002e
−3.040 ± 0.001d
−3.073 ± 0.001c
−3.097 ± 0.003b
−3.142 ± 0.002a
0.0792
−1.382 ± 0.007f
−1.461 ± 0.002e
−1.498 ± 0.001d
−1.511 ± 0.001c
−1.539 ± 0.003b
−1.569 ± 0.002a
0.0998
−0.290 ± 0.007f
−0.336 ± 0.002e
−0.377 ± 0.001d
−0.403 ± 0.001c
−0.426 ± 0.003b
−0.455 ± 0.002a
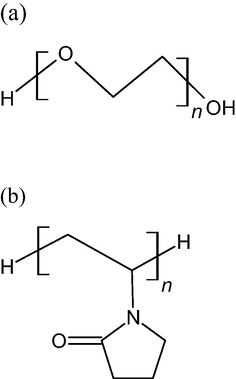
Structural formula of (a) Polyethylene glycol (PEG) and (b) Polyvinyl pyrrolidone (PVP).
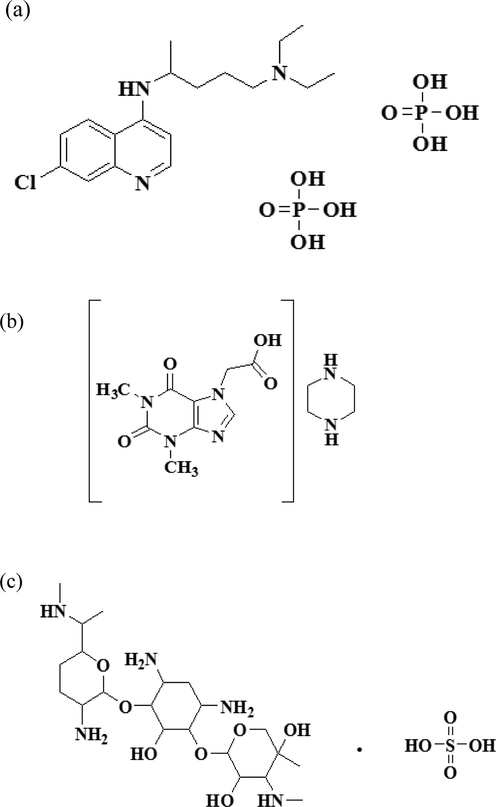
Structural formula of (a) Chloroquine phosphate, (b) Acefylline piperazine and (c) Gentamicin sulfate.
3.1 Volumetric properties of Chloroquine phosphate
The calculated values of apparent molar volumes for CP drug solutions in aq, aq-PEG and aq-PVP solvent systems at different temperatures are reported in Tables 4–6, as shown in Figs. 3 and 4. The positive ‘
’ values of CP drug in aq and aq-PEG systems decreased with the increase in drug concentration, which is related to the compression in volume due to change in solvophobic hydration and reduction in the mean distance between polar groups of drug and solvent (Munir and Ali, 2014) while increased with the elevation of temperature. The positive values of the apparent molar volume of drugs are a clear indication of the ion–dipole interaction as the structure of water helps to describe the drug-solvent interactions. In aqueous system solvent molecules act as dipole and solute ones as a point charge, hence interactions between drug and solvent molecules are based on ion–dipole forces. The negative values of apparent molar volumes of CP in the aq-PVP system show an increasing trend with the increase in the concentration of the drug, which evident the presence of drug-solvent interactions. Drug molecules are completely dissociated at infinite dilution which is considered as standard partial molar volume. The standard partial molar volume has been calculated by Masson equation Eq. (2) from its intercept by using the least square method.
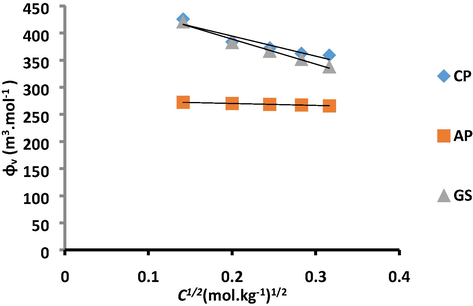
Plot of
v/s C1/2 for CP, AP and GS in aqueous system at 298.15 K.
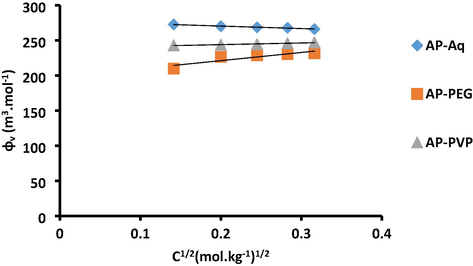
Plot of
v/s C1/2 for AP in aq, aq-PEG and aq-PVP systems.
where,
is the limiting apparent molar volume,
is the square root of concentration of drug in the solution and Sv is the experimental slope that can be related to solute-solute (drug-drug) interactions Figs. 3 and 4, which is considered as a volumetric pairwise interaction coefficient. The evaluated values of
and Sv at different temperatures are listed in Tables 7 and 8.
Solvent 1% (w/v)
× 10–2, m3.mol-1at different temperatures (K).
293.15
298.15
303.15
308.15
313.15
318.15
Chloroquine phosphate
Aqueous
03.933 ± 0.025b
04.618 ± 0.025b
04.685 ± 0.025b
04.721 ± 0.025b
04.776 ± 0.025b
04.849 ± 0.025b
PEG
03.423 ± 0.006c
03.699 ± 0.006c
03.725 ± 0.006c
03.874 ± 0.006c
03.903 ± 0.006c
04.151 ± 0.006c
PVP
−31.499 ± 0.170a
−30.051 ± 0.170c
−29.881 ± 0.170a
−29.381 ± 0.170a
−28.980 ± 0.170a
−28.652 ± 0.170a
Acefylline piperazine
Aqueous
03.125 ± 0.055c
02.849 ± 0.055c
02.791 ± 0.055c
02.509 ± 0.055c
02.672 ± 0.055b
02.666 ± 0.055b
PEG
01.354 ± 0.016a
01.741 ± 0.016a
01.977 ± 0.016a
02.234 ± 0.016a
02.389 ± 0.016a
02.565 ± 0.016a
PVP
02.038 ± 0.012b
02.183 ± 0.012b
02.390 ± 0.012b
02.570 ± 0.012b
02.732 ± 0.012c
02.876 ± 0.012c
Gentamicin sulfate
Aqueous
03.994 ± 0.008c
04.382 ± 0.008c
04.809 ± 0.008c
05.071 ± 0.008c
05.167 ± 0.008c
05.473 ± 0.008c
PEG
−29.491 ± 0.034a
−29.191 ± 0.034a
−28.781 ± 0.034a
−28.591 ± 0.034a
−28.501 ± 0.034a
−28.401 ± 0.034a
PVP
−09.626 ± 0.043b
−09.805 ± 0.043b
−09.952 ± 0.043b
−10.311 ± 0.043b
−10.490 ± 0.043b
−10.721 ± 0.043b
Solvent 1% (w/v)
Sv × 10–2, m3.kg.mol−2 at different temperatures (K).
293.15
298.15
303.15
308.15
313.15
318.15
Chloroquine phosphate
Aqueous
−01.271 ± 0.051b
−03.588 ± 0.051a
−03.703 ± 0.051a
−03.750 ± 0.051a
−03.844 ± 0.051a
−03.998 ± 0.051a
PEG
−02.431 ± 0.005a
−02.579 ± 0.005b
−02.008 ± 0.005b
−02.359 ± 0.005b
−02.217 ± 0.005b
−02.7654 ± 0.005b
PVP
103.89 ± 0.036c
098.877 ± 0.036c
098.620 ± 0.036c
097.421 ± 0.036c
096.062 ± 0.036c
094.957 ± 0.036c
Acefylline piperazine
Aqueous
−00.293 ± 0.007a
−00.302 ± 0.007a
−00.359 ± 0.007a
−00.364 ± 0.007a
−00.362 ± 0.007a
−00.563 ± 0.007a
PEG
02.985 ± 0.016c
01.723 ± 0.016c
01.162 ± 0.016c
00.778 ± 0.016c
00.741 ± 0.016c
00.691 ± 0.016c
PVP
00.279 ± 0.005b
00.261 ± 0.005b
00.237 ± 0.005b
00.236 ± 0.005b
00.224 ± 0.005b
00.218 ± 0.005b
Gentamicin sulfate
Aqueous
−02.350 ± 0.050a
−03.270 ± 0.050a
−04.605 ± 0.050a
−05.059 ± 0.050a
−04.579 ± 0.050a
−05.255 ± 0.050a
PEG
97.890 ± 0.031c
97.050 ± 0.031c
96.042 ± 0.031c
95.552 ± 0.031c
95.411 ± 0.031c
95.300 ± 0.031c
PVP
28.542 ± 0.032b
28.921 ± 0.032b
29.281 ± 0.032b
30.461 ± 0.032b
31.043 ± 0.032b
31.722 ± 0.032b
of drugs provides information only about drug-solvent interaction and it is independent of drug-drug interaction at infinite dilution. It also gives information about hydration properties and solute hydrophobicity. data for CP, AP and GS drugs in aq, aq-polymer solvent systems are summarized in Table 7, the values of in aq system were found to be higher for GS drug as compared to CP and AP. This behavior indicates that the hydrophobicity of studied drugs follows the sequence GS > CP > AP due to the enhancement of hydrophobic groups (CH3), aromatic rings and hydroxyl groups of drugs (Ali and Bidhuri, 2019).
Table 7, also illustrates that at different temperatures data showing increasing trend with the rise in temperature. The positive values of of CP in aq and aq-PEG solvent systems were also evident that the strong drug-solvent interactions exist here. The solvation and hydration behavior of drug may be responsible for this interaction, as the migration of solvent molecules occurs from the second hydration layer that surrounds the drug into the bulk solvent and results in a change in the volume. At high-temperature, an increased in is due to the release of some solvent molecules in the solution from the solvation layer of solute. The values of CP were found to be higher in aq system represent that drug interaction are stronger with water molecules than in polymer–solvent systems showing that drug-solvent interactions decreased. The sequence of values for CP as follows.
The negative values of for CP in aq-PVP system indicate that the interaction between drug and solvent molecules was weaker in aq-PVP system.
The values of Sv which were negative for CP in aq and aq-PEG solvent systems, while positive in aq-PVP at varied temperatures are tabulated in Table 8. The positive values of Sv indicate that two molecules of CP interact by an overlap that occurs between two hydrophilic co-spheres. In contrast, negative data was obtained when the interaction of drug molecules take place by an overlap of hydrophobic co-spheres. The high magnitude of Sv in aq-PVP as compared to the aq and aq-PEG systems representing that drug-drug interaction is strengthened in these solvent systems. Sv data shows a declined trend for CP in aq, aq-PEG and aq-PVP with temperature suggests that high-temperature causing decreased in drug-drug interactions. Drug-Drug Interactions (DDIs) represent a common problem in clinical practice during drug treatments that is adverse drug reactions. DDIs can both induce the development of adverse drug reactions or reduce the clinical efficacy of each drug (Palleria and Paolo, 2013). The magnitude of
values of CP is greater than Sv values in aq and aq-PEG solvent systems as tabulated in Tables 7 and 8. This suggests that drug-solvent interaction has preponderance over drug-drug interactions in these systems.
interactions until they become far away to the significant distance. Vstr is the structural influence on the volume due to variations in the structure of water cause a negative effect and positive effect by enhancing ice likeness of water. Water molecules have a three-dimensional hydrogen-bonded network and its orientation participates through Vstr . As the structure of water depends on ions (its shape, its size and non-polar groups attachment). VHB is the contribution originating from hydrogen bonding between water-drug molecules. (Parmer and Banyal, 2005; Iqbal and Chaudhry, 2009a,b)
Millero, (Millero, 1969) represented the above expression Eq. (3) with a slight variation in the Frank and Wen model (Frank and Wen, 1957).
Transfer of apparent molar properties at infinite dilution renders qualitative as well as quantitative information about solute–solvent interactions without considering the effects of solute–solute interactions (Qiu et al., 2001). Standard partial molar volume of transfer
is also an important parameter that is used to determine the difference between the standard partial molar volumes in the different solvents and in the aqueous system. The values of volume transfer
are represented in Table 9, which show that the volume transfer was negative at all temperatures (298.15–318.15 K) for CP. The negative transfer volumes indicate that CP drug is firmly hydrated.
Solvent 1% (w/v)
× 10-1, m3.mol-1at different temperatures (K).
293.15
298.15
303.15
308.15
313.15
318.15
Acefylline piperazine
PEG
−015.560 ± 0.004a
−010.711 ± 0.004a
−007.966 ± 0.004a
−004.747 ± 0.004a
−002.808 ± 0.004a
−000.682 ± 0.004a
PVP
−008.727 ± 0.009b
−006.296 ± 0.009b
−003.838 ± 0.009b
−001.381 ± 0.009b
000.621 ± 0.009b
002.433 ± 0.009b
Chloroquine phosphate
PEG
−051.040 ± 0.008b
−091.820 ± 0.008b
−096.000 ± 0.008b
−084.670 ± 0.008b
−087.240 ± 0.008b
−069.730 ± 0.008b
PVP
−354.400 ± 0.021a
−346.600 ± 0.021a
−345.600 ± 0.021a
−341.000 ± 0.021a
−337.500 ± 0.021a
−334.900 ± 0.021a
Gentamicin sulfate
PEG
−334.871 ± 0.012a
−335.759 ± 0.012a
−335.852 ± 0.012a
−336.562 ± 0.012a
−336.630 ± 0.012a
−338.736 ± 0.012a
PVP
−136.202 ± 0.024b
−141.869 ± 0.024b
−147.613 ± 0.024b
−153.802 ± 0.024b
−156.640 ± 0.024b
−161.916 ± 0.024b
Franks and Evans (Frank, 1945) postulated that the thermodynamic transfer function can be evaluated in terms of the ability of water either it is structure breaking or making of solute. The volume transfer values for CP, AP and GS drugs were calculated by using Eqs. (5) and (6),
The co-sphere overlap model upon which basis there are four types of molecular interactions that can exist between drug and polymer. (i) Ion-ion interactions between the polar group (R—CH3, R—NH2, R—NH and R—Cl) of drug and zwitter-ionic groups of the polymer (H and —OH, —C⚌O). (ii) Non-polar-non-polar group interactions between non-polar group and a hydrophobic group of polymer and drug (R—CH2). (iii) Hydrophilic-hydrophilic interactions between polar groups of drug (—NH2, —NH and —Cl) and a polar group of the polymer (—OH). (iv) Ion-hydrophobic interactions between the polar group of polymer/drug and an ionic group of drug/polymer. (Dhondge and Paliwal, 2012)
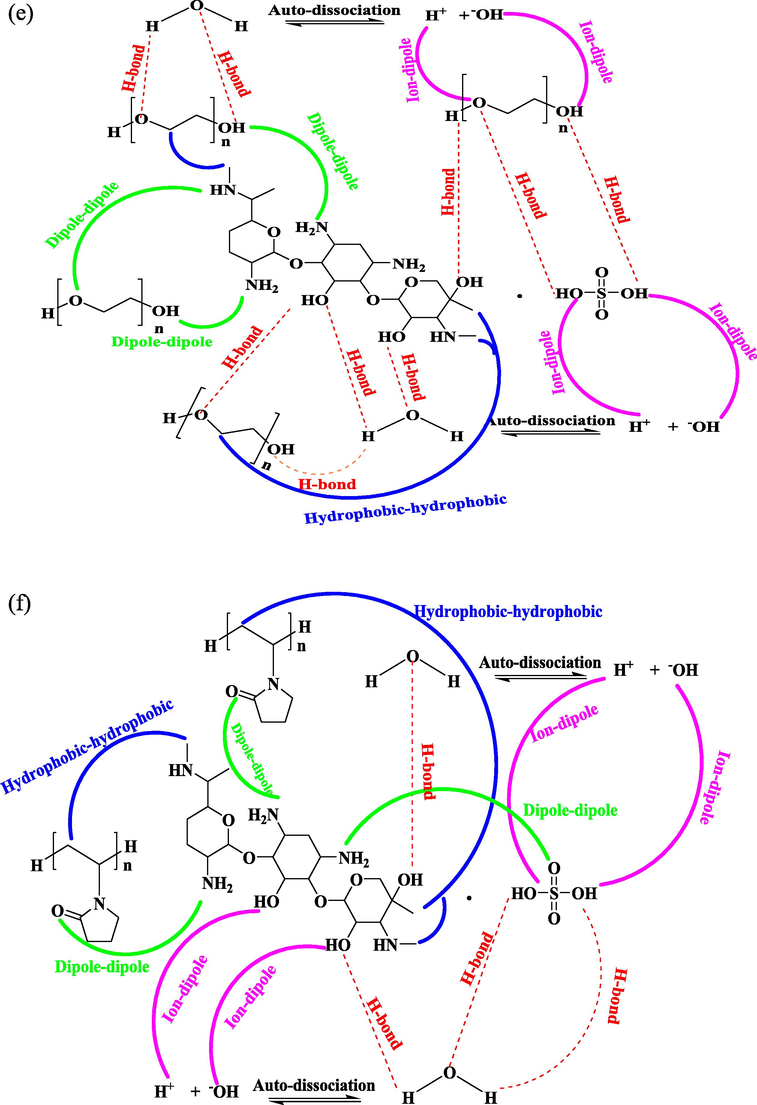
According to this co-sphere overlap model as two ionic or polar species that increase in volume is due to hydration co-spheres overlap, while the decrease in volume occurs when the hydration co-spheres of ion-hydrophobic and hydrophobic-hydrophobic proceed. The negative values of of drugs CP in aq-PEG and aq-PVP, illustrate that solute-hydrophobic and hydrophobic-hydrophobic interactions are dominant over solute-hydrophilic and hydrophilic-hydrophilic interactions (Sarkar and Sinha, 2016) as shown in Fig. 6 (a and b).
Thermodynamic properties depend on the nature of the interacting group which is different in these drug molecules (CP, AP and GS) as shown in Fig. 5.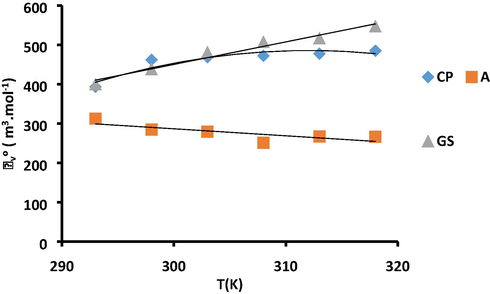
Plot of
v/s T for CP, AP and GS in aqueous system.
The temperature dependence of
in aq and aqueous polymer systems (aq-PEG and aq-PVP) can be expressed by follows the polynomial Eq. (7),
The α coefficients values for drugs are obtained from the following equations in the temperature ranges under the investigation Table 10.
Solvent 1% (w/v)
“α” coefficients of drugs
Chloroquine phosphate
Aqueous
− 21,137
138.58
−0.2221
PEG
−1254.4
8.1854
−0.0093
PVP
−37305
214.67
−0.3346
Acefylline piperazine
Aqueous
2622.8
− 14.304
0.0217
PEG
10,439
65.012
−0.0987
PVP
−2061.7
11.679
−0.0135
Gentamicin sulfate
Aqueous
−12,836
81.528
−0.1241
PEG
−19,795
106.38
−0.1669
PVP
−2161.8
12.032
−0.0271
Partial molar expansibilities ( is considered as an important parameter for the illustration of solute–solvent interactions and it also helps in the interpretation of the long-range structure making or breaking properties of solutes (Millero, 1969; Rafiee and Frouzesh, 2017).
The presence and absence of the caging or packing effect can be evaluated by the increasing and decreasing trend of
with respect to temperature
Partial molar expansibilities were calculated from the polynomial fits of Eq. (8) and given in Table 11. The decreased in values of
with the rise in temperature were obtained for CP drug in aq and aq-polymer systems that indicate the dominance of hydrophobic hydration over the electrostriction of solvent molecules around the solute molecules (Delgadoet al., 2010). This behavior also indicates that the interactions of drugs molecules between the solvent molecules decreased at high-temperature. This phenomenon may be explained by the reason that at high-temperature molecular thermal motion exaggerated and interaction of drug molecules between solvent molecules is weakened. So the structural difference between drug solution and solvent reduces progressively. This decreased also ascribed to the absence of caging or packing effect.
Solvent 1% (w/v)
, m3.mol-1at different temperatures (K).
293.15
298.15
303.15
308.15
313.15
318.15
Chloroquine phosphate
Aqueous
08.429 ± 0.001c
06.208 ± 0.001c
03.987 ± 0.001b
01.766 ± 0.001b
−00.454 ± 0.001a
−02.676 ± 0.001a
PEG
02.736 ± 0.000a
02.642 ± 0.000a
02.549 ± 0.000a
02.457 ± 0.000a
02.364 ± 0.000b
02.271 ± 0.000b
PVP
18.600 ± 0.000b
15.260 ± 0.000b
11.910 ± 0.000c
08.566 ± 0.000c
05.220 ± 0.000c
01.874 ± 0.000c
Acefylline piperazine
Aqueous
−01.588 ± 0.001a
−01.371 ± 0.001a
−01.154 ± 0.001a
−00.937 ± 0.001a
−00.720 ± 0.001a
−00.503 ± 0.001a
PEG
07.174 ± 0.000c
06.187 ± 0.000c
05.199 ± 0.000c
04.213 ± 0.000c
03.226 ± 0.000c
02.239 ± 0.000c
PVP
03.768 ± 0.000b
03.633 ± 0.000b
03.498 ± 0.000b
03.363 ± 0.000b
03.228 ± 0.000b
03.093 ± 0.000b
Gentamicin sulfate
Aqueous
08.805 ± 0.004b
07.564 ± 0.004b
06.323 ± 0.004b
05.082 ± 0.004b
03.841 ± 0.004b
02.600 ± 0.004b
PEG
08.577 ± 0.001c
06.908 ± 0.001c
05.239 ± 0.001c
03.569 ± 0.001c
01.901 ± 0.001c
00.232 ± 0.001c
PVP
−03.849 ± 0.000a
−04.119 ± 0.000a
−04.391 ± 0.000a
−04.662 ± 0.000a
−04.933 ± 0.000a
−05.204 ± 0.000a
Hepler established a thermodynamic expression developed as given Eq. (9), to elaborate whether the solute (drug) will behave as a structure maker/ breaker in different solvent system.
The sign of (∂2 /∂T2) p with respect to temperature (∂2 /∂T2) p was used to decide the structure making/breaking effect by the help of apparent molar volumes. According to Hepler’s criterion, the behavior of the second derivative of the partial molar volume at infinite dilution with respect to temperature is associated with the hydrophilic and hydrophobic character of the solute. The hydrophobic effects are caused by hydrophobic parts of the solute and their variations provide knowledge about the solvent–solvent interactions and this type of hydration is different as compared to the usual solute–solvent interactions. Unlike the next shell of water molecules drug’s hydrophobic part does not orient the molecules present in the surrounding. Therefore, water molecules interact via strong H-bonds with their adjacent water molecules and formed a compact water structure that surrounds the drug molecules. Large and more hydrophobic structures of drug enhance this effect. The interaction between drug and water occurs only by intermolecular H-bonding and this H-bond formation caused the decline in as a result of the reduction in the inter-atomic distances. The data of represent that GS has the highest values in aq while AP has the lowest values at all studied temperatures. The AP-aq H-bond formation was strong as compared to CP-aq and GS-aq due to the presence of solvated anions. This also confirmed from the low values of and it also evident that linearly depend on the extent of hydrogen bonding. Usually, are found to be high for the drugs which having high molar masses and larger sizes. Strength of drug-water molecules hydrogen bonding leads to small values of the .
On the basis of Hepler’s criterion, it can be evaluated that the sign of (∂2 /∂T2) p will be negative for structure breaking solute, whereas the positive sign shows the structure making behavior of solute. Chaotropes or structure breakers are the solute which is weakly hydrated whereas, kosmotropes or structure promoters are strongly hydrated solutes.
The negative values of Hepler’s criterion for CP in aq, aq-PEG and aq-PVP was calculated and are given in Table 12, conclude the structure breaking nature of CP drug in all studied solvent systems.
Solvent 1% (w/v)
‘(
/∂
)P’ ×10-1, m3.mol-1at different temperatures (K).
293.15
298.15
303.15
308.15
313.15
318.15
Chloroquine phosphate
Aqueous
−13.011 ± 0.004a
−13.241 ± 0.004a
−13.462 ± 0.004a
−13.680 ± 0.004a
−13.910 ± 0.004a
−14.121 ± 0.004a
PEG
−00.545 ± 0.004b
−00.554 ± 0.004b
−00.563 ± 0.004b
−00.573 ± 0.004b
−00.582 ± 0.004b
−00.592 ± 0.004b
PVP
−19.610 ± 0.012c
−19.940 ± 0.000c
−20.280 ± 0.000c
−20.610 ± 0.000c
−20.950 ± 0.000c
−21.280 ± 0.000c
Acefylline piperazine
Aqueous
0.1272 ± 0.003a
01.293 ± 0.003a
01.315 ± 0.003a
01.337 ± 0.003a
01.358 ± 0.003a
01.380 ± 0.003a
PEG
−05.783 ± 0.001b
−05.882 ± 0.001b
−05.981 ± 0.001b
−06.080 ± 0.001b
−06.179 ± 0.001b
−06.277 ± 0.001b
PVP
−07.911 ± 0.000c
−08.046 ± 0.000c
−08.181 ± 0.000c
−08.316 ± 0.000c
−08.451 ± 0.000c
−08.586 ± 0.000c
Gentamicin sulfate
Aqueous
−07.272 ± 0.013a
−07.396 ± 0.013a
−07.521 ± 0.013a
−07.645 ± 0.013a
−07.769 ± 0.013a
−07.893 ± 0.013a
PEG
−09.780 ± 0.005c
−09.947 ± 0.005c
−10.111 ± 0.005c
−10.280 ± 0.005c
−10.452 ± 0.005c
−10.613 ± 0.005c
PVP
−01.588 ± 0.002b
−01.615 ± 0.002b
−01.642 ± 0.002b
−01.669 ± 0.002b
−01.696 ± 0.002b
−01.723 ± 0.002b
3.2 Volumetric properties of Acefylline piperazine
The calculated values of apparent molar volumes for AP drug solutions in aq, aq-PEG and aq-PVP solvent systems at different temperatures are reported in Tables 4–6. The positive ‘ ’ values of AP drug in aq systems decreased with the increase in drug concentration and also with the elevation of temperature. While an increasing trend was obtained with respect to concentration and temperature which suggests the existence of a great drug-solvent interaction in these solvent systems (Dhondge and Paliwal, 2012).
Table 7, illustrates the increased in values of in aq-polymer solvent systems at different temperatures whereas a decreased in aq system with the rise in temperature. It indicates, AP exhibits more electrostrictive solvation for aqueous polymer systems where solvent molecules are loosely attached to AP and expand by an increase in temperature. Thermal agitation may also be occurred and results in an increase in the kinetic energy of the molecules due to slow desolvation (Dakua and Sinha, 2007).
The magnitude of values of AP follow the sequence Aq > Aq-PVP > Aq-PEG, which designate drug-solvent interactions are maximum in aq as compare to polymer solvent systems. This behavior is slightly different in AP as given in the CP drug. With the variation in solvent system the interaction behavior will also be different for different drug in different solvent systems. Here the positive values of AP were obtained with the increase of temperature again confirm the strong drug-solvent interactions in aq-polymer solvent systems.
The values of Sv which were negative for AP in aq solvent system, while positive in aq-PEG and aq-PVP at varied temperatures are tabulated in Table 8. The high magnitudes of Sv in aq-PEG as compared to the aq and aq-PVP systems representing that drug-drug interaction are strengthened in aq-PEG system. Sv data for AP in aq, aq-PEG and aq-PVP shows a declined trend with temperature suggests that high-temperature decreased in drug-drug interaction.
The magnitude of values of AP was greater than Sv values in aq and aq-PVP solvent systems. This suggests that drug-solvent interaction has preponderance over drug-drug interactions in these systems.
From Eqs. (5) and (6), the values of volume transfer
for AP in aq-PEG and aq-PVP are given in Table 9, which illustrates that the volume transfer was negative at all temperatures (298.15–318.15 K) hence determining the presence of strong solute-hydrophobic and hydrophobic-hydrophobic interactions as represented in Fig. 6(c and d)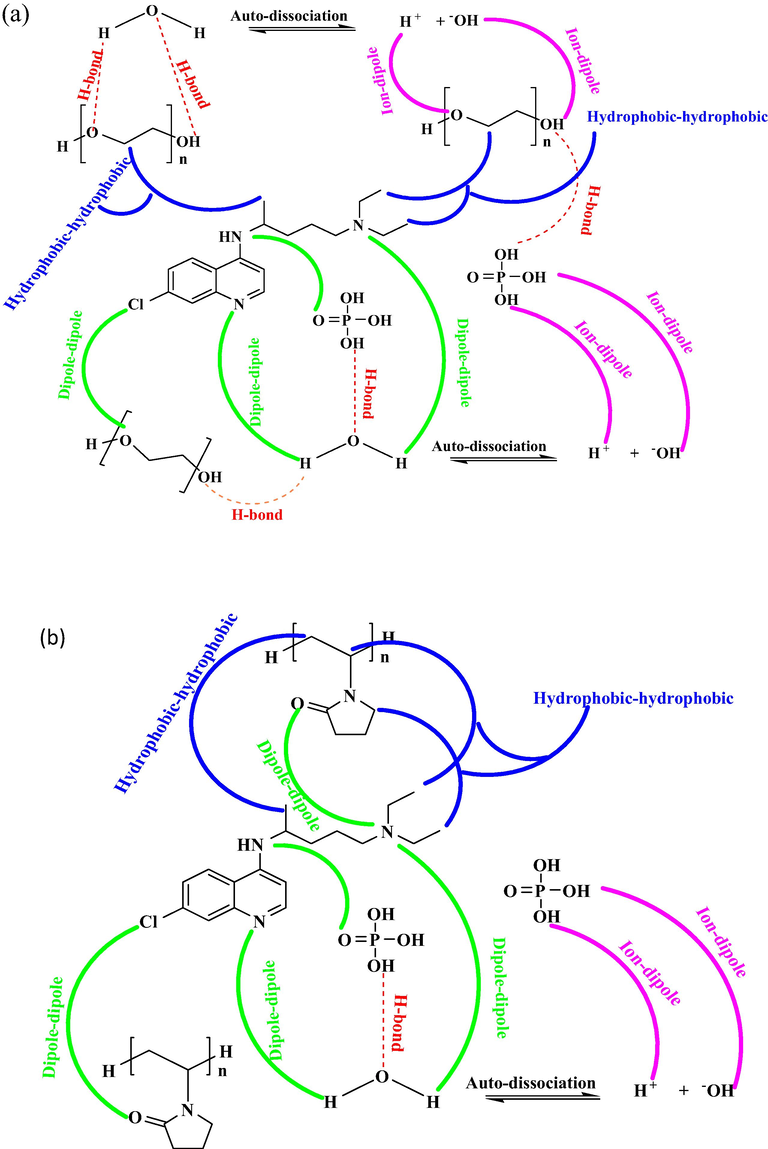
Structural description of different interionic interaction for drugs (a) CP in Aq-PEG (b) CP in Aq-PVP (c) AP in Aq-PEG (d) AP in Aq-PVP (e) GS in Aq-PEG and (f) GS in Aq-PVP.
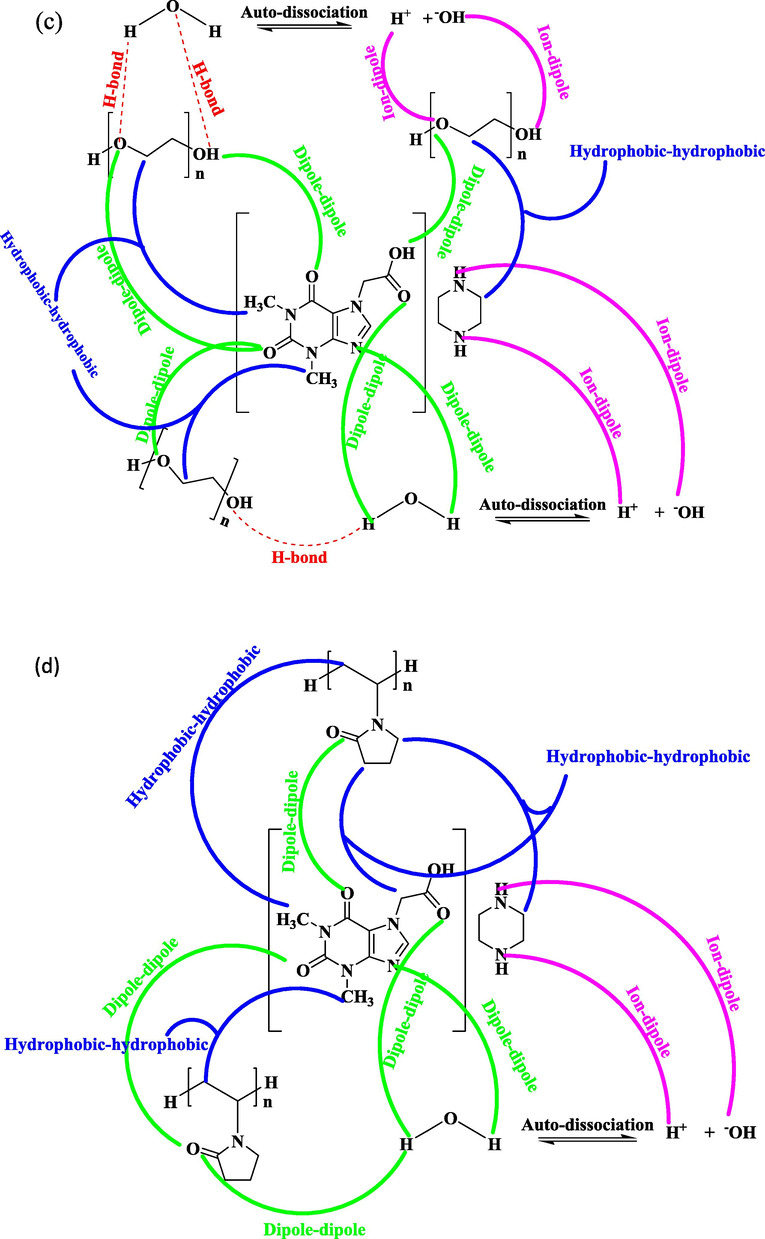
Structural description of different interionic interaction for drugs (a) CP in Aq-PEG (b) CP in Aq-PVP (c) AP in Aq-PEG (d) AP in Aq-PVP (e) GS in Aq-PEG and (f) GS in Aq-PVP.
Structural description of different interionic interaction for drugs (a) CP in Aq-PEG (b) CP in Aq-PVP (c) AP in Aq-PEG (d) AP in Aq-PVP (e) GS in Aq-PEG and (f) GS in Aq-PVP.
Partial molar expansibilities (Eq. (8)) with the rise in temperature were observed for AP in aq-polymeric systems confirm the absence of caging or packing effect. The negative values of for AP that are increased as a function of temperature in aq system showing ascendency of electrostriction of water molecules around drug particles over hydrophobicity. This increased may also be intensified the molecular thermal motion, so the interactions between molecules become weakened and the difference between the solution and solvent structure gradually decreases and represent the presence of caging and packing effect here. (Li and Ren, 2013)
The positive values of Hepler’s criterion from Eq. (9) for AP in aq are given in Table 12, which indicates the structure making nature of solutes. (Li and Ren, 2013; Masood and Rehman, 2018) Similarly, the structure-breaking solutes are accompanied by the negative values of Hepler’s constant at different temperatures as observed for AP in aq-polymeric systems. The structure breaking nature is due to interactions that exist between solute and co-solute, which resulting in the relaxation of electrostriction and hydrated water molecules in surrounding ionic, hydrophobic and hydrophilic solute.
3.3 Volumetric properties of Gentamicin sulfate
Result tabulated in Tables 4–6, for apparent molar volumes of GS drug solutions in studied solvent systems at different temperatures. The ‘ ’ values of GS drug increased with the rise in the concentration drug in and aq-PVP solvent system showing volume expansion and also confirming the drug-solvent interaction are strengthen with the concentration increment. While a decreasing trend of ‘ ’ for GS with temperature elevation aq-PVP solvent system suggesting lowering in the interaction between drug and solvent with the rise in temperature. The data of ‘ ’for GS in aq and aq-PEG was found to be decreased with increase in concentration and increase with the rise in temperature that indicates the high-temperature conditions enhance the drug-solvent interaction here.
It is seen from Table 7, that values were negative and decreased with the increase in temperature in aq-PVP system for GS indicate that the interaction between drug and solvent molecules is weak. The positive and high values of for GS in aq system confirmed that solute–solvent interactions are greater here as compared to aq-polymer solvent systems. The increment in with temperature accretion also shows the decrease in drug-solvent interactions.
The positive values of Sv for GS in aq-polymeric solvent systems at (298.15–318.15 K) temperature are tabulated in Table 8, suggest the strong drug-drug interactions. While Sv data for GS only in aq-PVP shows an increasing trend with respect to temperature evident that high-temperature conditions favor interaction between drug molecules.
The values of volume transfer was calculated by using Eqs. (5) and (6) for GS are given in Table 9, which shows that the volume transfer was negative at all studied temperatures suggesting that solute-hydrophobic and hydrophobic-hydrophobic interactions are existing here.
As data from Eq. (8) represents a decline in the magnitudes with the escalation in temperature for GS in aq, aq-PEG and aq-PVP. This trend suggests the absence of a caging or packing effect.
The negative values of Hepler’s constant (Eq. (9)) at different temperatures were observed for GS in aq and aqueous polymer (aq-PEG and aq-PVP) systems, evident the structure breaking nature of GS in all studied solvent systems which may be due to solute and co-solute interactions, which renders electrostriction relaxation and water molecules become hydrated in surrounding ionic, hydrophobic and hydrophilic solute.
4 Conclusion
Some pharmacological important drugs such as CP that is clinically approved after clinical trials for its efficacy and potent activity against pandemic COVID-19 pneumonia. CP is a cost-effective and safe drug that has variety of assays to inhibit viral duplication in vitro. AP is used to combat lung disease and GS is commonly used as an antibiotic. Physicochemical properties like densities are very important to understand the drug action at the molecular level. By the study of physicochemical properties the action of drug in vivo can be illustrated as these are conducive to elaborate the drug-biopolymer interaction criteria. From the density data, the values of apparent molar volume for these drugs in aqueous, aq-PEG and aq-PVP were within the concentration range 2.0–10.0 × 10⁻² mol.dm−3 at different temperatures (293.15–318.15 K) with an interval of 5 K are calculated by using Masson equation.
The positive values of for CP in aq and aq-PEG show the existence of great interaction between drug and solvent, while negative values in aq-PVP system evident the weak drug-solvent interaction. Positive data of for AP in aq, aq-polymer solvent systems confirms the presence of strong drug-solvent interactions. For GS the drug–solvent interactions are found to be weaker in aq and aq-PVP systems proven from negative values of .
By using values of CP, AP and GS, the limiting apparent molar volumes of transfer from aqueous to aqueous polymer–solvent systems were evaluated which indicates that the hydrophobic-hydrophobic interactions are dominant in the investigated systems.
Drug-drug interactions observed by Sv results confirming the drug-drug interactions for CP, AP and GS are strengthen in the aq-polymer systems than aq systems.
The values of partial molar expansibilities were found to be decreased with the increase in temperature for CP, AP and GS drug evident the absence of packing or caging effect in all studied solvent systems, except for AP in aq system where an increase in values shows the presence of packing or caging effect.
Hepler’s criterion values for AP in aq indicate the structure promoting nature whereas, in aq-PEG and aq-PVP systems structure breaking behavior was observed.
The values of Hepler’s constant were found to be negative for CP and GS in aq and aqueous polymer (aq-PEG and aq-PVP) systems confirm the structure breaking effect of these drug.
Acknowledgement
Summyia Masood (author) is grateful for the research grant provided by the Dean Faculty of science (DFS), university of Karachi and Nabi Qasim pharmaceutical industry for the drug support.
Declaration of Competing Interest
The authors declare that they have no known competing financial interests or personal relationships that could have appeared to influence the work reported in this paper.
References
- J. Adv. Pharm. Technol. Res.. 2016;7(3):80.
- Arabian. J. Chem.. 2019;12:1684.
- J. Mater. Sci. Mater Med.. 2006;17:345.
- Int. J. Antimicrob. Agents.. 2020;55:105932.
- J. Phys. Chem. Liq.. 2007;45:549.
- Rev. C.olomb. Cienc. Quím. Farm.. 2010;39:57.
- J. Chem. Therm.. 2012;45:114.
- Discuss. Faraday. Soc.. 1957;24:133.
- J. Chem. Phy.. 1945;13:493.
- Bioscience. Trends.. 2020;14(1):72.
- J. Pharmaceut. Biomed. Anal.. 2009;50:1037.
- J. Chem. Eng. Data.. 2009;54:2772.
- J. Chem. Thermodyn.. 2009;41:221.
- J. Int. Pharmaceut.. 2008;359:254.
- RSC. Adv.. 2015;5:37553.
- J. Chem. Thermodyn.. 2013;66:14.
- J. Photochem. Photobiol.. 2009;85:848.
- Physical Chemical Principles in the Pharmaceutical Sciences (4th edition). Philadelphia: Lea and Febiger; 1993.
- J. Struct. Chem.. 2018;59:1148.
- J. Mol. Liq.. 2020;303:112611
- J. Phys. Chem.. 1969;73:2417.
- Asian J. Biomed. Pharm. Sci.. 2014;4:22.
- Fluid. Phase. Equilibria.. 2012;334:144.
- J. Res. Med. Sci.. 2013;18(7):601.
- J. Ind.chem.. 2005;44:1582.
- Langmuir.. 2001;17:5375.
- J. Mol. Liq.. 2017;23:6.
- J. Chem. Eng. Data.. 2009;54:312.
- J. Int. Thermophys.. 2008;29:643.
- J. Food. Chemistry.. 2016;211:590.
- J. Int. Research Pure Applied Physics.. 2013;3:10.
- Cell. Research.. 2020;30:269.
- J. Pharm. Sci.. 2008;97:4269.
- Curr. Op. Coll. Interf. Sci.. 2000;5:132.


