

Dual-emitter polymer carbon dots with spectral selection towards nanomolar detection of iron and aluminum ions
⁎Corresponding author. khalid.omer@univsul.edu.iq (Khalid M. Omer)
-
Received: ,
Accepted: ,
This article was originally published by Elsevier and was migrated to Scientific Scholar after the change of Publisher.
Abstract
We report on the spectral selection of excitation wavelength towards selective detection of aluminum and iron ions using dual emission polymer carbon dots (PCDs). PCDs were prepared from glucose and dilute sulfuric acid using one-pot solvothermal method. The PCDs emit blue light at 480 nm when excited at 340 nm, while emit red light at 590 nm when excited with 400 nm. Spectral selection (selection of excited state) showed sensitivity enhancement for detection of some metal ions. The PCDs showed fluorescence enhancement when combined with Al3+ ions with hypsochromic shift centered at 470 nm when excited at 440 nm. While the PCDs selectively quenched via addition of Fe3+ ions, when excited at 400 nm. The wavelength selection of the same carbon dots increases signal to noise ration. The PCDs showed thermo-sensing behavior from 0 °C to 90 °C with reasonably good reversibility. The PCDs acted as fluorescent probes for multicolor (green and yellow) imaging of MCF-7 cells while not inducing cell death, which indicates that the PCDs are biocompatible and nontoxic to the cells. Therefore, the PCDs can be used as probes for cell-imaging applications in vitro and in vivo. The PCDs proved to be a multi-purpose polymer carbon nanomaterial that can used for pharmaceutical analysis, bio-imaging and thermo-sensing while providing high accuracy, selectivity and a limit of detection in the nano range.
Keywords
Polymer carbon dots
Dual emissive fluorescence probe
Tablets analysis
Cancer cell bioimaging

1 Introduction
Carbon dots (CDs) (Baker and Baker, 2010; Zheng et al., 2015; Zhao et al., 2015; Molaei, 2019, 2020) has gained great attention due to its unique characters and wide applications prospect since the first report that has been published by Xu et al. (2004) CDs are nano-sized carbonaceous material with high fluorescent properties. In comparison with organic dyes and conventional semiconductor quantum dots, CDs possess various advantages, such as bright fluorescence, low-cost precursors, facile synthesis, low-toxicity and biocompatibility. Consequently, CDs found applications in many fields such as biosensing (Li et al., 2012; Mohammed and Omer, 2020; Omer and Sartin, 2019; Omer, 2018); photocatalysis (Hutton et al., 2017; Omer et al., 2018a,b), cancer therapy (Hola et al., 2014), and light emitting devices (Ding et al., 2016).
Due to the diverse structures and properties of CDs, it is still tricky and challenging to classify the exact definition of this class of carbon nanomaterial. In literature, CDs encompass a broad family of carbon nanomaterials such as carbon nanodots (Qu et al., 2012; Omer et al., 2019), carbon quantum dots (Hama Aziz et al., 2019); graphene quantum dots (Zhu et al., 2012) and polymer dots (Zhu et al., 2012). The formation processes of CDs are mostly through condensation and polymerization, and the obtained CDs always possess polymeric characteristics, such as abundant various functional groups, highly crosslinked network structure, polydispersity of products, and other properties similar to non-conjugated fluorescent polymers. Therefore, the new concept, polymer carbon dots (PCDs), is put forward to generalize all kinds of CDs based on the summary of related reports (Tao et al., 2017).
Polymer carbon dots (or polymer dots; or carbonized polymer dots), as a new class of highly fluorescent carbon nanomaterials, have attracted tremendous attention over the recent years (Tao et al., 2019, 2017, 2018; Zhu et al., 2014). Polymer carbon dots (PCDs) are nano-sized particles having low carbonization degree with some polymer structures, prepared from small molecules, monomers or polymers by condensation, crosslinking, assembling or slightly carbonization processes (Zhu et al., 2015). Not only do PCDs have high stability due to carbonization process, but also they are much more compatible compared to QDs because of the reserved polymer chains. Moreover, PCDs exhibit low-cost precursors, low-toxicity and can be considered as environmentally friendly nanomaterials (Hill et al., 2016; Xia et al., 2018).
Synthesis of red-emitting fluorescent carbon nanomaterials are scarcely reported in the literature with most of the studies suffering from some drawbacks like low quantum yield, high production costs and sophisticated synthesis methods (Qu et al., 2016; Hu et al., 2015; Sun et al., 2016; Yuan et al., 2017). Moreover, red-emitting stable nanomaterial is most desirable for biosensing, bioimaging and photothermal therapy applications as it has less destructive effects on cells because red emission has less energy compared to blue emission which minimizes cellular damage (Zhang et al., 2019).
Many analytical methods based on molecules and nanomaterials have been reported in literature for detection of aluminum and iron ions (Zhu et al., 2019, 2016, 2020; Gao et al., 2019). However still there is a need for a simple preparation strategy, low-cost precursors, with sensitive and selective method.
In this work, dual-emission PCDs were prepared using facile solvothermal method (Fig. 1). The PCDs produced fluorescence in the blue and red wavelength, even at single wavelength excitation. Spectral selection of excited wavelength was used for sake of sensitivity enhancement. The blue region is enhanced by aluminum ions when excited at 440 nm, while the red emission is quenched via addition of ferric ions when excited at 400 nm. The analytical application of the prepared PCDs as novel fluorescence assay for measuring of Al3+ and Fe3+ ions investigated. Furthermore, the PCDs showed excellent behavior as emitter in bio-imaging.
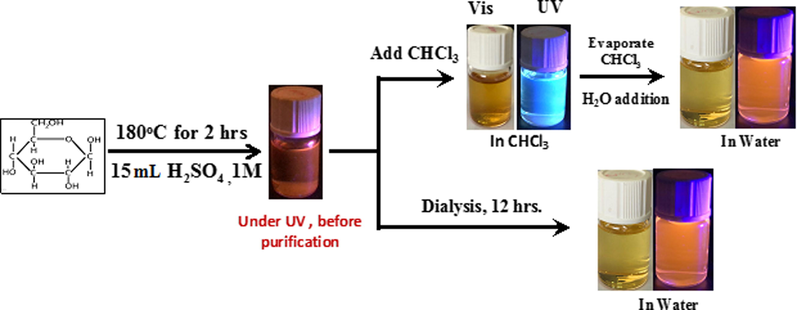
- Scheme of preparation of PCDs.
2 Experimental section
2.1 Chemicals
All the reagents used were of analytical grade purchased from commercial suppliers (Merck and Sigma-Aldrich) and were used without further purification. Urea, uric acid, lactose, sucrose, glucose, ascorbic acid, aluminum (III) nitrate nonahydrate Al(NO3)3·9H2O, iron (III) nitrate nonahydrate Fe(NO3)3·9H2O and all metal salts were purchased from Merck (Darmstadt, Germany). Chloroform and H2SO4 (97%) with ACS grade were purchased from Sigma-Aldrich (Sigma Aldrich, USA).
2.2 Instrumentation
Transmission electron microscope TECNAI G2 F20 microscope (Ames Lab, USA) at 200 kV was used to take TEM images to determine the morphological features and size of particles. The sample preparation involved placing a droplet of the PCDs solution on a copper supported grid then leaving it to dry. Similarly, Thermo Escalab 250 XI X-ray photoelectron spectrometer (Thermo Scientific, USA) was used to generate the XPS data with the survey scan binding energy being 1486.6 eV at 1.0 eV intervals while the data were deconvoluted using CasaXPS® (Ver. 2.3.22). Subsequently, a Cary 60 Spectrophotometer (Agilent Technologies, USA) was used to obtain the UV–Vis absorption spectra. Fluorescence spectra were recorded via Cary Eclipse Fluorescence Spectrophotometer (Agilent Technologies, USA), both the emission and excitations slits were set at 5.0 nm. Empyrean X-ray diffractometer, (PANalytical, Netherland) was used to collect the X-ray diffraction patterns XRD. The functional groups of the PCDs was detected by Fourier transform infrared spectrometer FTIR Nicolet iS50 (Thermo Scientific, USA) through a diamond ATR attachment. The Raman spectra were produced using in Via Reflex (Renishaw, UK) with Nd: YAG laser source at 785 nm (energy output 50mW). The scanning range was from 500 to 3000 cm−1 with a spectral resolution of 2.0 cm−1.
2.3 Synthesis of PCDs
Solvothermal method was used for the preparation of the PCDs. In brief, 0.2 g of glucose was dissolved in 15 mL of 1.0 M H2SO4, then the solution was transferred into a Teflon-lined autoclave and heated at 180 °C for 1 h which resulted in a brown solution. The brown solution was filtered by 0.22 μm filter paper to remove any existing larger particles. Then, it was purified by solvent extraction with Chloroform, and re-suspended with water after the evaporation of Chloroform.
2.4 Determination of the quantum yield
The fluorescence quantum yield (
Where
2.5 Fluorescence assay for iron ions
100 μL of the PCDs solution was mixed with 3 mL of different concentrations of iron solutions. The pH of each solution was adjusted to 5.0 with HCl or NaOH. The fluorescence spectra were recorded 5 mins after mixing in 25 °C. Each measurement was repeated three times for sake of repeatability.
2.6 Analysis of Fe3+ and Al3+ in real samples
20 tablets of iron (Referum®) and antacid (Maalox plus®) were purchased from Sulaimani City pharmaceutical stores and were grounded to make a homogeneous powder mixture. 1.0 g from the powder was dissolved in 15–20 mL of 6.0 M HCl and then heated at 60 °C for 15 min with stirring. The solution was filtered to get rid of non-soluble particles. Finally, the clear solution was completed to 100 mL with DI water for the fluorescence measurement. 100 μL of PCDs solution was mixed with either 1 mL of iron tablet sample or 1 mL of antacid tablet sample, to which different concentrations of Fe3+ and Al3+ standard solutions were added respectively. The content of the added metals in the tablet samples was analyzed using the developed sensing technique and the recovery efficiency was calculated.
2.7 Thermosensing experiment
The temperature of the PCDs solution was adjusted at various temperatures (0, 10, 20, 30, 40, 50, 60, 70, 80 and 90 °C) using a water bath. The duration time of each PCDs solution at each temperature was 10 min, then the fluorescence emission spectra were recorded directly. The temperature variation before and after the fluorescence measurement was ±1.0.
2.8 Cytotoxicity assays
The MCF-7 cells were grown in DMEM containing 10% (v/v) fetal bovine serum, 1% (v/v) penicillin. Then the cells were cultured in a humid environment of 5% CO2 atmosphere at 37 °C. The cellular toxicity of the PCDs was evaluated by MTT assay. MCF-7 cells were cultured in 96-well plates for 24 h under aforementioned situations (3000 cells/100 µL). After eliminating the culture medium, 100 μL of fresh medium containing various amounts of PCDs (0, 0.14, 0.27, 0.54, 0.8, 1.1 and 1.6 mg mL−1) were added into 96-well plates and preserved in an incubator for 20 h. Then, the culture medium was removed and 150 μL of fresh DMEM containing MTT (10% of the added culture medium) (15 μL) added to each well. After 3 h, the supernatant solution was replaced by 100 μL of DMSO to dissolve MTT. The resultant mixture was shaken for 5 min at room temperature. Finally, the optical density of each well was measured at 545/630 nm using a microplate reader. Cell viability (%) was estimated by the following equation: Cell viability (%) = (ODtreated/ODcontrol) × 100%.
Where ODcontrol and ODtreated were attained in the absence and presence of PCDs, respectively.
2.9 Cellular imaging
To investigate the effect of the PCDs on cell imaging, MCF-7 cells were seeded into 6-well plates with an 18 mm glass slide at a cell density of 1 × 10⁴ cells/well and cultured at 37 °C for 48 h. Then MCF-7 cells were treated with different concentrations of PCDs (0, 0.3 and 0.5 mg mL−1) for 9 h incubation at 37 °C. After removing the supernatant, the cells were washed thrice with PBS to eliminate residual PCDs and subsequently fixed with 4% (v/v) formaldehyde.
3 Results and discussion
3.1 Characterization of PCDs
The size, shape and morphology of PCDs were described using transmission electron microscopy (TEM). The TEM image and particle size distribution in (Fig. 2A and B) illustrate that the PCDs have nearly spherical shape and the size of the particles is in the range of 6.0 ± 2 nm. X-ray diffraction pattern (XRD) of the PCDs showed a broad noisy peak centered at around 30° which indicates the presence of graphitic structure of the PCDs (Fig. 2C). This peak can be attributed to the diffraction of the (0 0 2) lattice of graphitic carbon, plainly demonstrating the presence of amorphous carbon (Sarkar et al., 2015; Liang et al., 2013; Omer et al., 2018; Omer and Hassan, 2017). The chemical functional groups on the surface of the PCDs and its chemical composition were characterized using Fourier transform infrared (FTIR) spectroscopy. A broad peak centered at 3250 cm−1 ccorresponds to the stretching vibration bond for (C-OH) groups indicating the presence of hydroxyl groups of carboxylic acid. The presence of stretching and bending vibration bands of C-H is confirmed by the peaks at 2970 cm−1 and 1374 cm−1 respectively (Yang et al., 2011; Durán et al., 2017). The peak at 1710 cm−1 is related to (C=O) stretching vibration, while the absorption peak at 1405 cm−1 is assigned to C=C stretching for aromatic compound. The peaks at 1210 cm−1 and 1168 cm−1 are assigned to C-O-C stretching vibration and C-O stretching vibration respectively (Yang et al., 2011; Huang et al., 2019; Shen et al., 2015; Zhao et al., 2019). All the data from the FTIR spectra provide confirmation that hydroxyl and carbonyl groups are present at the surfaces of the PCDs.
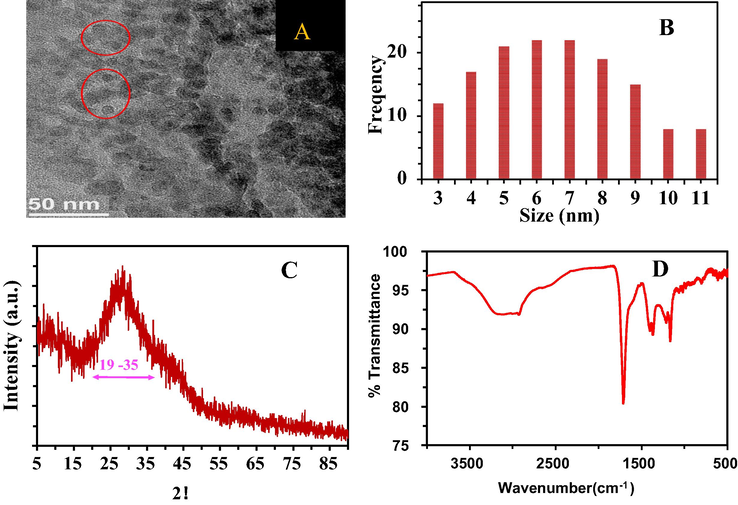
- (A) TEM image of PCDs, (B) histogram of particle size, (C) XRD, (D) FTIR.
In order to further identify the surface chemical composition and the elements doping the PCDs, high resolution X-ray photoelectron spectroscopy (XPS) was carried out. The XPS survey spectra illustrated in Fig. 3A shows two main peaks: O 1 s (531 eV) and C 1 s (286 eV). Resolved C 1 s Spectrum (Fig. 3B) shows three characteristic peaks at 284.5 eV, 286.2 eV and 288.5 eV corresponding to graphitic sp2 C = C, C–O/C − OH and C = O respectively (Omer et al., 2018; Omer and Hassan, 2017; Omer et al., 2019). O 1 s spectrum (Fig. 3C) Shows two peaks centred at 531.3 eV and 533 eV corresponding to C = O and O-H respectively (Omer et al., 2018b).
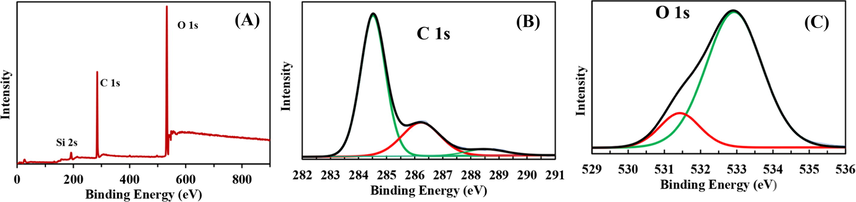
- (A) Survey scan of PCDs, (B) deconvoluted spectra of C 1 s, (C) deconvoluted spectra of O 1 s.
3.2 Optical properties of PCDs
As shown in the UV–Vis spectrum (Fig. 4A), the PCDs solution shows a broad peak centered at 272 nm, which could be attributed to π to π* transition of C = C bonds. The absorption spectrum also exhibits a shoulder around 320 nm, which could be attributed to the n-π* transition of C = O band (Zhang et al., 2016).
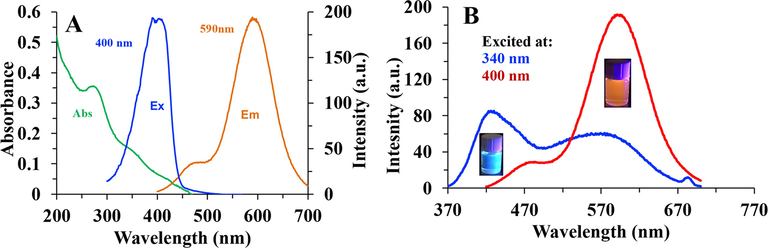
- (A) Absorption, excitation and emission spectra of red PCDs in aqueous solution. The emission spectrum excited at 400 nm. (B) Emission spectra of blue PCDs (excited at 340 nm) and red PCDs (excited at 400 nm).
Steady-state photoluminescence spectra, emission and excitation spectra, of the PCDs solution were recorded at room temperature as shown in Fig. 4A. The emission spectra centered at 590 nm (orange-red emission) when excited at 410 nm, while it produces a shoulder at 470 nm, due to the presence of different emissive states. However, if the solution was excited at 340 nm, a bluish fluorescence due to dual emission could be observed consisting of an emission peak centered at 420 nm and another wider peak centered at around 580 nm. Thus, red emitter is obtained with 390–410 excitation, while bluish emission is achieved with 340 nm excitation light (Fig. 4B).
3.3 Thermo sensing behavior of PCDs
The influence of temperature on the fluorescence emission of the PCDs was investigated. Based on Fig. 5A and C, it is clear that the emission of the PCDs decreases linearly when the temperature is raised. Temperature range from 0 °C to 90 °C was examined and a good correlation coefficient (R2) of 0.9882 on heating and 0.9867 on cooling was observed (Fig. 5B and D). The PCDs showed reasonable reversibility and restorability of fluorescence upon heating, about 75% of fluorescence intensity was restored when the temperature was alternated between 0 °C and 90 °C, which means that heating partially destroys the surface of the PCDs (Wei et al., 2018). Monitoring temperature variation in nano spaces is very important for deep understanding of the reaction mechanism and dynamics in nanosystems.
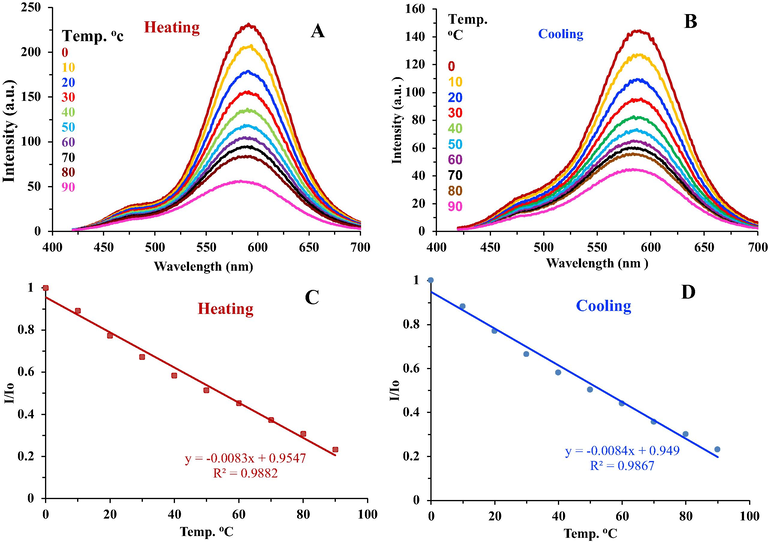
- (A) Fluorescence emission spectra of the PCDs against increasing temperature. (B) Fluorescence emission spectra of the PCDs against decreasing temperature. (C) Calibration graph showing linearity in fluorescence intensity upon heating the PCDs. (D) Calibration graph showing linearity in fluorescence intensity upon cooling the PCDs.
3.4 Analytical applications of the assay for Fe3+ and Al3+
The high intensity fluorescence of the PCDs can be exploited for quantitative analysis of metal ions based on either enhancement or quenching of interference free matrices. In the present work, aluminum and ferric ions were chosen to be determined in pharmaceutical formulations, using the antacid Maalox plus® and the iron supplement Referum® as examples.
Fig. 6 shows the fluorescence spectra and calibration graphs of a series of standard solutions of aluminum and ferric ions, covering the range of 0.75 to 52 μM for Al3+ and the range of 0.38 to 67.5 μM for Fe3+ ions. Linear relationship was obtained with a limit of detection (LOD) of 2.5 nM for Al3+ and 1.7 nM for Fe3+. Furthermore, the limit of quantification (LOQ) has been determined which was 8.25 nM and 5.6 nM for Al3+ and Fe3+ ions respectively. The LOD was calculated based on 3 × standard deviation of blank/ slope, and the LOQ was calculated based on 10 × standard deviation of blank/ slope. A summary of the calculated analytical parameters of both aluminum and ferric ions is presented in Table 1.
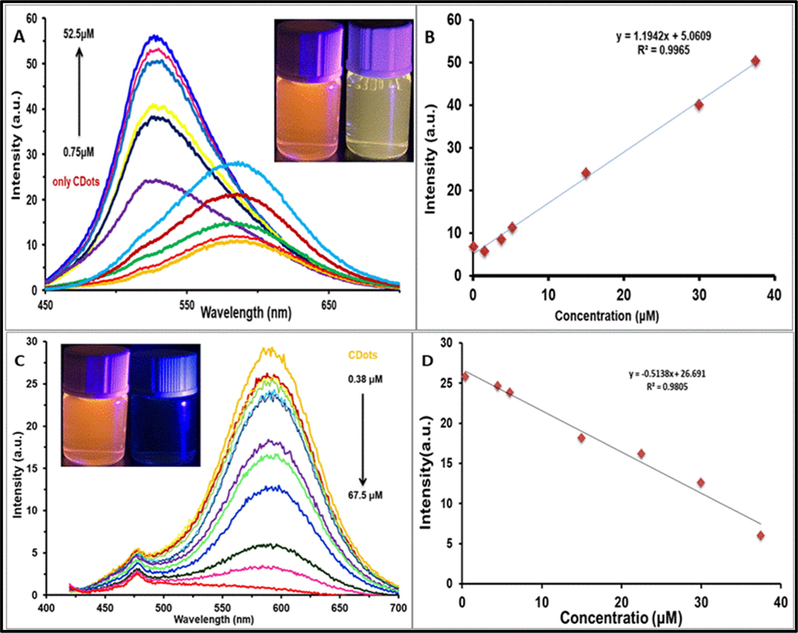
- (A) Emission spectra of PCDs in the presence of different concentrations of Al3+ (from 0.75 to 52 μM) in aqueous solution (Excitation wavelength 440 nm). (B) A plot of PL intensity for different concentration of Al3+ (C) Emission spectra of PCDs in the presence of different concentrations of Fe3+(from 0.38 to 67.5 μM) in aqueous solution (Excitation wavelength 400 nm). (D) A plot of PL intensity for different concentration of Fe3+.
| Precursor | Method | Sample type | LOD | Linear range | Reference |
|---|---|---|---|---|---|
| Lactose | Solvothermal | Drug | 4 nM | – | (Omer and Hassan, 2017) |
| Naringin | Solvothermal | Tap water | 113.8 nM | 0.1 – 38.4 μM | (Wei et al., 2021) |
| Graphene oxide | Solvothermal | Drug | 1.3 μM | 2.5–75 μM | (Fang et al., 2018) |
| Tetracycline | Hydrothermal | Milk | 0.05 μM | – | (Granados et al., 2019) |
| Citric acid & methionine | Thermal oxidation | Tap water | 0.113 μM | 8–20 μM | (Kong et al., 2017) |
| Glucose | Solvothermal | Drug | 2.5 nM | 0.1 – 37 μM | This study |
Nano molar levels as LOD for determination of both aluminum and ferric ions made the present method effective in trace analysis range. It would be useful for the determination of trace elements if interferences were masked or removed successfully. Furthermore, review tables have been established to compare the current proposed method with other nanomaterial-based methods from the literature (Tables 1 & 2).
| Precursor | Method | Sample type | LOD | Linear range | Reference |
|---|---|---|---|---|---|
| L - glutamic acid & ethylenediamine | Microwave | Tap water | 3.8 μM | 8 – 80 μM | (Chen et al., 2020) |
| Glucose & boric acid | Hydrothermal | Tap water | 242 nM | 0 – 16 μM | (Wang et al., 2016) |
| Citric acid & urea | Solvothermal | Tap water | 50 nM | 0.1–0.9 μM | (Omer et al., 2018) |
| Melamine & ethylenediamine | Neutralization heat reaction | Blood | 5.0 nM | 0.01–10.0 μM | (Liu et al., 2018) |
| Carboxymethylcellulose | Solvothermal | Tap water | 0.14 μM | 1 – 400 μM | (Issa et al., 2020) |
| Garlic | Solvothermal | Tap water | 0.2 μM | 0–500 μM | (Sun et al., 2016) |
| Glucose | Solvothermal | Drug | 1.7 nM | 0.3 – 37 μM | This study |
3.5 Specificity study
The red emitter (when excited at 390 nm) was quenched by adding Fe3+ ions, while most of other metal ions did not show any effect, except for Al3+ ions. Not only did Al3+ ions enhance the fluorescence intensity, but they also induced the blue-shift of the fluorescence signal centered at 470 nm (Fig. 7A). It is worth designing a probe based on spectral selectivity via Fe3+ and Al3+ quantification at 590 and 470 nm, respectively.
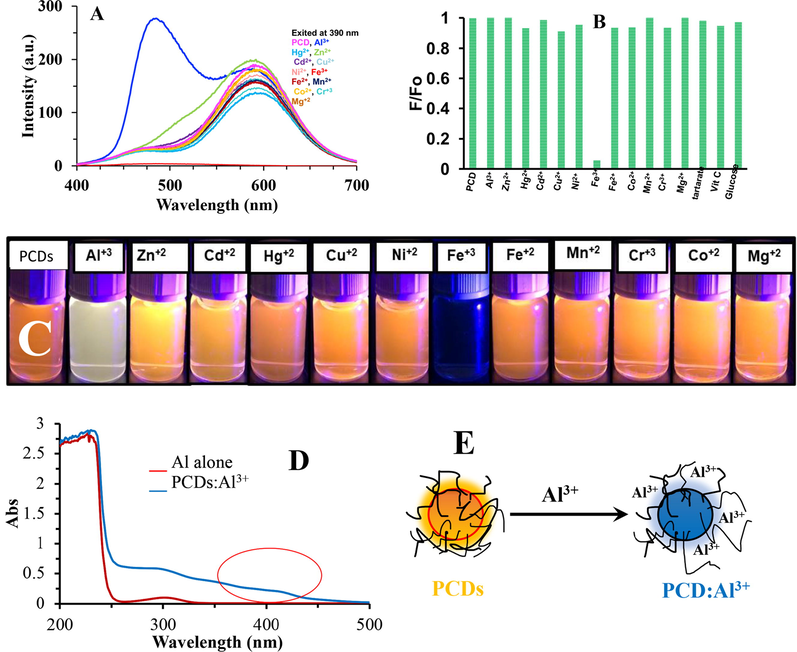
- (A) & (B) Effect of metal ions on PCDs solution when exited at 400 nm. (C) Digital photograph showing the effect of metal ions on PCDs solution. (D) Abortion spectra of PCDs:Al3+ and Al3+ ions alone. (E) Illustration of the fluorescence enhancement with hypsochromic shift upon addition of Al3+ ions.
The absorption spectra of PCDs are shown in the absence and presence of Al3+ (Fig. 7D). It can be noticed that a small broad peak appeared in 415–425 nm. This can be attributed to complexation among functional groups on the PCDs and aluminum ions causing chelation-enhanced fluorescence (Omer and Hassan, 2017). However, improving probe selectivity is not only possible by selecting the emission wavelength, but also by masking or removing interfering ions. The quenching mechanism of Fe3+ ions is related to the both static and dynamic quenching as is common in literature (Mohammed and Omer, 2020; Omer and Sartin, 2019; Omer et al., 2019).
3.6 Determination of aluminum in antacid tablets (Maalox plus ®) and iron tablets (Referum ®)
Different types of antacid and iron tablets were purchased from local pharmacies and were used for the analysis which are free from quencher metals. The two sample solutions contain organic compounds as constituents (excipients), such as vitamin C, sugars, with metals and the ions Na+, Mg2+, Ca2+, and Cl-. They were tested and showed no effect on the fluorescence emission. Standard addition method was used for the determination of aluminum and ferric ions in real samples in order to minimize the matrix effect, as shown in Figure S1. The recovery of Al3+ in the spiked samples was in the range of 93–103% while for Fe3+ it was in the range of 94–102% (Table 2), assigning for little interference of the excipients in the iron and antacid tablets samples. The experimental results prove that the fluorescent PCDs can be used successfully for determination of Al3+ and Fe3+ in real samples based on spike recovery results. The effect of pHs were also examined for detection of Al3+ and Fe3+ ions, as shown in Supplementary file (Figure S2). It is shown that, there assay is linear from pH 2 to pH 7 due to the stability of the PCDs. However, after pH 7, both Al3+ and Fe3+ ions tend to make precipitate with hydroxide ions.
3.7 Bioimaging
In order to investigate the toxicity of PCDs for MCF-7 cells, PCDs were added to MCF-7 cells at increasing concentrations (0.14 to 1.6 mg mL−1). The viability of the cells was assessed after 24 h of incubation at 37 °C. As shown in Fig. 8, PCDs displayed non-toxic nature at concentrations up to 0.54 mg mL−1. These results exhibited that the as-fabricated PCDs can be utilized as a suitable fluorescent probe for MCF-7 imaging enhancing the analytical performances of fluorescence methods. Fig. 9(a-d) shows confocal laser scanning microscopic images for control cells. Fig. 9(e-l) demonstrates that after incubation of PCDs at a concentration of 0.3 mg mL−1 for 9 h, the strong green and yellow fluorescence were emitted. It can be observed that PCDs mainly distributed in MCF-7 cells membrane and the cytoplasm.
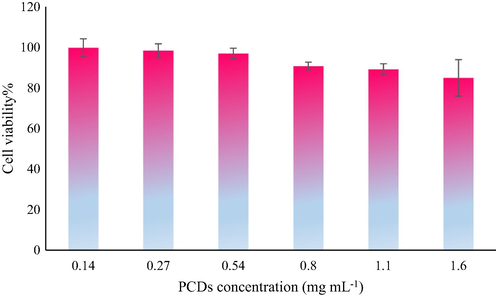
- Graph displaying percentage viability versus concentration of PCDs using MTT assay.
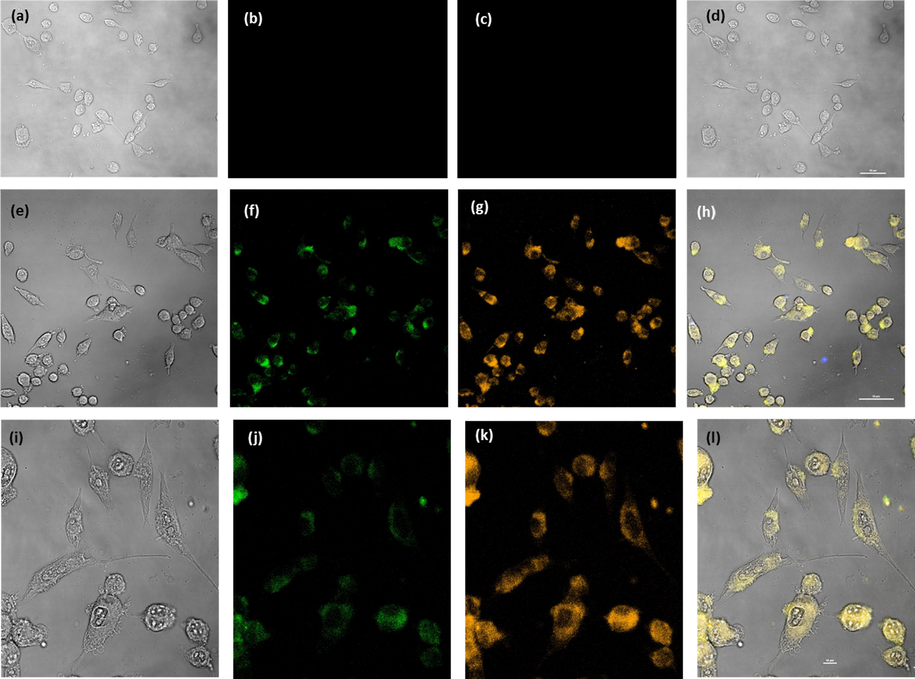
- Confocal laser scanning microscopic images of MCF-7: control (a-f) cells and cells treated with 0.3 mg mL−1 of PCDs (e-l) excitation by bright field (a, e & i), green (b, f & j), yellow (c, g & k), and Merge (d, h & l).
4 Conclusion
In summary, the PCDs were synthesized through a facile hydrothermal route serving as a dual Red/Blue emitter. The PCDs proved to be a multi-purpose nanomaterial that can used for pharmaceutical analysis, bio-imaging and thermo-sensing while providing high accuracy, selectivity, stability, and a limit of detection within the nano range. Utilization of the PCDs for pharmaceutical analysis application exploits the fact the aluminum ions enhance its florescence while causing a blue shift in the peak at 470 nm, on the other hand, iron ions can quench the intensity of florescence. Excitation wavelength selection is the key issue for enhancing the sensitivity of target analysis. PCDs revealed great biocompatibility for imaging of MCF-7 cells and presented non-toxic behavior toward MCF-7 cells. Moreover, the uptake of PCDs into MCF-7 cells was proved by confocal laser scanning microscopy. Confocal imaging validated that the PCDs were efficiently internalized by the cells while strong green and yellow fluorescence validated that the PCDs can be exploited as good candidates for biomedical usages. The thermo-sensing capabilities of the PCDs were confirmed over the range of 0–90 °C for both cooling and heating processes while showing decent reversibility. Hence, the current work provides a novel and inexpensive probe with high potential for bio-medical and analytical applications.
Acknowledgement
This research was supported by the research office of University of Sulaimani and University of Kurdistan. The corporation of Tehran medical University for bioimaging experiments is kindly acknowledged.
Declaration of Competing Interest
The authors declare that they have no known competing financial interests or personal relationships that could have appeared to influence the work reported in this paper.


