Translate this page into:
Dual functions of nitrogen and phosphorus co-doped carbon dots for drug-targeted delivery and two-photon cell imaging
⁎Corresponding authors. genglina0102@126.com (Lina Geng), lyh5615@163.com (Yuhua Lei)
-
Received: ,
Accepted: ,
This article was originally published by Elsevier and was migrated to Scientific Scholar after the change of Publisher.
Abstract
Heteroatom-doping carbon dots (CDs) have excellent fluorescence properties. In the paper, nitrogen (N) and phosphorus (P) co-doped CDs (N, P-CDs) were prepared through the hydrothermal method and characterized by TEM, PXRD, FT-IR, 13C NMR, XPS, UV–vis, and fluorescence spectra. The optical properties and drug (doxorubicin) - delivery performance of N, P-CDs were also studied. The results showed that the average size of N, P-CDs was 3.64 nm and the quantum yield was 30 %. The N, P-CDs had down- and up-conversion fluorescence properties, and the luminescence mechanism of the N, P-CDs was explained. The drug loading capacity of N, P-CDs was 39.11 %, and the drug delivery system (N, P-CDs-DOX) had low cytotoxicity, sustained release, and pH-targeted properties. The in vitro release of N, P-CDs-DOX belonged to the Weibull model and Fick diffusion, exhibiting the same release model and mechanism with free DOX. The N, P-CDs could deliver DOX successfully, which was demonstrated by the co-collocation of N, P-CDs and DOX in SH-SY5Y cells through single/two-photon imaging. N, P-CDs could potentially be used in drug-targeted delivery and cell imaging.
Keywords
Carbon dots
Up-conversion
Two-photon imaging
In vitro release
1 Introduction
Carbon dots (CDs) had many excellent properties, such as good solubility, high biocompatibility, chemical stability and unique optical properties(Myint et al., 2018). They had a wide potential usage in many fields of sensors(Liu et al., 2019, Wang et al., 2022a), antimicrobial(Nichols et al., 2020), therapeutics(Wang et al., 2021), and drug delivery (Zhang et al., 2019, Hettiarachchi et al., 2021), and so on. The significant disadvantages of CDs were the low quantum yield (QY), needed for UV excitation, and blue fluorescence emission; those all limited the usage of biological systems. Recently, doping with heteroatoms was the most crucial way to eliminate photoluminescence defects in CDs (Li and Dong 2019, Zhang et al., 2021). Because doping of heteroatoms could effectively change the intrinsic properties of CDs, such as electronic characteristics and chemical characteristics of the local surface, producing new surface defects and increasing the number of energy traps(Zhang et al., 2014). It demonstrated that doped-CDs had higher quantum yield, longer fluorescence lifetime, red-shift emission spectrum, and lower toxicity than undoped CDs. However, the drug-loading and optical properties of doped-CDs need to be improved.
The nitrogen atom was the first heteroatom doped in CDs in 2012(Li et al., 2012), and subsequently other heteroatoms doping of S, P, B, Zn, Mn, Co, Mg, Fe, Yb, Nd, and so on had been reported. Nitrogen atoms had advantages in doping, had a radius and surface status similar to that of the C atom, and could enter the intrinsic structure of CDs (Li et al., 2021). By doping N, the performance of CDs improved, reflected mainly in improved quantum yield, adjustable emission spectrum, and reduced toxicity (Yang et al., 2015, Lee et al., 2016, Wang et al., 2022b). On the contrary, the phosphorus atom cannot enter into the intrinsic structure of CDs due to the large radius of P, and the emission wavelength of CDs often redshifts through doping of P(Zhou et al., 2017). In addition, P has more extranuclear electrons than C. Barman reported that n-type doping (P atom doping) could provide excess electron to N-CDs that can increase the radiative relaxation pathway and induce a high decay time and QY(Barman et al., 2014). The N and P co-doped CDs (N, P-CDs) had excellent fluorescence characteristics, such as low biotoxicity and good biocompatibility. N, P-CDs were used for in vivo imaging(Tu et al., 2021), for detecting reactive oxygen and nitrogen species in real time (Gong et al., 2016a), and for examining Fe3+ in cancer cells (Zhang et al., 2014). Presently, N, P-doped carbon dots with excellent optical properties, such as high QY and up-conversion fluorescence, have aroused the interest of researchers.
CDs with up-conversion properties were essential in biological imaging and drug loading. Up-conversion was a multi-photon activation process, in which two or more photons were absorbed simultaneously to emit light of a shorter wavelength, showing the emission wavelength of the fluorescence was shorter than the excitation wavelength(Hwang et al., 2014, Jiang et al., 2016). CDs with up-conversion properties usually possess two-photon fluorescence imaging capabilities, and two-photon imaging has several advantages, including strong penetration for deep tissue, dark-field imaging, avoiding fluorescence bleaching, phototoxicity, and autofluorescence interference (Ansari et al., 2021), that was superior than the UV-excited CDs. Therefore, the preparation and related research of CDs with up-conversion performance are worth studying.
Currently, the poor target specificity of anticancer drugs is non-targeting, which induces many side effects (Li et al., 2016). The targeting release of anticancer drugs is essential in the clinic (Venugopalarao et al., 2015, Pandey et al., 2017). Doxorubicin hydrochloride (DOX) is an anthracycline and a broad-spectrum antitumor agent commonly used in the clinic. Although DOX can kill cancer cells, it damages normal cells at the same time, which reduces the effectiveness of the drug and causes serious side effects in the body. Therefore, the selection of appropriate drug-loaded DOX for intracellular transport can improve the efficiency of cancer treatment and reduce side effects(Supasena et al., 2020).
The safety and efficacy of the drug delivery system were important and could be evaluated by the in vitro - in vivo correlation. In vitro release of the drug-delivery system could predict drug release in vivo, and save experiment time and cost. The common dynamics models are the zero-order model, first-order kinetic model, Weibull model, Higuchi and Ritger-Peppas model(Shi et al., 2021). Zero-order release is an ideal release rule of controlled release preparation, which is not affected by release conditions. The first-order kinetic model is suitable for describing the dissolution of water-soluble drugs in the porous polymer matrix. The Weibull model is the most widely used and a probabilistic model, which is ideal for simulating in vitro release of various systems. The Higuchi model is ideal for describing the kinetic process of drug release in a porous matrix system. The Ritger-Peppas model is often used to determine the release mechanism, including Fick diffusion and non-Fick diffusion. To the best of our knowledge, the nitrogen and phosphorus co-doped carbon dots used for drug-targeted delivery and two-photon cell imaging was not reported.
Based on the above research background, it was expected to obtain the multifunctional doped–CDs, which had both down-conversion and up-conversion fluorescence characteristics and could be used for single-photon and two-photon image or targeted drug delivery. In this paper, co-doped carbon dots of N and P (N, P-CDs) were prepared by citric acid, urea, and Na2HPO4 and characterized by TEM, XRD, FT-IR, 13C NMR, XPS, UV, and fluorescence spectra. Then, N, P-CDs were used to carry DOX, and the drug loading efficacy, cell cytotoxicity, and colocation were studied in SH-SY5Y cells. The fluorescence propertied, drug loading mechanism, pH targeting, and in vitro drug release of N, P-CDs were also discussed.
2 Experimental
2.1 Preparation of N, P-CDs
Citric acid (CA), urea and disodium hydrogen phosphate (Na2HPO4) (molar ratio of nCA: nurea: nNa2HPO4 = 1:1:0.1, 1:1:0.3, 1:1:0.5, 1:1:0.7, 1:1:1, 1:1:2) were dissolved in double-distilled water. The solution was transferred to a Teflon reactor and the hydrothermal reaction was carried out at 200 ℃ for 10 h. After the reactor cooled naturally to room temperature, the brown solution of N, P-CDs was obtained. The N, P-CDs solution was filtered to remove large particles of precipitation and centrifuged for 10 min at 4000 rpm/min. The supernatant was then dialyzed in a dialysis bag (MWCO = 1000 Da) and stored at 4℃ in a refrigerator for use.
2.2 Characterization of N, P-CDs
The micromorphology was detected under transmission electron microscopy (TEM) with a 100SX system (Hitachi, Japan). The amorphous state of N, P-CDs was examined by powder X-ray diffraction (PXRD) with Cu Ka radiation, (l = 1.54178 Å, Bruker, Karlsruhe, Germany). Fourier transform infrared spectra were recorded at 500–4000 cm−1 using KBr pellets by Shimadzu 8900 spectrophotometer. 13C nuclear magnetic resonance (13C NMR) was carried out on a Bruker spectrometer (500.13 MHz). X-ray Photoelectron Spectroscopy (XPS) detection was performed on an ESCALAB 250Xi X-ray Photoelectron Spectrometer microprobe with a monochromatic Al-K X-ray source (h = 1486.68 eV) (Thermo Fisher, Waltham, MA, USA). UV–vis absorption spectra were recorded on a UV–vis spectrophotometer (Cary 60, Agilent Technologies, USA), and photoluminescence (PL) spectra were measured through the fluorescence spectrophotometer (F-4600, Hitachi).
2.3 Preparation of N, P-CDs-DOX
The drug-loading of N, P-CDs for DOX was prepared according to our previous method (Zhang et al., 2019). In brief, N, P-CDs and DOX solutions were mixed in different mass ratios of 1:0.5, 1:1, 1:1.2, 1:1.5, and 1:2, respectively, and shacked on an oscillator for 12 h. Then the free DOX was removed by dialysis (MWCO = 1000 Da), and N, P-CDs-DOX was obtained (Scheme 1). The drug loading capacity was calculated using formula (1):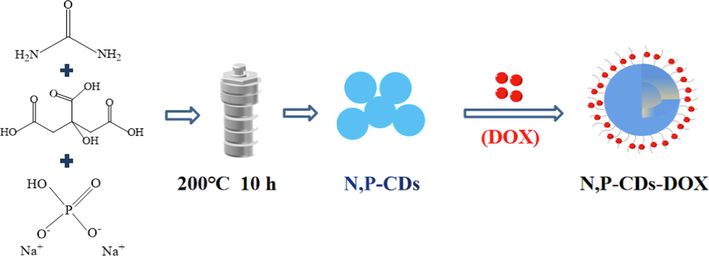
The synthesis of N, P-CDs-DOX.
2.4 Release model and mechanism N, P-CDs-DOX in vitro
In vitro release of N, P-CDs-DOX was carried out in different pH buffers (PBS, pH = 5.0, 6.5, and 7.4). The process was as follows: 2 mL of N, P-CDs-DOX solution was injected into dialysis and placed into 80 mL of release medium (PBS buffer, pH = 5.0, 6.5, or 7.4). 2 mL of the release medium was taken out every 1 h to measure UV absorption, and 2 mL of fresh release medium was replenished simultaneously.
The accumulative delivery amount was calculated according to our previous method (Zhang et al., 2019).
The release data were fit by different mathematical models, including Zero-order kinetics, First-order kinetics, Weibull equation, Ritger-Peppas equation, and Higuchi equation. The release model of N, P-CDs-DOX was evaluated according to the fitting degree (R2), and the release mechanism was judged by the n value in the fitting data of the Ritger-Peppas equation (Wang et al., 2019).
2.5 MTT assays
Cell cytotoxicity of N, P-CDs-DOX was tested by MTT assays, compared to the control groups, N, P-CDs and DOX groups. Different concentrations of N,P-CDs-DOX, N,P-CDs and DOX (0 μg/mL, 0.625 μg/mL, 1.25 μg/mL, 2.5 μg/mL, 5 μg/mL) incubated with SH-SY5Y cells, respectively, for 24 h. And then, the cells were washed with PBS and incubated with MTT solution (5 mg/mL) for four hours. Subsequently, the incubating solution was sucked out, and dimethylsulfoxide (DMSO) was added to the cells. The absorbance of 490 nm was detected using a multi-label counter (BioTek, USA).
2.6 Fluorescence colocalization
SH-SY5Y cells were incubated with N,P-CDs-DOX (1.25 μg/mL) for 3 h, and then the culture medium was sucked out and the cells were washed with PBS buffer three times. The fluorescence of N, P-CDs and DOX was observed at the exited wavelengths of 700 nm and 488 nm, respectively, under laser confocal microscopy (Olympus FV1000, Japan).
3 Results and discussion
3.1 Characterization of N, P-CDs
In the experiments, the N, P-CDs had the maximum quantum yield (QY) of 30 % at the molar ratio of nCA: nurea: nNa2HPO4 = 1:1:0.7, according to the reference method to quinine sulfate (Zhang et al., 2019). Compared to the reported literature (QY = 15 %) (Du et al., 2018), the quantum yield of N, P-CDs was higher. This N, P-CDs was used for the next experiments.
The TEM image showed that N, P-CDs were almost spherical particles with good monodispersity. The inset was the particle size distribution map by measuring 100 particles with a size distribution of 2.0–6.0 nm, and the average size of N, P-CDs was 3.64 nm (Fig. 1A). In the XRD spectrogram, the diffraction peak appeared at 2θ = 24° and 32°, that suggested some CDs were amorphous while some showed crystallinity with different lattice spacings (Sun et al., 2015) (Fig. 1B).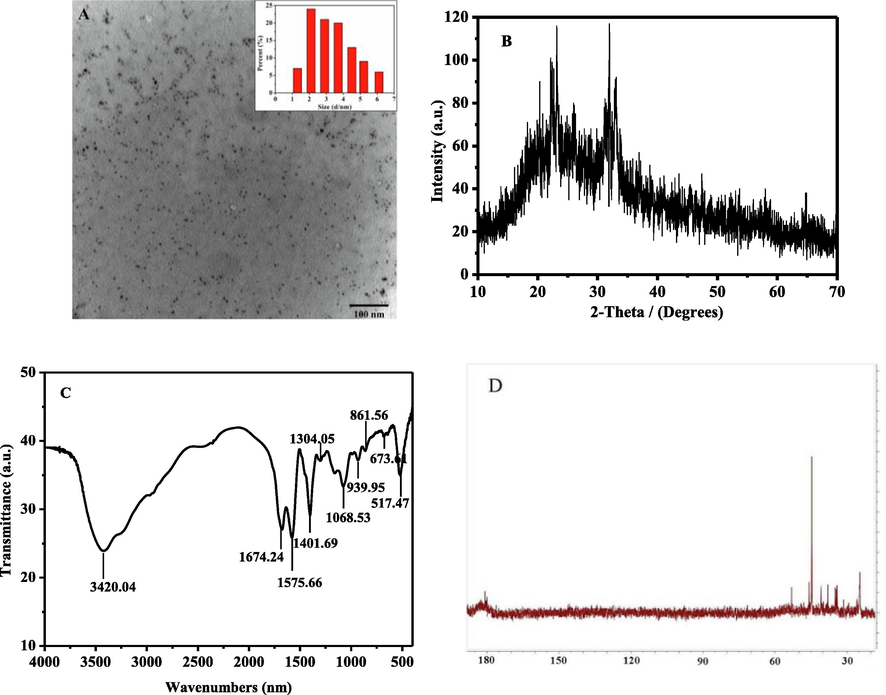
Characterization of N,P-CDs: (A) TEM, (B) XRD pattern, (C) FT-IR spectra, and (D) 13C NMR spectrum.
As shown in the FT-IR spectrum (Fig. 1C), the broad and intense peak at around 3420 cm−1 may be attributed to the stretching vibrations of O—H and N—H, indicating that the hydroxyl groups were present as surface functional groups of N, P-CDs. Concurrently, the peaks at 1647 cm−1 indicated the presence of –C⚌O groups. The peak at 1575 cm−1, 1304 cm−1, 1068 cm−1, 939 cm−1, 673 cm−1, could be attributed to the stretching vibrations of C⚌N, P⚌O, P—O—R, P—N and P—C (Ananthanarayanan et al., 2015, Gong et al., 2016b). These results indicated that nitrogen and phosphorus atoms had been successfully doped into the CDs. Moreover, N, P-CDs had good solubility as a result of the hydrophilic groups, such as the hydroxyl, carboxyl, and amino groups on the surface.
The hybrid state of the carbon atom in N, P-CDs was shown in the 13C NMR spectrum(Jia et al., 2012): the strong signal between 20 and 60 ppm was attributed to the sp3 hybridized carbon atoms of aliphatic and aliphatic bonded to electronegative nitrogen/oxygen atoms; and the weak signal about 170–185 ppm belonged to sp2 -hybridized carbon atoms of carboxyl/amide (Qu et al., 2012) (Fig. 1D).
XPS is a sensitive analysis method for studying the surface of the material that provides the elemental composition and function groups of the surface. From the full spectra of N, P-CDs (Fig. 2A), four apparent peaks at 285 eV, 400 eV, 531 eV, and 133 eV were attributed to C1s, N1s, O1s, and P2p, respectively. As shown in Fig. 2B, The high-resolution spectra band C1s can be deconvoluted into three peaks at 284.78 eV, 286.01 eV, and 288.21 eV representing C—C/C⚌C, C—N/C—P⚌O, and C⚌O/C⚌N, respectively (Parvin and Mandal 2017). As shown in Fig. 2C, The N1s band can be deconvoluted into three peaks at 399.76 eV and 401.15 eV representing N—H, and N—N/P—N (Huang et al., 2018). As shown in Fig. 2D, the O1s band can be deconvoluted into two peaks at 530.83 and 531.93 eV representing N—O and C—O (Sahu et al., 2012, Zhang et al., 2012). As shown in Fig. 2E, the P 2p band can be deconvoluted into three peaks at 133 eV and 134 eV indicating P—O and P—C/P—N (Yu et al., 2017). These results were consistent with those of the FT-IR spectra.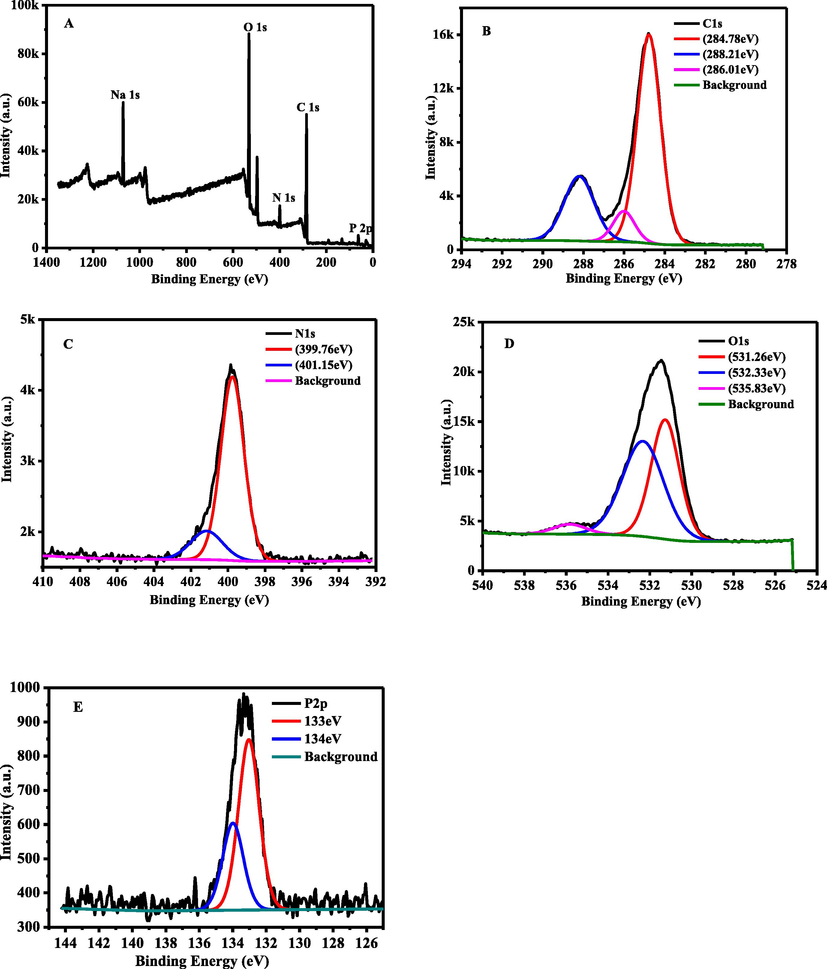
XPS of N,P-CDs: (A) Full spectrum, (B) C1s spectrum, (C) N1s spectrum, (D) O1s spectrum, and (E) P2p spectrum.
3.2 Optical properties of N, P-CDs
In the UV–vis absorption spectrum, the N, P-CDs exhibited a typical absorption peak at 330 nm that corresponded to the n -π* transition of C⚌O. The optimal excitation and emission spectra were 320 nm and 420 nm, respectively, with pleasing symmetry (Fig. 3A). The emission spectra of N, P-CDs at different excitation wavelengths showed a general red-shifting trend, and the fluorescence intensity decreased upon an increase in the excitation wavelengths from 300 nm to 400 nm (Fig. 3B). This phenomenon could be due to the effect of surface states on the band gap of the N, P-CDs. The surface states were close to the molecular states, which promoted the complexity of the excited states of the N, P-CDs (Esteves da Silva and Gonçalves 2011, Yan et al., 2019) (Fig. 4A).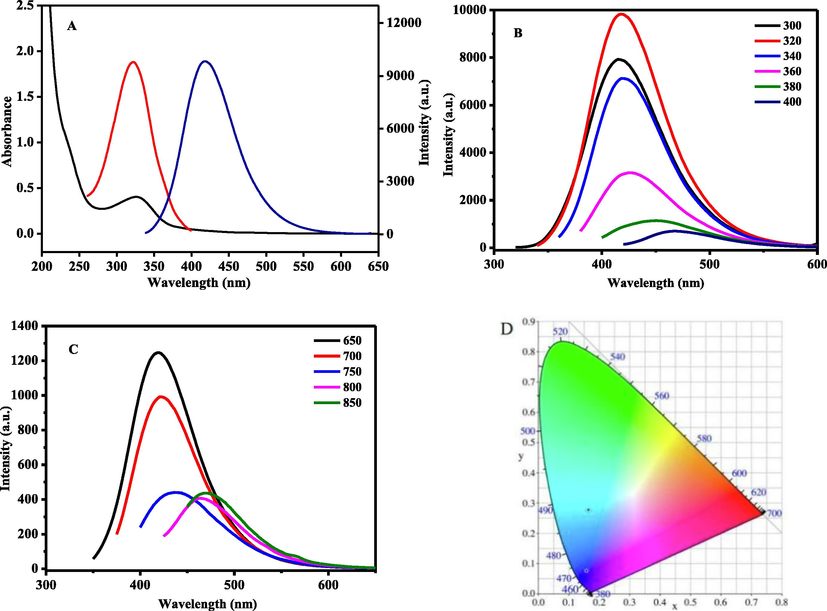
Fluorescence of N, P-CDs: (A) UV absorbance, excitation and emission spectra, (B) down-conversion spectrum, (C) up-conversion spectrum, and (D) color coordinate.

Photoluminescence mechanism of N, P-CDs.
When the excited wavelengths were changed to long-wavelengths of 650–850 nm, N, P-CDs emitted fluorescence at 420 nm and showed up-conversion property (Fig. 3C). The color coordinate picture showed that the emission color of N,P-CDs was changed from blue to green light with the change of excitation wavelength from UV to near-infrared (NIR) (Fig. 3D). The obtained N, P-CDs had down- and up- fluorescence simultaneously.
Currently, the photoluminescence mechanism of CDs was controversial; and the two commonly accepted assumptions were the core state and the surface state (Shen et al., 2016). In N, P-CDs, the fluorescence of the carbon-core states derived from the conjugated π-domains, and that of the surface state was inclined to the heteroatom doping of CDs (Fig. 4A). In this work, the photoluminescence of N, P-CDs exhibited up-conversion and red-shift properties, which may also be associated with the heteroatom doping of CDs. The doping of N and P could introduce the new highest occupied molecular orbitals (HOMO-N and HOMO-P) between the band gaps of CDs (Fig. 4B), which facilitated the direct or continuous absorption of CDs for lower energy photons and led to the up-conversion phenomenon. In addition, the nonfixation of N in N, P-CD resulted in multiple HOMO (nN) energy levels, and then the emission of N, P-CD showed red-shift properties(Qu et al., 2017, Ding et al., 2018, Li et al., 2021).
The fluorescence stability of N, P-CDs was detected at different pH and ionic strength solutions. It showed that N, P-CDs could be used under physiological conditions and to carry drugs (Fig. S1).
3.3 Formation of N, P-CDs-DOX
The effect of the mass ratio (mN,P-CDs: mDOX) on drug loading was investigated, and the optimal drug loading capacity was 39.11 % when mN,P-CDs: mDOX = 1:1.2 (Fig. 5A). The DOX loading efficiency of N, P-CDs was much higher than that in the reported literature (Table S1).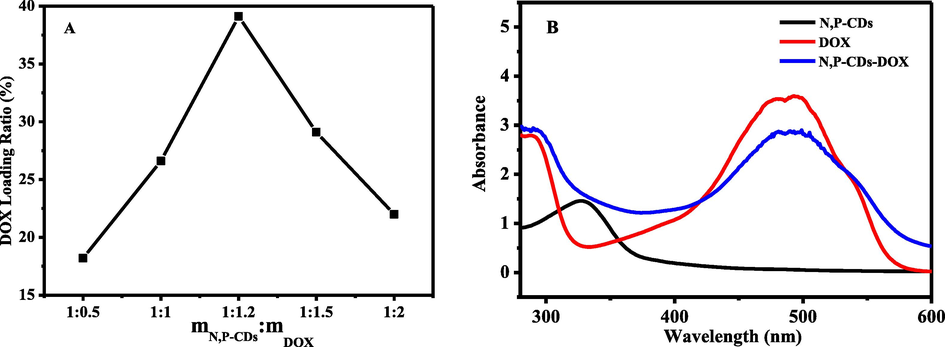
Characterization of N, P-CDs-DOX: (A) effect of the mass ratio of N, P-CDs to DOX upon DOX loading, (B) UV–vis absorption spectra.
The UV–vis spectra of N, P-CDs-DOX indicated that DOX was successfully coupled to N, P-CDs (Fig. 5B). Because N, P-CDs and DOX had typical absorption peaks at 330 nm and 488 nm, respectively. The two absorption peaks of N, P-CDs-DOX were all red-shifted, indicating the new bond between N, P-CDs and DOX.
The formation diagram of N, P-CDs-DOX was shown in Scheme 2. It suggested that the groups of —NH2 (on the surface of N, P-CDs) and —C⚌O (on the surface of DOX) were coupled and generated the bond —C⚌N—, which belonged to the Schiff base structure. The conjugation principle of CDs and DOX was similar with our previous reports, which proved the cross-linking between CDs and DOX (Zhang et al., 2019).
Formation of N, P-CDs-DOX.
3.4 In vitro release of N, P-CDs-DOX
The targeting release of anticancer drugs determined the effectiveness of treatment. Anticancer drugs with low pH release properties were one of the goals pursued by researchers. The reason was that the pH of the tumor tissue was weakly acidic, about 5.0 ∼ 6.5, which was different from normal tissue and blood. In our experiments, the in vitro release of N, P-CDs-DOX was carried out in different PBS buffers(pH = 5.0, 6.4, 7.4) (Fig. 6A). It showed that N, P-CDs-DOX had sustained release and pH-dependent properties: it released slowly without sudden at the three pH conditions and released slowly down as the pH increased from 5.0 to 6.5 and 7.0. It indicated that N, P-CDs-DOX was expected to be used for the targeted release of anticancer drugs. It was indicated the formation of —C⚌N— between N, P-CDs and DOX, due to the bond —C⚌N— was unstable at acidic conditions.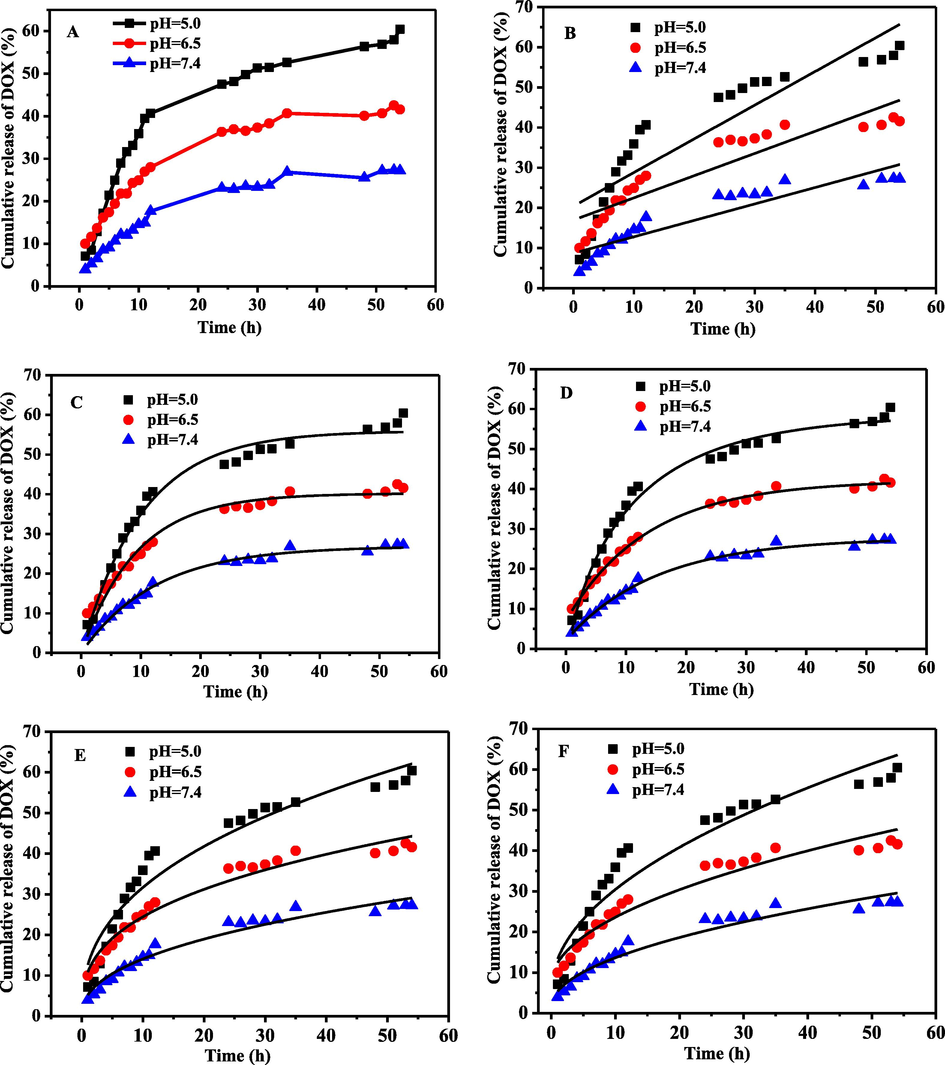
N, P-CDs-DOX release kinetics (A) fitting at different pH values, Zero-order kinetics (B), First-order kinetics, (C) Weibull equation (D), Ritger-Peppas equation (E), Higuchi equation (F).
To examine the release model, the release data at different pH conditions were fitted by five dynamical equations (Fig. 6 B-F). The dynamics model was determined according to the maximum fitting correlation coefficient (R2) (Table S2, pH = 5.0, R2 = 0.986; pH = 6.5, R2 = 0.996; pH = 7.0, R2 = 0.992). The results showed that the release of N, P-CDs-DOX was the Weibull model at different pH buffers.
The release mechanism N, P-CDs-DOX was judged by the index of t (n) in the Ritger-Peppas equation (Q = Kptn). Data (Table S2) showed that the release mechanisms of N, P-CDs-DOX was Fick diffusion (n < 0.45) at different pH (pH = 5.0, n = 0.399; pH = 6.5, n = 0.352; pH = 7.0, n = 0.4308) (Shi et al., 2021).
Whether the carrier (N, P-CDs) changed the drug's (DOX) release model or not? Furthermore, our subsequent experiments compared the release behavior of N, P-CDs-DOX and DOX at pH = 5.0 (Fig. S3). According to R2 and n (Table S3 and S4), the release models and mechanisms of N, P-CDs-DOX (R2 = 0.987, n = 0.413) and DOX (R2 = 0.960, n = 0.106) were consistent and belonged to the Weibull equation and Fick diffusion. It showed that N, P-CDs as a carrier did not change the model and mechanism of drug release, and endowed the drug-targeted-release property.
The reason for N, P-CDs-DOX with pH - targeted release was probably the formation of the Schiff base, the conjugate bond of –C⚌N— was unstable and quickly broken under acid conditions(Shi et al., 2021).
3.5 MTT assays
The proliferative activity of N, P-CDs in SH-SY5Y cells was examined by the MTT assay according to the reference (Zhang et al., 2019). Three groups of N, P-CDs-DOX, N, P-CDs, and DOX with different concentrations (0, 0.625, 1.25, 2.5, 5 μg/mL of DOX) incubated SH-SY5Y cells for 24 h, respectively, and cell viability was detected (Fig. 7). In the experiments, at any particular concentration (0, 0.625, 1.25, 2.5, 5 μg/mL), the N, P-CDs-DOX group had the same DOX concentration with DOX group, meanwhile, the N, P-CDs-DOX group had the same CDs concentration with N, P-CDs group. Fig. 7 showed that N, P-CDs did not affect proliferative activity, but DOX and N, P-CDs-DOX had significant cytotoxicity for SH-SY5Y cells. By comparison, the N,P-CDs-DOX group had less cytotoxicity than the DOX group at a concentration of 2.5 or 5 μg/mL. It indicated that N, P-CDs could reduce the toxicity of DOX at the same cultured concentration of DOX.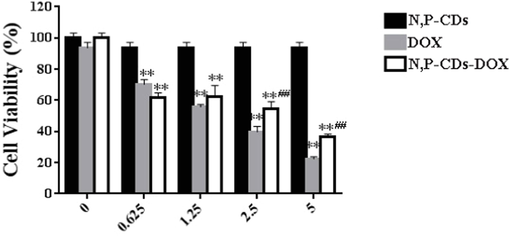
Viability of SH-SY5Y cells incubated with different concentrations of N,P-CDs-DOX. Data are represented by the mean standard deviation (SD; n = 6) (**p < 0.01 versus control group and ##p < 0.01 versus DOX group).
3.6 Single/two-photon fluorescence imaging in cells
N, P-CDs had down- and up-conversion fluorescence, and considering the longer wavelength (700 nm) had slight damage to cells and could avoid the autofluorescence of background, 700 nm was selected to examine N, P-CDs. After 3 h of incubation, N, P-CDs-DOX entered SH-SY5Y cells, and the colocation of N, P-CDs and DOX was detected by confocal microscopy (Fig. 8). The fluorescence colors of N, P-CDs (ex = 700 nm) and DOX (ex = 488 nm) were blue and red, respectively, under confocal microscopy (Fig. 8A3 and B2), and N, P-CDs-DOX exhibited purple color in cells (Fig. 8C4), suggesting the colocation of N, P-CDs and DOX. It demonstrated that N, P-CDs could successfully transport DOX to cells.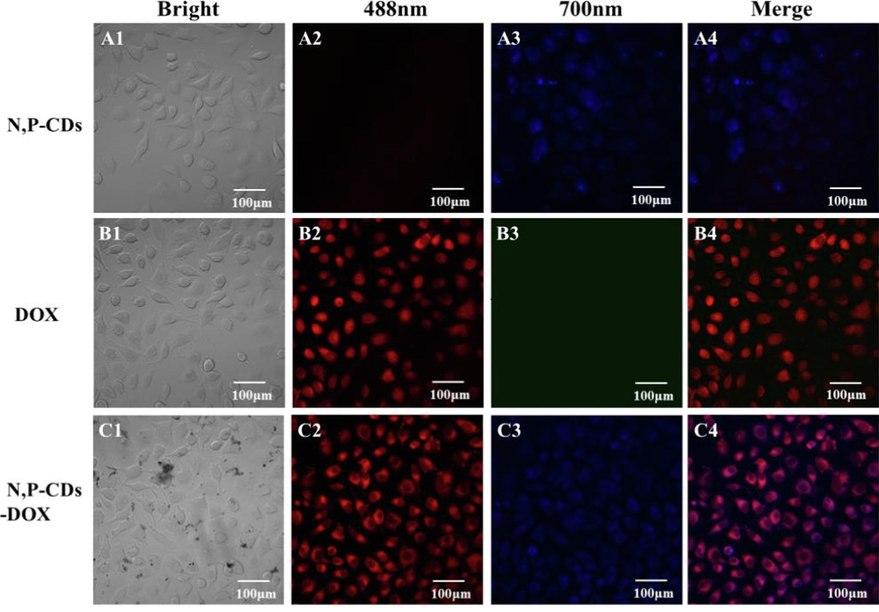
Viability of SH-SY5Y cells incubated with N, P-CDs-DOX.
4 Conclusions
In summary, N, P-CDs were prepared using a hydrothermal method with a size of about 3.64 nm and a fluorescence quantum yield of 30 %. N, P-CDs were loaded with DOX anti-cancer drug to form a drug loading system N, P-CDs-DOX and drug loading was as high as 39.11 %. N, P-CDs-DOX exhibited a faster release in acidic environments than in neutral environments, indicating that they were expected to be used for the targeted release of anticancer drugs. In vitro release studies showed that the release model and mechanism of N, P-CDs-DOX and DOX belonged to the Weibull equation and Fick diffusion. In addition, using single-photon and two-photon images, N-CDs and DOX could be monitored inside SH-SY5Y cells in real-time. It indicated that N, P-CDs had potential use in drug-targeted delivery and cell imaging.
Acknowledgments
This work is supported by grants from the National Natural Science Foundation of China (31201305), the Natural Science Foundation of Hebei Province (B2019205054), the Teaching Reform Project of Hebei Normal University (2021XJJG047), and The Project Supported by Science Foundation of Hebei Normal University (L2023J01).
References
- Nitrogen and phosphorus co-doped graphene quantum dots: synthesis from adenosine triphosphate, optical properties, and cellular imaging. Nanoscale. 2015;7:8159-8165.
- [CrossRef] [Google Scholar]
- Doped-carbon dots: recent advances in their biosensing, bioimaging and therapy applications. Colloids Surf. B-Biointerfaces. 2021;203
- [CrossRef] [Google Scholar]
- Photophysical properties of doped carbon dots (N, P, and B) and their influence on electron/hole transfer in carbon dots-nickel (II) phthalocyanine conjugates. J. Phys. Chem. C. 2014;118:20034-20041.
- [CrossRef] [Google Scholar]
- Solvent-Controlled synthesis of highly luminescent carbon dots with a wide color gamut and narrowed emission peak widths. Small. 2018;14
- [CrossRef] [Google Scholar]
- Facile, rapid synthesis of N, P-dual-doped carbon dots as a label-free multifunctional nanosensor for Mn(VII) detection, temperature sensing and cellular imaging. Sensors Actuators B-Chem.. 2018;277:492-501.
- [CrossRef] [Google Scholar]
- Analytical and bioanalytical applications of carbon dots. TrAC Trends Anal. Chem.. 2011;30:1327-1336.
- [CrossRef] [Google Scholar]
- Phosphorus, and nitrogen co-doped carbon dots as a fluorescent probe for real-time measurement of reactive oxygen and nitrogen species inside macrophages. Biosens. Bioelectron.. 2016;79:822-828.
- [CrossRef] [Google Scholar]
- Phosphorus and Nitrogen Dual-Doped Hollow Carbon Dot as a Nanocarrier for Doxorubicin Delivery and Biological Imaging. ACS Appl. Mater. Interfaces. 2016;8:11288-11297.
- [CrossRef] [Google Scholar]
- pH and redox triggered doxorubicin release from covalently linked carbon dots conjugates. Nanoscale. 2021;13:5507-5518.
- [CrossRef] [Google Scholar]
- Low-temperature rapid synthesis of nitrogen and phosphorus dual-doped carbon dots for multicolor cellular imaging and hemoglobin probing in human blood. Sensors Actuators B-Chem.. 2018;265:326-334.
- [CrossRef] [Google Scholar]
- Upconversion nanoparticle-based Forster resonance energy transfer for detecting the IS6110 sequence of Mycobacterium tuberculosis complex in sputum. Biosens. Bioelectron.. 2014;53:112-116.
- [CrossRef] [Google Scholar]
- One-pot green synthesis of optically pH-sensitive carbon dots with upconversion luminescence. Nanoscale. 2012;4:5572-5575.
- [CrossRef] [Google Scholar]
- Triple-Mode emission of carbon dots: applications for advanced anti-counterfeiting. Angewandte Chemie-Int. Ed.. 2016;55:7231-7235.
- [CrossRef] [Google Scholar]
- Biodegradable nitrogen-doped carbon nanodots for non-invasive photoacoustic imaging and photothermal therapy. Theranostics. 2016;6:2196-2208.
- [CrossRef] [Google Scholar]
- Transferrin conjugated nontoxic carbon dots for doxorubicin delivery to target pediatric brain tumor cells. Nanoscale. 2016;8:16662-16669.
- [CrossRef] [Google Scholar]
- Photoluminescence tuning in carbon dots: surface passivation or/and functionalization, heteroatom doping (vol 6, pg 7944, 2018) J. Mater. Chem. C. 2019;7:3105.
- [CrossRef] [Google Scholar]
- One-step synthesis of N, P Co-doped orange carbon quantum dots with novel optical properties for bio-imaging. Opt. Mater.. 2021;111
- [CrossRef] [Google Scholar]
- Nitrogen-Doped graphene quantum dots with oxygen-rich functional groups. J. Am. Chem. Soc.. 2012;134:15-18.
- [CrossRef] [Google Scholar]
- A tailored molecular imprinting ratiometric fluorescent sensor based on red/blue carbon dots for ultrasensitive tetracycline detection. J. Ind. Eng. Chem.. 2019;72:100-106.
- [CrossRef] [Google Scholar]
- Water-soluble, lignin-derived carbon dots with high fluorescent emissions and their applications in bioimaging. J. Ind. Eng. Chem.. 2018;66:387-395.
- [CrossRef] [Google Scholar]
- Antibacterial activity of nitrogen-doped carbon dots enhanced by atomic dispersion of copper. Langmuir. 2020;36:11629-11636.
- [CrossRef] [Google Scholar]
- Theranostic carbon dots 'clathrate-like' nanostructures for targeted photo-chemotherapy and bioimaging of cancer. J. Ind. Eng. Chem.. 2017;56:62-73.
- [CrossRef] [Google Scholar]
- Dually emissive P, N-co-doped carbon dots for fluorescent and photoacoustic tissue imaging in living mice. Microchim. Acta. 2017;184:1117-1125.
- [CrossRef] [Google Scholar]
- Se & N co-doped carbon dots for high-performance fluorescence imaging agent of angiography. J. Mater. Chem. B. 2017;5:4988-4992.
- [CrossRef] [Google Scholar]
- A Biocompatible Fluorescent Ink Based on Water-Soluble Luminescent Carbon Nanodots. Angewandte Chemie-Int. Ed.. 2012;51:12215-12218.
- [CrossRef] [Google Scholar]
- Simple one-step synthesis of highly luminescent carbon dots from orange juice: application as excellent bio-imaging agents. Chem. Commun.. 2012;48:8835-8837.
- [CrossRef] [Google Scholar]
- Two-photon excitation nanoparticles for photodynamic therapyt. Chem. Soc. Rev.. 2016;45:6725-6741.
- [CrossRef] [Google Scholar]
- Amino-modified carbon dots as a functional platform for drug delivery: load-release mechanism and cytotoxicity. J. Ind. Eng. Chem.. 2021;101:372-378.
- [CrossRef] [Google Scholar]
- One-pot and ultrafast synthesis of nitrogen and phosphorus co-doped carbon dots possessing bright dual wavelength fluorescence emission. Nanoscale. 2015;7:17278-17282.
- [CrossRef] [Google Scholar]
- Enhanced selective cytotoxicity of doxorubicin to breast cancer cells by methoxypolyethylene glycol conjugation via a novel beta-thiopropanamide linker. Eur. Polym. J.. 2020;141
- [CrossRef] [Google Scholar]
- Facile hydrothermal synthesis of nitrogen, phosphorus-doped fluorescent carbon dots for live/dead bacterial differentiation, cell imaging and two nitrophenols detection. Dyes Pigm.. 2021;184
- [CrossRef] [Google Scholar]
- Preparation and characterization of cefditoren pivoxil-loaded liposomes for controlled in vitro and in vivo drug release. Int. J. Nanomed.. 2015;10(Suppl 1):149-157.
- [CrossRef] [Google Scholar]
- Study of release kinetics and degradation thermodynamics of ferric citrate liposomes. Chem. Phys. Lipids. 2019;225
- [CrossRef] [Google Scholar]
- Highly luminescent nucleoside-based N, P-doped carbon dots for sensitive detection of ions and bioimaging. Front. Chem.. 2022;10
- [CrossRef] [Google Scholar]
- Carbon dots as a new class of nanomedicines: opportunities and challenges. Coord. Chem. Rev.. 2021;442
- [CrossRef] [Google Scholar]
- Rational design of novel carbon-oxygen quantum dots for ratiometrically mapping pH and reactive oxygen species scavenging. Carbon. 2022;190:115-124.
- [CrossRef] [Google Scholar]
- The fluorescence mechanism of carbon dots, and methods for tuning their emission color: a review. Mikrochim. Acta. 2019;186:583.
- [CrossRef] [Google Scholar]
- Fluorescent N-doped carbon dots as in vitro and in vivo nanothermometer. ACS Appl. Mater. Interfaces. 2015;7:27324-27330.
- [CrossRef] [Google Scholar]
- Sesame-derived ions co-doped fluorescent carbon nanoparticles for bio-imaging, sensing and patterning applications. Sensors Actuators B-Chem.. 2017;253:900-910.
- [CrossRef] [Google Scholar]
- Solid-Phase synthesis of highly fluorescent nitrogen-doped carbon dots for sensitive and selective probing ferric ions in living cells. Anal. Chem.. 2014;86:9846-9852.
- [CrossRef] [Google Scholar]
- High drug-loading system of hollow carbon dots-doxorubicin: preparation, in vitro release and pH-targeted research. J. Mater. Chem. B. 2019;7:2130-2137.
- [CrossRef] [Google Scholar]
- Self-photo-oxidation for extending visible light absorption of carbon dots and oxidase-like activity. Carbon. 2021;182:537-544.
- [CrossRef] [Google Scholar]
- One-pot synthesis of N-doped carbon dots with tunable luminescence properties. J. Mater. Chem.. 2012;22:16714-16718.
- [CrossRef] [Google Scholar]
- Carbon dots doped with heteroatoms for fluorescent bioimaging: a review. Microchim. Acta. 2017;184:343-368.
- [CrossRef] [Google Scholar]
Appendix A
Supplementary material
Supplementary data to this article can be found online at https://doi.org/10.1016/j.arabjc.2023.104671.
Appendix A
Supplementary material
The following are the Supplementary data to this article:Supplementary data 1
Supplementary data 1


