

Translate this page into:
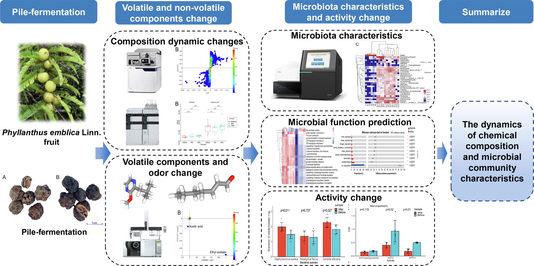
Dynamic changes in chemical composition and microbial community characteristics during pile-fermentation process of Phyllanthus emblica Linn. fruit
⁎Corresponding authors. zhangdingkun@cdutcm.edu.cn (Dingkun Zhang), hanliyx@163.com (Li Han), 582097013@qq.com (Junzhi Lin)
-
Received: ,
Accepted: ,
This article was originally published by Elsevier and was migrated to Scientific Scholar after the change of Publisher.
Abstract
Abstract
Pile-fermentation is a common processing step for Phyllanthus emblica L. fruit (PEF) in its producing area. This process enhances its flavor, reduces astringency, and increases its health benefits. However, the mechanism behind pile-fermentation and the key factors impacting PEF quality remain unknown, becoming an urgent challenge that limits its further application. To address this issue, 87 volatile compounds were analyzed by HS-SPME/GC-QQQ-MS/MS and identified acetic acid and ethyl acetate as distinguishing markers before and after fermentation. The results found that 2-methoxy-3-isobutylpyrazine contributes to the differences in odor after fermentation based on the odor intensity characteristic spectrum. Illumina Miseq sequencing of ITS1 region and 16SrDNA V4 region was performed to investigate the microbial succession during the pile-fermentation. A total of 4 phyla 34 genera of fungi and 15 phyla 61 genera of bacteria were detected in all samples. The results showed that the dominant bacteria had significant differences due to different habitats before fermentation, and the diversity increased after fermentation, while the fungal diversity exhibited the opposite trend. Aspergillus and the Unclassified_f_Necriaceae genus emerged as dominant genera after fermentation. Additionally, through UPLC-QTOF-MS analysis, we identified 18 differential components before and after fermentation. Among these, 5 compounds, such as 2-O-galloyl-1,4-galactolactone and 1-methyl-2-gallate galactose ester, showed a downward trend, whereas 13 compounds, including corilagin and chebulitic acid, exhibited an upward trend. These changes weakened astringency while improving sourness and aftertaste sweetness. The results of this study hold significant importance in clarifying the fermentation mechanism and improving the quality standards of PEF.
Keywords
Phyllanthus emblica Linn.
Pile-fermentation
Flavor
Illumina Miseq sequencing
Microbial community
Chemical composition

- PEF
-
Phyllanthus emblica L. fruit
- HS-SPME/GC-QQQ-MS/MS
-
Head Space-Solid Phase Micro-extraction/ Gas chromatography-mass spectrometer
- UPLC-QTOF-MS
-
Ultra High-Pressure Liquid Chromatography-Time of Flight Mass Spectrometer
- OAV
-
Odor activity value
- OICS
-
Odor intensity characteristic spectrum
- PNPG
-
4-Nitrophenyl-β-D-glucopyranoside
- DPPH
-
Diphenyl picryl phenyl hydrazine radical
- ABTS
-
2,2′-Azino-bis (3-ethylbenzothiazoline-6-sulfonic acid) diammonium salt
Abbreviations
1 Introduction
The Phyllanthus emblica Linn. fruit, a tropical fruit native to Southeast Asia, is primarily consumed locally as a fruit tea (Variya et al., 2016). It is highly regarded for its distinctive aftertaste-sweetness, appealing flavor, and impressive fragrance. PEF is also known for its rich polyphenols, which makes it feel strongly astringent when first consumed. Agati et al. (2013) reported that PEF contains a high concentration of polyphenols (33% of the dry weight), flavonoids, and amino acids, which provide it with exceptional antioxidant properties and potential benefits against fatigue, hyperlipidemia, and tumors (Khan et al., 2013, Huang et al., 2021). Owing to its favorable flavor and remarkable health benefits, PEF has amassed a considerable consumer base in the beverage market.
Pile-fermented processing of PEF is a method utilized in its production. Typically, the method involves stacking the dried PEF, regulating their humidity and temperature (>37 °C), sealing them with plastic film to create an air-tight environment, and storing them for over a week to promote fermentation (Huang et al., 2021). In the presence of humidity and microorganisms, a succession of reactions such as oxidation, hydrolysis, polymerization, and secondary metabolic transformations take place (Hu et al., 2021), expediting alterations in PEF ingredients and contributing to the formation of its quality (Huang et al., 2023). Research has shown that pile-fermentation augments the concentration of gallic acid, the primary active component of PEF, intensifies its color, effectively mitigates astringency, and enhances both its flavor and health benefits, rendering it an optimal processing method (Huang et al., 2021). Nevertheless, the quality of PEF may be adversely affected by insufficient comprehension of pile-fermentation, resulting in unanticipated product quality and potentially compromising the safety of the final product.
This study examined the succession process of bacterial and fungal community structures before, during, and after PEF fermentation using Illumina MiSeq sequencing. Additionally, the functional predictions of microorganisms were determined. Subsequently, sensory evaluation was conducted to assess the impact of the fermentation process on flavor. Volatile components were analyzed after PEF fermentation using HS-SPME/GC-QQQ-MS/MS. Moreover, the difference in chemical composition during fermentation was studied using UPLC-Q-TOF-MS. This study elucidates the dynamic changes in both chemical composition and microbial community characteristics during PEF's pile-fermentation process, and revealed the biological activity and sensory effects of this process on PEF, which is vital for comprehending the fermentation mechanism and improving fermentation quality.
2 Materials and methods
2.1 Materials and chemicals
Water was purified using a Milli Q water purification system (Millipore, Bedford, MA, USA). HPLC-grade methanol was purchased from Fisher Chemical (Pittsburg, PA, USA). HPLC-grade formic acid was obtained from Chengdu KeLong Chemical Factory (Chengdu, China). Anhydrous Ethanol (Analytical purity). DPPH free radical scavenging ability test kit, ABTS buffer solution was purchased from Solaribio biotechnology Co., Ltd. (Beijing), α-Glucosidase, 4-Nitrophenyl-β-D-glucopyranoside (PNPG, Sigma, USA). Standards of Citric acid, mucinous acid, malic acid Gallic acid (No. CHB201131), Epicatechin gallate (No. CHB-B-081), Quercetin (No. CHB-H-040), Corilagin (No. CHB-K-004), Gallocatechin (No.4051109), Catechin (No.14051508), Epigallocatechin gallate (No.14121608), Gallocatechin gallate (No.14102009), Ellagic acid (No. CHB-R-039), Chebulagic acid (No. CHB-H-114), Chebulic acid (No. CHB-H-140), Chebulinic acid (No. CHB-H-018) were purchased from Chengdu Biopurify Phytochemicals Ltd. (Chengdu, China). The purity of the twelve standards was each above 98.0%.
2.2 Sample preparation
2.2.1 Sample information
PEF origin place: Yunnan, Sichuan, Guangxi (Table 1). All the samples were identified as dry and mature fruits of Euphorbiaceae Phyllianthus emblica L. by Associate Professor Gao Jihai of Chengdu University of TCM.
Sample No.
Origin identification
Collection place
Altitude (m)
Collection time
F1
Phyllianthus emblica L.
Yongren, Yunnan
1900
2020.09
F2
Phyllianthus emblica L.
Pu'er, Yunnan
1800
2021.07
F3
Phyllianthus emblica L.
Chuxiong, Yunnan
1900
2021.05
F4
Phyllianthus emblica L.
Chuxiong, Yunnan
1900
2020.09
F5
Phyllianthus emblica L.
Panzhihua, Sichuan
1200
2021.07
F6
Phyllianthus emblica L.
Pingnan, Guangxi
1200
2021.05
2.2.2 Pile-fermentation protocol
Divide the PEF into two portions and place them separately in containers. Add warm water (approximately 60 °C) to the container in a ratio of 10:1 (herb to water), mix well to ensure the wetting of all PEF surfaces. Then transfer the mixture into transparent self-sealing bags, remove any air, and seal the bags. Place the bags in a thermostat-controlled incubator at a temperature of around 40 °C. After 5 days of preservation, take out the PEF and dry it to obtain the fermented sample.
2.3 UPLC-QTOF-MS conditions
2.3.1 Sample preparation
Take 0.1 g PEF dried powder (through No. 3 sieve) of each sample was put in clean erlenmeyer flask respectively, added 50 mL of 50% methanol–water solution and ultrasonic for 30 min to dissolve it as a sample solution. Appropriate amount of each reference substance was weighed and made into reference substance solution respectively. All solutions above were filtered through 0.22 μm membranes (Jinteng, Tianjin, China) before sample injection.
2.3.2 Chromatographic conditions
Samples were analyzed by Acquity UPLC I-class (Waters) ultra-performance liquid chromatography system. The Waters ACQUITY UPLC BEH C18 column (2.1 mm × 100 mm, 1.7 μm) was used for the analysis. The mobile phase A was 0.1% formic acid aqueous solution, and the mobile phase B was acetonitrile solution. The gradient elution was 0–3 min, 2%-2% B; 3–5 min, 2%–7% B; 5–15 min, 7%−21% B; 15–20 min, 21%–78% B; 20–21 min, 78%–85% B; 21%−24% min, 85%−95% B; 24–26 min, 95%–95%B; 26–28 min, 95%–2%B; 28–30 min, 2%–2%. The column temperature was set as 40 °C, and the flow rate was 0.3 mL/min, and the injection volume was 3 μL.
2.3.3 Mass spectrometry conditions
Samples were analyzed by SYNAPT XS (Waters corporation, U.S.A) high-resolution time-of-flight mass spectrometer. The electrospray ion source (ESI) negative ion mode was used for detection and analysis. The spatial resolution was 120 μm, capillary voltage was 4 kV, cone voltage 50 V, ion source temperature 150 °C. The atomizing gas was high-purity nitrogen, cone gas flow rate was 50 L/h, desolvention gas flow rate was set as 600 L/h, and the temperature was set as 250 °C. The mass spectrum data was collected in MSE mode, ion scanning range was m/z100-1200. Leucine-enkephalin (LE) was used for calibration during data acquisition. LE [M−H]− accurate relative molecular mass was calculated as m/z 554.2615 in negative ion mode.
2.3.4 Data processing and multivariate analysis methods
Masslynx 4.1 was used to collect data, and the original data was imported into progenesis Qi (V2.0) for processing. The quality error parameter |ppm|<5 was set, and the peak comparison, selection and normalization were performed to obtain the retention times, m/z and peak intensities of each sample. The above information was imported into EZinfo 3.0 for principal component analysis (PCA) and partial least squares discriminant analysis (OPLS-DA) to find the different compounds. Finally, compounds with VIP > 1and P < 0.05 were selected as differential component.
2.4 HPLC conditions
Samples were analyzed by Shimadzu LC-20AT high performance liquid chromatography (Shimadzu corporation, Kyoto, Japan) using Welchrom C18 column (4.6 × 250 mm, 5 μm, Shanghai Yuexu Material Technology Co, Ltd., China). Column temperature was 25 °C and 10 μL of the sample solution was injected into the system. Mobile phase was composed of (A) 0.1% formic acid in Milli-Q water water and (B) methanol using a gradient program of 5% of B at 0–6 min, 5%–7% of B at 6–15 min, 7%–15% of B at 15–20 min, 15%–21% of B at 20–25 min, 21%–22% of B at 25–31 min, 22% of B at 31–41 min, 22%–28% of B at 41–47 min, 28%–32% of B at 47–51 min, 32%–38% of B at 51–57 min, 38%-45% of B at 57–70 min, 45%-65% of B at 70–80 min. The detection wavelength was 270 nm, with a mobile flow rate of 1 mL/min.
2.5 Sensory evaluation methods
2.5.1 Sensory evaluation methods of volunteers
A human sensory test using the visual analog scale (VAS) is recommended to verify the results (Han et al., 2018, Liu et al., 2023). Before the experiment, volunteers were trained with different concentrations of model solutions, so they were accustomed to the evaluation scales and bitterness intensities. After that, a drop of approximately 10 mL of each solution was applied to the upper surface of the tongue for 15 s. Volunteers were asked to score the taste using the 100 mm VAS by placing a mark along a 100 mm line. Between each test interval, the mouth was rinsed well with distilled water so that no bitter taste remained.
2.5.2 Preparation of Phyllanthus emblica Linn. fruit polyphenol—protein sample
Take 0, 10, and 50, 100 uL of PEF decoction samples, add 1 mL of artificial saliva (Containing 1.2 mg/mL β-casein, Biofount, China) respectively, and then dilute to 2 mL with ultrapure water respectively.
2.5.3 Experimental methods
Place the samples in F-380 fluorescence spectrophotometer for determination. Set the excitation wavelength at 280 nm, scan the emission spectrum at 287–450 nm. The fluorescence intensity at 340 nm is used for the calculation of interaction process parameters. Each sample shall be measured twice continuously, and the average fluorescence intensity shall be taken.
2.6 HS-SPME/GC-QQQ-MS/MS conditions
2.6.1 HS-SPME conditions
The sample was crushed into fine powder (passed through a No. 3 sieve). Accurately weighed 0.5 g PEF fine powder and placed in a 20 mL inert headspace bottle, and then equilibrated at 50 °C for 40 min. Before and after sample injection, the Solid phase microextraction (SPME) head was automatically aged for 3 min in the 270 °C aging device, inserted into the headspace via a PTFE septum, without contact the sample. After extraction and adsorption at a constant temperature of 50 °C for 10 min, the SPME head quickly insert the GC–MS injection port in the pre-operation state, desorb at 250 °C for 2 min.
2.6.2 Chromatography and mass spectrometry conditions
Samples were analyzed by a TQ8050 NX triple quadrupole GC–MS equipped with Aoc-6000 automatic sampler and an electron bombardment ion source (EI), a PAL heating magnetic stirring module and a PAL SPME Arrow solid phase microextraction sampler (1.5 mm × 120 μm × 20 mm, PN: ARR15-DVB/C-WR-120/20CT, CTC Analytics AG, Switzerland). The inertcap pure wax capillary column (30 m × 0.25 mm × 0.25 μm) was used as chromatographic column during analysis. The chromatographic conditions were set as follows: injection temperature was 250 °C, split ratio was 5:1, injection pressure was 83.5 kPa; carrier gas was high purity helium, carrier gas control mode was constant pressure mode; purge flow was 3.0% mL/min. The temperature program was set as follows: the initial temperature was 50 °C for 5 min, then raised from 10 °C to 250 °C for 10 min; the column equilibrium time was 2.0 min. The mass spectrometry conditions were set as follows: the ionization energy was 70 EV, the ion source temperature was 200 °C, the mass spectrum transmission interface temperature was 250 °C, the collision gas was argon; the mass spectrum monitoring mode was multi reaction monitoring, the detector voltage was +0.3 kv relative to the tuning result, and the solvent delay time was 1.3 min.
2.6.3 Qualitative and quantitative methods
Precisely draw 1 μL of the mixed solution of 4 compounds (Acetophenone solution (2 μg/mL, Cat:48292, Sigma), Naphthalene (5 μg/mL, Cat:40053, Sigma), 2,6-Dichlorophenol (2 μg/mL, Cat:40302, Sigma), 2,4,6-Trichloroanisole (2 μg/mL, Cat:47526-U, Sigma) for analysis to evaluate the applicability of the instrument system. Then precisely draw 1 μL of the mixed solution (0.1 μg/mL) containing three internal standards for sample analysis to obtain the peak area of the internal standard. The qualitative of the target compound is confirmed by the m/z ratio and the ion pair. The quantification of the target compound is quantified by the standard curve of 150 compounds built in the Shimadzu TQ8050 reanalysis software.
2.7 DNA extraction and PCR amplification
Microbial community genomic DNA was extracted from PEF samples using the E.Z.N.A.® soil DNA Kit (Omega Bio-tek, Norcross, GA, U.S.) according to manufacturer’s instructions. The DNA extract was checked on 1% agarose gel, and DNA concentration and purity were determined with NanoDrop 2000 UV–vis spectrophotometer (Thermo Scientific, Wilmington, USA). The hypervariable region V3-V4 of the bacterial 16S rRNA gene were amplified with primer pairs 338F (5′-ACTCCTACGGGAGGCAGCAG-3′) and 806R (5′-GGACTACHVGGGTWTCTAAT-3′) by an ABI GeneAmp® 9700 PCR thermocycler (ABI, CA, USA). Forward primer (5′-CTTGGTCATTTAGAGGAAGTAA-3′) and the revise primer (5′-GCTGCGTTCTTCATCGATGC-3′) were used for amplification of ITS1 region of fungi. The PCR amplification of 16S rRNA and ITS gene was performed as follows: initial denaturation at 95 °C for 3 min, followed by 27 cycles of denaturing at 95 °C for 30 s, annealing at 55 °C for 30 s and extension at 72 °Cfor 45 s, and single extension at 72 °C for 10 min, and end at 10 °C. All samples were amplified in triplicate. The PCR product was extracted from 2% agarose gel and purified using the AxyPrep DNA Gel Extraction Kit (Axygen Biosciences, Union City, CA, USA) according to manufacturer’s instructions and quantified using Quantus™ Fluorometer (Promega, USA).
2.8 Illumina MiSeq sequencing
Purified amplicons were pooled in equimolar and paired-end sequenced on an Illumina MiSeq PE300 platform/NovaSeq PE250 platform (Illumina, San Diego, USA) according to the standard protocols by Majorbio Bio-Pharm Technology Co. Ltd. (Shanghai, China).
2.9 Processing of sequencing data
The raw 16S rRNA gene sequencing reads were demultiplexed, quality-filtered by fastp version 0.20.0 (Chen et al., 2018) and merged by FLASH version 1.2.7 (Magoč and Salzberg 2011) with the following criteria: (i) the 300 bp reads were truncated at any site receiving an average quality score of <20 over a 50 bp sliding window, and the truncated reads shorter than 50 bp were discarded, reads containing ambiguous characters were also discarded; (ii) only overlapping sequences longer than 10 bp were assembled according to their overlapped sequence. The maximum mismatch ratio of overlap region is 0.2. Reads that could not be assembled were discarded; (iii) Samples were distinguished according to the barcode and primers, and the sequence direction was adjusted, exact barcode matching, 2 nucleotide mismatch in primer matching.
Operational taxonomic units (OTUs) with 97% similarity cutoff were clustered using UPARSE version 7.1(Edgar 2013), and chimeric sequences were identified and removed. The taxonomy of each OTU representative sequence was analyzed by RDP Classifier version 2.2 against the 16S rRNA database (eg. Silva v138) using confidence threshold of 0.7. Bioinformatic analysis of the microbiota was carried out using the Majorbio Cloud platform (https://cloud.majorbio.com).
2.10 Biological activity determination methods
Take the α-glucosidase and PNPG reaction system as a model for testing, and the specific operations were as instructions. Samples were set with 8 concentration gradients of 50, 100, 150, 250, 350, 500, 750, and 1000 μg/mL and calculate the inhibition rate and half inhibitory concentration (IC50). According to the ABTS, DPPH free radical scavenging ability test kit (Solebo biotechnology Co., Ltd.) instructions, prepared the solution and required reagents. Samples were set with 8 concentration gradients of 0.20, 0.60, 1.00, 2.00, 4.00, 6.00, 8.00, and 10.00 mg/mL and calculated the scavenging rate and IC50.
Staphylococcus aureus, Candida albicans and Aspergillus flavus (purchased from Baina Biological Co., Ltd., China) were inoculated and cultured for 3 generations. Under aseptic conditions, take 0.2 mL of bacterial suspension (the best concentration of bacterial solution is 1 × 10⁶ CFU/mL) and spread it evenly on the surface of the agar plate. Take 2 mL of each sample solution into a sterilized EP tube, and then put a 6 mm diameter neutral filter paper into the EP tube to soak for 4 h. Place the filter paper clockwise on the same plate, parallel three groups, and measure the average value after incubation at 37 °C for 24 h.
3 Results
3.1 Sensory evaluation results before and after pile-fermentation
Astringency, bitterness, sourness, salivation, and aftertaste-sweetness are the five fundamental flavors of PEF. According to the results in Fig. 1, pile-fermentation decreases astringency while enhances sourness, bitterness, and aftertaste-sweetness.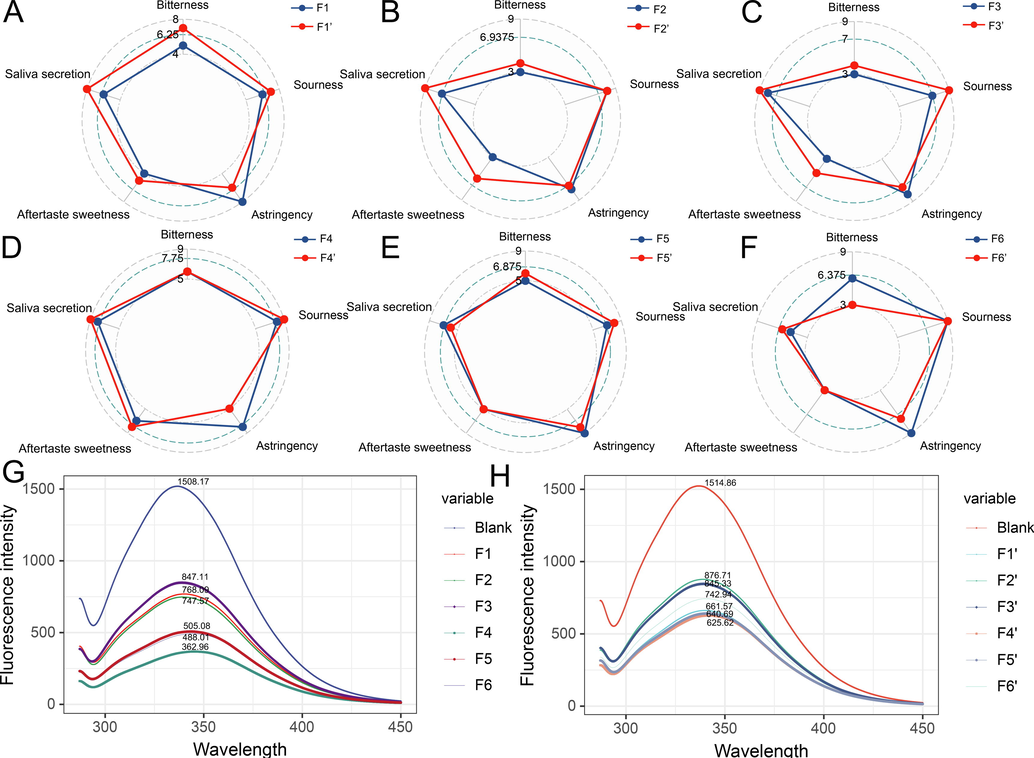
Volunteers sensory evaluation results (A-F) of sample before (F1-F6) and after (F1‘-F6‘) the pile-fermentation, fluorescence measurement results before (G) and after (H) the pile-fermentation.
The interaction between β-casein and polyphenols in saliva is primarily responsible for the perception of astringency. The fluorescence intensity of PEF extract and β-casein before and after fermentation, can serve as an indicator of its astringency level, with the results shown in Fig. 1. Using the fluorescence intensity at 340 nm as an indicator, a lower fluorescence intensity indicates a stronger binding between polyphenols and proteins. The findings indicate that pile-fermentation reduced the astringency of PEF (reduced 1–1.5times) and align with the evaluations conducted by volunteers.
3.2 Analysis of chemical composition changes in pile-fermentation process
3.2.1 Volatile composition changes of PEF before and after pile-fermentation
In the results, a total of 87 compounds were qualitatively and quantitatively analyzed from samples before and after PEF fermentation (Table 2). Fig. 2 A demonstrates that OPLS-DA can differentiate volatile composition before and after fermentation with great clarity. The model exhibits strong internal verification and prediction capabilities, as indicated by the following parameters: R2X = 0.988, R2Y = 0.881, Q2 = 0.798. The loading scatter plot also revealed that the differential markers before and after fermentation were acetic acid and ethyl acetate (p < 0.05, VIP > 1). Inspection of the load map's coordinate data shows a significant increase in the amount of ethyl acetate during the fermentation process, while the level of acetic acid slightly decreases.
Compounds
F1
F2
F3
F4
F5
F6
F1′
F2′
F3′
F4′
F5′
F6′
ethyl acetate
32016.63
29836.61
20558.07
25995.55
69555.65
28619.71
52948.76
533769.45
525208.63
284691.55
530913.48
683771.33
2,3-butanedione
1091.05
1467.65
1893.27
1882.58
164.84
405.82
0.00
1063.17
0.00
0.00
0.00
1518.65
alpha-pinene
0.00
69.09
60.40
0.00
175.42
49.00
68.87
356.56
101.39
83.66
0.00
82.89
methylbenzene
196.05
224.34
205.14
242.87
288.77
180.88
206.71
240.44
176.86
221.06
0.00
232.21
Dimethyl disulfide
50.30
133.86
58.81
121.69
448.99
0.00
0.00
62.50
171.20
39.36
0.00
250.59
butyl acetate
51.52
65.16
0.00
222.05
54.58
0.00
0.00
209.14
191.22
74.22
0.00
0.00
beta--pinene
32.24
0.00
0.00
66.75
33.28
0.00
35.80
95.64
15.85
62.14
6.50
0.00
Ethyl benzene
71.73
93.67
82.44
121.12
121.85
116.11
86.97
130.75
93.16
79.02
59.48
112.04
4-Methyl-3-penten-2-one
117.38
120.47
92.58
248.99
339.49
54.25
72.57
265.31
176.31
174.27
0.00
300.39
Paraxylene
92.87
117.07
104.63
160.77
220.18
147.41
117.78
179.05
127.96
101.76
67.16
208.76
M-xylene
92.84
117.21
102.51
219.37
519.83
217.65
138.79
275.04
186.79
123.48
245.24
493.82
O-xylene
161.18
214.78
190.45
399.82
364.57
383.46
245.51
439.15
321.71
214.48
111.84
345.17
Dipentene
650.37
859.95
789.46
2695.01
931.03
4633.12
867.80
1843.62
1367.35
709.10
91.92
920.39
styrene
140.42
130.29
108.03
489.42
1439.67
252.30
1856.11
786.51
1084.52
199.64
48.82
1505.99
2-Methylpyrazine
45.96
52.30
85.75
46.59
0.00
38.18
58.92
0.00
210.39
44.26
0.00
0.00
Hexylacetate
128.86
274.38
40.58
853.66
171.80
407.77
155.20
577.35
411.32
218.29
0.00
0.00
2-octanone
54.54
0.00
0.00
234.73
262.66
67.55
255.72
361.05
123.55
87.37
0.00
288.86
n-octanal
4656.72
2989.83
2421.72
9288.47
12165.97
0.00
8531.90
16908.10
10926.11
6168.20
8116.54
12044.69
2-Ethylpyrazine
16.72
13.91
16.77
11.46
20.62
0.00
24.42
19.80
83.67
13.08
0.00
22.62
2-Phenyl-1-propene
0.00
12.55
13.78
4.68
16.97
4.89
8.30
7.08
0.00
5.14
210.54
0.00
Dimethyl trisulfide
30.20
86.31
49.33
58.22
114.41
0.00
30.99
56.02
149.18
29.10
0.00
61.65
1,4-Dichlorobenzene
26.83
34.00
17.94
27.26
30.03
76.20
34.42
22.32
73.42
16.60
5.35
29.82
acetic acid
134828.11
146239.81
145939.97
113085.56
125290.83
114895.27
34519.69
154377.89
138578.71
109565.35
99524.97
129423.86
(E, E) - 2,4-heptadienal
2121.54
1951.07
1306.33
1436.31
3826.24
1074.39
3000.00
5729.95
1728.38
1178.65
9247.58
4063.44
2-Ethyl hexanol
262.15
199.75
199.37
157.09
64.65
343.47
400.56
210.80
336.65
139.50
643.62
133.11
Decanal
1114.50
1095.54
935.13
1368.50
753.37
1226.82
1231.23
902.50
1078.23
1145.84
53.68
932.37
2-camphanone
1812.60
1049.14
838.33
0.00
0.00
0.00
13956.90
0.00
2489.60
492.79
95.85
0.00
Benzaldehyde
2505.94
1916.38
1340.99
4701.99
10509.03
6936.51
3373.67
8418.35
7320.46
3554.77
2180.03
11384.41
2-nonyl alcohol
330.28
295.28
234.71
0.00
0.00
244.50
0.00
0.00
0.00
220.89
313.69
0.00
2-methoxy-3-isobutylpyrazine
93.81
52.98
33.95
104.53
44.98
96.57
207.81
746.07
131.79
78.27
224.18
208.56
propionic acid
16233.79
15906.75
15902.44
16211.88
15968.30
24775.69
5812.49
17005.61
13475.79
15105.96
14144.16
15680.99
Trans-2-nonaldehyde
889.44
581.24
668.08
1200.50
891.38
566.05
728.49
1020.39
1282.45
924.38
1520.28
732.96
Linalool
2318.36
2349.86
3166.33
1347.33
107.48
13455.42
0.00
2140.77
2018.91
373.29
0.00
129.25
N-octanol
903.34
871.60
742.76
1771.79
815.34
1046.26
894.46
1492.50
921.66
1381.64
0.00
1153.17
Isobutyric acid
2570.10
2590.76
3034.67
4251.43
2233.62
1438.33
995.44
2178.82
3088.85
3931.28
1119.36
2218.88
5-Methyl furfural
5755.68
6240.67
5497.04
4340.24
6309.07
2750.66
0.00
0.00
10757.35
3656.51
7840.75
8065.97
Isophorone
42.58
46.88
36.91
47.07
41.40
29.19
48.79
98.83
46.75
36.72
217.40
39.42
2-Methylisoborneol
16.51
0.00
0.00
0.00
10.19
0.00
351.24
55.88
0.00
22.66
0.00
22.22
butyric acid
5506.60
5118.71
4769.27
5866.40
6432.87
8876.17
1857.60
6654.24
4096.49
6506.72
9292.65
6446.53
Phenylacetaldehyde
956.33
884.11
2016.31
1453.66
2633.73
452.58
1004.46
879.12
6420.57
1222.23
119.26
2662.41
menthol
1496.18
1295.03
744.50
0.00
105.35
2663.10
4095.55
1783.88
2057.30
427.56
1006.06
140.60
Acetophenone
1075.57
1080.11
1024.41
1602.39
3207.20
816.32
1346.69
2903.72
1235.60
2.52
282.06
3545.40
Trans-2-decenaldehyde
0.00
205.44
0.00
667.05
0.00
0.00
513.08
0.00
0.00
554.08
0.00
0.00
verbenol
409.82
0.00
67.14
198.03
0.00
0.00
0.00
0.00
0.00
101.98
0.00
0.00
Isovaleric acid
0.00
0.00
5842.04
0.00
4208.44
0.00
2024.99
4617.16
8499.46
0.00
1186.76
4166.14
2-Hydroxybenzaldehyde
145.53
143.53
158.01
150.98
302.23
137.53
128.47
346.28
585.64
138.07
134.12
340.99
α- Terpineol
339.11
352.26
269.45
201.37
80.53
752.43
294.76
736.00
453.52
162.31
83.90
84.36
(E, E) - 2,4-Nonadienal
163.20
151.20
157.21
284.91
130.61
284.49
242.81
166.99
111.43
160.34
103.24
114.55
2-Zinol
293.39
20.30
20.64
52.62
25.18
102.76
3117.55
44.10
130.84
37.33
39.86
36.14
Verbenone
19.28
0.00
0.00
36.08
34.99
64.23
58.35
75.71
46.28
0.00
0.00
50.01
N-valeric acid
3944.87
3293.52
0.00
4333.52
3304.83
7833.95
0.00
0.00
0.00
0.00
3730.29
3429.95
naphthalene
94.35
100.17
66.13
128.10
67.60
174.70
132.97
116.04
169.84
88.88
53.69
69.16
Methyl salicylate
290.43
296.54
192.80
603.62
670.30
332.47
385.11
852.57
772.82
509.08
1603.94
693.29
4-Methylvalerate
793.67
0.00
1035.66
795.26
788.54
0.00
652.11
773.63
1530.19
751.31
0.00
780.91
Trans-2,4-decadienal
35.71
27.28
23.81
51.93
51.35
46.57
78.85
92.98
33.91
36.39
43.16
65.68
Caproic acid
6879.40
4585.00
3573.16
8160.59
6219.24
15084.07
7921.05
7927.64
2995.10
6873.80
6490.24
6420.91
Geraniol
58.73
82.87
58.20
41.30
0.00
55.79
30.85
40.62
55.78
47.36
50.23
30.10
2-methylnaphthalene
30.67
25.91
18.67
43.32
20.48
56.76
68.89
27.11
51.28
25.26
45.79
16.77
Guaiacol
196.15
215.69
335.66
−1.01
125.74
38.48
56.64
1058.47
2856.40
91.06
88.74
113.54
Benzyl acetone
9.28
0.00
4.84
6.00
0.00
0.00
0.00
14.92
0.00
0.00
0.00
6.63
Undecanol
0.00
49.56
35.52
0.00
0.00
88.81
28.43
0.00
0.00
0.00
0.00
26.60
Benzyl alcohol
675.07
502.09
732.63
873.95
935.80
288.01
1064.47
485.63
2391.19
463.15
209.97
920.86
1-Methylnaphthalene
19.17
16.46
0.00
21.53
11.14
28.52
33.79
14.91
30.79
15.11
18.00
10.67
2. 6-Di-tert-butyl-p-cresol
64.57
97.94
104.22
7.51
1.10
7.72
10.61
3.00
12.42
11.77
0.00
3.59
Beta ionone
9.11
12.52
11.46
13.01
0.00
0.00
0.00
0.00
15.89
0.00
0.00
0.00
Heptanoic acid
1065.50
871.70
783.31
1144.99
879.46
1750.24
973.17
882.87
625.96
988.96
852.99
846.24
Benzothiazole
17.15
14.90
12.67
0.00
7.25
8.89
11.60
0.00
13.42
15.51
5.95
4.51
O-cresol
135.91
141.33
352.22
32.48
40.00
0.00
29.20
298.27
2001.29
29.30
16.10
34.32
phenol
2758.60
2503.16
8329.27
624.73
387.55
98165.13
213.22
2702.51
22993.94
280.73
193.29
328.66
4-Ethyl-2-methoxyphenol
25.91
34.70
41.76
8.53
14.00
6.51
9.43
168.57
383.23
14.51
5.86
13.54
caprylic acid
1435.37
1212.24
903.26
1516.37
1546.43
1772.96
1248.13
1389.72
879.52
1382.98
908.22
1426.20
4-Methylphenol
329.80
15.52
34.37
39.11
63.60
26.53
43.51
32.63
251.16
49.08
24.41
60.28
M-methylphenol
422.81
348.09
1303.00
48.83
47.29
34.67
47.02
450.15
5707.92
55.35
11.04
45.47
Azelaic acid
1042.45
882.00
696.07
981.85
497.66
1381.34
415.31
642.96
486.61
902.95
0.00
452.10
Eugenol
60.59
0.00
47.22
0.00
0.00
336.60
0.00
0.00
50.79
0.00
0.00
0.00
4-Ethylphenol
94.11
75.30
287.28
20.28
13.49
3.58
13.86
136.72
1435.94
16.81
8.98
12.37
Caprolactam
60.21
67.95
0.00
0.00
0.00
63.69
70.75
0.00
74.20
0.00
64.76
63.51
Decanoic acid
292.62
271.90
182.58
401.79
231.94
306.75
116.73
250.88
292.43
304.76
140.16
197.03
Lauric acid
0.00
610.10
0.00
677.13
458.97
547.76
0.00
488.94
494.31
0.00
0.00
445.11
Phenylacetic acid
0.00
0.00
0.00
674.67
678.99
649.75
0.00
660.70
667.75
659.78
698.32
666.49
vanillin
96.71
75.74
43.14
113.25
153.72
92.69
115.71
167.80
146.84
87.11
272.57
162.80
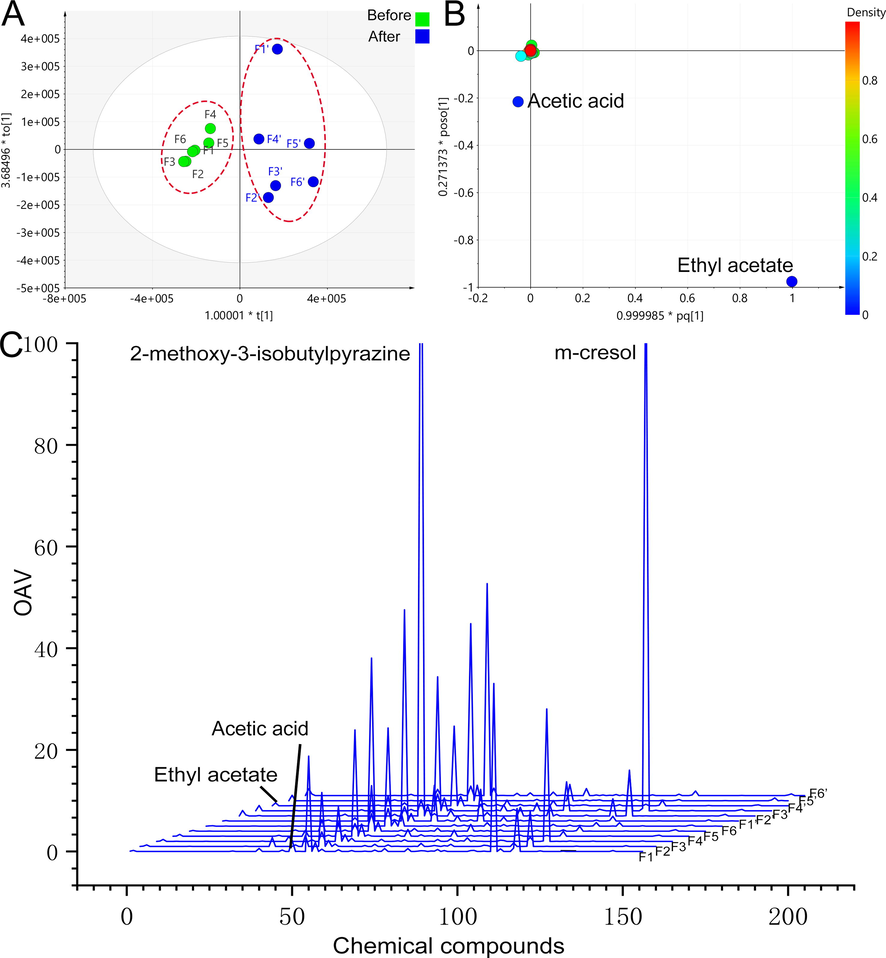
Multivariate statistical analysis results of volatile components of PEF before and after fermentation, OPLS-DA results before and after fermentation (A), loading scatter plot (B), and odor intensity characteristic spectrum (C).
3.2.2 Analysis results of PEF odor intensity characteristic spectrum (OICS)
The study utilized the odor intensity characteristic spectrum (OICS) to provide a more accurate and intuitive description of the concentration and odor contribution of volatile components. The ratio of the concentration to the threshold is known as odor activity values (OAV) (Huang et al., 2022). Fig. 2C depicts the OICS of PEF, with the OAV as the ordinate and the serial number of 150 odor compounds as the abscissa. Through this analysis, the study identified that 2-methoxy-3-isobutylpyrazine (OAV:9.0–149.2) and m-cresol (OAV:0.7–114.2) made significant contributions to the odor of PEF, while volatile components like ethyl acetate and acetic acid, which had the highest content before and after fermentation, did not exhibit noticeable contributions in the OICS. Previous reports have described 2-methoxy-3-isobutylpyrazine as having an unpleasant, spicy, and green pepper flavor, which can negatively impact the overall flavor of food (Ling et al., 2021). Another component with obvious smell is m- cresol, which has a plastic smell and comes from plastic film. It is not difficult to find from OICS that the odor characteristics of PEF before and after fermentation have changed due to 2-methoxy-3-isobutylpyrazine.
3.2.3 Analysis results of non-volatile differential component of PEF before and after fermentation by UPLC-QTOF-MS
In Fig. 3A, the OPLS-DA analysis revealed significant changes in the chemical components of PEF before and after fermentation. To identify specific differential markers, we used the S-plot with screening parameters set as VIP > 1 and p < 0.05. By combining the parent ion and daughter ion m/z of the chemical compounds with reference substances, 18 differential markers were identified, with the majority being tannins. Among these markers, 13 components showed an increase in content, while 5 components showed a decrease (Fig. 3C).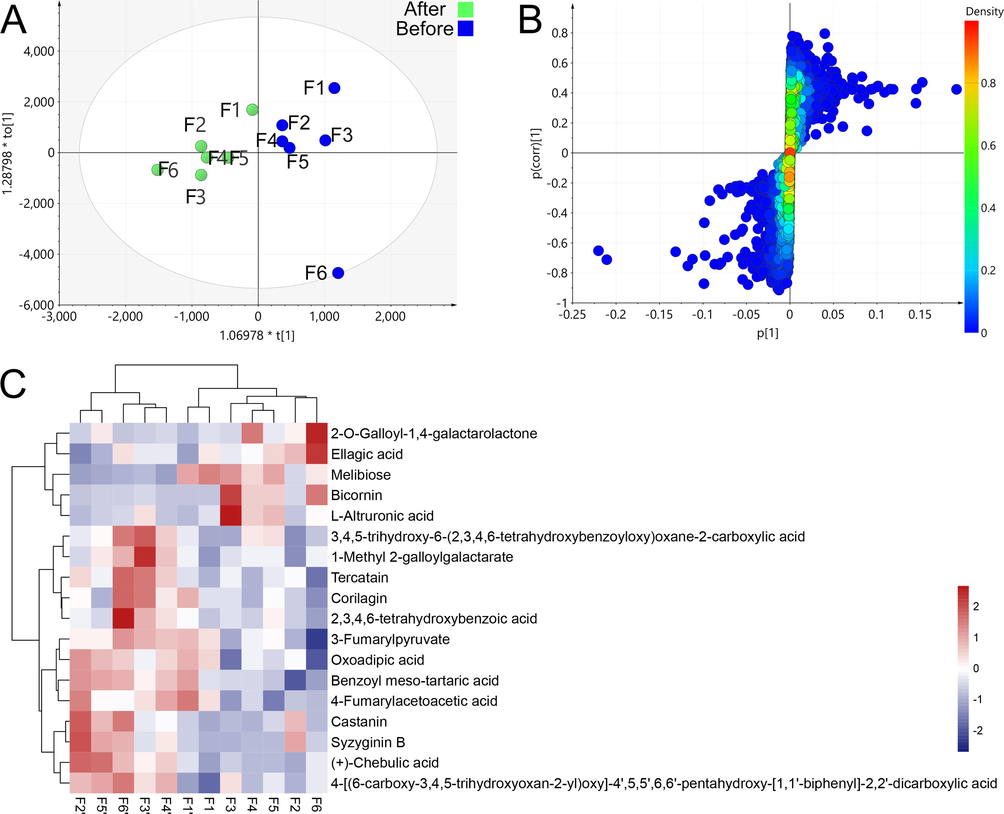
Multivariate statistical analysis results before and after pile-fermentation, OPLS-DA analysis result (A), s-plot results (B), and heatmap of changes in the content of differential compounds (C), (F ' represent samples after pile-fermentation).
Fig. 4 presents the HPLC analysis results, which demonstrate the dynamic variations in the content of active components in PEF during pile-fermentation. It was observed that the contents of ellagic acid and chebulagic acid decreased significantly, while the contents of other components showed an increasing trend. Notably, the content of corilagin initially increased rapidly during fermentation but then decreased, which is consistent with the previous conclusion (Huang et al., 2019). Furthermore, corilagin can undergo microbial fermentation to produce gallic acid and ellagic acid. Similarly, the gallic tannins, such as 2-O-galloyl-1,4-galactolactone and 1-methyl-2-galloylgalactarate, found in the mass spectral data may also follow the same degradation pathway. Additionally, the microbial degradation of ellagic acid may contribute to its ongoing reduction during fermentation (Aguilar-Zarate et al., 2018). Overall, these findings suggest that tannins in PEF can be converted into active compounds and further degraded during the fermentation process. Therefore, it is important to improve the fermentation process and identify an appropriate “time window” for PEF pile-fermentation.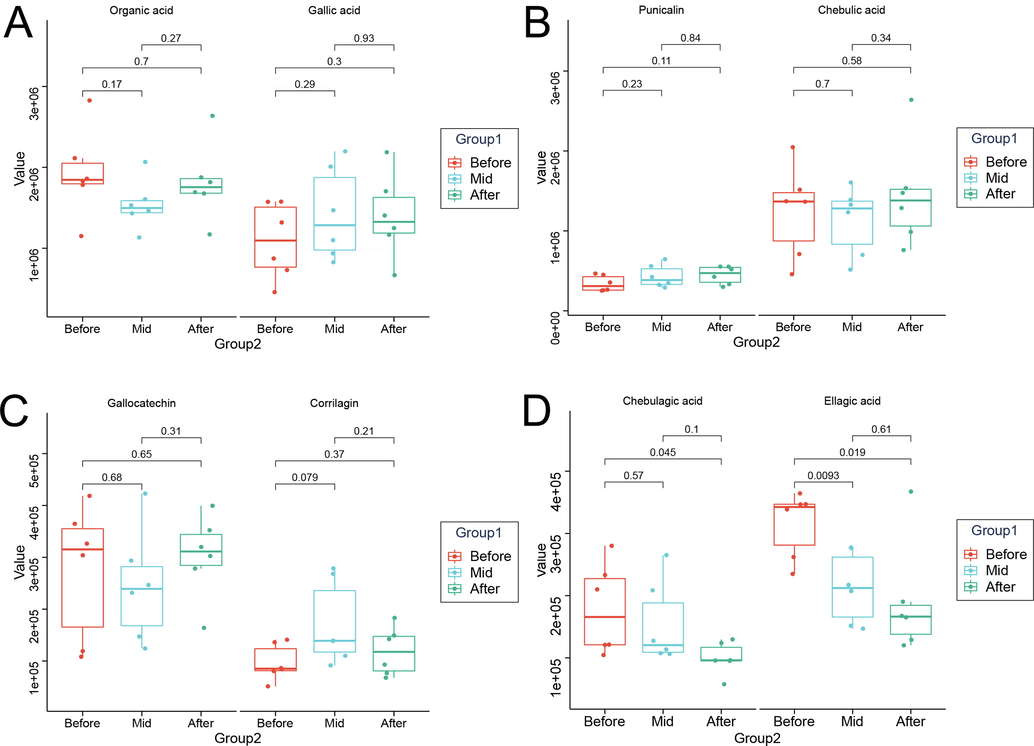
Changes of main active components during PEF pile-fermentation.
3.3 Diversity of microbial communities results
3.3.1 Statistical analysis results of sequencing data
In this study, a total of 1,999,430 effective ITS1 region optimized sequences were obtained in the study, with an average sequence length of 231 bp. The bacterial 16Sr region obtained 1,117,423 optimized sequences with an average length of 422 bp. According to the dilution curve, the majority of samples of bacteria (Fig. 5A) and fungi (Fig. 5B) in various fermentation stages have flat curves, suggesting that the volume of the sequencing data can accurately reflect the total number of OTUs in the samples. The Venn diagram analysis showed that there were a total of 338 common OTUs in the bacterial samples and 25 common OTUs in the fungal samples at different fermentation steps. Interestingly, the number of fungal OTUs continuously decreased, indicating a decline in fungal microbial diversity during the pile-fermentation process.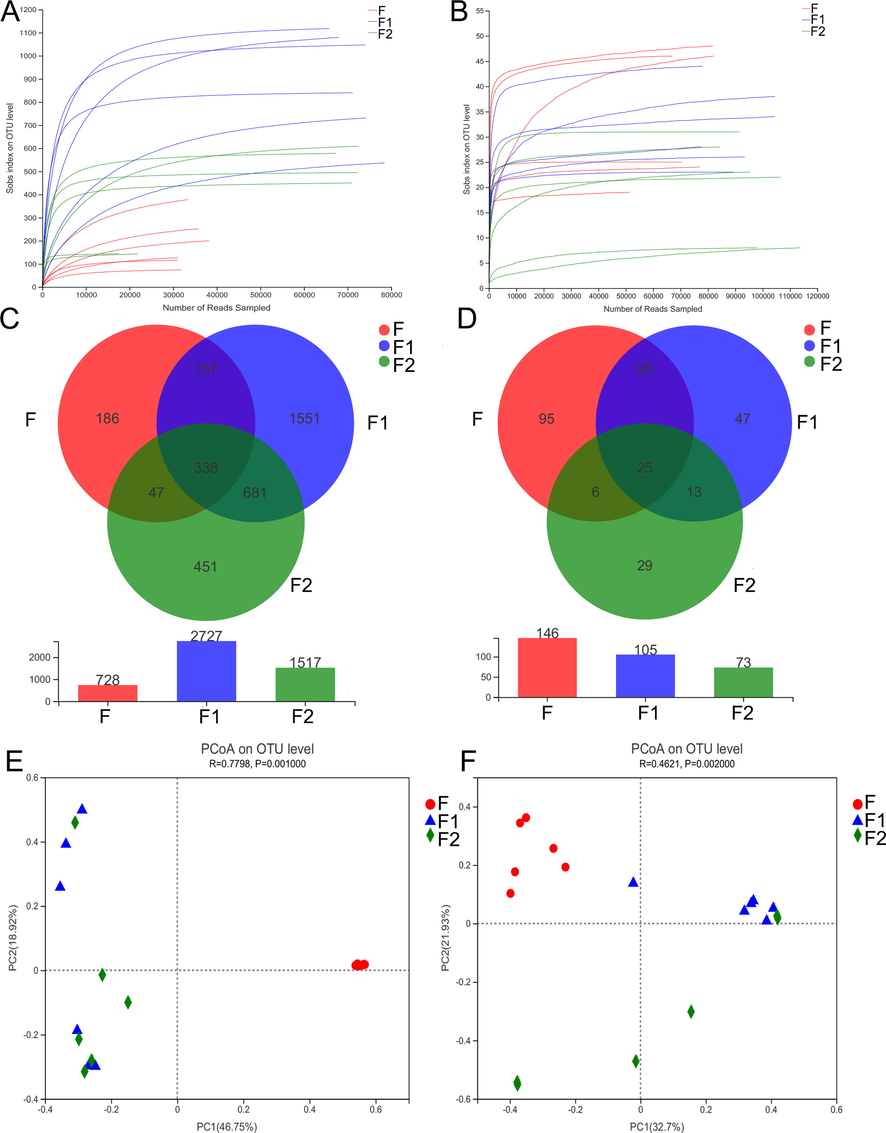
OTU dilution curve of bacteria (A) and fungi (B) at different fermentation stages, OTU Venn diagram of bacteria (C) and fungi D, PCoA results of bacteria (E) and fungi (F) (F, F1 and F2 represent samples before, during and after fermentation respectively).
3.3.2 Alpha beta diversity analysis results
The α-diversity results of bacterial and fungal of PEF in different fermentation stages are shown in Table 3 and Table 4 respectively. In terms of bacteria, samples' microbial richness and diversity were considerably higher during and after fermentation than they were before (p < 0.05). However, for fungi, there was a noticeable decline in both richness and diversity during fermentation.
Sample
Shannon
Simpson
ACE
Chao
Coverage
F
0.294
0.928
146.274
147.300
0.999
F1-1
4.957
0.038
1128.023
1140.677
0.999
F1-2
4.587
0.067
583.938
586.000
1.000
F2
0.608
0.839
120.083
119.750
1.000
F2-1
3.352
0.210
1102.665
1108.583
0.999
F2-2
4.340
0.021
148.807
146.500
1.000
F3
0.998
0.752
429.510
447.720
0.997
F3-1
2.515
0.315
764.746
767.495
0.999
F3-2
3.654
0.060
164.151
152.429
0.999
F4
0.293
0.922
77.544
77.500
1.000
F4-1
5.660
0.010
844.985
849.231
1.000
F4-2
4.887
0.021
499.179
506.000
1.000
F5
0.491
0.885
291.463
285.957
0.998
F5-1
5.302
0.025
1056.597
1071.474
1.000
F5-2
2.119
0.312
625.097
634.067
0.999
F6
0.425
0.898
229.232
234.500
0.999
F6-1
1.773
0.350
576.110
582.000
0.999
F6-2
4.320
0.050
457.023
463.125
1.000
Sample
Shannon
Simpson
ACE
Chao
Coverage
F1
1.490
0.303
48.280
49.333
1.000
F1-1
1.040
0.534
40.607
38.600
1.000
F1-2
0.006
0.999
9.091
8.333
1.000
F2
1.781
0.301
25.000
25.000
1.000
F2-1
1.375
0.408
38.673
34.500
1.000
F2-2
0.019
0.995
8.352
8.000
1.000
F3
1.856
0.354
46.462
46.000
1.000
F3-1
0.849
0.708
26.532
26.000
1.000
F3-2
0.972
0.509
22.586
22.000
1.000
F4
2.140
0.195
20.802
19.000
1.000
F4-1
1.055
0.472
52.518
31.000
1.000
F4-2
1.282
0.393
31.667
29.000
1.000
F5
2.394
0.201
55.003
51.000
1.000
F5-1
1.444
0.423
48.644
44.333
1.000
F5-2
0.583
0.778
31.000
31.000
1.000
F6
1.378
0.501
24.520
24.000
1.000
F6-1
0.669
0.767
23.000
23.000
1.000
F6-2
0.267
0.916
24.309
23.500
1.000
PCoA analysis was employed to investigate the β-diversity at the genus level. As depicted in Fig. 5E, substantial differences in the bacterial community were observed before, during, and after fermentation, indicating a significant alteration in the structure of the bacterial community post-fermentation. This finding was further supported by the α-diversity analysis, revealing an increase in bacterial diversity corresponding to a shift in the colony structure. Conversely, the fungal analysis (Fig. 5F) demonstrated pronounced variations in the microbial community structure of fungi during different fermentation time points. Moreover, the diversity analysis results suggest that the fungal colony structure exhibited a decline after fermentation, implying the potential importance of certain fungi in the fermentation process.
3.3.3 Composition of microbial communities
In all fermentation samples, fungi from 4 phyla 34 genera and bacteria from 15 phyla 61 genera were detected. The predominant bacterial phylum (Fig. 6A) before fermentation was Proteobacteria (92.34%–97.81%), while after fermentation, the dominant phylum became Firmitutes. At the genus level (Fig. 6B), Delftia (91.60%–96.31%) was the most abundant genus of bacteria in all pre-fermentation samples, whereas during fermentation, Escherichia-Shigella (43.8%–55.26%) dominated in all samples, except for Geobacteria (16.59%) in F1, and Bacillus (13.26%) in F4. After fermentation, the microbial community becomes more complex, the proportion is as follows: F1 norank_f_norank_o_Chloroplast (24.97%), F2 Turicibacter (9.90%), F3 Escherichia-Shigella (16.78%), F4 Bacillus (21.42%), F5 Escherichia-Shigella (49.68%), F6 norank_f_norank_o_Chloroplast (18.80%). The bacterial community heatmap (Fig. 6C) intuitively reflects the dynamic changes in bacterial abundance at different fermentation stages. Among them, the abundance of Delftia decreased significantly after fermentation, while that of other genera was almost on the rise, which was reflected in the One-way ANOVA bar plot (Fig. 6D). Fig. 6D shows the top ten bacterial communities with significant differences, it mainly includes Bacillus, norank_f__norank_o__Chloroplast, Lactobacillus, etc.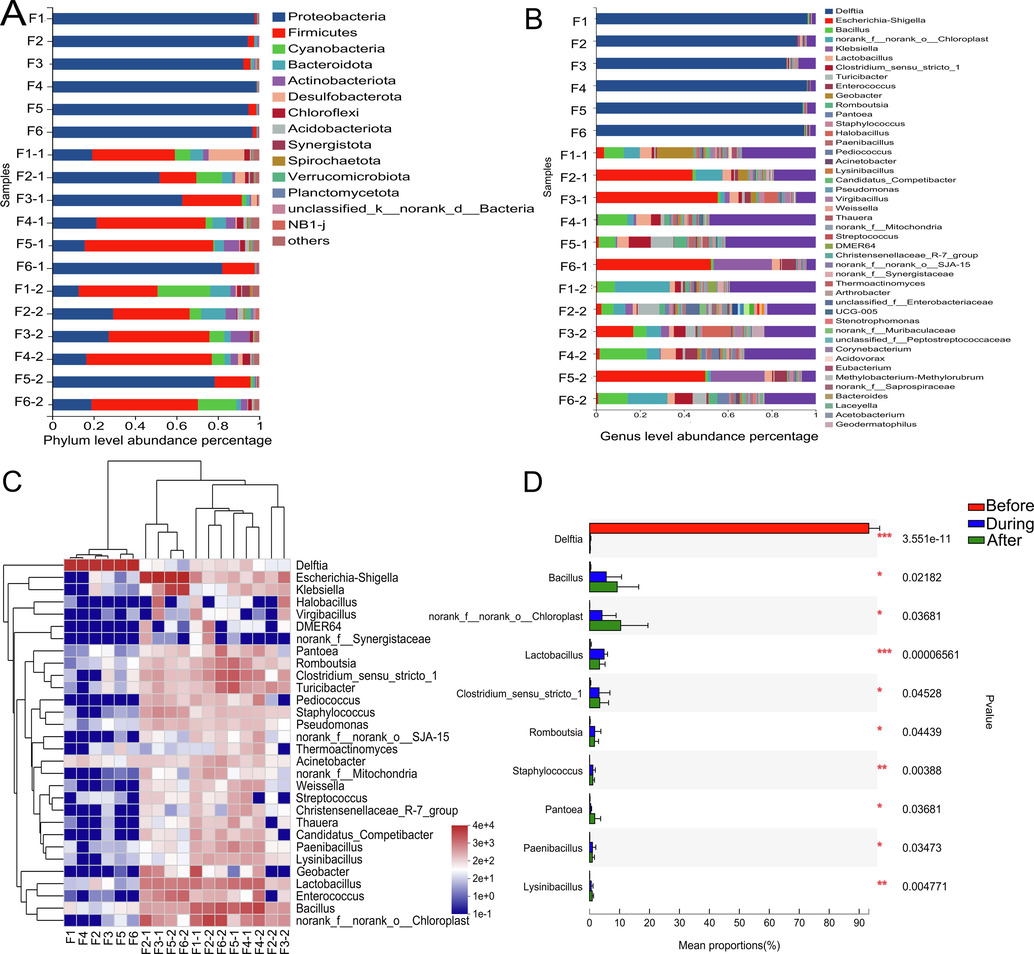
Analysis results of bacterial community composition in different fermentation stages, results of fungal (A) and bacterial (B) community level composition abundance at different fermentation times, community heatmap analysis on genus level (C) and analysis on the difference of microbial communities on genus level (D) (F1, F1-1, F1-2 represent samples before and during and after fermentation).
As demonstrated in Fig. 7A, the Ascomycota phylum of fungus predominates (25.6%–99.7%) before fermentation, followed by Basidiomycota (0.3%–74.4%), which was highly abundant only before fermentation. Fig. 7B shows that there are quite a few differences in the dominant fungi in the samples before fermentation, which can be directly related to differences in the origin place and processing. Unclassified_o_Eurotiales, for instance, makes up the majority of the fungi in F1 and F2 (47.61%–47.77%). In F3 and F6, Apiotrichum (57.50%–70.21%) predominates, while F4 and F5 are dominated by Lambertella (37.70%) and Aspergillus (64.75%), respectively. Aspergillus and unclassified_f_Nectriaceae are the most prevalent fungus after fermentation. In F1, Aspergillus perdominated both during and after fermentation (71.42%–99.99%). And the predominant fungus in F2 during fermentation was still unclassified_f_Nectriaceae (57.66%). After fermentation, the Aspergillus abundance in F2 rapidly increased to 99.89%, similar to F3 and F4. In contrast to the other samples, Aspergillus (64.75%) was the dominant fungi before fermentation in F5 and F6, but gradually decreased to 1.45% after that. At this time, unclassified_f_Nectriaceae (88.07%–95.85%) was the dominant fungi in both samples. The heatmap (Fig. 7C) makes it abundantly evident that unclassified_f_Nectriaceae and Aspergillus are the dominant genera during the whole fermentation process. The former increases significantly after fermentation, while the latter has an upward trend after fermentation and shows no significant difference from that before (Fig. 7D). It's important to note that Aspergillus has been recognized as a significant genus of fungi that may transform and biodegrade tannins and is crucial to the food, brewing, and fermentation sectors. It might be involved in the PEF pile-fermentation component transition.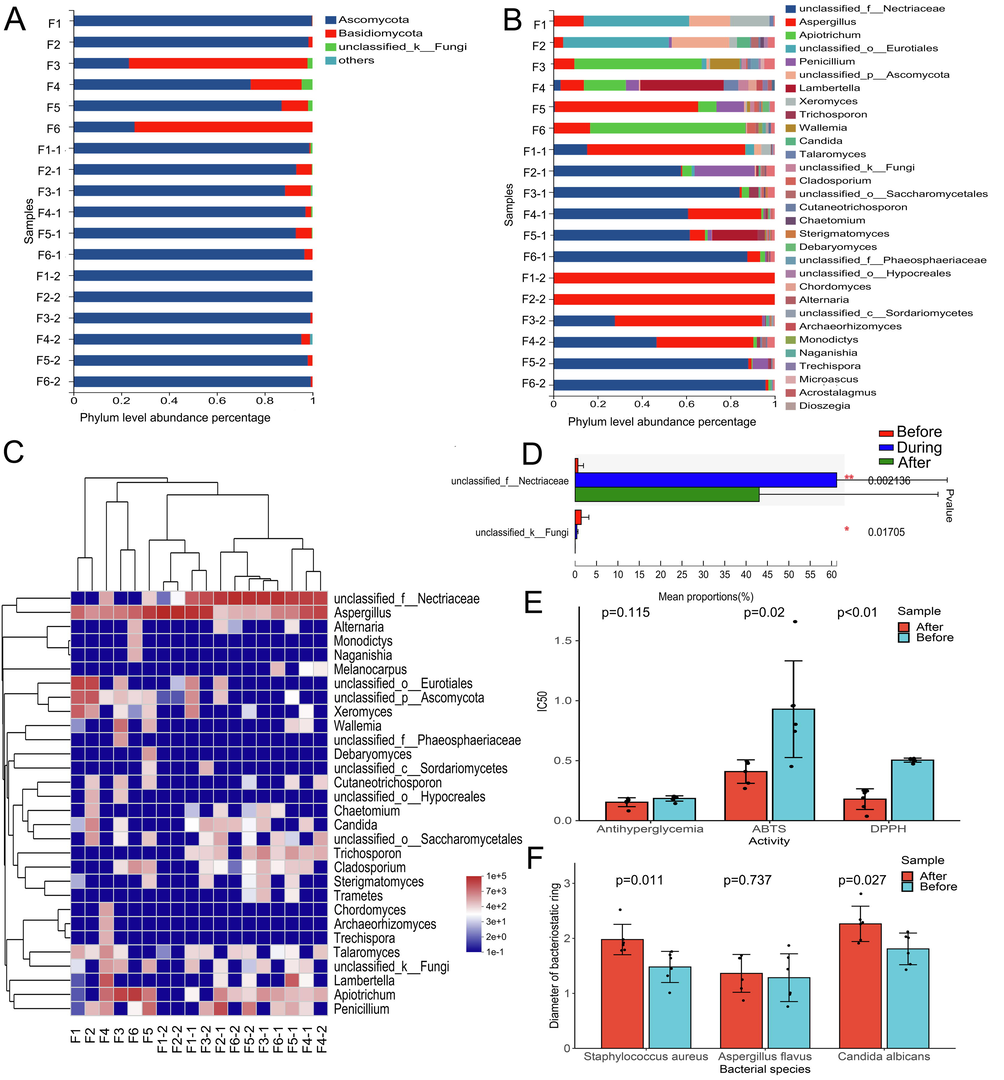
Analysis results of bacterial community composition and biological activity of PEF in different fermentation stages, results of fungal (A) and bacterial (B) community level composition abundance at different fermentation times, community heatmap analysis on genus level (C) and analysis on the difference of microbial communities on genus level (D), Effect of fermentation on antioxidation, antihyperglycemic activity (E) and bacteriostatic activity (F).
3.3.4 Prediction of pile-fermentation microbial function
In this paper, the Majorbio Cloud platform’s PICRUSt, FAPROTAX, and FUNGuild tools were utilized in this study to forecast the microbial function of samples. PICRUSt, based on 16S amplification sequence, was used to predict bacterial function at three levels (Fig. 8A). The bacterial function prediction revealed that bacteria primarily involve pathways such as aerobic reproduction I (cytochrome c), pyrotechnic differentiation to isobutanol (engineered), and amino acid synthesis. Fungi, on the other hand, mainly involve pathways such as palmitate biosynthesis I (animals and fungi), guanosine nucleotides degradation II, and chitin degradation to ethanol (Fig. 8C). The heatmap reveals that these metabolic pathways have a markedly improved trend after fermentation at the same time. The FAPROTAX prediction results (Fig. 8B) show that the functional differences amongst bacteria in different samples primarily relate to plastic_degradation, chemoheterotrophy, fermentation, aerobic_chemoheterotrophy, nitrate_reduction, animal_parasites_or_Symbolts, etc. Whereas after fermentation, bacterial functions were greatly enhanced except for plastic degradation. The fungi's projected roles were confirmed by FUNGuild, which discovered that saprotroph predominated during the fermentation process.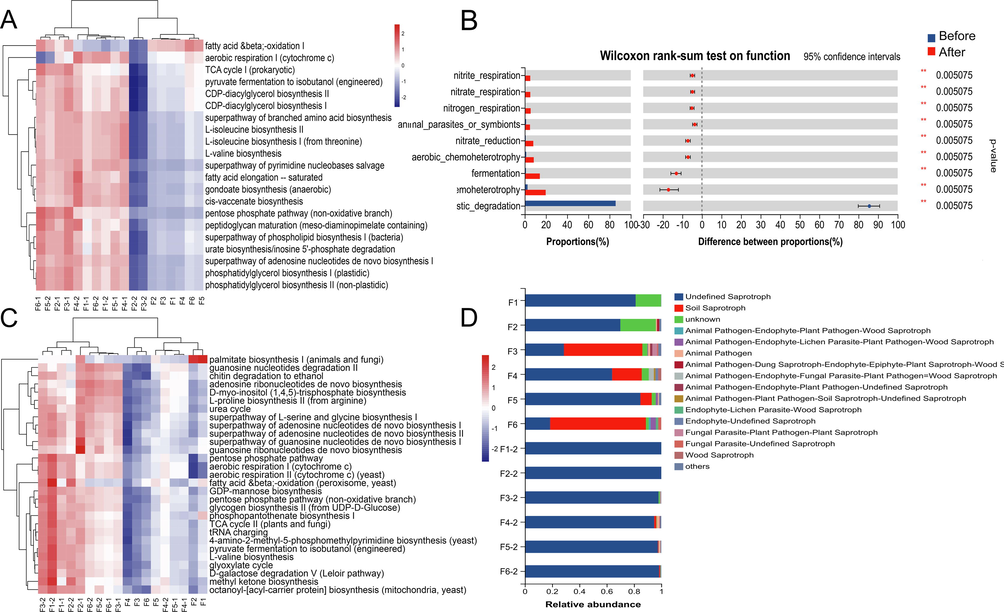
Microbial function prediction results, statistical heatmap of bacteria MetaCyc pathway abundance (A), results of difference test between bacterial functional groups(B), statistical heatmap of fungi MetaCyc pathway abundance (C), funguild function classification statistics histogram.
3.4 Effect of pile-fermentation process on PEF biological activity
Fig. 7E and F show the changes before and after fermentation with various biological activities. The results depict the 50% inhibition rate measured in vitro for different biological activities. To evaluate the key indicator of PEF's hypoglycemic efficacy, its ability to inhibit α-glucosidase was tested in vitro. The results showed that while the antihyperglycemic activity did not significantly improve, the antioxidant activity significantly increased after fermentation with an increase in the content of active components. Regarding bacteriostasis, PEF exhibited a good inhibitory effect on bacteria both before and after fermentation, but the effect on fungi was poor. However, after fermentation, the bacteriostatic effect of PEF was greatly improved, except for Aspergillus flavus. The in vitro bacteriostatic action of PEF may be closely related to tannin components, such as corilagin, as inferred from the dynamic changes in bacteriostatic effect and content (Bobasa et al., 2021). This outcome demonstrates that PEF's fermentation procedure is advantageous for increasing the content of its active components as well as for enhancing its health benefits.
4 Conclusion
The pile-fermentation process of PEF is a typical open multi-strain mixed solid-state fermentation system, and the fungal and bacterial microbial communities on its surface are naturally diverse and complex. The results suggest that the primary biological alteration of macromolecular gallic tannins is the source of gallic acid. Based on the dynamic changes in its internal chemical composition and the analysis of microorganisms, various microorganisms may dominate the decomposition and transformation process of tannins, thereby improving the quality of PEF during fermentation.
Although tannins have microbial toxicity, a variety of microorganisms, including linear fungi, a few bacteria, and yeast, can still degrade hydrolytic tannins. In fact, some fungi, such as Penicillium and Aspergillus identified in this study, can tolerate the toxicity of tannins and rely solely on them for growth and reproduction. These microorganisms primarily produce tannase to carry out this function. For instance, when chebulagic acid is used as an example, microbial tannase can convert it into corilagin by removing a molecule of chebulic acid. Furthermore, corilagin can be decomposed to form small molecules of phenolic acid components, such as gallic acid and ellagic acid (Huang et al., 2019). This process explains why the sourness increases after pile-fermentation. Similarly, the enhancement of bitterness may be related to the degradation of rutin, which leads to the formation of quercetin. The phenolic acids can further degrade into pyruvic acid and butyric acid. Consequently, improper fermentation time not only leads to a decrease in gallic acid but also results in the degradation and deterioration of PEF quality. The findings of this study also indicate that PEF's bacterial community makeup is complex, and not all samples are suitable for use with certain process parameters. To improve flavor and quality, it is essential to investigate the fermentation time window, optimize the fermentation process, and study and understand the key influencing factors in the PEF fermentation process. In the future, it is necessary to improve the current natural fermentation process in order to achieve precise fermentation through inoculation of specific strains, and to promote the industrialization of pile-fermentation processing of PEF.
In conclusion, this research reveals the microbial succession process in PEF pile-fermentation and provides insights into the changes in flavor and chemical composition during this process. These findings contribute to a better understanding of the pile-fermentation mechanism of PEF and the improvement of its quality.
CRediT authorship contribution statement
Haozhou Huang: Methodology, Data curation, Writing – original draft. Mengqi Li: Methodology, Data curation, Writing – original draft.Dingkun Zhang: Conceptualization, Supervision, Validation, Writing – review & editing. Li Han: Conceptualization, Supervision, Validation, Writing – review & editing. Junzhi Lin: Conceptualization, Supervision, Validation, Writing – review & editing.
Acknowledgements
This study was supported by grants from the National Natural Science Foundation of China (81973493); National Interdisciplinary Innovation Team of Traditional Chinese Medicine ZYYCXTD-D-202209; Sanajon Pharmaceutical Group-Chengdu University of TCM production, study and Research Joint Laboratory Project (2019-YF04-00086-JH) and China Postdoctoral Science Foundation (2023MD734100). Thanks to Innovative Institute of Chinese Medicine and Pharmacy of Chengdu University of TCM for its technical support in mass spectrometry work.
Declaration of Competing Interest
The authors declare the following financial interests/personal relationships which may be considered as potential competing interests: [Author Sanhu Fan and Taigang Mo were employed by company Sanajon Pharmaceutical Group. All other authors declare no competing interests.]
References
- Functional roles of flavonoids in photoprotection: new evidence, lessons from the past. Plant Physiol. Biochem. : PPB. 2013;72:35-45.
- [CrossRef] [Google Scholar]
- Ellagitannins: Bioavailability, purification and biotechnological degradation. Mini Rev. Med. Chem.. 2018;18:1244-1252.
- [CrossRef] [Google Scholar]
- Hydrolysable tannins in Terminalia ferdinandiana Exell fruit powder and comparison of their functional properties from different solvent extracts. Food Chem.. 2021;358:129833
- [CrossRef] [Google Scholar]
- fastp: an ultra-fast all-in-one FASTQ preprocessor. Bioinformatics (Oxford, England). 2018;34:i884-i890.
- [CrossRef] [Google Scholar]
- UPARSE: highly accurate OTU sequences from microbial amplicon reads. Nat. Methods. 2013;10:996-998.
- [CrossRef] [Google Scholar]
- A novel quantified bitterness evaluation model for traditional Chinese herbs based on an animal ethology principle. Acta Pharm. Sin. B. 2018;8:209-217.
- [CrossRef] [Google Scholar]
- Changes of fungal community and non-volatile metabolites during pile-fermentation of dark green tea. Food Res. Int. (Ottawa, Ont.). 2021;147:110472
- [CrossRef] [Google Scholar]
- Exploration on the approaches of diverse sedimentations in polyphenol solutions: An integrated chain of evidence based on the physical phase, chemical profile, and sediment elements. Front. Pharmacol.. 2019;10:1060.
- [Google Scholar]
- Exploration on the approaches of diverse sedimentations in polyphenol solutions: An integrated chain of evidence based on the physical phase, chemical profile, and sediment elements. Front. Pharmacol.. 2019;10:11.
- [CrossRef] [Google Scholar]
- Quality analysis combined with mass spectrometry imaging reveal the difference between wild and cultivated Phyllanthus emblica Linn.: From chemical composition to molecular mechanism. Arabian J. Chem.. 2022;15 103790
- [CrossRef] [Google Scholar]
- The impact of thermal extraction on the quality of Phyllanthus emblica Linn. fruit: A systematic study based on compositional changes. Arabian J. Chem.. 2023;16:104562.
- [CrossRef] [Google Scholar]
- Potential effect of tropical fruits Phyllanthus emblica L. for the prevention and management of type 2 diabetic complications: a systematic review of recent advances. Eur. J. Nutr. 2021
- [CrossRef] [Google Scholar]
- [Strategies and ideas of comprehensive development and utilization of medicine and food homologous variety Phyllanthus emblica]. Zhongguo Zhong yao za zhi = Zhongguo zhongyao zazhi =. China J. Chinese Materia Medica. 2021;46:1034-1042.
- [CrossRef] [Google Scholar]
- Antibacterial activity of Phyllantus emblica, Coriandrum sativum, Culinaris medic, Lawsonia alba and Cucumis sativus. Acta Pol. Pharm.. 2013;70:855-859.
- [Google Scholar]
- Ling, M., Zhou, Y., Lan, Y., 2021. Modification of Sensory Expression of 3-Isobutyl-2-methoxypyrazine in Wines through Blending Technique. 26, https://doi.org/10.3390/molecules26113172.
- The material basis of astringency and the deastringent effect of polysaccharides: A review. Food Chem.. 2023;405:134946
- [CrossRef] [Google Scholar]
- FLASH: fast length adjustment of short reads to improve genome assemblies. Bioinformatics (Oxford, England). 2011;27:2957-2963.
- [CrossRef] [Google Scholar]
- Emblica officinalis (Amla): A review for its phytochemistry, ethnomedicinal uses and medicinal potentials with respect to molecular mechanisms. Pharmacol. Res.. 2016;111:180-200.
- [CrossRef] [Google Scholar]


