Translate this page into:
Effect of an activating agent on the physicochemical properties and supercapacitor performance of naturally nitrogen-enriched carbon derived from Albizia procera leaves
⁎Corresponding author at: Center of Research Excellence in Nanotechnology (CENT), King Fahd University of Petroleum and Minerals, KFUPM Box 5040, Dhahran 31261, Saudi Arabia. maziz@kfupm.edu.sa (Md. Abdul Aziz)
-
Received: ,
Accepted: ,
This article was originally published by Elsevier and was migrated to Scientific Scholar after the change of Publisher.
Peer review under responsibility of King Saud University.
Abstract
Abstract
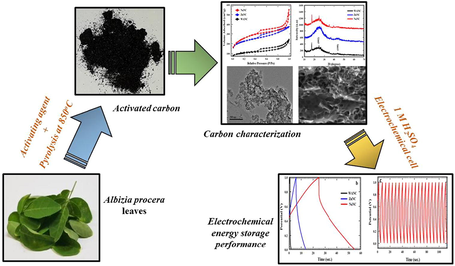
The present study reports the preparation of naturally nitrogen-doped carbon nanostructured materials from Albizia procera leaves with enhanced electrochemical supercapacitance properties. The doped carbon materials were prepared by the pyrolysis of Albizia procera leaves at 850 °C. The effect of using various activating agents such as NaHCO3 and ZnCl2 was checked and compared on the structural and textural properties, specific capacitance, surface functional groups, and surface area. The Brunauer–Emmett–Teller (BET) analysis shows that NaHCO3-activated nitrogen-doped carbon (NaNC) has a higher specific surface area compare to ZnCl2-activated nitrogen-doped carbon (ZnNC) and nitrogen-doped carbon prepared without an activating agent (WANC). Overall, the BET and microscopic analyses confirmed that NaNC is composed of carbon nanosheets with macropores and mesopores, as well as a large number of micropores, which is completely different from the composition of ZnNC and WANC. In addition, the XPS analysis confirmed the existence of higher amount of nitrogen in NaNC compared to that of ZnNC, and WANC. NaNC exhibits a specific capacitance of 231 F g−1 at 1 A g−1 current with good energy and power densities, and an outstanding charging-discharging stability thanks to its unique features such as the existence of high amounts of nitrogen, high SSA, and the nanosheet-type morphology.
Keywords
Supercapacitor
Albizia procera
Nitrogen-doped carbon
Biomass-derived carbon
Activating agents
Electrochemical performance
1 Introduction
The ability to use renewable energy and store it with high efficiency is one of the necessities of our life nowadays owing to the high rate depletion of fossil fuel and other natural energy resources (Li et al., 2019; Yi et al., 2020). The efficient use of generated energy significantly depends on storage performance. As a result, scientists are interested in developing a high-performance energy storage devices like a supercapacitor (SC), which can be made from very cheap and environmentally-friendly materials (Beguin et al., 2009; Cai et al., 2018; G. Wang et al., 2012). Scheme 1.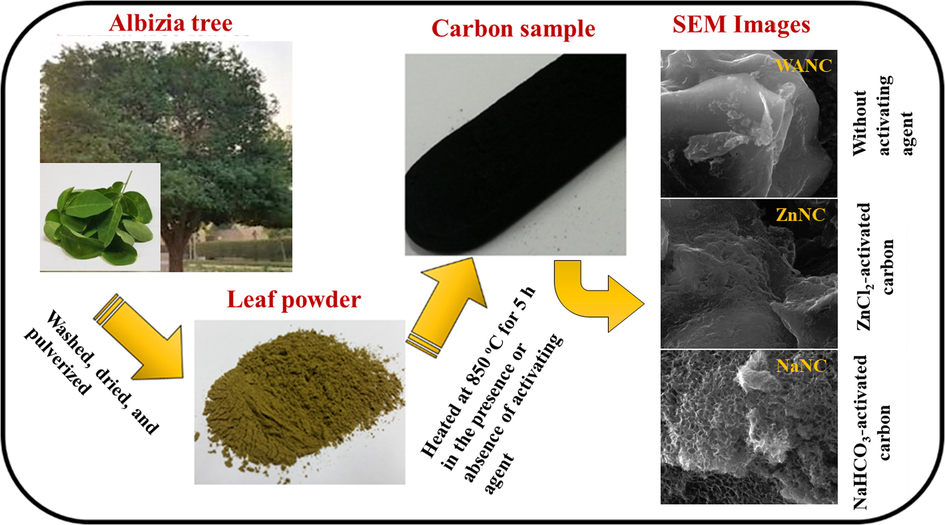
Preparation of carbon samples from Albizia procera leaves.
Electric charges are stored in SCs at the electrode–electrolyte-interface (EEI) through the electrostatic force, which results in their special properties that filled the technological gap between conventional capacitors and traditional batteries (Qun Lu, Wang, et al., 2018; Pandolfo et al., 2006; Richey et al., 2014; Yi et al., 2020). The exceptional advantages of SCs, such as their high capacity to store energy (hundreds of Farad) and their rapid charging and discharging, make them high-power devices (Kang et al., 2009; C. Liu et al., 2010; Lu et al., 2011; Pech et al., 2010). The productivity of SCs partially depends on the electrode materials. Activated carbon (AC) in its different forms is commonly used for SCs as electrode materials because of its high-conductivity, high specific surface area (SSA), low-cost, good corrosion resistance, and high-temperature stability (Gao et al., 2016; Liu et al., 2016; Pandolfo et al., 2006; Peng et al., 2008). The storage mechanism in SCs based on AC is predominantly through the electrical double-layer capacitance (EDLC) mechanism (Qun Lu, Lu, et al., 2018). Here, the charge accumulates at the EEI, unlike pseudocapacitors, that utilize faradic-redox reactions (Li et al., 2019; Yi et al., 2020b; Ali et al., 2018; Subramanian et al., 2007). In addition, heteroatoms, such as O and N-doped carbon can take advantage of both EDLC and faradic redox reactions to increase the total capacitance (Ahmed, Rafat, et al., 2018; Chen et al., 2012; Ma et al., 2015; Sun et al., 2016; Wei et al., 2015; Zhang et al., 2018; Zou et al., 2018). In particular, the surface wettability of the nitrogen doped carbon is vital for adsorption of electrolyte-charged ions in the pores of carbon (Ahmed, Rafat, et al., 2018; Chen et al., 2012; Ma et al., 2015; Sun et al., 2016; Wei et al., 2015; Zhang et al., 2018; Zou et al., 2018). Additionally, the N-doped carbon has high electronic conductivity as a result of Fermi level shifting to the valence band based on the presence of N atoms as a dopant (Ahmed, Rafat, et al., 2018; Chen et al., 2012; Ma et al., 2015; Sun et al., 2016; Zhang et al., 2018; Zou et al., 2018).
For SC applications, pristine/heteroatom-doped carbon bearing different morphologies, SSA, and porosities were prepared from different sources, such as chemical or natural resources (Deb Nath et al., 2019; Li et al., 2006; Tang et al., 2017; Zhang et al., 2018). Preparing heteroatoms, such as N-doped carbon using a carbon precursor along with N-containing chemicals, is a common strategy for SC applications. For example, Zhang et al. (2018) fabricated porous N-doped carbon from phenolic formaldehyde as a carbon precursor. They utilized sodium citrate and hexamethylenetetramine as an activating agent and N doping source, respectively. Recently, research has shifted towards the natural resources that can be used as a carbon precursor instead of using toxic, inorganic, and expensive chemicals. Moreover, biomass is very rich in different elements such as iron, copper, nitrogen, phosphorus, and sulfur depending on the type of biomass (Guo et al., 2015; Liu et al., 2015; Mondal, Kretschmer, Zhao, Liu, Fan, et al., 2017). However, only a fraction of biomass materials, for example in the Broussonetia papyrifera stem back, potato waste residue, waste shrimp shells, and water hyacinth (Eichhornia crassipes), have been carbonized to prepare N-doped carbon (Liu et al., 2015; Ma et al., 2015; Mondal, Kretschmer, Zhao, Liu, Fan, et al., 2017; Wei et al., 2015). Nevertheless, the search for inexpensive and accessible plant biomass materials could create significant economic value. It is known that Albizia procera grows widely in the world, including the Middle East, South East Asia, and Australia and produces large amounts of leaves over most of the year. These leaves, which contain a high percentage of nitrogen containing molecule (protein) (Chitra et al., 2016), are discarded in the environment without much effective use. However, there has no report for the preparation of N-doped carbons from Albizia procera leaves for SC applications. Therefore we took an attempt to prepare different types of N-doped carbons having different SSAs, porosities, and morphologies from Albizia procera for comparing their supercapacitor performances.
The porosity type, SSA, and morphology of plant-derived carbon depend on the type of activating agent, e.g., KOH, NaOH, ZnCl2, H3PO4, and carbonates (Abioye et al., 2015; Ahmed, Ahmed, et al., 2018; Grycova et al., 2018; H. Lu et al., 2017; Shrestha et al., 2017; Xia et al., 2016; Zhang et al., 2010). Various types of nanostructured carbons have been fabricated by biomass carbonization with or without an activating agent (Ahmed, Ahmed, et al., 2018; Shrestha et al., 2017). Different types of activating agents produced different morphologies and porosities due to their different activating mechanisms. As an example, ZnCl2 is used as a dehydrating agent in order to remove the water molecules from the lignocellulose skeleton and resulting in mostly meso- and microporous AC without loss in carbon quantity (Hu et al., 2001; Sayğılı et al., 2016; Shrestha et al., 2017). Besides, preparation mechanism of AC using bicarbonate is significantly different from that of using ZnCl2. It is reported that NaHCO3 decomposed at ∼ 200 °C to Na2CO3 which reacts with the carbon at ∼700 °C as Eq. (1) for evolving CO. This provides a path for making macro-, meso- and micropores in the remaining carbon.
In this study, we prepared three different types of N-doped carbon materials from Albizia procera leaves. Two of them were prepared in the presence of NaHCO3 and ZnCl2 to compare their effects on their SSAs, types of porosities, morphologies and SC. Besides, the third carbon sample was prepared without an activating agent for comparison with the obtained N-doped AC. The carbon prepared with NaHCO3 showed the best SC performance among the three types of carbon materials because of their distinctive properties, including the highest BET SSA, a nanosheet-type morphology with micro-, meso- and macro-pores, and nitrogen and oxygen doping.
2 Preparation method
2.1 Materials
The Albizia plant leaves were collected from the front of building 28, King Fahad University of Petroleum and Minerals, Dhahran-Saudi Arabia. All the utilized chemicals in this research were obtained from Sigma-Aldrich. Nitrogen (N2) gas (99.99% purity) was provided by the SCG gas supplier center, Jubail, Saudi Arabia.
2.2 Preparation of N-doped carbon materials from Albizia procera leaves
The collected Albizia procera leaves were washed using tap water and then dried for 48 h under the sun. Next, the leaves were dried in an electric-oven at 100 °C for 48 h. A very fine leaves powder was prepared by pulverizing the dried leaves using the kitchen blender. To obtain high SSA AC, one sample of leaves (3 g) was mixed with NaHCO3 in a mass ratio of 1:2, and the other sample was mixed with ZnCl2 in a mass ratio of 1:4. To obtain the carbon materials, the leaf powder, with or without the activating agent, was heated in a tube furnace at 850 °C in the presence of a N2 atmosphere for 5 h. The heating ramp rates were adjusted to 10 °C/min. Upon cooling to room temperature at 5 °C/min., each carbonized sample was well washed in an aqueous solution of 1 M HCl by ultrasonication, and subsequent centrifugation was used to remove all metals and other soluble impurities. Next, each sample was washed on filter paper with deionized water (DI) H2O three times to wash out the remaining water-soluble impurities. As a final step, all the three samples had been dried in an oven at 60 °C for 24 h. The dried N-doped carbon materials prepared without an activating agent and with the activating agents NaHCO3 and ZnCl2 are termed as WANC, NaNC, and ZnNC, respectively, for simplification in the rest of the manuscript.
2.3 Preparation of the working electrodes
20-mg of each of the prepared carbon samples were mixed separately with 5-mL of ethanol, sonicated for 1 h, then mixed with 30-µL of Nafion, which was used as a binding material, and finally sonicated for another 30 min. From this, 200-µL of the solutions were dropped onto a steel foil (2 cm × 1 cm) to obtain the working electrodes. The working electrodes were subsequently dried in an electric-oven at 60 °C for 2 h.
2.4 Instrumentation
Different characterization techniques were employed to examine the structure, elemental composition, morphology, and SSA of the prepared carbon nanomaterials. X-ray diffraction (XRD: Rigaku Miniflex 600) and Raman spectroscopy (Raman spectroscopy: iHR320 with CCD detector, HORIBA) were used to study the crystallinity of the prepared samples. The morphological characteristics of the carbon materials were evaluated by both field scanning electron microscopy (FESEM: Tescan Lyra 3, Czech Republic) and transmission electron microscopy (TEM: JEOL, JEM 2011). The pore size distribution and the SSA were investigated by using a nitrogen adsorption–desorption method (BET: Micromeritics, ASAP 2020). X-ray photoelectron spectroscopy (XPS: Model: ESCALAB250Xi) has been used to examine the chemical composition of the prepared activated and pristine carbon materials. Fourier transform infrared spectroscopy (FTIR) analysis (FTIR: Thermo Scientific NICOLET 6700 spectrometer) was investigated in order to study the available functional groups and the microstructure of the activated carbon samples. FTIR spectra of the three samples were studied within 4000–400 cm−1 range with 32 scans per spectrum and 4 cm−1 resolution. To prepare the sample pellet for FTIR spectral recording, 0.1 wt% of the carbon sample was mixed with potassium bromide (KBr) (Thermo Fisher Scientific) powder to prepare KBr pellets. The pellet was formed by transferring the sample powder into a 20 mm die and applying 4-ton pressure using an ATLAS POWER T25 PRESS.
2.5 Electrochemical measurements
Electrochemical measurements were conducted using CHI 760E potentiostat in a three-electrodes configuration: a counter electrode (platinum foil), a working electrode (nanostructured carbon), and a standard reference electrode (Ag/AgCl). 1 M H2SO4 has been used as an aqueous electrolyte for measuring the electrochemical performance of the prepared electrodes. Cyclic voltammetry (CV) measurements at various scanning rates were conducted. Galvanostatic charge–discharge (GCD) measurements were performed on various current densities for the three samples to examine their capacity and test their stability over thousands of cycles. The specific capacitance was obtained using formulas 2 and 3 for CV and GCD, respectively (Nath et al., 2020; Tehare et al., 2017; Zheng et al., 2019).
The energy density (E, Wh/kg) and power density (P, W/kg) were measured using formulas 4 and 5, respectively (Wei et al., 2013).
3 Results and discussion
3.1 Crystal structure
Raman spectral analysis is widely used to characterize the structural features of carbonaceous materials (Marsh et al., 2006; Sadezky et al., 2005). This analysis effectively demonstrates the overall quality of carbon samples, doping effect, and specifically identify the defects present in the samples (Tian et al., 2016). The sp2-hybridized disorder carbon gives rise to the rich and fascinating properties in their resonance Raman spectra. Therefore, Raman spectroscopy is one of the extremely informative and sensitive tools required for the characterization of disorder sp2 carbon materials (Dresselhaus et al., 2010). Raman spectra of WANC, NaNC, and ZnNC are shown in Fig. 1 (a). Two major peaks related to the D-band and G-band were noticed in all the prepared carbon samples, indicating a typical Raman spectrum of carbon samples. It is observed that the peak related to D-band is due to the breathing mode of six atoms of carbon rings, also regarded as a double-resonant and demands a defect for its activation (Cançado et al., 2011). It is also noted that the G-band of Raman spectra is equivalent to the doubly degenerate E2g phonon in the center of the Brillouin zone (Cançado et al., 2011; Wang et al., 2012). The D-band (indicative of defective carbon), presented by a peak at around ca. 1358 cm−1 is due to sp3-hybridized defective sites in the prepared samples (Eng et al., 2017), indicating structural defects, as well as other disordered structures on the graphitic carbon (Tian et al., 2016; Wang et al., 2012). The G-band (graphitic carbon) (Marsh et al., 2006), at around ca. 1600 cm−1, is commonly observed for all graphitic carbons and is a characteristic of the pristine sp2 bonded lattice (Eng et al., 2017; Vollebregt et al., 2012). All sample spectra show troughs with a high signal intensity between the D-band and G-band, which may be classified as the peak D3 band (ca. 1500 cm−1), indicating the occurrence of amorphous carbon (Sadezky et al., 2005). The D-band and G-band in all the sample spectra are broad, which can be attributed to higher disorder in graphite (Aziz et al., 2017; Jawhari et al., 1995). Comparing intensities of the D-band to G-band (ID/IG ratio) consequently identifies the relative quantity of disorder carbon to graphitic carbon in the AC samples (Eng et al., 2017). It is evident from Fig. 1(b), that with activation, a slight reduction in the ID/IG ratio from 0.92 for WANC to 0.87 and 0.85 for ZnNC and NaNC, respectively, suggests the conversion of disordered proportion to the ordered graphitic form (Eng et al., 2017; Liu et al., 2019) i.e. graphitic nature of the prepared carbon followed the order NaNC > ZnNC > WANC, which is exactly similar to the obtained order of BET surface area (discuss later in section 3.2). This indicates that the increase of porosity in the carbon enhances graphitization by thermal treatment.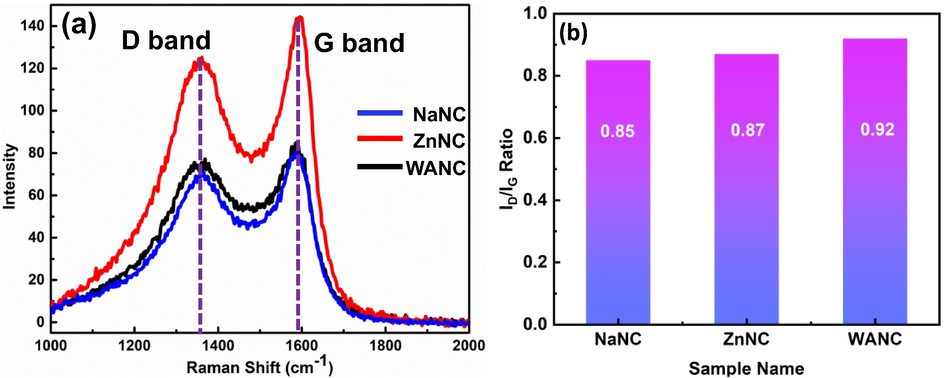
(a) Raman spectra of activated carbon samples WANC, ZnNC, and NaNC. (b) Average ratios of the D-band and G-band for Raman of the prepared samples.
The crystallinity of the fabricated samples is further investigated by XRD technique. Fig. 2 shows the XRD diffraction pattern for WANC, ZnNC, and NaNC in the 2θ range from 10° to 70°. The two broad diffraction peaks presented with a central sharp peak at 2θ = ∼24.7° and 44.3° in all the samples are attributed to (0 0 2) and (1 0 0) planes of the carbon material, respectively (Li et al., 2007). The broad diffraction peak (from ∼ 17° to ∼ 35°) in the entire prepared carbon samples occurs due to the presence of a considerable amount of disordered material and amorphous structures that contributed to the background intensity (Ahn et al., 2013). The presence of another one sharp peak at 26.1° in the entire XRD spectra for (0 0 2) plane might be related to the lower interlayer spacing (Liu et al., 2010) in some portion of the carbon for the entire prepared samples. In addition, the intensity of the sharp peak at 24.7° on the broad peak in NaNC are higher than those in WANC and ZnNC, indicating the enhanced graphitization (002 plane) degree of NaNC sample (Zhang et al., 2017). While addition two small peaks in the NaNC sample at around ∼35.5° and ∼39.7° reveal the formation of intralayer-condensation of carbon, which is beneficial throughout the electrochemical performance (Hemalathaa et al., 2020). The origin of another peak at 2θ = 17.45° in the WANC and NaNC samples is not yet clear.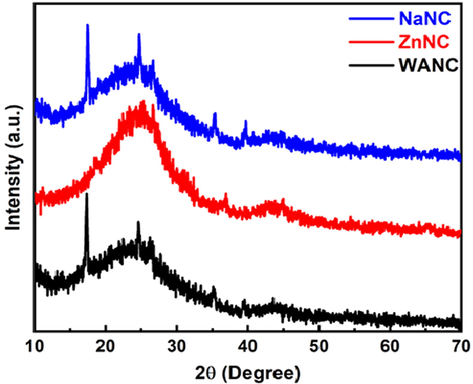
XRD patterns of WANC, ZnNC, and NaNC.
3.2 BET surface area and pore size distribution
To improve SC performance, carbon electrode surface properties and modifications are highly important. Hence, we have used ZnCl2 and NaHCO3 to enhance and modify the SSA of the prepared carbon electrodes. Fig. 3 presents the nitrogen isothermal analysis for the three prepared N-doped carbon samples, WANC, NaNC, and ZnNC, which was performed to determine their pore structures. It is evident that the three prepared carbon samples belong to type-IV isothermal sorption curves due to the presence of hysteresis loops (Deb Nath et al., 2019). In this curve type, the initial part of the curve is attributed to micropores, and the latter part is due to the existence of mesopores (Sing, 1985). In addition, an abrupt increase in the loop of NaNC at the range of high relative pressure in the range (P/P0 = 0.80–1.00) (Type H3 loop) shows that macropores are present (Y.-N. Sun et al., 2018; Thommes et al., 2015). The highest intensity of this H3 loop in the BET isotherm of NaNC indicates the presence of highest macroporosity in NaNC. Comparing the three results, NaNC shows the highest SSA of
, while the SSAs of ZnNC and WANC reached to
and
, respectively. NaNC had nearly three times the sorption volume of WANC, although the average pore width of WANC (∼49 Å) was larger than that of NaNC (∼28 Å), which indicates NaNC has a higher micro/mesopore ratio than WANC. On the other hand, average pore width (∼15 Å) and type of hysteresis loops of ZnNC indicate that it possesses a mixture of micro- and meso-porous structure. The obtained porosities are in agreement with the mechanism as discussed in the introduction section. The resultant average pore width and the corresponding BET SSA for the three synthesized samples (prepared carbons) are presented in Table 1. Based on the BET analysis, NaNC is classified as the best electrode material among entire prepared N-doped carbon materials, for SC applications.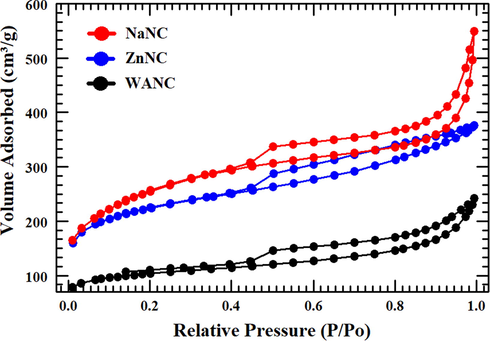
Nitrogen isothermal analysis for the WANC, ZnNC, and NaNC.
Carbon sample
Average pore diameter (Å)
BET SSA
WANC
49
ZnNC
15
NaNC
28
3.3 Surface morphology
The N-doped carbon prepared with or without the activating agent was studied via FESEM and TEM to identify the surface morphology of the prepared carbon samples. Fig. 4 shows both FESEM (Fig. 4a, c, and e) and TEM (Fig. 4 b, d, and f) images for WANC, ZnNC, and NaNC. The figures mentioned above show how the porous surface was improved by using an activating agent. Fig. 4a and b) demonstrates the bulk nature of WANC, which in turn explains the low surface area of this carbon material. Using ZnCl2 as an activating agent increases the carbon surface topography, as shown in Fig. 4c and d by the appearance of some small-sized pores. However, the use of NaHCO3 increases both the size and number of pores at the surface of NaNC carbon significantly, as displayed in Fig. 4e and f, thus increasing the SSA, which confirms the BET results discussed previously. NaNC is composed of carbon nanosheets with numerous macropores, which correlates with the BET data.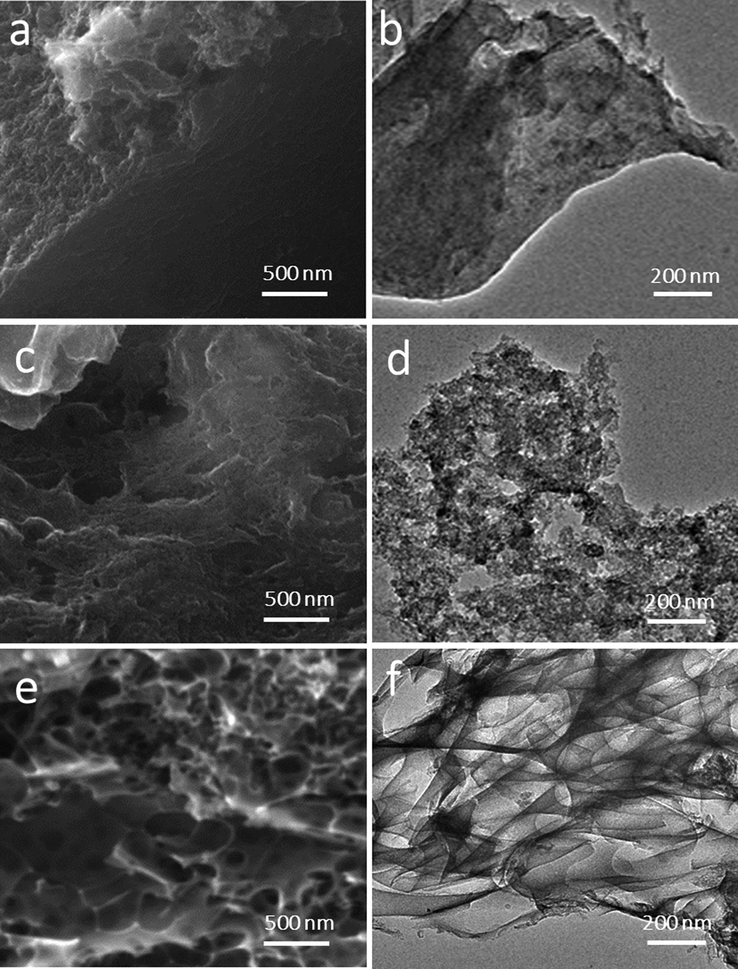
FESEM (a, c, e) micrographs and TEM (b, d, f) images of WANC (a and b), ZnNC (c and d), and NaNC (e and f) samples.
3.4 Chemical composition and functional groups
In carbon material preparation, functional groups along with numerous chemical compositions of the prepared materials specify a greater role in SC applications. Hence, the chemical composition and the functional groups mounted on the surface of the as-synthesized materials were investigated using XPS and FTIR techniques. The XPS data presented here are related to the NaNC sample considering it was the best of the three samples.
Three distinct peaks appeared at 531.8, 398.5, and 284.6 eV assigned to oxygen (O 1 s), nitrogen (N 1 s), and carbon (C 1 s), respectively, as described with Fig. 5a (Zou et al., 2016). A quantitative test shows that for NaNC, the composition percentages are 90% for C 1 s, 6.5% for O 1 s, and 3.5% for N 1 s. The survey scans (Fig. S1) of WANC and ZnNC samples and corresponding elemental compositional discussion (S1 XPS analysis) are provided in the supplementary information.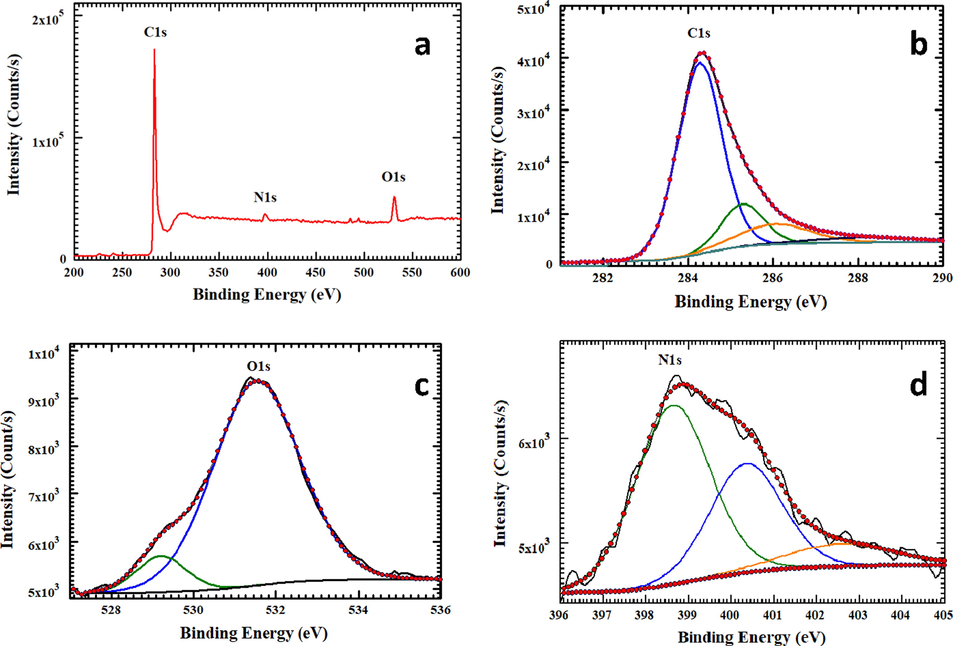
XPS survey spectra (a), C 1 s (b), O 1 s (c), N 1 s (d) spectra of NaNC.
Fig. 5b shows the XPS deconvoluted spectra for C 1 s, with four distinct peaks corresponding to the binding energies of 284.6, 285.6, 286.3, and 288.4 eV, those are related to sp2 C-C and C = C graphitic carbon, C-O phenol or alcohol bonding, C-N linkage, and ester linkages, respectively (Chua et al., 2016; Eng et al., 2017; Goel et al., 2015; Tian et al., 2016). The O 1 s deconvoluted spectra shown in Fig. 5c present the binding energies related to C = O groups at 529.2 eV and C-O-C or C-OH groups at 531.8 eV (Biniak et al., 1997; Hu et al., 2013). XPS is effective to analyze the characteristics of nitrogen species present in carbon materials (Deng et al., 2011). Fig. 5d portrays the three- deconvoluted peaks of N 1 s centered at 398.6, 400.4, and 402.3 eV, attributable to pyridinic, pyrrolic and /or pyridonic nitrogen (Goel et al., 2015; Lu et al., 2013; H. Wang et al., 2012; Zhang et al., 2019). The N1s high-resolution spectra centered at around 402.3 eV, corresponds to carbon atoms replaced by the nitrogen atoms in the form of graphitic (Lu et al., 2013). The high-resolution XPS spectra for C 1 s, O 1 s, and N 1 s of WANC and ZnNC samples are shown in Fig. S1. This XPS analysis confirms the presence of similar type C, O, and N in the entire prepared samples.
Fig. 6 displays the FTIR spectra of the WANC, ZnNC, and NaNC. All spectra show similar vibration bands characteristic of activated carbon materials (Hesas et al., 2013). FTIR spectra for all samples show a broad transmittance band peaked at ca. 3430 cm−1, which is attributed to the O–H stretching vibration of hydroxyl groups and adsorbed water (H-O-H) (C. Hu et al., 2013; Larkin, 2011). Noticeably, ZnNC shows a sign of a reduction in hydrogen bonding, as reflected by the small O–H band stretching at ca. 3430 cm−1. The band centered at ca. 1630 cm−1 observed is associated with the C = O bonds in carboxylic acid and carbonyl moieties (Hu et al., 2013; Tian et al., 2016). Besides, this observed band between ca. 1750 and 1500 cm−1 and centered ca. 1630 cm−1 may be related to the olefinic group (C = C, 1850–1500 cm−1)/(C = N) (Clougherty et al., 1957; Huang et al., 2017). The intense absorption band centered at ca. 1086 cm−1 is regarded as C-O stretching (C-O, 850–1300 cm−1) (Larkin, 2011) or C-N stretching (1080–1360 cm−1). The small and broad band observed between 3000 and 2800 cm−1 in the spectra of WANC and NaNC may be explained by adsorption of an aliphatic group (C–H). The band appearing in the NaNC spectrum at ca. 2082 cm−1 can be assigned to a carbon–carbon triple bond (–C≡C–), triple and cumulated double bond stretch usually appears as a weak band from 2260 to 2100 cm−1 (Larkin, 2011). Overall, it is very difficult to differentiate the oxygen and nitrogen-containing functional groups in the synthesized carbon samples by FTIR as the peaks overlap. This phenomenon was realized in the reported FTIR spectra of graphene oxide and N-doped graphene oxide (Kumar et al., 2013).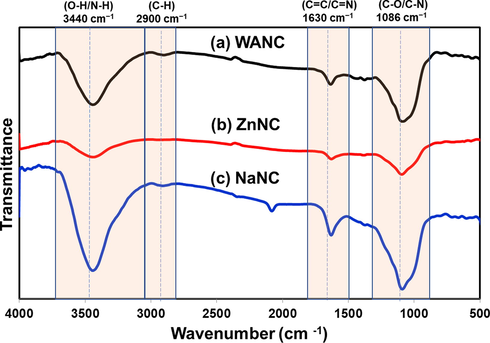
FTIR spectra of (a) WANC, (b) ZnNC, and (c) NaNC.
3.5 Electrochemical measurements
CV and GCD measurements have been carried out with the three-carbon electrodes to study their supercapacitance performance. The graphs in Fig. 7 compare the electrochemical performances of each of the three samples. By looking at Fig. 7(a), it is evident that all CV curves of WANC, ZnNC, and NaNC have a nearly rectangle-like shape exhibiting typical EDLC behavior (Karthikeyan et al., 2010; Tang et al., 2012; Wang et al., 2014). As mentioned previously, the sole purpose of the process of activation is to enhance the SSA of the carbon electrode, which has a significant role in boosting the specific capacity of the EDLC of the electrode. As expected, WANC and ZnNC, which show the low SSA as compared to NaNC, exhibit small specific capacitances of 35.9 F g−1 and 53.4 F g−1, respectively, at a 20 mVs−1 scan rate. While NaNC indicates a greater specific capacitance of 160.2 F g−1 at the same scan rate. A similar performance was observed in the measurements of charging-discharging, as shown in Fig. 7(b). NaNC has the highest discharging rate and hence the largest specific capacitance. In detail, at 5 A g−1, NaNC has a specific capacitance value of 166.7 F g−1, while WANC and ZnNC have a specific capacitance of 19.1 F g−1 and 30.3 F g−1, respectively. Both WANC and NaNC have oxygen- and nitrogen-containing functional groups that turn to improve the conductivity of the carbon (Cheng et al., 2012; Suktha et al., 2015). Yet, the higher SSA and higher content nitrogen, higher amount of macroporosity and sheet type structure of NaNC is the main reason for its higher capacitance performance compare to WANC and ZnNC. NaHCO3-activated carbon was investigated further by varying the scan rates. Fig. 8(a) presents the CV measurements of NaNC at scan rates of 5, 10, 20, and 50 mV s−1, which produced the corresponding specific capacitances of 225.8 F g−1, 198.6 F g−1, 160.2 F g−1, and 104.8 F g−1, respectively. At 50 mV s−1, a small distorted rectangle based shape was observed in the CV curve, but with a specific capacitance of 104.8 F g−1, which indicates good capacitance capability of NaNC even at high scan rates. The prepared NaNC-modified steel foil electrode also exhibited significantly high electrochemical surface area (ECSA) of ca. 1376 cm2. The details to estimate ECSA for NaNC are summarized in the supplementary information.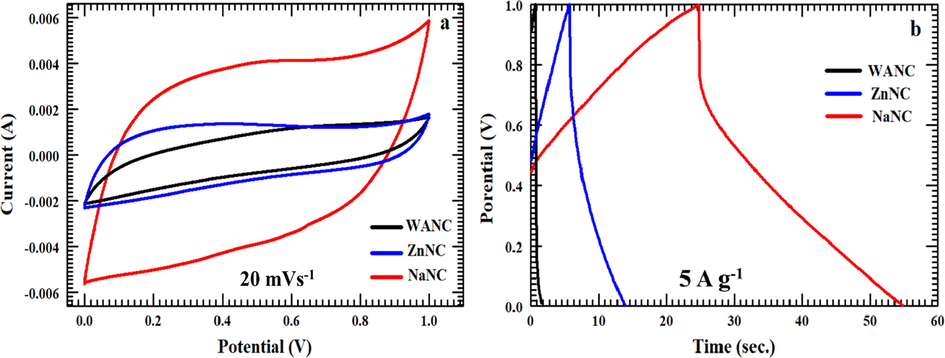
CV at scan rate of 20 mVs−1 and GCD measurements at current density of 5 A g−1 of WANC, ZnNC, and NaNC.
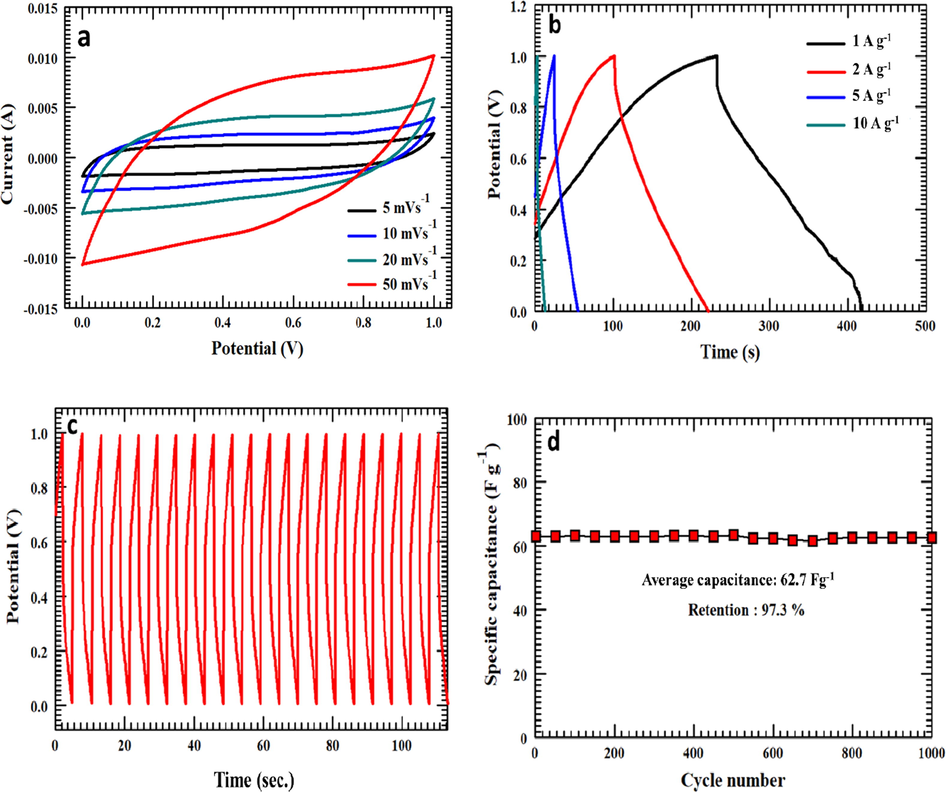
(a) CV curves of NaNC sample at 5, 10, 20, and 50 mVs−1 scan rate, (b) GCD profiles with different applied current densities, (c) 20 GCD cycles at 20 A g−1 current density, and (d) specific capacitance retention of the prepared NaNC electrode at 20 A g−1 current density.
GCD curves of NaNC were obtained to examine capacitance performance by varying the applied current densities, as depicted in Fig. 8(b). The GCD profiles show a quasi-triangular shape, revealing ideal EDLC behavior (Yang et al., 2005). A specific capacitance of 231.2 F g−1 was attained at an applied current density of 1 A g−1. By increasing the value of the applied current density to 2 A g−1, 5 A g−1, and 10 A g−1, the specific capacitance decreased to 214.5 F g−1, 166.7 F g−1, and 108.8 F g−1, respectively. The decreasing tendency in the specific capacitance along through an increase in the applied current density is attributed to insufficient electrolyte ion diffusion on the carbon electrode surface at higher current densities (Mondal, Kretschmer, Zhao, Liu, Wang, et al., 2017). Fig. 8(c) demonstrates the first 20 charging-discharging cycles of 1000 cycles for NaNC electrode, while the first and last few cycles as a proof of their cycling stability are shown in Fig. S3. These cycles have similar curves, indicating stability and excellent electrochemical performance. Fig. 8(d) shows 97.3% retention even after 1000 continuous charging-discharging cycles, which confirms the high stability of the NaNC sample. The specific capacitances of the three-carbon electrodes, WANC, ZnNC, and NaNC are summarized in the Table 2. The capacitance of NaNC (231.2 F g−1) mentioned in this study is comparable with the previously reported carbon electrodes that derived from different biomass feedstocks as described in Table 3.

Biomass waste (carbon source)
Activating agent
SSA(m2/g)
Specific capacitance (F g−1)
Measurement conditions
Reference
Giant Miscanthus
KOH
2212
121
1 M TEABF4 0.5 mA/cm2
(Han et al., 2018)
Onion
KOH
1914.9
179.5
6 M KOH at 0.5 A
(W. Zhang et al., 2018)
Urumqi oil-pressing mill
ZnCl2
1416.9
170.5
1 M H2SO4 5 mV/s
(X. Kang et al., 2018)
Bamboo leaves
Manganese silicate
300.3
162.2
3 M KOH 0.5 A g−1
(Qiushi Wang et al., 2019)
Larch waste
ZnCl2
36
213.7
1 M KOH 0.2 A g−1
(Y. Zhang et al., 2020)
Locust seed
K2FeO4
2010.1
333
6 M KOH 1 A g−1
(Hou et al., 2019)
Tea seed
KOH
1503.2
168
1 M/L KOH 0.5 A g−1
(Quan et al., 2020)
Glucose
CO2/ KOH
3,657
175
EMIM-TFSI/AN 0.5 1 A g−1
(Jung et al., 2018)
Grape seeds
KOH
698
260
H2SO4 1 mA g−1
(Guardia et al., 2019)
Syzygium cuminiLeaves
NaHCO3
1184.4
222.3
1 M H2SO4 1 A g−1
(Deb Nath et al., 2019)
Albizia Procera
NaHCO3
910
231
1 M H2SO4 1 mA g−1
This work
Other important factors to demonstrate the electrochemical performance of a SC are the energy and power densities. The energy density and power density for NaNC electrode were calculated from GCD profiles at different current densities using Eqs. (4) and (5), respectively. Fig. S4 shows the Ragone plot of the NaNC electrode, where the NaNC attained a maximum energy density of 32 Wh kg−1 at a power density of 625 W kg−1 and retained 15 Wh kg−1 at a higher-power density of 6250 W kg−1(Fig. S4). The results mentioned above suggest that the activated carbon NaNC is a promising electrode material in the field of SCs.
4 Conclusion
N-doped carbon from Albizia plant leaves was successfully prepared without and with the activating agents ZnCl2 and NaHCO3. The SSA of the activated carbon by NaHCO3 was observed to be three times greater than that of the non-activated carbon. The three prepared carbon samples were characterized using XRD, FESEM, Raman, and TEM. These results confirmed the amorphous structure and porous nature of the prepared carbon materials. The XPS and FTIR analysis confirmed the availability of nitrogen and oxygen-containing functional groups in the synthesized carbon materials. The specific capacitance of the untreated and activated carbon was studied through CV and GCD tests. The activated carbon NaNC, which had the highest surface area, highest macrosporsity, highest nitrogen content, and sheet type morphology, had the highest specific capacitance of the carbon samples. The specific capacitance of NaNC was examined at various CV scan rates and applied current densities, and the results demonstrated the ideal EDLC behavior. Furthermore, the activated carbon NaNC delivered remarkable energy and power densities and displayed very good charging-discharging cycle stability (97.3% retained after 1000 cycles), which confirmed the excellent supercapacitance efficiency of this material.
Acknowledgment
The support provided by CENT-KFUPM in the utilization of research facilities in all the reported characterizations.
Declaration of Competing Interest
The authors declare no conflict of interest.
References
- Recent development in the production of activated carbon electrodes from agricultural waste biomass for supercapacitors: a review. Renew. Sustain. Energy Rev.. 2015;52:1282-1293.
- [CrossRef] [Google Scholar]
- Supercapacitor performance of activated carbon derived from rotten carrot in aqueous, organic and ionic liquid based electrolytes. J. Saudi Chem. Soc.. 2018;22(8):993-1002.
- [Google Scholar]
- Nitrogen doped activated carbon derived from orange peel for supercapacitor application. Adv. Nat. Sci.: Nanosci. Nanotechnol.. 2018;9(3):035008
- [Google Scholar]
- Utilization of wood biomass char in a direct carbon fuel cell (DCFC) system. Appl. Energy. 2013;105:207-216.
- [Google Scholar]
- Novel supercapacitor electrodes based semiconductor nanoheterostructure of CdS/rGO/CeO2 as efficient candidates. Arabian J. Chem.. 2018;11(5):692-699.
- [CrossRef] [Google Scholar]
- A simple and direct preparation of a substrate-free interconnected nanostructured carbon electrode from date palm leaflets for detecting hydroquinone. ChemistrySelect. 2017;2(17):4787-4793.
- [CrossRef] [Google Scholar]
- Carbons for electrochemical energy storage and conversion systems. Crc Press; 2009.
- The characterization of activated carbons with oxygen and nitrogen surface groups. Carbon. 1997;35(12):1799-1810.
- [Google Scholar]
- Broccoli-like porous carbon nitride from ZIF-8 and melamine for high performance supercapacitors. Appl. Surf. Sci.. 2018;440:47-54.
- [Google Scholar]
- Quantifying defects in graphene via Raman spectroscopy at different excitation energies. Nano Lett.. 2011;11(8):3190-3196.
- [Google Scholar]
- Synthesis of nitrogen-doped porous carbon nanofibers as an efficient electrode material for supercapacitors. ACS Nano. 2012;6(8):7092-7102.
- [Google Scholar]
- Synergistic effects from graphene and carbon nanotubes enable flexible and robust electrodes for high-performance supercapacitors. Nano Lett.. 2012;12(8):4206-4211.
- [Google Scholar]
- Study on chemical composition and nutritive value of Albizia tree leaves as a livestock feed. Int. J. Sci. Environ. Technol.. 2016;5(6):4638-4642.
- [Google Scholar]
- The reduction of graphene oxide with hydrazine: elucidating its reductive capability based on a reaction-model approach. Chem. Commun.. 2016;52(1):72-75.
- [Google Scholar]
- C= N stretching frequency in infrared spectra of aromatic azomethines. J. Org. Chem.. 1957;22(4) 462–462
- [Google Scholar]
- Defective carbon nanosheets derived from syzygium cumini leaves for electrochemical energy-storage. ChemistrySelect. 2019;4(31):9079-9083.
- [CrossRef] [Google Scholar]
- Toward N-doped graphene via solvothermal synthesis. Chem. Mater.. 2011;23(5):1188-1193.
- [Google Scholar]
- Perspectives on carbon nanotubes and graphene Raman spectroscopy. Nano Lett.. 2010;10(3):751-758.
- [Google Scholar]
- Synthesis of carboxylated-graphenes by the Kolbe-Schmitt process. ACS Nano. 2017;11(2):1789-1797.
- [CrossRef] [Google Scholar]
- Boron-doped ordered mesoporous carbons for the application of supercapacitors. Electrochim. Acta. 2016;207:266-274.
- [Google Scholar]
- Synthesis of nitrogen doped mesoporous carbons for carbon dioxide capture. RSC Adv.. 2015;5(58):46568-46582.
- [Google Scholar]
- Influence of Activating Reagents on the Porous Structure of Activated Carbon. Chem. Eng. Trans.. 2018;70:1897-1902.
- [Google Scholar]
- Biomass waste-carbon/reduced graphene oxide composite electrodes for enhanced supercapacitors. Electrochim. Acta. 2019;298:910-917.
- [Google Scholar]
- High performance heteroatoms quaternary-doped carbon catalysts derived from Shewanella bacteria for oxygen reduction. Sci. Rep.. 2015;5:17064.
- [CrossRef] [Google Scholar]
- Herbaceous biomass waste-derived activated carbons for supercapacitors. J. Electrochem. Sci. Tech. 2018;9:157-162.
- [Google Scholar]
- Concomitant use of azolla derived bioelectrode as anode and hydrolysate as substrate for microbial fuel cell and electro-fermentation applications. Sci. Total Environ.. 2020;707:135851
- [Google Scholar]
- Preparation and characterization of activated carbon from apple waste by microwave-assisted phosphoric acid activation: application in methylene blue adsorption. BioResources. 2013;8(2):2950-2966.
- [Google Scholar]
- Hierarchically porous and heteroatom self-doped graphitic biomass carbon for supercapacitors. J. Colloid Interface Sci.. 2019;540:88-96.
- [Google Scholar]
- One-step preparation of nitrogen-doped graphene quantum dots from oxidized debris of graphene oxide. J. Mater. Chem. B. 2013;1(1):39-42.
- [Google Scholar]
- Mesoporous high-surface-area activated carbon. Microporous Mesoporous Mater.. 2001;43(3):267-275.
- [Google Scholar]
- Highly efficient magnetic nitrogen-doped porous carbon prepared by one-step carbonization strategy for Hg2+ removal from water. ACS Appl. Mater. Interfaces. 2017;9(3):2550-2559.
- [Google Scholar]
- Raman spectroscopic characterization of some commercially available carbon black materials. Carbon. 1995;33(11):1561-1565.
- [Google Scholar]
- Activated biomass-derived graphene-based carbons for supercapacitors with high energy and power density. Sci. Rep.. 2018;8(1):1-8.
- [Google Scholar]
- Battery materials for ultrafast charging and discharging. Nature. 2009;458(7235):190.
- [Google Scholar]
- Biomass derived hierarchically porous and heteroatom-doped carbons for supercapacitors. J. Colloid Interface Sci.. 2018;509:369-383.
- [Google Scholar]
- A novel asymmetric hybrid supercapacitor based on Li2FeSiO4 and activated carbon electrodes. J. Alloy. Compd.. 2010;504(1):224-227.
- [CrossRef] [Google Scholar]
- Plasma-assisted simultaneous reduction and nitrogen doping of graphene oxide nanosheets. J. Mater. Chem. A. 2013;1(14):4431-4435.
- [Google Scholar]
- General outline and strategies for IR and Raman spectral interpretation. IR and Raman Spectroscopy: Principles and Spectral Interpretation 2011:117-134.
- [Google Scholar]
- Studies on preparation and performances of carbon aerogel electrodes for the application of supercapacitor. J. Power Sources. 2006;158(1):784-788.
- [Google Scholar]
- Review and prospect of NiCo2O4-based composite materials for supercapacitor electrodes. J. Energy Chem.. 2019;31:54-78.
- [Google Scholar]
- X-ray diffraction patterns of graphite and turbostratic carbon. Carbon. 2007;45(8):1686-1695.
- [Google Scholar]
- Graphene-based supercapacitor with an ultrahigh energy density. Nano Lett.. 2010;10(12):4863-4868.
- [Google Scholar]
- Preparation of activated carbon from spent catalyst with mercury by microwave-induced CO2 activation. Asia-Pac. J. Chem. Eng.. 2019;14(1):e2272
- [Google Scholar]
- Hollow porous carbon spheres with hierarchical nanoarchitecture for application of the high performance supercapacitors. Electrochim. Acta. 2016;211:183-192.
- [Google Scholar]
- Microstructure of carbon derived from mangrove charcoal and its application in Li-ion batteries. Electrochim. Acta. 2010;55(5):1696-1700.
- [Google Scholar]
- Biomass-derived nitrogen self-doped porous carbon as effective metal-free catalysts for oxygen reduction reaction. Nanoscale. 2015;7(14):6136-6142.
- [Google Scholar]
- Biomass-derived carbon electrode materials for supercapacitors. Sustain. Energy Fuels. 2017;1(6):1265-1281.
- [CrossRef] [Google Scholar]
- Supercapacitor electrodes with high-energy and power densities prepared from monolithic NiO/Ni nanocomposites. Angew. Chem. Int. Ed.. 2011;50(30):6847-6850.
- [Google Scholar]
- Porous activated carbon derived from Chinese-chive for high energy hybrid lithium-ion capacitor. J. Power Sources. 2018;398:128-136.
- [Google Scholar]
- Manganese dioxide/ant-nest-like hierarchical porous carbon composite with robust supercapacitive performances. ACS Sustain. Chem. Eng.. 2018;6(6):7362-7371.
- [Google Scholar]
- Facile preparation of nitrogen-doped reduced graphene oxide as a metal-free catalyst for oxygen reduction reaction. J. Mater. Sci.. 2013;48(23):8101-8107.
- [Google Scholar]
- Nitrogen-doped porous carbon derived from biomass waste for high-performance supercapacitor. Bioresour. Technol.. 2015;197:137-142.
- [Google Scholar]
- Marsh, H., & Reinoso, F. R. (2006). Activated carbon: Elsevier.
- Naturally nitrogen doped porous carbon derived from waste shrimp shells for high-performance lithium ion batteries and supercapacitors. Micropor. Mesopor. Mater.. 2017;246:72-80.
- [Google Scholar]
- Nitrogen-doped porous carbon nanosheets from eco-friendly eucalyptus leaves as high performance electrode materials for supercapacitors and lithium ion batteries. Chem.–A Europ. J.. 2017;23(15):3683-3690.
- [CrossRef] [Google Scholar]
- Intercalation-type electrodes of copper–cobalt oxides for high-energy-density supercapacitors. J. Electroanal. Chem.. 2020;861:113947 ARTN 113947
- [CrossRef] [Google Scholar]
- Carbon properties and their role in supercapacitors. J. Power Sources. 2006;157(1):11-27.
- [CrossRef] [Google Scholar]
- Ultrahigh-power micrometre-sized supercapacitors based on onion-like carbon. Nat. Nanotechnol.. 2010;5(9):651.
- [Google Scholar]
- Carbon nanotube and conducting polymer composites for supercapacitors. Prog. Nat. Sci.. 2008;18(7):777-788.
- [Google Scholar]
- Nitrogen-doping activated biomass carbon from tea seed shell for CO2 capture and supercapacitor. Int. J. Energy Res.. 2020;44(2):1218-1232.
- [Google Scholar]
- Ionic liquid dynamics in nanoporous carbon nanofibers in supercapacitors measured with in operando infrared spectroelectrochemistry. J. Phys. Chem. C. 2014;118(38):21846-21855.
- [Google Scholar]
- Raman microspectroscopy of soot and related carbonaceous materials: spectral analysis and structural information. Carbon. 2005;43(8):1731-1742.
- [Google Scholar]
- High surface area mesoporous activated carbon from tomato processing solid waste by zinc chloride activation: process optimization, characterization and dyes adsorption. J. Cleaner Prod.. 2016;113:995-1004.
- [CrossRef] [Google Scholar]
- Nanoarchitectonics of nanoporous carbon materials from natural resource for supercapacitor application. J. Inorg. Organomet. Polym Mater.. 2017;27(1):48-56.
- [Google Scholar]
- Reporting physisorption data for gas/solid systems with special reference to the determination of surface area and porosity (Recommendations 1984) Pure Appl. Chem.. 1985;57(4):603-619.
- [CrossRef] [Google Scholar]
- Supercapacitors from activated carbon derived from banana fibers. J. Phys. Chem. C. 2007;111(20):7527-7531.
- [CrossRef] [Google Scholar]
- High-performance supercapacitor of functionalized carbon fiber paper with high surface ionic and bulk electronic conductivity: effect of organic functional groups. Electrochim. Acta. 2015;176:504-513.
- [Google Scholar]
- Nitrogen-doped high surface area carbon as efficient electrode material for supercapacitors. NANO. 2016;11(07):1650076.
- [Google Scholar]
- Nitrogen-doped porous carbons derived from polypyrrole-based aerogels for gas uptake and supercapacitors. ACS Appl. Nano Mater.. 2018;1(2):609-616.
- [Google Scholar]
- Macropore-and micropore-dominated carbon derived from poly (vinyl alcohol) and polyvinylpyrrolidone for supercapacitor and capacitive deionization. ACS Sustain. Chem. Eng.. 2017;5(12):11324-11333.
- [Google Scholar]
- A high energy density asymmetric supercapacitor from nano-architectured Ni(OH)2/carbon nanotube electrodes. Adv. Funct. Mater.. 2012;22(6):1272-1278.
- [CrossRef] [Google Scholar]
- Electrochemical supercapacitors of cobalt hydroxide nanoplates grown on conducting cadmium oxide base-electrodes. Arabian J. Chem.. 2017;10(4):515-522.
- [CrossRef] [Google Scholar]
- Physisorption of gases, with special reference to the evaluation of surface area and pore size distribution (IUPAC Technical Report) Pure Appl. Chem.. 2015;87(9–10):1051-1069.
- [CrossRef] [Google Scholar]
- Facile synthesis of highly conductive sulfur-doped reduced graphene oxide sheets. PCCP. 2016;18(2):1125-1130.
- [Google Scholar]
- Influence of the growth temperature on the first and second-order Raman band ratios and widths of carbon nanotubes and fibers. Carbon. 2012;50(10):3542-3554.
- [Google Scholar]
- A review of electrode materials for electrochemical supercapacitors. Chem. Soc. Rev.. 2012;41(2):797-828.
- [CrossRef] [Google Scholar]
- Review on recent progress in nitrogen-doped graphene: synthesis, characterization, and its potential applications. ACS Catal.. 2012;2(5):781-794.
- [CrossRef] [Google Scholar]
- Three-dimensional flower-like and hierarchical porous carbon materials as high-rate performance electrodes for supercapacitors. Carbon. 2014;67:119-127.
- [CrossRef] [Google Scholar]
- In-situ grown manganese silicate from biomass-derived heteroatom-doped porous carbon for supercapacitors with high performance. J. Colloid Interface Sci.. 2019;534:142-155.
- [Google Scholar]
- Electropolymerized polyaniline nanocomposites from multi-walled carbon nanotubes with tuned surface functionalities for electrochemical energy storage. J. Electrochem. Soc.. 2013;160(7):G3038-G3045.
- [CrossRef] [Google Scholar]
- Large scale production of biomass-derived nitrogen-doped porous carbon materials for supercapacitors. Electrochim. Acta. 2015;169:186-194.
- [Google Scholar]
- Effect of activating agent on the preparation of bamboo-based high surface area activated carbon by microwave heating. High Temp. Mater. Processes (London). 2016;35(6):535-541.
- [Google Scholar]
- All solid-state electric double-layer capacitors based on alkaline polyvinyl alcohol polymer electrolytes. J. Power Sources. 2005;152:303-310.
- [Google Scholar]
- Porous spherical NiO@ NiMoO4@ PPy nanoarchitectures as advanced electrochemical pseudocapacitor materials. Sci. Bull.. 2020;65:546-556.
- [Google Scholar]
- Approaching High-Performance Supercapacitors via Enhancing Pseudocapacitive Nickel Oxide-Based Materials. Advanced Sustainable Systems; 2020.
- One pot synthesis of nitrogen-doped hierarchical porous carbon derived from phenolic formaldehyde resin with sodium citrate as activation agent for supercapacitors. J. Mater. Sci.: Mater. Electron.. 2018;29(6):4639-4648.
- [Google Scholar]
- Improving biomass-derived carbon by activation with nitrogen and cobalt for supercapacitors and oxygen reduction reaction. Appl. Surf. Sci.. 2017;411:251-260.
- [Google Scholar]
- Hierarchical porous carbon prepared from biomass through a facile method for supercapacitor applications. J. Colloid Interface Sci.. 2018;530:338-344.
- [CrossRef] [Google Scholar]
- Polydopamine-assisted formation of Co3O4-nanocube-anchored reduced graphene oxide composite for high-performance supercapacitors. Ceram. Int.. 2019;45(11):13894-13902.
- [Google Scholar]
- Effect of activation agents on the surface chemical properties and desulphurization performance of activated carbon. Sci. China Technol. Sci.. 2010;53(9):2515-2520.
- [Google Scholar]
- Regulatory pore structure of biomass-based carbon for supercapacitor applications. Micropor. Mesopor. Mater.. 2020;297:110032
- [Google Scholar]
- Core-shell structured MoS2@ Mesoporous hollow carbon spheres nanocomposite for supercapacitors applications with enhanced capacitance and energy density. Electrochim. Acta. 2019;298:630-639.
- [Google Scholar]
- Zou, B.-X., Wang, Y., Huang, X., & Lu, Y. 2018. Hierarchical N-and O-Doped Porous Carbon Composites for High-Performance Supercapacitors. J. Nanomater., 2018.
- One-pot synthesis of ternary polypyrrole-Prussian-blue-graphene-oxide hybrid composite as electrode material for high-performance supercapacitors. Electrochim. Acta. 2016;188:126-134.
- [Google Scholar]
Appendix A
Supplementary material
Supplementary data to this article can be found online at https://doi.org/10.1016/j.arabjc.2020.05.017.
Appendix A
Supplementary material
The following are the Supplementary data to this article:Supplementary data 1
Supplementary data 1


