

Translate this page into:
Effect of doping activated carbon based Ricinodendron Heudelotti shells with AgNPs on the adsorption of indigo carmine and its antibacterial properties
⁎Corresponding author. ndinsami2002@yahoo.com (Ndi Julius Nsami) bigpielo2002@yahoo.com (Ndi Julius Nsami)
-
Received: ,
Accepted: ,
This article was originally published by Elsevier and was migrated to Scientific Scholar after the change of Publisher.
Peer review under responsibility of King Saud University.
Abstract
Two adsorbents samples namely ZnCl2 Activated carbon (ACZ); and a composite from ACZ doped with silver nanoparticles (ACZ/AgNP) made by successful precipitation loading onto ACZ and silver nanoparticles of the Recinodendron heudelotti shells aqueouse extract (RHSNP) were prepared. The ACZ and ACZ/AgNP materials were characterised by scanning electron microscopy (SEM), Energy dispersive X-ray (EDX), Fourier Transform Infra-Red (FTIR) spectroscopy, X-ray diffraction (XRD) and particle size by Zeta sizer. The antibacterial activities of ACZ, ACZ/AgNP the RHSNP and the RHS extract was done by the broth microdilution test on Shigella flexneri, Salmonella typhi and Escherichia coli species. Futhermore, the adsorption capacities of the ACZ and the ACZ/AgNP was investigated using the hazardous Indigo Carmine (IC) dye. The SEM results shows spongy rock-like surface on both adsorbents (ACZ and ACZ/AgNP) with the presence of pores, EDX and XRD shows the presence of crystalline zincite on ACZ and Ag on the ACZ/AgNP. The FTIR spectral for both adsorbents preseumes a composite material while the zeta sizer shows that all the materials samples prepared were in the nano-range. The extract and ACZ showed no antimicrobial activities while the antimicrobial properties were proven to be very interesting for the nanoparticles and the ACZ/AgNP but higher for the ACZ/AgNP (7.812 ≤ MIC ≤ 31.25 µg/ml). The adsorption capacities of IC were found to decrease by 33.15% respectively using the maximum concentration at equilibrium. RHS is therefore a good and promising precursor for the preparation of activated carbon and nanoparticles for bacterial containing water purification and for the treatment of bacterial infections.
Keywords
Activated carbon
Silver nanoparticle
Composite
Adsorption
Antibacterial activity

1 Introduction
During the last two decades water reuse has become a key element in integrated water resources management under water scarcity conditions. In terms of quantity wastewater treatment plant, effluent represents a highly reliable water source but quality aspects prevent high-quality water reuse without advanced water treatment. This is basically be due to the (excess) pollution with numerous microbial, organic and inorganic contaminants posing severe health risks (Wang et al., 2015; Ankoro et al., 2016). Water reclamation applications such as indirect or even direct potable reuse target therefore at a complete removal of microbial (pathogens), organic, inorganic and trace contaminants to minimise the risk and reach drinking water quality.
As a matter of fact, the rapid increase in textile industries in the world and the increasing demand for textile, and also the ceramic paper, printing and plastic use large varieties of dyes as their raw materials and also, some dyes are used in medicine and biological strain and coloring plastic (Ankoro et al., 2016; Harrache et al., 2019). The waste from these industries in one way or the other finally ends up in water, thereby polluting the environment. Unlike other pollutants, dye pollutants especially those with the benzene ring even at low concentration is visible in water and reduce light penetration in to water, hence causes negative effect on photosynthesis to water plants as they are non-degradable (Gao et al., 2016; Maleki et al., 2017; Harrache et al., 2019). Furthermore, bacteria, viruses, parasites and fungi have been widely used in food, brewery and many other industries for the production of consumables and also for the production of vaccines. Some of these bacteria, viruses, parasites and fungi are resistant to drugs and hence causes over 700,000 deaths each year. It has been estimated that by 2050, such ‘superbugs’, inured to treatments, could cause up to 10 million deaths annually and cost the global economy of about US$100 trillion (David, 2017). Waste water containing IC dye are rich both in color, organic contents and large amount of suspends solid which are broadly fluctuating pH, high temperature and beside high chemical oxygen demand. According to the According World Health organization, indigo carmine dye at concentration greater than 0.005 mg/L (Harrache et al., 2019) is not acceptable in water while the micro-organisms are not appreciated in normal water no-matter the concentration. Also, water containing bacterials and viruses such as shigella flexneri, Salmonella typhi and Escherichia coli are known to cause infections such as typhoid fever, joint pains etc.
Therefore, full scale systems apply treatment trains for water reclamation and reuse based on the multi-barrier principle combining several unit processes to remove these unwanted pollutants to the parts-per-trillion level corresponding to the usual detection limit of the analytical methods is essential. Many methods have been adopted for treatment of waste water and industry effluents (Dong et al., 2015). One of the best and convenient water treatment processes is seemed to be adsorption, as it is cheap, easy and simple in operation (Elkady et al., 2015). AC is one of the most widely used as a natural and cost effective adsorbent of colours and organic substances (Ndi et al., 2013). This is due to its outstanding adsorptive ability and its wide variety of forms to suit different processing conditions. For this reason, the adsorption capacity of AC to remove phenolic and coloured compounds in food stuff and fruit juices as well as its application in waste water treatment have been extensively studied (Chee et al., 2013). As standard method for organics, and inorganic contaminants removal, several projects (Gao et al., 2016; Maleki et al., 2017) investigated the behaviour and optimisation of activated carbon in effluent treatment. AC as adsorbent have relatively high surface area, large porosity, high total pore volume and presence of wide spectrum of functional groups on its surface, which provides a strong affinity for even low concentration organics to attach to itself. Nevertheless, the well-developed internal pore structure of AC with macropores serves as excellent loci for colonization of organisms and support material for bacterial growth (Das et al., 2015; El-Shafey et al., 2016). The biofilm layer formations on the AC by the microbes have undesirable effects as the filter may clog up as a result of excessive bacterial growth (Karthik and Radha, 2016). Against this backdrop, more attention is focused to water treatment with engineered nanoparticles. These nanoparticles can be produced by numerous techniques, including chemical, aerosol, electrochemical, laser irradiation, sonochemical deposition, photochemical reduction and biological techniques. Among the nanoparticles, silver nanoparticles (AgNP) are gaining more importance from others because of its antimicrobial and antiviral properties, and also use for water purification (Karthik and Radha, 2016). The believed mechanism is that AgNPs attach to the surface of cell membrane disturbing the permeability and respiration functions of the cells, which leads to microbial cell death. Nanocomposite as adsorbent has proven as an efficient adsorbent because of the increase in their surface-to-volume ratio with the reduction of the size of the adsorbent particles from bulk to nano dimensions. Ernst (2000) was the first researcher to investigate treatment trains combining nanofiltration and activated carbon for effluent polishing prior to managed aquifer recharge. That’s not withstanding, to the best of our knowledge the quest for low cost and renewable precursors for the production of activated carbons (Yakout and El-Deen, 2016; Lekene et al., 2019) with antibacterial properties still remain a major challenge to researchers as Ernst (2000) did not investigate his composite material on organic micropollutants. Also, a comparative study of the adsorption capacities and antibacterial studies on the effect of doping activated carbon with AgNP have not yet been exploited while Karthik and Radha (2016) only tested the anti-microbial properties but failed to investigate if the material is still a good adsorbent. This is because doping an AC might increase its antibacterial properties and may reduce its adsorption properties on organic and inorganic pollutants as a result of the NPs occupying the pores or binding to the active sites needed for surface adsorption. In the present study, silver nanoparticles were biogenically synthesized using extracts from Ricinodendron heudelotii shells and the synthesized nanoparticles were incorporated onto activated carbon prepared from these same nut shells to produce a nanocomposite. Therefore, this work aim to investigate the effect of doping activated carbon with AgNP on adsorption of IC dye and its antibacterial capacities on Shigella flexneri, Salmonella typhi and Escherichia coli bacteria.
2 Materials and methods
2.1 Preparation of ACZ sample
10.0 g of the crushed dried RDH shells were impregnated with the ZnCl2 solution of impregnation ratio 0.659 of RH shells. Each mixture was left for 1 h at room temperature, so that reagents are fully absorbed into the RH shells network. The impregnated RH shells were dried at 110 °C for 24 h in an oven. The dried impregnated RDH shells were cooled in a desiccator for 1 h and the dried samples were carbonised using a Carbolite Funace at a temperature of 432 °C for 40 min. The Activated carbon obtained was then washed with distilled water. The resulting sample was named ACZ.
2.2 Preparation of silver nanoparticles and nanocomposite
2.2.1 Preparation of silver nanoparticles
5.0 g of the powder raw RH shells was mixed with 200 mL of distilled water and stirred using a magnetic stirrer for 30 mins and filtered. In 100 mL of 1 mM, and 5 mM silver nitrate (AgNO3) solution, 100 mL of supernatant sample was added slowly and was observed for colour change. The particles resulting from the reduction of AgNO3 are called as AgNP.
2.2.2 Preparation of silver nanocomposite
The AgNP was loaded on AC by means of simple agitation. 5.0 g of ACZ was taken and added to obtain AgNPs solution. It was mixed vigorously by continuous stirring for 1 h at 150 rpm using Horse shoe IKA agitator. The nanocomposite product was obtained by drying the AgNP loaded activated carbon powder in an oven at a temperature of 110 °C. The resulting sample was named ACZ/AgNP.
2.2.3 Characterization of the adsorbents and Ag NPs
Activated Carbons ACZ and ACZ/AgNP were observed and photographed by using a scanning Electron Microscopy equipped with Energy Dispersive Spectrometer (SEMEDS, LEO 1455 VP). The structural analysis of the samples were carried out by a powder X-ray diffractometer (PANalytical X’ Pert Pro) with Cu-Ka radiation. FTIR measurements were also carried out in the absorbance mode ranging from 400 to 4000 cm− using Universal ATR, Crystal: Platinum, Diamond, Bounces: 1, Solvent: ethanol. The particle sizes of the different samples were measured by using MALVERN Zeta sizer Nano ZS90 at 25 °C. UV–visible spectrum of synthesized AgNPs was analyzed by using himadzu UV–visible spectrophotometer (UV-1800, Japan) ranging from 300 to 1100 nm.
2.3 Adsorption experiments
2.3.1 Batch adsorption experiments
Batch adsorption tests were carried out by mechanical agitation at room temperature. For each run, 20.0 mL of Indigo Carmine dye of known initial concentration was treated with a known weight of adsorbents (ACZ and ACZ/AgNP). After agitation, the solution was filtered and the filtrate was subsequently analyzed for dye concentration by UV/V spectrophotometer, model ANLAGE 260. Similar measurements were also carried out at various adsorbents doses, pH and initial concentrations of IC dye. The percentage removal (%R) of IC dye and the amount (Qe) adsorbed per unit mass of adsorbent were calculated by using the following expressions
2.3.2 Adsorption isotherms studies
Adsorption is usually described through isotherms, which is, the amount of adsorbate on the adsorbent as a function of its pressure (if gas) or concentration (if liquid) at constant temperature. The Data obtained from these studies were fitted using four different non-linear isotherms models, namely, the Langmuir, Freundlich, Dubinin-Kaganer-Raduskevich (D-K-R) and Temkin models as shown in Table 1 below (see Table 2).
Isotherms models
Non-linear forms
Langmuir
Freundl)ich
D-K-R
Temkin
Kinetics models
Non-linear forms
Pseudo-first order
Pseudo-second order
Intraparticle diffusion
Elovich
2.4 Adsorption kinetics
The adsorption onto or into adsorbent surfaces with respect to time is known as adsorption kinetics. Adsorption is a time- dependent process, and to determine the rate of adsorption is highly important in the design and evaluation of adsorbent in removing pollutants from wastewater. Therefore, Adsorption kinetic models are the area of analytical chemistry related to the rate and speed at which the chemical reaction occurs. In surface and interface chemistry, kinetics models are used to evaluate the adsorption mechanism of adsorbate on the surface of adsorbent. The four kinetics models are consigned in Table 3.
2.5 Evaluation of antibacterial properties
The in vitro antibacterial activity of the extracts was evaluated on three bacterial isolates including Shigella flexneri and Escherichia coli, obtained from the Pasteur center of Cameroon (CPC) and Salmonella typhi from the ‘Centre Hospitalier Universitaire’ (CHU) of Yaoundé-Cameroon.
The minimum inhibitory concentration (MIC) of the doped activated carbons and nanoparticles from R. Heudelotti Shells were determined by the broth micro-dilution method, using a ρ-iodonitrotetrazolium chloride (INT) based assay as previously reported by Lunga et al. (2014) with slight modifications. Briefly, 196 µL of Muller Hinton broth (MHB) were introduced into the wells of the first line followed by 4 µL of each sample (initially prepared at 100 mg/ml in 100% DMSO). Serial two-fold dilutions were performed and 100 µL of the bacterial suspension (1.5 × 10⁶ CFU/mL) added. The final concentration ranged from 500 to 1.953 µg/mL for the samples and from 5 to 0.0195 µg/mL for the positive control (Ciprofloxacin). The plates were incubated at 37 °C for 24 h after which 50 µL of 0.2 mg/mL INT solution was added and further incubated at 37 °C for 30 min. MICs were determined as the lowest sample concentration with no visible colour change. Wells containing MHB and bacteria constituted the negative control while the sterility control contained MHB alone. The final concentration of DMSO was at most 1% and preliminary test did not inhibit bacterial growth
3 Results and discussion
3.1 Characterisation of ACZ and ACZ/AgNP adsorbents
3.1.1 Fourier transform infra-red spectroscopy
Fig. 1 above shows the FTIR spectral of RHS sample. The peak at 3300 cm−1 corresponding to OH (alcohol, phenol), the adsorption band at 2990 cm−1 can be attributed to CH2 (Asymmetric stretching) and CH3 (symmetric stretching) (Abega et al., 2019), the peaks at 1500–1650 cm−1 might correspond to C⚌C (monosubstituted alkene) or C⚌O (Ketone or Aldehyde). The band ranging from 1000 to 1500 also could be CH2 and CH3 (deformation) or ⚌CH2 (plane and out of plane deformation) while that of 500–950 is attributed to CO32– of CaCO3.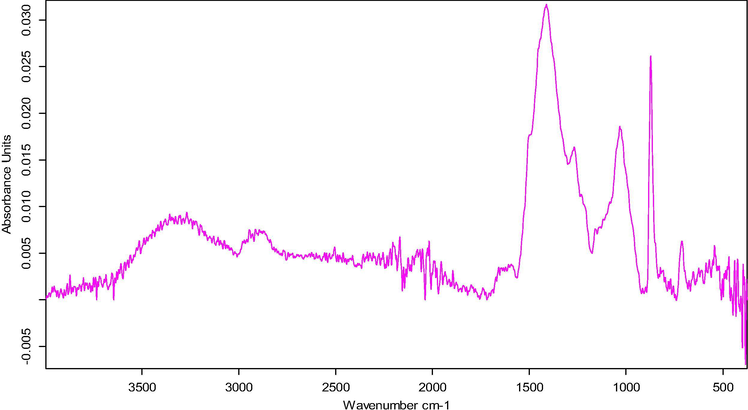
Fourier Transform Infra-Red Spectroscopy (FTIR) of RHS.
3.1.2 Scanning electron microscope-energy dispersive X-ray crystallography (SEM/EDX)
The surface morphologies of ACZ and their composite samples produced were determined using (SEM) coupled with EDX to analyse the surface morphology and the elemental composition of the adsorbents. The analysis of the microscopic images was obtained with a Phenom Pro X Scanning Electron Microscope operating at 15 kV. The SEM images presented in Fig. 2 were observed at magnifications of 1000X.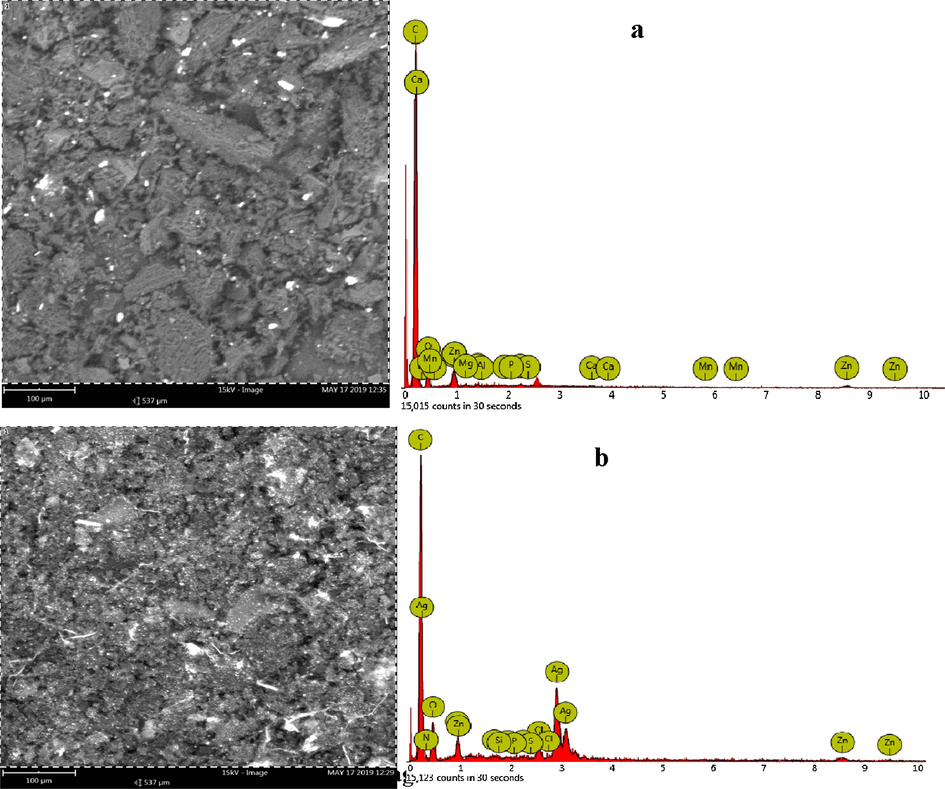
SEM-EDX images of (a) ACZ and (b) ACZ/AgNP.
The surfaces of Sample ACZ shows some rock like structures with the presence of some transport arteries with cracks and crevices with little sight of pore spaces. The ACZ/AgNP Sample shows some transport pores and spongy surfaces with more visible micropores. In the two cases, rock-like structures and more transport pores were observed, serving as pathways for the adsorbates to enter the mesopores and micropores. The adsorbents have rough texture with heterogeneous surface and a variety of randomly distributed pore size. The samples also gives a clearer pore structure, having more volume of pores and better pore structures with little agglomeration, making them more viable for adsorption and thus, the better the pore structure, the better its adsorption capability as compared to the RHS precursor. Hence the use of zinc chloride is tied to enhancement of the surface area and improvement of the pore structure. The pores seen in the Samples are as a result of the evaporation of the activating agents during carbonization and washing after activating, leaving empty spaces.
From the EDX graph, all the samples were rich in carbon, Ag, O, N, Zn and Na while the other elements were found in traces. It was also noticed that the nitrogen concentration was higher in the composite material than in the activated carbons. This was previsible as the nanocomposite was made from AgNO3 solution hence increasing the nitrogen content. Furthermore, the carbon content was found to decreased while the oxygen content increased from the ACZ to the ACZ/AgNP.
3.1.3 Ray diffraction spectroscopy (XRD)
The samples were characterized using X-ray Diffractometer (Philips X‘pert X-ray Diffractometer) employing 1.5046 Å copper source. The samples were scanned from 2θ = 10–90°. The value of the interplanar spacing between the atoms, d was calculated using the Bragg equation; nλ = 2dsinθ. Where n = 1 is an integer, λ is the wavelength of the x-rays, d is the spacing of the planes of the atoms and θ is the angle of incidence of x-ray beam. The superposed graph comprising the 3 samples are given in Fig. 3.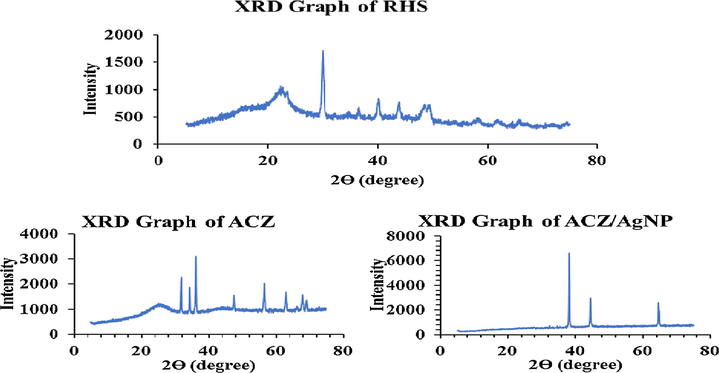
XRD studies of RHS, ACZ and ACZ/AgNP.
Franklin, on the basis of XRD studies, classified activated carbons into two types, based on their graphitizing ability (Ramakrishna Gottipati, 2012). The non-graphitizing carbons are hard and show a well-developed microporous structure due to the formation of strong cross-linking between the neighbouring randomly oriented elementary crystallites. Whereas, graphitizing carbons has weak cross-linking and had a less developed porous structure (Ramakrishna Gottipati, 2012). The figure above shows the X-ray diffraction profiles of the ACs prepared at optimum conditions. The RHS sample was found to contain a s strong diffraction peak at 29.9654 °C a series of weak diffraction peaks at 23.4856°, 36.5817°, 40.1731°, 43.9368°, 48.4898°, 49.4886°, 58.6167° and 65.7421° respectively was observed in Fig. 3. These values correspond to reference code number 96-900-0575 (dhkl = 5.40) and is attributed to the calcite. ACZ sample shows a mixture of strong and weak peaks at 2θ values between 0 and 80 degrees of respectively 31.8378°,34.4838°, 36.3256°, 47.6036°, 56.6403°, 62.9018°, 66.4151°, 67.9504° and 69.0721°. This values correspond to reference code number 96-900-4179 (dhkl = 200) and is attributed to the zincite. Zincite is a rare minerale with high medicinal values. The XRD patterns of sample ACZ/AgNP possesses 4 crystelline peaks at 2ϴ positions of 64.7265°; and 32.3547°, 34.5980°, 38.2457°, 44.4240° and 64.5517° respectively. These peaks are attributed to reference number dhkl 4.00 corresponding to Ag. This shows that the dopping process of AgNP on the two ACs was very effective. Generally, broad peaks found at around 24° for all the samples confirm that the samples are non-graphitized and can have high microporous structure which was confirmed by the gas adsorption isotherms
3.1.4 UV–Vis analysis of Ag NPs
The Ricinodendron Heudelotti shell extract was slowly introduced in the AgNO3 solution, initially it was observed that the orange-clear solution of the extract was rapidly changed into dark brown colouration indicating the formation of AgNPs. Based on the visual observation, it was confirmed that the colour change was due to the reduction of Ag+ to Ag0 (Al-Ansari et al., 2019a,b). Furthermore, the optical UV–Vis analysis of Ricinodendron Heudelotti shell extract, AgNO3 solution and the synthesized AgNPs in aqueous solutions were monitored by recording the absorption spectra at a wavelength range of 300–1050 nm as shown in Fig. 4. The shell extract presents a dom shape peak around 500–950 nm which is attributed to CO32– ions while the AgNO3 solution does not show any absorbance peak in that region. For the AgNPs extract, a strong and sharp peak was observed at 453 nm which explains the surface plasmon resonance (SPR) phenomenon that confirmed the synthesis of AgNPs attributed to spherical nanoparticles of phenol (Al-Ansari et al., 2019a,b) (see Fig. 5).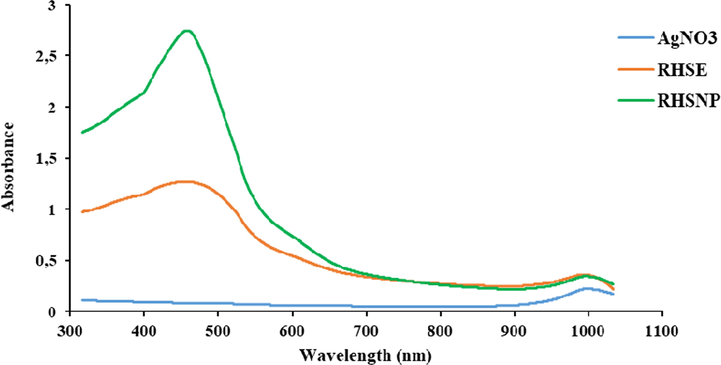
UV–Vis analysis of Ricinodendron Heudelotti shell extract, pure AgNO3 and synthesized Ag NPs.
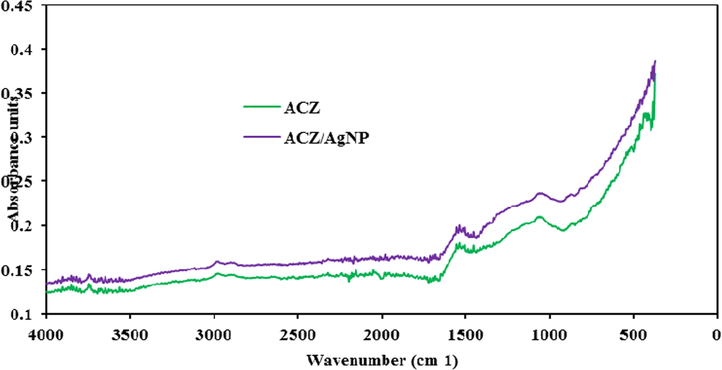
Fourier Transform Infra-Red Spectral (FTIR) of ACZ and ACZ/AgNP.
3.1.5 Fourier transform infra-red spectroscopy for ACZ and ACZ/AgNP
The FTIR spectra were recorded to identify the different functional groups and the potential biomolecules that contributed to the reduction of the Ag+ ions and to the capping of the bioreduced AgNps (Visweswara et al., 2013). The FTIR spectrum was recorded 1 day following the formation of the AgNps. The bands observed around 3556–3931 cm−1 may be attributed to —N—H stretching vibrations of amines and amide (II) band groups. The was no peaks traces of —OH groups in the materials, the peak at 2978 cm−1 may be attributed to C—H stretching vibrations of sp2 hybridized carbons (Abega et al., 2019), those around 1508–1716 cm−1 corresponds to the carbonyl groups in the α-helices present in the nut shell extract and C⚌O stretching vibration in the aldehydes, ketones, esters, lactones and carboxylic groups on the surface of the ACs after activation. The amide band primarily consisted of the carbonyl (C⚌O) stretching of the peptide backbone at 1,684 and 1698 cm−1. It might also corresponds to, C—C vibrations in aromatic rings. The observed peaks at 1418–1488 cm−1 denote —CH— deformation; which are associated with the in plane and out-of-plane aromatic ring deformation vibrations; it can also be attributed to CO32– of calcite which can also be attributed to Ca—O formed when calcite is usually completely decomposed into CaO after the chemical activation. Vibrational frequency at 1066 cm−1 observed in both spectra could be ascribed to the —C—O stretching in acids, alcohols, phenols, ethers and/or esters groups; O—C stretching vibrations; —C—N stretching groups in aromatic rings groups, aromatic rings and —N—O stretching groups respectively. The milled band around 409–546 cm−1, could be assigned to —Zn—O of the zincite formed after activation and carbonisation.
Furthermore, the absence of peaks for Ag in ACZ/AgNP implies that the silver present in the nano-particles cluster precipitated is in the metallic form which could be originated to protein precipitation occurring during the reduction and stabilization of the AgNps (Visweswara et al., 2013). This observation indicated relatively interaction between the extract and AgNPs. It also confirmed by the formation of AgNPs which was materialised by a color change of synthesized AgNPs solution.
3.1.6 Determination of particle size of ACZ and ACZ/AgNP manerials
Carbon samples were crushed and sieved in the size less than 75 µm and 0.04–0.05 g of each sample was added into 5 mL of methanol. The sizes of the different Samples were measured by using MALVERN Zetasizer Nano ZS90 at 25 °C. The results are given in Fig. 6 below.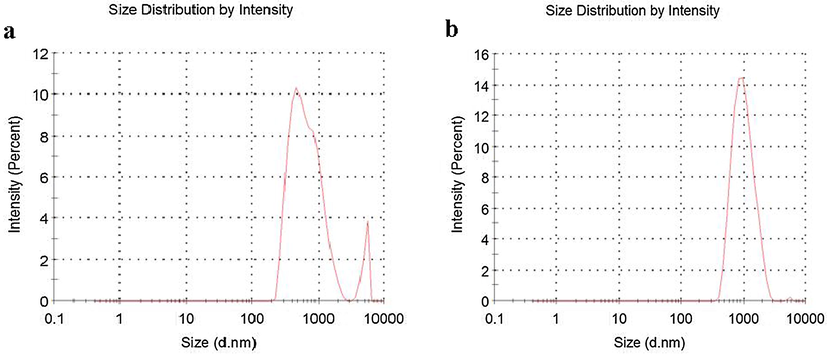
Particle size of (a) ACZ and (b) ACZ/AgNP materials biosynthesized.
The size distribution of the ACZ and ACZ/AgNP above were determined by Differential Light Scattering (Fig. 6a and 6b). Particle size distribution curve reveals that the ACZ and ACZ/AgNP obtained are polydispersed in nature, with average diameter ∼81.46 nm and 100.8 nm respectively. Furthermore, the second virial coefficient for ACZ and ACZ/AgNP are respectively 0.408 and 0.169. This implies that the particles ‘like’ the solvent more than itself, and will tend to stay as a stable solution in a disperse manner. These particles therefore have stability, good colloidal nature and high dispersity of AgNPs due to negative-energative repulsion (Kumari et al., 2015) hence can interact with adsorbate molecules and this favors adsorption.
3.2 Adsorption test of IC dye on the prepared samples
3.2.1 Variation of pH on the solution
pH measurement is an important parameter considered in the study of adsorption because it affects both the surface functional groups of the adsorbent and the adsorbate to be adsorbed. The adsorption of IC dye in aqueous solution of initial concentration 100 mg/L was achieved by the using a mass of 0.01 g each for the adsorbents that is, ACZ and ACZ/AgNP. The pH was varied between 2 and 11 by either using NaOH or HCl both of concentrations 0.1 N. Figure è shows the variation of IC quantity adsorbed at different pH.
From Fig. 7 shows that the maximum adsorption of IC dye for the two adsorbents was at pH 2 for all the adsorbents. The maximum adsorption at pH 2 might be due to protonation of the surface of the adsorbents by the H+ ions. This implies that at pH 2, the H+ ions will neutralize all the negative charges on the surface of the adsorbent leaving the surface positively charged thereby increasing the electrostatic force of attraction between the positively charged adsorbents and the negatively charged anionic dyes. Also, at pH lower than 6.5 and 7.7 (corresponding to pHPZC for ACZ and ACZ/AgNP respectively) the suface of the activated carbons and their respective composite becomes positively charged, and the electrostatic repulsion between the adsorbate and the adsorbents becomes weaker and the IC dye may be easily transported to the surface of the adsorbents and become attached on the surface. It can also be due to the fact that at pH 2, there is protonation of the adsorbate, facilitating intra-particle diffusion and hence favors adsorption of IC. A similar result was obtained by Ankoro et al. (2016). But for pH greater than 2, the number of positively charged surface sites decreases, which did not favor adsorption due to electrostatic repulsion with negatively charged IC dye. Also, at pH greater than the pHPZC for the respective adsorbents, the excess OH– ions which is very mobile increases the repulsion barrier on the surface of the negatively charged adsorbents which decreases the adsorption capacities of IC. It can also be noticed that at pH greater than 7, the quantity of IC adsorbed on the ACZ/AgNP greately increased. This increase results to a slight change of colour of the solution. The belived mechanisms is that, at pH greater than 7, there is the possibility of a redox reaction taking place which therefore facilitates the change in the form of the molecules and consequently its colour. The pH for further adsorption test was therefore taking as pH 2 (see Figs. 8 and 9).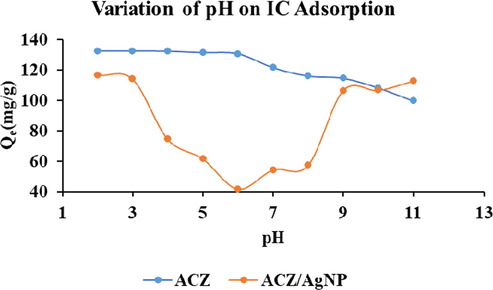
Variation of pH on IC adsorption on ACZ and ACZ/AgNP.
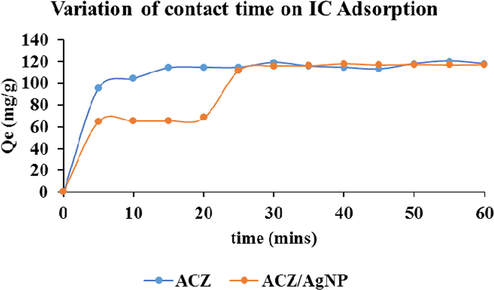
Variation of contact time on IC adsorption on ACZ and ACZ/AgNP.
Variation of adsorbent dose on adsorption of IC dye.
3.2.2 Variation of contact time of adsorbate and adsorbents
With pH 2 and adsorbent mass of 0.01 g under agitation, the agitation time was varied between 5 and 60 min. The solutions were removed under their different agitation time and filtered. The filtrates were analyzed using UV-spectrometer. Fig. 7 below displayed the result obtained.
The results for the two adsorbents indicate that, adsorption rate was rapid within the first five minute for all the adsorbents. It then slows down and come to equilibrium at 20 min for ACZ adsorbents. In the case of ACZ/AgNP, it slows down up to 20 min and increased again from the 20th to the 25th minutes and finally slows down to attain equilibrium and 30 min beyond which there was no significant increase in the removal rate in the case of IC adsorption The speed is first rapid due to the availability of active sites for surface adsorption. It slows down due to saturation of adsorption site. The second increase may be due to Pore (intra-particle) diffusion from the bulk fluid onto the inner surface of the porous adsorbents through the film due to continuous agitation. Similar results were obtained by Sumalatha et al. (2014). It later comes to equilibrium due to saturation of adsorption sites. It is though that the stages of sorption of IC on activated carbon might be controlled by the diffusion process from bulk to the surface or the heterogeneous nature of the adsorbent.
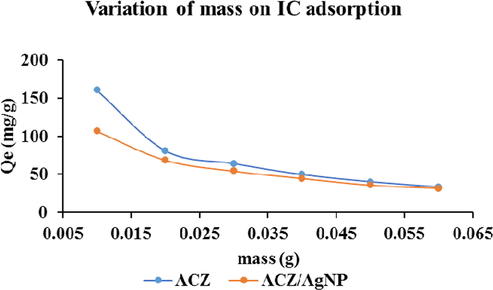
3.2.3 Variation of adsorbent dose
The study of the effect of adsorbent dosage for the removal of IC dye was done by varying the mass of the adsorbents, that is, the ACZ and ACZ/AgNP respectively from 0.01 to 0.06 g and after the respective consequent adsorption, the solution as usual was filtered and the filtrate analyzed for the respective IC residual concentrations. The graphs below demonstrate the quantity adsorbed versus the varied mass.
From the figure above, it shows that increasing the mass of the adsorbents, the quantity of IC adsorbed per gram showed a remarkable decrease for the two adsorbents. The decrease in adsorption capacity is basically due to masking of adsorption sites, that is, the available surface area for IC adsorption respectively decreases due to aggregation of active sites for surface adsorption. Similar result was obtained by other researches precisely (Ndi et al., 2013).
3.2.4 Variation of initial concentration of IC adsorption
The concentration of IC dye was respectively varied between 50 and 100 ppm for an adsorption pH of 2, adsorbent dose of 0.01 g and at their individual respective contact time obtained during the variation of contact time between the adsorbates and the carbonaceous materials. The analytical result obtained was plotted as shown below:
It is observed that increasing, the initial IC dye concentration increases the quantity adsorbed increase as a function of the initial dye concentration for the two adsorbents. This quantity increases from 81.446 to 133.407 and 39.638 to 89.181 mg/g for the ACZ and ACZ/AgNP respectively. This increase is attributed to the fact that as the concentration of the adsorbates (IC) increases, the distance between the dye molecules themselves and the adsorbents decreases. The number of effective collisions between the dye molecules and between the dye molecules and the adsorbents increases as a result of increase in the mobility of the molecules due to high collision between the molecules themselves. These increase in effective collision helps to rupture the resistance force between the adsorbates and the adsorbents. Hence favouring adsorption which therefore leads to increase in the quantity adsorbed on the respective adsorbents.
3.3 Adsorption isotherm studies
Adsorption isotherm which is the relationship between the adsorbate in the liquid phase and the adsorbate adsorbed on the surface of the adsorbent at equilibrium at constant temperature (Ndi et al., 2014). In order to successfully represent the dynamic adsorptive behaviour of any substances from the fluid to the solid phase, it is important to have a satisfactory description of the equilibrium state between the two phases comprising the adsorption system. Four Isotherms models were used to represent the adsorption behaviour of the IC dye in the fluid phase to the solid phase. In this regard, the analysed date was done under the four non-linear isotherms models of Langmuir, Freundlich, Tempkin and Dubinin-Kaganer-Raduskevich as presented Fig. 10 below.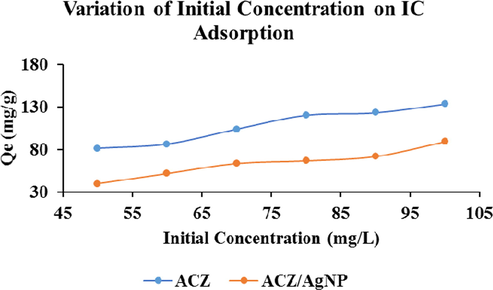
Variation of initial concentration of IC adsorption on ACZ and ACZ/AgNP.
A summary of the different relative isotherm constants and their respective determination coefficients (R2, RMSE and χ2) for the adsorption of IC on ACZ and ACZ/AgNP are grouped in Table 3 below.
Isotherm models
Parameters
Adsorbents
ACZ
ACZ/AgNP
Langmuir
qm (mg g−1)
121.752
411.680
KL (L. g−1)
1.506
0.007
R2
0.999
0.999
RMSE
16.750
10.879
χ2
9.956
7.344
RL
0.007
0.595
Freundlich
KF (L. g−1)
74.673
3.769
1/n
0.177
0.857
R2
0.672
0.669
RMSE
13.480
10.956
χ2
6.766
7.432
D-K-R
qs (mg. g−1)
114.674
101.544
Kad (mol2. J−2) × 10−7
1.447
526.800
E (kJ. mol−1)
1859.119
97.426
R2
0.413
0.719
RMSE
18.038
10.083
χ2
11.454
6.256
Tempkin
AT (L. g−1)
88.647
0.115
BT (J. mol−1)
149.880
43.822
R2
0.640
0.694
RMSE
14.137
10.523
χ2
7.303
6.817
Langmuir adsorption isotherm is best known for its applicability to explain adsorption phenomenon on monolayer coverage hence predicting a chemisorption process with strong forces between the adsorbate and the adsorbents. From Table 3 above, the Langmuir for the two adsorbents on IC dye was the most suitable and best to explain the adsorption phenomenon looking at its R2 values which is closer to unity with values of 0.999, and 0.999 for IC adsorption ACZ and ACZ/AgNP respectively. Also, the maximum quantity adsorbed on the monolayer coverage (qm) theoretically for both adsorbates on the respective adsorbents (except for ACZ/AgNP case) is closer to the experimental quantities. This implies that most of the adsorbate molecules adsorbed at equilibrium is found on the monolayer coverage and this permits to presume a chemisorption phenomenon on the respective adsorbents. The high values of the Langmuir adsorption constant (KL) on both adsorbents on IC dye adsorbate (except for ACZ/AgNP on adsorbate) implies the isotherm model is best applicable to explain the adsorption process taking place. This applicability was futher substantiated by the low values of RMSE and χ2 for both adsorbates. Furthermore, the Langmuir separation constant RL for all the adsorbents on the adsorption of IC dye being found between 0 and 1 (i.e 0 < RL < 1) implies the adsorption of the two adsorbates on the respective adsorbents are favourable.
Freundlich isotherm model best applies to adsorption on heterogeneous surfaces with interaction between the adsorbed molecules. This model which shows no restriction to the formation of a multi-layer was not the best to explain the adsorption of IC on the two adsorbates from their R2 values. Nevertheless, despite its low R2 values in most cases, the high values the Freundlich constant (KF) for the two adsorbents is high and this makes the model applicable to presume the possibilities of the formation of a multi-layer coverage on the surface of the respective adsorbents. This possibility was further strengthened by the low values of RMSE and χ2 for both adsorbents on all the respective IC adsorption. In addition, Freundlich heterogeneity factor 1/n being lower that 1 implies the surface of the respective adsorbents is heterogenous vis-à-vis/with respect to the adsorbates.
The information obtained from the Langmuir and Freundlich isotherms are generally insufficient to explain the physical and chemical characteristic of the adsorption phenomenon. Dubinin–Kaganer-Radushkevich (D-K-R) isotherm is generally applied to express the adsorption mechanism with a Gaussian energy distribution onto a heterogeneous surface (Mehrabi et al., 2015). The model has often successfully fitted high solute activities and the intermediate range of concentrations data well. The approach was usually applied to distinguish the physical and chemical adsorption of adsorbate molecules with its mean free energy, E per molecule of adsorbate (for removing a molecule from its location in the sorption space to the infinity). From Table 3 above the R2 values of all the adsorbents were insufficient to compromised the asdsorption phenomenon but nevertheless, the theoretical quantities adsorbed at equilibrium is approximately the same as the experimental adsorbed quanties for all the adsorbents respectively studied. Also, despite the fact that the small values of the D-K-R adsorption isotherm constant Kad was insufficient to be used to explain the adsorption process. The D-K-R energy constant (E) for all the adsorbents on the adsorption of IC being far greater than 8 kJmol−1, indicates that the adsorption processes of the adsorbents on the adsorbates is dominated by chemisorption with the formation of chemical bonds. This further confirms the strong interactive forces between the adsorbates and the adsorbents presumed by the Langmuir model.
The Tempkin Isotherm model is often used to explain adsorption phenomenon because it contains a factor that is explicitly taking into account the adsorbent–adsorbate interactions by ignoring the extremely low and large value of concentrations, the model assumes that heat of adsorption (function of temperature) of all molecules in the layer would decrease linearly rather than the logarithmic with coverage (Mehrabi et al., 2015). Nevertheless, despite the consequent low values of R2 in some cases the high value of the Tempkin isotherm equilibrium binding energy constant AT in all the adsorption process on IC on all two respective adsorbents implies the bond energies of the adsorbents and the respective adsorbates is very high hence strong bond are formed between the adsorbates and the respective adsorbents. In addition, the high adsorption energies of the adsorption process of IC adsorption on all the adsorbents further confirms the chemisorption process.
3.4 Adsorption kinetics of IC
The adsorption kinetic study describes the speed at which the solute phase is retained on the surface of the adsorbents, the time necessary for the process to attained equilibrium and also predicts the limiting step of the adsorption process. It also permits one to determine the effectiveness of the adsorption process. The non-linear kinetic models of pseudo-first order, pseudo-second order, intra-particle diffusion and Elovich were studied in this our work with the aim of determining the type mechanism or type of adsorption put in place between the adsorbate and the adsorbent as well as the rate limiting step of the adsorption of IC on ACZ ACZ/AgNP. In this regard, the graphs relative to the respective non-linear models is given by Fig. 11 below and table 2 below gives an over view summary of the kinetic parameters and their respective determination coefficients (R2, RMSE and χ2) for the adsorption process (see Fig. 12).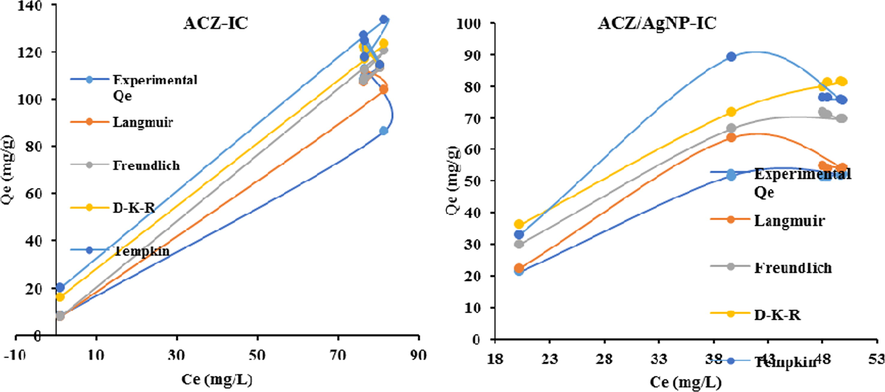
Non-linear adjustement of langmuir, Freundlich, D-K-R and tempkin isotherm models on IC adsorption on ACZ and ACZ/AgNP.
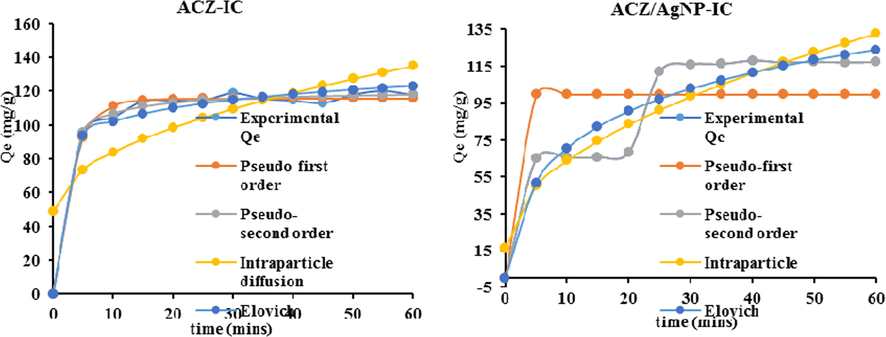
Non-linear adjustment of pseudo-first order, pseudo-second order, intraparticle diffusion and elovich kinetic models on IC adsorption on ACZ and ACZ/AgNP.
A summary of the different relative adsorption kinetic constants and their respective determination coefficients (R2, RMSE and χ2) for the adsorption of IC on ACZ and ACZ/AgNP are grouped in Table 4 below (see Table 5). ACZ: Zinc chloride activated carbon, ACZ-Ag/NP: Zinc chloride activated carbon doped with silver nanoparticles, RHSE: Ricinodendron heudelotti shell extracts, RHSNP: Ricinodendron heudelotti shell nanoparticles.
Kinetic models
Parameters
Adsorbents
ACZ
ACZ/AgNP
Pseudo-first order
qe (mg g−1)
115.755
99.455
k1 (mins−1)
0.323
0.262
R2
0.992
0.262
RMSE
3.087
24.758
χ2
0.940
67.794
Pseudo-second order
qe (mg g−1)
120.613
125.000
K2 (mg g−1mins−1)
0.006
34.000
R2
0.995
1.000
RMSE
2.268
0.000
χ2
0.494
0.000
Intra-particle diffusion
kid
11.123
8.424
Ci (mg. g−1)
48.703
81.279
R2
0.900
0.496
RMSE
20.994
35.620
χ2
26.198
68.047
Elovich
α (mg g−1 mins−1)
2.643 × 10²¹
5.225 × 10¹¹
β (g. mins−1)
0.386
0.154
R2
0.870
0.994
RMSE
13.989
4.262
χ2
16.363
1.077
Test sample
Bacterials
Salmonella typhi
Escherichia coli
Shigella flexneri
ACZ
–
–
–
ACZ/AgNP (1 mM)
125
15.625
125
ACZ/AgNP (5 mM)
31.25
7.812
31.25
RHSE
–
–
–
RHSNP
125
62.5
250
Ciprofloxacin
0.156
0.625
0.078
From the Table above, the pseudo-first order kinetic model was most appropriate to explain the adsorption of IC on ACZ judging from its high R2 values which is closer to unity and their experimental adsorbed quantity which is closed to the theoretical quantity adsorbed at equilibrium. Also its low values of RMSE and χ2 for ACZ adsorbent makes the model suitable to explain the adsorption process. The pseudo-second order kinetic model was most appropriate to explain the adsorption of IC on both ACZ and ACZ/AgNP from their R2 value which is closer to unity and their experimental adsorbed quantity which is closed to the theoretical quantity adsorbed at equilibrium. The reliability of this model to explain the adsorption mechanisms was further confirm by their respective low values of RMSE and χ2 which are 2.269 and 0.000 and 0.494 and 0.000 (for RMSE and χ2 respectively) for ACZ and ACZ/AgNP respectively. This model strongly described interaction between the surface of these adsorbents and the adsorbate, which indicates that the adsorption is, might be with chemisorption with the formation of strong bonds between the adsorbents and the adsorbates.
With respect to R2 values, the Intra-particle diffusion model is most suitable to explain the adsorption of IC on ACZ with R2 value of 0.900 However, the large values of the diffusion constant value Kid for all the adsorbents implies that diffusion rate of IC is important in the adsorption process; but that’s not withstanding, the high values of the constant Ci (which is the repulsion barrierbetween the adsorbate and the adsorbent) for all the adsorption processes is an indication that the intra-particle diffusion step is not the rate limiting step in the adsorption mechanism. This therefore favours strong interaction between adsorbents and adsorbate molecules. This is further confirmed by the higher values of RMSE and χ2 for all the adsorption processes.
In the case of the Elovich model, all the R2 values were significant but the best fitted in terms of R2 value was for ACZ/AgNP composite materials with values of 0.994 respectively for IC adsorption. Also, the RMSE and χ2 values which are respectively 4.262 and 1.077 ACZ/AgNP for IC adsorption throws further significance of this model to explain the adsorption of IC on the above adsorbents. Nevertheless, The Elovich adsorption speed constant (α) for all four adsorbents is far greater than the desorption coefficient β for both the IC adsorption processes which strongly declares without any doubt or fear of uncertainty that the adsorption process of IC on is the above respective adsorbents is chemisorption.
3.5 Antibacterial test of ACZ and ACZ/AgNP samples on shigella flexneri, Salmonella typhi and Escherichia coli bacteria
The MIC values range from 7.812 µg/ml to 250 µg/ml. The activated carbons doped with silver nanoparticles are generally more active than the simple nanoparticles alone (RHS-NP). Equally, activated carbons with silver nanoparticles at a 0.5 M AgNO3 (ACZ-Ag-NP) are more active than those doped at 1 mM AgNO3 (ACZ-A). ACZ-Ag-N generally was the most active (with MIC ranging from 7.782 to 62.5) and the RHS-NP was the least active ranging from (62.5–500 µg/ml). The results equally showed that E. coli and S. typhi were the most susceptible while S. flexneri was the most resistant. The un-doped activated carbon showed no activity against any of the strains at the tested concentrations.
4 Discussion
The MIC value of the samples varied from 7.782 to 250 μg/mL. The results show that doping generally increase the antibacterial properties of the extracts and the activated carbon, while the introduction of nanoparticles further increases this activity especially at the lower concentration of 5 mM AgNO3. According to Tamokou et al. (2017), the antimicrobial activity of a plant extract is considered to be highly active if the MIC < 100 μg/mL; significantly active when 100 ≤ MIC ≤ 512 μg/mL; moderately active when 512 < MIC ≤ 2048 μg/mL; weakly active if MIC > 2048 μg/mL and not active when MIC > 10 000 μg/mL. However, to the best of our knowledge, no such classification exists for doped carbons and nanoparticles. Interestingly, these samples exhibited significant activities against the typhoid-causing Salmonella typhi, as well as the diarrheal-manifesting Escherichia coli and Shigella flexneri. The RHS extract had no activity while sythesised nanoparticles have activities ranges between 62.5 for Escherichia coli, 125 for Salmonella typhi and 250 for Shigella flexneri. Similar results were showed by Kumari et al. (2015).
Despite the fact that there are no limits for activities of solid carbon materials, it is particularly interesting to note that these nanoparticles are from products considered as waste (Ricinodendron heudelotii shells) and demonstrated herein to hold great perspectives in the development of complementary and/or alternative medicines to the use of synthetic antibiotic.
The antibacterial activity of doped activated carbon from Ricinodendron heudelotii shells is therefore presented herein for the first time. The significant activities recorded offers great perspective in the development of nanoparticle-base medication against the typhoid-causing Salmonella typhi, as well as the diarrheal-manifesting Escherichia coli and S. flexneri.
5 Conclusion
Novel approach for biosynthesis of AgNPs from aqueous Ricinodendron heudelotii shell extract was investigated and given in this present work. The synthesized AgNPs were spread on the surface of the ACZ by simple precipitation method to form a composite material. XRD parttern shows pics of zincite and Ag in ACZ and ACZ/AgNP respectively. The UV–Visible analysis show the appearance of a peak at 453 nm during nanoparticle preparation, while the FTIR result shows no significant change from ACZ to ACZ/AgNP on doping, confirming the production of a nano-composite material. The adsorption capacity of the ACZ/AgNP was slightly lower compared to that of the ACZ which could be as a result of the precipitated AgNPs occupying the active sites available for IC adsorption. The synthesized RHSNPs and ACZ/AgNP have shown interesting antibacterial activities with typhoid-causing Salmonella typhi, as well as the diarrheal-manifesting Escherichia coli and S. flexneri a wide range of pathogenic bacterias which established their application in biomedicines. Thus, it can be concluded that the prepared ACZ/AgNP and AgNPs synthesized using Ricinodendron heudelotii shell extract is a cost effective, simple and eco-friendly method that excludes the hazards arising out of the use of harmful reducing/capping agents. Therefore, the introduction of silver nanoparticles onto the activated carbon could be used in water filters and will attribute excellent antimicrobial property to the filters. This does not only prevent rapid blockage of filters, but also limits the possibilities of the spread of water borne diseases. Moreover, this process could be easily scaled up for the industrial applications to increase the yield of the nanoparticles significantly as the Ricinodendron heudelotii shells are considered as potential waste, which undoubtedly would establish its commercial viability in medicine.
Acknowledgement
The authors of this work sincerely wish to thank the Research Unit ‘Adsorption and Surface’ of the Applied Physical and Analytical Chemistry Laboratory of the University of Yaoundé I. They are also grateful to the scholars whose articles are cited and included in references of this manuscript and are grateful to the authors, editors, and publishers of all the articles, journals and books from where the literature for this work has been reviewed and discussed.
References
- Easy and convenient synthesis of CNT/TiO2nanohybrid by in-surface oxidation of Ti3+ ions and application in the photocatalytic degradation of organic contaminants in water. Synth. Met.. 2019;251:1-14.
- [Google Scholar]
- Facile and cost-effective Ag nanoparticles fabricated by lilium lancifolium leaf extract: antibacterial and antibiofilm potential. J. Cluster Sci.. 2019;30:1081-1089.
- [CrossRef] [Google Scholar]
- Parameters optimization for nitrate removal from water using activated carbon and composite of activated carbon and Fe2O3 nanoparticles. J. Cluster Sci.. 2019;30:1081-1089.
- [CrossRef] [Google Scholar]
- Removal of Indigo Carmine Dye (IC) by batch adsorption method onto dried cola nut shells and its active carbon from aqueous medium. Int. J. Eng. Sci. & Res. Technol.. 2016;5(3):874-887.
- [Google Scholar]
- Herbal extract decolourization device using activated carbon. Jurnal Teknologi (Sciences & Engineering). 2013;61(1):73-79.
- [Google Scholar]
- Preparation of activated carbon from green coconut shell and its characterization. J. Chem. Eng. Process Technol.. 2015;6(5):2157-7048.
- [CrossRef] [Google Scholar]
- David, G.E.M., 2017. Global burden of bacterial infections: The role of vaccines in reducing AMR. Lecture notes of the Faculty of Medicine of the Imperial College, London UK, 552, pp. 163–167.
- Recent developments in heterogeneous photocatalytic water treatment using visible lightresponsive photocatalysts: a review. Royal Soc. Chem.. 2015;5:14610-14630.
- [CrossRef] [Google Scholar]
- Preparation of nano-activated carbon from carbon based material for copper decontamination from wastewater. Am. J. Appl. Chem.. 2015;3(3–1):31-37.
- [Google Scholar]
- Preparation and characterization of surface functionalized activated carbons from date palm leaflets and application for methylene blue removal. J. Environ. Chem. Eng.. 2016;4(3):2713-2724.
- [CrossRef] [Google Scholar]
- Ernst, M., 2000. “Abtrennung organischer Verbindungen aus kommunalen Kläranlagenabläufen mittels Nano- und Ultrafiltrationsmembranen mit dem Ziel der künstlichen Grundwasseranreicherung (Separation of organic compounds from municipal wastewater treatment plant effluents by means of ultra- and nanofiltration membranes for artificial groundwater recharge)”. VDI series 15, Environmental Engineering 221, VDIVerlag, Dusseldorf.
- Chemical preparation of crab shell-based activated carbon with superior adsorption performance for dye removal from wastewater. J. Taiwan Inst. Chem. Eng.. 2016;000:1-9.
- [CrossRef] [Google Scholar]
- Thermodynamic and kinetics studies on adsorption of indigo carmine from aqueous solution by activated carbon. Microchem. J.. 2019;144:180-189.
- [CrossRef] [Google Scholar]
- Silver nanoparticle loaded activated carbon: An escalated nanocomposite with antimicrobial property. Orientation J. Chem.. 2016;32(1)
- [Google Scholar]
- Characterization of silver nanoparticles synthesized usingUrtica dioicaLinn. leaves and their synergistic effects with antibiotics. J. Radiat. Res. Appl. Sci.. 2015;1–11
- [CrossRef] [Google Scholar]
- Optimization conditions of the preparation of activated carbon based Egusi (Cucumeropsis mannii Naudin) seed shells for nitrate ions removal from wastewaterl. Am. J. Anal. Chem.. 2019;9:439-463.
- [CrossRef] [Google Scholar]
- Antityphoid and radical scavenging properties of the methanol extracts and compounds from the aerial part of Paullinia pinnata. SpringerPlus. 2014;3:302.
- [Google Scholar]
- Amine functionalized multi-walled carbon nanotubes: Single and binarysystems for high capacity dye removal. Chem. Eng. J.. 2017;313:826-835.
- [CrossRef] [Google Scholar]
- Parameters optimization for nitrate removal from water using activated carbon and composite of activated carbon and Fe2O3 nanoparticles. Royal Soc. Chem.. 2015;5(64):51470-51482.
- [CrossRef] [Google Scholar]
- The adsorption efficiency of chemically prepared activated carbon from cola nut shells by ZnCl2 on methylene blue. J. Chem.. 2013;201:1-7.
- [Google Scholar]
- Physical and chemical characteristics of activated carbon prepared by pyrolysis of chemically treated Cola nut (cola acuminata) Shells wastes and its ability to adsorb organics. Int. J. Adv. Chem. Technol.. 2014;3:1-12.
- [Google Scholar]
- Ramakrishna Gottipati, 2012. Preparation and Characterization of Microporous Activated Carbon from Biomass and its Application in the Removal of Chromium(VI) from Aqueous Phase. PhD Thesis of the Department of Chemical Engineering National Institute of Technology, Rourkela Odisha, India.
- Removal of indigo carmine from aqueous solution by using activated carbon. Res. J. Pharm., Biol. Chem. Sci.. 2014;5:912.
- [Google Scholar]
- Antimicrobial activities of African medicinal spices and vegetables. In: Medicinal Spices and Vegetables from Africa: Therapeutic Potential Against Metabolic Inflammatory Infectious and Systemic Diseases (first ed.). Elsevier; 2017. p. :207-237.
- [Google Scholar]
- H.G. Biogenic silver nanoparticles using Rhinacanthus nasutusleaf extract: synthesis, spectral analysis, and antimicrobial studies. Int. J. Nanomed.. 2013;8(3):3355-3364.
- [Google Scholar]
- Advances in photocatalytic disinfection of bacteria: Development of photocatalysts and mechanisms. J. Environ. Sci.. 2015;34:232-247.
- [CrossRef] [Google Scholar]
- Characterization of activated carbon prepared by phosphoric acid activation of olive stones. Arabian J. Chem.. 2016;9:S1155-S1162.
- [CrossRef] [Google Scholar]


