

Translate this page into:
Effect of homogeneous acidic catalyst on mechanical strength of trishydrazone hydrogels: Characterization and optimization studies
⁎Corresponding author at: Pejabat Dekan (Blok C17), Fakulti Sains, 81310 UTM Johor Bahru, Johor, Malaysia. Tel.: +60 7 5534022 (office), +60 13 7466213 (mobile); fax: +60 7 5566162. wazelee@kimia.fs.utm.my (Wan Azelee Wan Abu Bakar),
-
Received: ,
Accepted: ,
This article was originally published by Elsevier and was migrated to Scientific Scholar after the change of Publisher.
Abstract
Characterization utilizing X-ray photoelectron spectroscopy (XPS) revealed the presence of all the expected elements found in trishydrazone hydrogels (3). Morphological study on confocal laser scanning microscopy (CLSM) and atomic force microscopy (AFM) revealed the branching and bundling of fibers that led hydrogels network as well as the presence of cross-linked nanofibrillar network structure. A three-factor three-level Box Behnken design was implemented to study the concurrent effects of three main variables (concentration of precursor; 10–20 mM, pH; 3–7, and concentration of buffer; 50–150 mM) on mechanical strength of hydrogels. Analysis of variance (ANOVA) was conducted to investigate the potential interactive and quadratic effects between these variables and revealed that interaction between the pH value and the concentration of buffer (X2X3) showed a significant effect on the response since the significance of the design model (p-value) was set at <0.05. Experimental results showed that acid catalyst at pH 5 had a significant effect on mechanical properties of hydrogels compared to uncatalyzed condition at pH 7 where the mechanical strength at pH 5 is almost 10 times higher than pH 7. The processing conditions that contributed to an optimum hydrogels setting were found at concentration of precursor = 20 mM, pH = 5 and concentration of buffer = 100 mM.
Keywords
Low molecular weight gelators
Self-assembled system
Catalyst
Mechanical strength
Mathematical modeling

1 Introduction
Trishydrazone hydrogels that are built from low-molecular-weight gelators (LMWGs) are currently considered as replacement for polymeric gelator systems because of their unique properties that cannot be attained by polymeric gelators. Trishydrazone hydrogels response promptly to external stimuli, and possess low critical gelation concentrations (cgc) (Tiller, 2003). The properties of hydrogels which can be controlled via external stimuli may open the possibility to design the new gelator systems for various applications (Wang et al., 2008). Trishydrazone hydrogels can also be quickly flushed out from the body once they turn from gel to sol transition, thus making them as a useful candidate for biopharmaceutical applications such as for drug delivery (van Bommel et al., 2004). Interestingly, hydrogels based on biomaterials can be used as drug carrier to enter the body in several ways such as oral, rectal, epidermal, ocular and subcutaneous application (Costa et al., 2012). It is known that the hydrazone bonds are hydrolytically labile bonds because of easy incorporation of hydrazides into delivery materials and the rate of drug release control can be achieved by loading the drug to the hydrazone bonds (Jesus et al., 2002). Matson and Stupp (2011) developed a hydrazide-containing peptide amphiphile nanofiber gels which could be attached to the nabumetone drug (ND) via hydrazone formation and could be possibly used to slowly release the ND from the gels into aqueous solution.
Response surface methodology (RSM) can be implemented as an effective tool to determine the influence of several independent variables on responses and at the same time could optimize the best conditions of process variables (Anderson and Whitcomb, 2005). In general, Response Surface Methodology (RSM) is a collection of statistical and mathematical technique to determine the optimum parameter for the experimental design (Montgomery, 2005). This technique is useful and could help to suggest the optimum condition for preliminary experimental work where this method would recommend the best experimental condition based on the design model. Thus, RSM could evaluate the effect and relationship among the variables in the reaction process, determine the most influential parameter in the experimental process and save the cost and time as it could reduce the number of experimental works.
RSM has been widely used to optimize the mechanical strength of materials such as polymer based hydrogels (Zheng et al., 2011; Kim et al., 2003). Liu et al. (2013) have optimized the improved gel properties of low-quality surimi by adding konjac glucomannan (KGM). Another applications of RSM for gels optimization were optimization of simultaneous effects of compositional variables (sago starch and sugar) and shearing speed of mixer on textural and rheological properties of gels (Teng et al., 2011), in drug delivery system study (Chaudhary et al., 2010; Chopra et al., 2007), and food and beverages industries (Bono et al., 2012; Akesowan, 2014).
To the best of our knowledge, there is no study reporting on the optimization of mechanical strength of trishydrazone hydrogels using response surface method. In this study, a full factorial experimental design for the optimization of mechanical strength of trishydrazone hydrogels (3) was investigated by rheometer. Herein, we also reported the individual and mutual parameters (concentration of precursor (1), pH and concentration of buffer) for the mechanical strength of trishydrazone hydrogels (3). A Box–Behnken design was chosen to determine the optimum mechanical strength hydrogels, and also to further elucidate the relationships between hydrogels strength and those three parameters.
2 Materials and methods
2.1 Materials
All reagents were purchased from commercial sources and were used as provided unless stated otherwise. Precursor compounds namely cyclohexane-1,3,5-tricarbohydrazide (1) and 3,4-bis(2-(2-methoxyethoxy)ethoxy)-benzaldehyde (2) were synthesized based on previously described procedures (Poolman et al., 2014). Sodium phosphate dibasic (98.5%) and Sodium phosphate dibasic heptahydrate (98.0–102.0%) were purchased from Sigma–Aldrich. All experiments were performed using Milli-Q water.
3 Experimental
3.1 Preparation of trishydrazone hydrogels (3)
Trishydrazone hydrogels (3) formed from mixture of (1) and (2) as depicted in Fig. 1 were prepared according to formulation design shown in Table 1 by dissolving the appropriate amount of stock solutions of (1) and (2) in phosphate buffer at different pH conditions in vial. The mixture then was vigorously mixed to ensure the homogeneity. Trishydrazone hydrogelator (3) has the ability to self-assemble and stack on each other and could gelate the surrounding solvent (i.e. water) to form fibers and subsequently forming gel networks.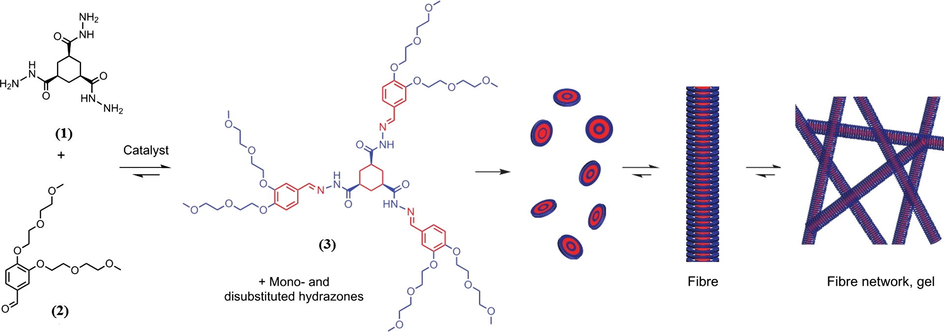
Formation and aggregation of trishydrazone hydrogelators (3) from soluble building blocks of cyclohexane-1,3,5-tricarbohydrazide (1) and 3,4-bis(2-(2-methoxyethoxy)ethoxy)-benzaldehyde (2). Blue and red represent the hydrophilic and hydrophobic parts respectively (Boekhoven et al., 2013).
Independent variables
Range and level
−1
0
+1
Concentration of precursor (1), X1 (mM)
10
20
30
pH, X2
3
5
7
Concentration of buffer, X3 (mM)
50
100
150
3.2 Characterization, morphology and XPS studies of trishydrazone hydrogels (3)
For characterization purpose, trishydrazone hydrogelator (3) was prepared by adding an appropriate amount of concentration of (1) solution in Milli-Q water to an appropriate amount of concentration of (2) solution in Milli-Q water with the final molar ratio is 1:6 (1) to (2). Morphology of trishydrazone hydrogels (3) gel networks was examined by using a confocal laser scanning microscopy (CLSM) Zeiss 700 equipped with a Zeiss Axio Observer inverted microscope, 40x Plan Fluor oil immersion objective lens (NA 1.3) using incident wavelengths of 488 nm. A z-step size of 0.53 μm was used to optically section the samples and the z-stacks were performed with confocal pinhole set to 1.0 airy unit. In order to visualize the gel network under microscope, an aldehyde functionalized fluorescein-derived fluorescent probe (fluorescent probe) was incorporated into the fiber formation process (Boekhoven et al., 2013). Image processing was conducted on Zen 2011 Image Analysis software.
Morphology of trishydrazone hydrogels (3) gel networks was further characterized on AFM with an Ntegra P8 from NT-MDT using NSG01 series cantilever (reson, freq, 150 kHz, force const. 5.5 N/m) mounted with Diamond Like Carbon (DLC) tips which was purchased from NT-MDT, in Delft University of Technology, the Netherlands. The AFM images were obtained at room temperature in air and were processed by Nova Px Image Analyzer 2014.
X-ray photoelectron spectroscopy (XPS) was employed to observe the types of the functional groups that bonded to the atoms of C and N in trishydrazone hydrogels (3) compound. The pre-dried gels were characterized by Kratos Surface Analysis Spectrometer XSAM HS instrument using Mg Kα L(1253.6 eV) as the X-ray source and the spectrum was recorded at 10 mA with 14 kV of energy source. The base pressure in the analysis chamber was approximately 10 × 10−10 mbar or lower during spectral acquisition. Charge compensation was implemented during spectral acquisition using an electron flood gun operated at 5 eV. The binding energy scale was corrected for charging effect based on the binding energy of C 1s peak from the surface contamination obtained from the analyzed sample which was assigned a value of 284.6 eV. At the beginning, survey scans were taken ranging from 0 to 1500 eV of binding energy. Then, the high resolution scans were conducted in the regions of interest involving elements of oxygen 1s, carbon 1s, nitrogen 1s. The peak fitting was done by peak deconvolution using CasaXPS software (Casa Software Ltd.). Curve fitting of the spectra was conducted using a Gaussian–Lorentzian peak shape after carrying out a Shirley background correction.
3.3 Determination of mechanical strength of hydrogels
Measurement of hydrogels strength was conducted in a Physica MCR 300 Rheometer, using a steel plate–plate geometry of 25 mm in diameter and applying dynamic oscillatory measurements. The temperature of the plates was maintained at 25 ± 0.2 °C. Linear viscoelastic region was up to 0.5% strain for all gels; thus, the time sweeps measurements were conducted under 0.05% strain with a frequency of 1 Hz.
3.4 Experimental design
The three-level, three-factorial Box–Behnken experimental design was selected to investigate and validate the process parameters that affected the mechanical strength of gels. 3 factors as independent variables involving namely concentration of precursor (1), pH value, and concentration of buffer were labeled as X1, X2 and X3, respectively. The response was the storage modulus, G′, at the end of time rheological time sweep experiment. The real and coded levels of the independent variables used in the experiment design are shown in Table 1. The experimental design matrix was generated based on 33 factorial design with the help of the Design Expert 7.0 software.
All experiments were conducted at random to minimize the effect of an explained variability in the observed responses due to systematic errors. In a function of X, a second-order polynomial equation (Eq. (1)) was fitted for each factor assessed,
Analysis of ANOVA was performed to test the validity of the design model. The fitness of the design model was tested by F-distribution test (Fisher variation ratio) and p-value (significantly probability value) respectively.
4 Results and discussion
4.1 Characterization of trishydrazone hydrogels (3)
4.1.1 Morphological studies
The self-assembly of trishydrazone hydrogelator (3) leading to gel network formation was visualized by confocal laser scanning microscopy (CLSM). CLSM revealed the presence of supramolecular nanofiber networks microstructure as depicted in Fig. 2(a) and (b). Both figures illustrated the morphology of the network exhibited the branching and bundling of fibers leading to dense and well-connected network. Moreover, the micrographs also showed that the gel networks were evenly distributed.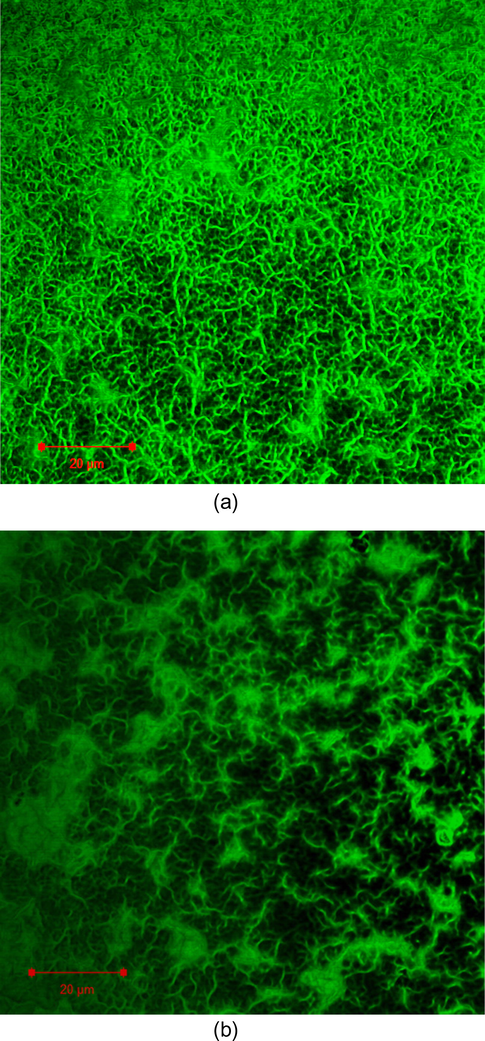
CLSM micrographs in situ hydrogels microstructures in (a) and (b). Green regions are fluorescently stained self-assembled nanofibers. Space bar 20 μm.
Morphology and structural information in three dimensions of nanofibers were further characterized by AFM. In this measurement, spatial dimensions of the fibers and the network structure formed by the nanofibers were visualized with 2D AFM images. Fig. 3(a) and (b) shows the topography and phase contrast images of AFM results for nanofibers morphology at a large surface area of 10.0 × 10.0 μm2 which revealed the presence of cross-linked nanofibrillar network structure. The results for distribution of height and diameter of trishydrazone hydrogels (3) were reported previously (Olive et al., 2014).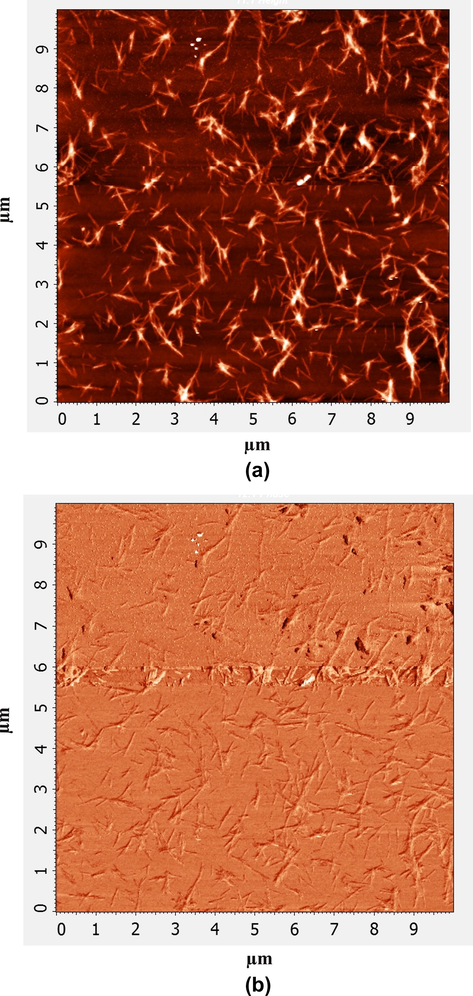
Characterization of the self-assembled fibrous structures of trishydrazone hydrogels (3); (a) 2D AFM topography image and (b) 2D AFM phase contrast image.
4.1.2 XPS study
Condensation reaction of cyclohexane-1,3,5-tricarbohydrazide (1) and 3,4-bis(2-(2-methoxyethoxy)ethoxy)-benzaldehyde (2) to produce trishydrazone hydrogelator (3) in the presence of acid catalyst has been published previously (Boekhoven et al., 2013). Trishydrazone hydrogelator (3) has the ability to self-assemble and stack on each other and could gelate the surrounding solvent (i.e. water) to form fibers and subsequently forming gel networks.
For further characterization of trishydrazone hydrogels (3), chemical analysis was performed by X-ray photoelectron spectroscopy (XPS) to verify the presence of elements in the functional groups on trishydrazone hydrogels (3) surface. XPS survey spectrum in Fig. 4(a) showed the element that exists from scanning of trishydrazone hydrogels (3) in which the atomic percentage of each element was displayed in Table 2. It can be seen from the survey spectra that the expected elements such as C1s, N1s and O1s were present in surface of trishydrazone hydrogels (3) and the XPS atomic percentages were in agreement with the trishydrazone hydrogels (3). The XPS narrow scan of C 1s spectrum as depicted in Fig. 4(b) can be curve fitted into 5 peak components with binding energies at about 284.2, 284.8, 285.1, 285.8, and 286.2, attributable to the C—H, C—C, C⚌C, C—OH, and C⚌N, respectively (Jeon et al., 2013; Giesbers et al., 2013; Xu et al., 2006). However, the peak due to C—N overlapped with C⚌N as the difference in their position is only 0.2 eV (Shard et al., 2004). Detailed analysis of the XPS spectra of the oxygen 1s core region exhibited that the spectra can be curve fitted into 2 components. As illustrated in Fig. 4(c), there were two binding energies at 531.8 and 533.4 eV which revealed the presence of C⚌O and C—O groups, respectively (Jeon et al., 2013). From deconvolution of the N1s XPS spectrum in Fig. 4(d), the spectrum for trishydrazone hydrogels (3) was well-fitted to two peaks with binding energies at 398.4 and 399.70 eV indicating the N in C—N bonds and the N in C⚌N bonds, respectively (Lv et al., 2013). The identification of each chemical species as depicted in Fig. 4(b)–(d) was based upon literature-reported peak positions of known chemical compositions and is summarized in Table 3.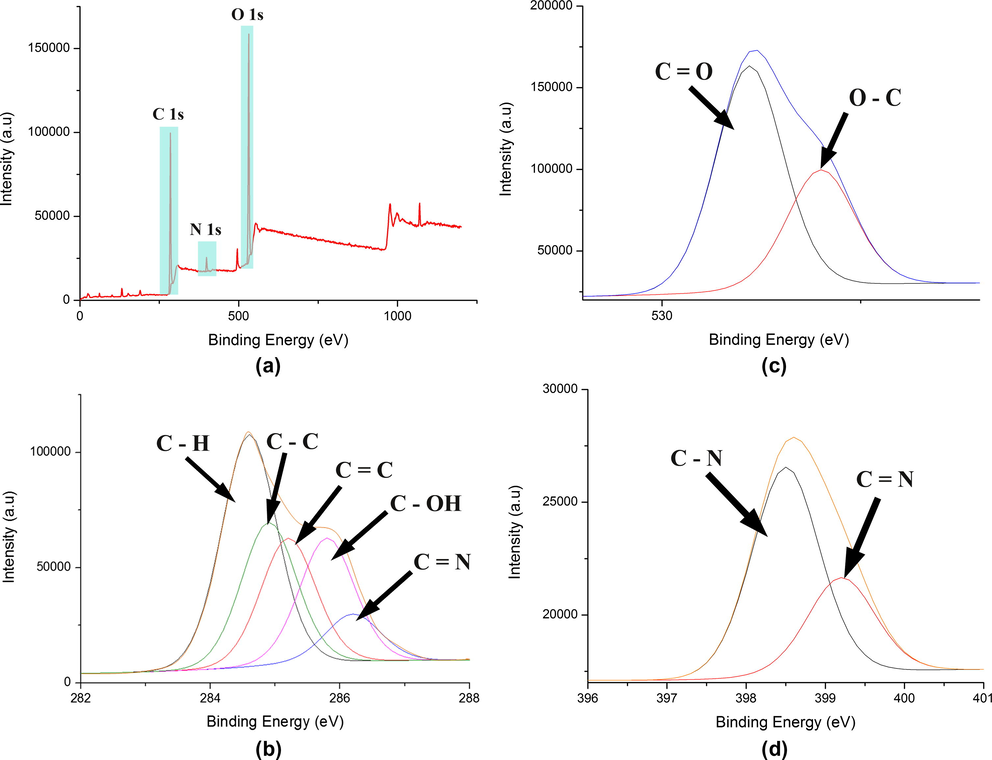
(a) XPS survey spectra of the trishydrazone hydrogels (3); high resolution X-ray photoelectron spectroscopy (XPS) of trishydrazone hydrogels (3) collected in the region region (b) C 1s, (c) O 1s, (d) N 1s.
Elements
Atomic (%)
O 1s
33.02
C 1s
64.09
N 1s
2.88
Elements
Binding energy (eV)
C⚌N/C—N
286.2/286.0
C—C
284.8
C—OH
285.8
C⚌C
285.1
C—H
284.2
O⚌C
531.8
O—C
533.4
N⚌C
398.4
N—C
399.7
4.2 Optimization of trishydrazone hydrogels (3)
Optimization of mechanical strength of hydrogels was studied using the Box–Behnken design where 17-experimental runs were taken at random orders as depicted in Table 4. Three parameters were selected to investigate the most important factors affecting the hydrogels strength namely concentration of precursor (1), pH value, and concentration of buffer. Multiple regression analysis (Table 5) was employed and the experimental results of the full factorial Box–Behnken design were fitted to the polynomial Eq. (1). The adjusted model found for hydrogels strength (response), as a function of the more significant variables, is shown in Eq. (2).
Run
Concentration of precursor (1) (mM)
pH value
Concentration of buffer (mM)
Mechanical strength (kPa)
Actual
Predicted
1
0
0
0
50.47
50.25
2
−
0
+
13.51
13.35
3
+
0
−
9.49
9.71
4
0
−
+
12.96
12.74
5
+
+
0
8.00
8.19
6
0
0
0
50.62
50.25
7
0
+
−
1.17
0.79
8
+
−
0
17.06
16.87
9
−
+
0
5.56
5.75
10
−
0
−
8.04
8.20
11
0
0
0
51.34
50.25
12
0
+
+
3.26
3.29
13
0
−
−
5.43
5.40
14
0
0
0
49.55
50.25
15
−
−
0
14.55
14.93
16
+
0
+
17.37
17.18
17
0
0
0
49.25
50.25
Source
Degree of freedom (DF)
Sum of squares
Mean squares
F-value
p-value
Model
6118.65
9
679.85
1379.57
<0.0001
X1
17.79
1
17.79
36.10
0.0005
X2
132.19
1
132.19
268.25
<0.0001
X3
72.30
1
72.30
146.71
<0.0001
X1X2
0.29
1
0.29
0.58
0.4709
X1X3
2.13
1
2.13
4.33
0.0761
X2X3
12.36
1
12.36
25.07
0.0016
X12
1170.83
1
1170.83
2375.88
<0.0001
X22
2136.89
1
2136.89
4336.22
<0.0001
X32
1967.28
1
1967.28
3992.06
<0.0001
Residual
3.45
7
0.49
Lack of fit
0.59
3
0.20
0.27
0.8427
Pure error
2.86
4
0.72
Std. dev.
0.70
R-squared
0.9994
Mean
21.63
Adj R-Squared
0.9987
Pred R-Squared
0.9977
The presented results of analysis of variance (ANOVA) in Table 5 showed that the developed quadratic model is significant for prediction of mechanical strength of hydrogels under the studied experimental condition. Based on the experimental results acquired, the model F-value and the corresponding p-value were 1379.57 and <0.0001 respectively. These indicated that the model was significant and only had 0.01% chance that the model F-value happens due to noise. From the results, pH (X2) was the most influential parameter among those 3 parameters which attained 268.25 of F-value and followed by concentration of buffer (X3) with 146.71 of F-value. The least influential parameter was concentration of precursor (1) (X1) which scored 36.10 of F-value. The p-value should be <0.05 to validate the significant of the design model. The lack of fit value of 0.20 implied that the lack of fit was not significant relative to the pure error. There was 84.27% chance of this lack of fit and this large could occur due to noise. Non-significant lack of fit depicted that the model was good and well fitted in the experiments. Furthermore, referring to ANOVA of Table 5, only the interaction between X2X3 showed a significant effect on the response since the significant of the design model (p-value) was set at <0.05.
The coefficient of determination, R2 value of 0.9994 showed the predicted polynomial model tolerantly well fitted the data. The value of the predicted R2 (Pred R-Sq) was 0.9977 in reasonable agreement with value and the adjusted R2 (Adj R-Sq) was 0.9987. The comparison between predicted versus actual values of hydrogels mechanical strength is illustrated in Fig. 5. Obviously, the values distributed relatively along the regression line indicating a good agreement between the predicted and actual values and within the range of experiment (Zhang et al., 2011).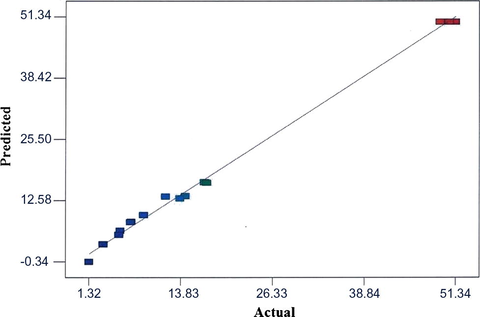
Fit plot of regression model for mechanical strength of hydrogels from the experimental design.
4.3 Response surface plots
Three dimensional (3D) plots were constructed by Design Expert 7.0 software as displayed in Figs. 6–8 to illustrate the relation and importance of those three independent variables (concentration of precursor (1), pH value, and concentration of buffer) with dependent variable (storage modulus). In the response surface plot and contour plot, the mechanical strength of hydrogels (storage modulus) was acquired along with two continuous variables, while the other one variable was fixed constant at its 0 level. The maximum predicted value indicated by the surface was confined in the smallest eclipse in the contour diagram. It is known that the elliptical contours would be obtained when there is a good interaction between the independent variables (Yuan et al., 2015).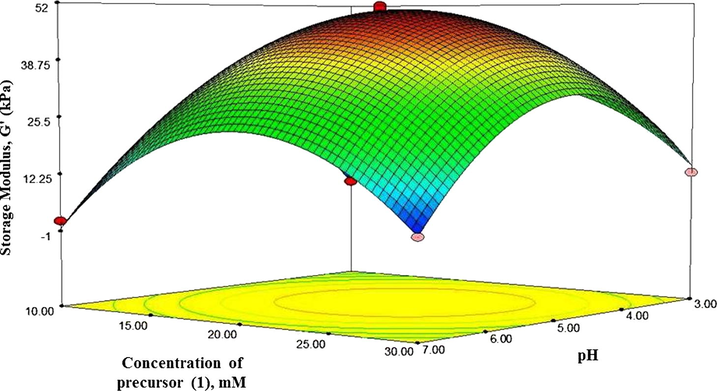
Response surface plot showing the effect of concentration of precursor (1) and pH and on strength of hydrogels.
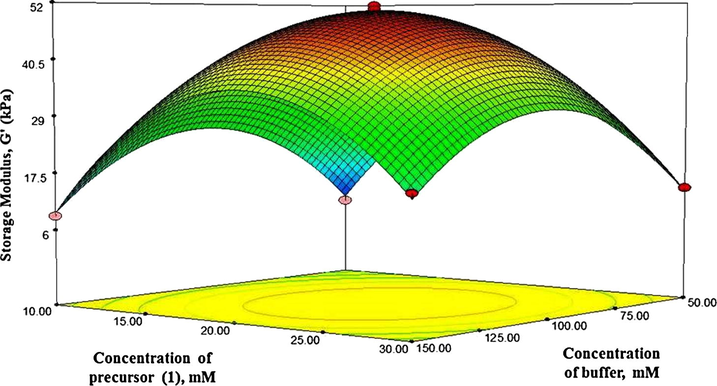
Response surface plot showing the effect of concentration of precursor (1) and concentration of buffer on strength of hydrogels.
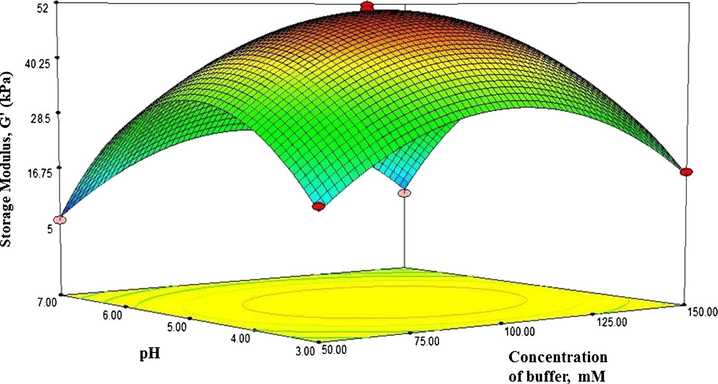
Response surface plot showing the effect of pH and concentration of buffer on strength of hydrogels.
The strength of hydrogels affected by concentration of precursor (1) and pH was seen in Fig. 6, when concentration of buffer was maintained at the zero level in the contour plot. The plot showed that the storage modulus increased as the pH was extended from 4.0 to 5.0. However, further increase in pH results in the decrease in the storage modulus. The storage modulus also increased as concentration of precursor (1) increased from 15 to 20 mM, and the storage modulus reduced after concentration of precursor (1) went to 25 mM. The maximum storage modulus was obtained when the concentration of precursor (1) and pH was 20 mM and 5 respectively.
Fig. 7 demonstrated the strength of hydrogels for varying concentration of precursor (1) and concentration of buffer when the pH was maintained at the zero level. It was depicted that the optimum storage modulus was obtained when the concentration of precursor (1) and concentration of buffer were 20 and 100 mM, respectively.
The response contour in Fig. 8 described the interaction between pH and concentration of buffer with the concentration of precursor (1) was set at zero level. It was found that increasing the pH from 3 to 5 and increasing the concentration of from 50 to 100 mM increased the storage modulus of hydrogels and the maximum value of the storage modulus was observed within those levels.
Validation of the experiment was performed at the optimum conditions as illustrated in Table 6 to obtain the maximum mechanical strength of hydrogels. Response optimum values were achieved by setting the starting point of concentration of precursor (1), pH and concentration of buffer at 20 mM, 5 and 100 mM respectively. The response that is storage modulus was estimated as 49.0 kPa within these optimum conditions (concentration of precursor (1) 21 mM, pH 4.8 and concentration of buffer 100 mM). An additional experiment was further conducted within those optimum conditions (concentration of precursor (1) 21 mM, pH 4.8 and concentration of buffer 100 mM) to verify the agreement of the model and experimental results. It is found that the experimental value obtained was 50.5 kPa and gave the maximum error of ± 3% from the predicted results indicating the validity of the finding of response surface optimization.
Parameter
Values
Mechanical Strength of hydrogels, kPa
49.0
X1 (Concentration of precursor (1), mM)
21.0
X2 (pH)
4.8
X3 (concentration of buffer, mM)
100.0
5 Conclusions
In this study, mechanical strength of hydrogels was evaluated by response surface methodology. It was illustrated that the influence of catalyst on the material properties showed different mechanical strengths with catalyst. At pH 5, the mechanical properties reached the highest value with storage modulus, G’ of 50 kPa compared to uncatalyzed sample at pH 7 with storage modulus, G’ only 5 kPa. The fact that the mechanical strength of trihydrazone hydrogels (3) is higher in acidic condition due to formation of branching interconnecting nanofibers which subsequently formed thick homogenous networks leading to a higher modulus storage in catalytic condition. While in the absence of catalyst, there would be less branching and poor connection in nanofibers network leading to lower modulus storage (Boekhoven et al., 2013). Optimization study by using RSM for all three independent variables namely concentration of precursor, pH and concentration of buffer validated the results obtained from the experiment where it showed a good agreement between each other. According to the statistical design method, the optimal operation conditions were determined at concentration of precursor = 20 mM, pH = 5 and concentration of buffer = 100 mM. Among the three stated variables (Concentration of precursor (1), pH and Concentration of buffer), pH was the most influential parameter. Verification experiment was performed at the optimum conditions and the experimental value (50.5 kPa) closely agreed with predicted value (49.0 kPa). The results of XPS revealed the presence of the expected elements namely C1s (binding energies of 284.2, 284.8, 285.1, 285.8, and 286.2 eV, for C—H, C—C, C⚌C, C—OH, and C⚌N bonds), N1s (binding energies at 398.4 and 399.70 eV indicating C—N and C⚌N bonds) and O1s (binding energies at 531.8 and 533.4 eV corresponding to C⚌O and C—O groups) respectively. Further morphological studies with CLSM and AFM confirmed the branching and bundling of fibers leading to dense, evenly distributed and well-connected hydrogels network as well as the presence of cross-linked nanofibrillar network structure.
Acknowledgments
The authors wish to thank the Department of Chemistry, Faculty of Science, Universiti Teknologi Malaysia and Department of Chemical Engineering, Faculty of Applied Science, Delft University of Technology for the experimental works facilities, Ministry of Higher Education (MOHE), Malaysia, for Fundamental Research Grant Scheme (FRGS) 4F195. Our gratitude also goes to the Ministry of Higher Education (MOHE) Malaysia and Universiti Malaysia Kelantan (UMK), Malaysia for scholarship given to Nor Hakimin bin Abdullah.
References
- Optimization of textural properties of konjac gels formed with κ-carrageenan or xanthan and xylitol as ingredients in jelly drink processing. J. Food Proc. Pres.. 2014;39(6):1735-1743.
- [Google Scholar]
- RSM Simplified: Optimizing Processes Using Response Surface Methods for Design of Experiments. New York: Productivity Press; 2005. p. 292
- Effect of process conditions on the gel viscosity and gel strength of semi-refined carrageenan (SRC) produced from seaweed (Kappaphycus alvarezii) J. King Saud Univ. –Eng. Sci.. 2012;26(1):3-9.
- [Google Scholar]
- Optimization and formulation design of gels of Diclofenac and Curcumin for transdermal drug delivery by Box–Behnken statistical design. J. Pharm. Sci.. 2010;100(2):580-593.
- [Google Scholar]
- Optimisation of polyherbal gels for vaginal drug delivery by Box–Behnken statistical design. Eur. J. Pharm. Biopharm.. 2007;67(1):120-131.
- [Google Scholar]
- Hydrogel as a Controlled Release System. Vol vol. 3. Nova Science Publishers; 2012. p. :95-129.
- Simulation of XPS C1s spectra of organic monolayers by quantum chemical methods. Langmuir. 2013;29(15):4782-4788.
- [Google Scholar]
- Direct nitrogen fixation at the edges of graphene nanoplatelets as efficient electrocatalysts for energy conversion. Sci. Rep.. 2013;3:2260.
- [Google Scholar]
- Polyester dendritic systems for drug delivery applications: in-vitro and in-vivo evaluation. Bioconjugate Chem.. 2002;13:453-461.
- [Google Scholar]
- Swelling behaviour and mechanical strength of crosslinked dextran hydrogel. Macromol. Res.. 2003;11(4):291-295.
- [Google Scholar]
- Optimization of adding konjac glucomannan to improve gel properties of low-quality surimi. Carbohydr. Polym.. 2013;92(1):484-489.
- [Google Scholar]
- A novel cobalt tetranitrophthalocyanine/graphene composite assembled by an in situ solvothermal synthesis method as a highly efficient electrocatalyst for the oxygen reduction reaction in alkaline medium. Phys. Chem. Chem. Phys.. 2013;15(31):13093-13099.
- [Google Scholar]
- Drug release from hydrazone-containing peptide amphiphiles. Chem. Commun.. 2011;47:7962-7964.
- [Google Scholar]
- Design and Analysis of Experiments: Response Surface Method and Designs. New Jersey: John Wiley and Sons Inc.; 2005.
- Spatial and directional control over self-assembly using catalytic micropatterned surfaces. Angew. Chem.. 2014;53(16):4132-4136.
- [Google Scholar]
- Variable gelation time and stiffness of low-molecular-weight-hyrogels through catalytic control over self-assembly. Nat. Protoc.. 2014;9(4):977-988.
- [Google Scholar]
- A NEXAFS examination of unsaturation in plasma polymers of allylamine and propylamine. J. Phys. Chem. B. 2004;108(33):12472-12480.
- [Google Scholar]
- Rheological and textural studies of fresh and freeze-thawed native sago starch sugar gels. I. Optimisation using response surface methodology. Food Hydrocol.. 2011;25(6):1530-1537.
- [Google Scholar]
- Increasing the local concentration of drugs by hydrogel formation. Angew. Chem. Int. Ed.. 2003;42(27):3072-3075.
- [Google Scholar]
- Responsive cyclohexane-based low-molecular-weight hydrogelators with modular architecture. Angew. Chem.. 2004;43(13):1663-1667.
- [Google Scholar]
- Investigation on the assembled structure–property correlation of supramolecular hydrogel formed from low-molecular-weight gelator. J. Colloid Inter. Sci. 2008;319(1):357-364.
- [Google Scholar]
- PH- and temperature-responsive hydrogels from crosslinked triblock copolymers prepared via consecutive atom transfer radical polymerizations. Biomaterials. 2006;27(14):2787-2797.
- [Google Scholar]
- Enzymatic hydrolysis of oleuropein from Olea europea (olive) leaf extract and antioxidant activities. Molecules. 2015;20:2903-2921.
- [Google Scholar]
- Evaluation of electro-oxidation of biologically treated landfill leachate using response surface methodology. J. Hazard. Mater.. 2011;188(1):261-268.
- [Google Scholar]
- Fast removal of ammonium ion using a hydrogel optimized with response surface methodology. Chem. Eng. J.. 2011;171(3):1201-1208.
- [Google Scholar]


