

Translate this page into:
Effect of incorporation of multi-walled carbon nanotubes on the CO2/CH4 separation performance of sulfonated poly (ether ether ketone) / polyetherimide composite membranes using design of experiments and molecular dynamics simulation methods
⁎Corresponding author. ameri@iaush.ac.ir (Elham Ameri)
-
Received: ,
Accepted: ,
This article was originally published by Elsevier and was migrated to Scientific Scholar after the change of Publisher.
Peer review under responsibility of King Saud University. Production and hosting by Elsevier.
Abstract
Abstract
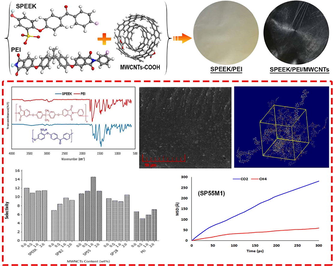
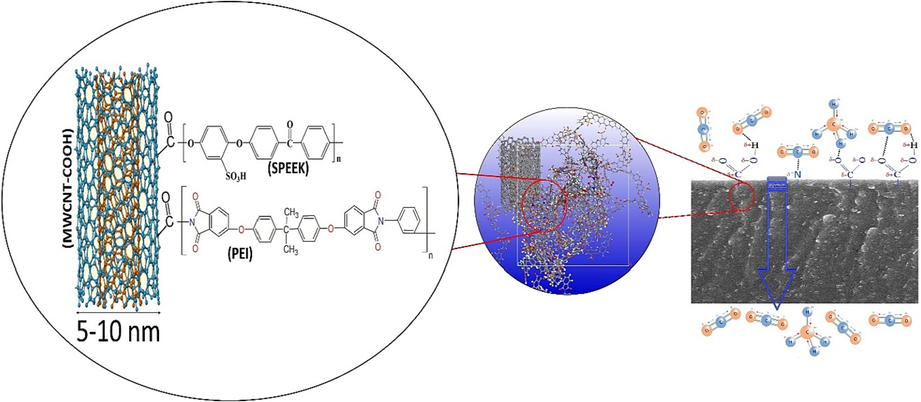
Blend membranes were prepared based on sulfonated poly (ether ether ketone) (SPEEK) and poly (etherimide) (PEI) using different amounts of multi-wall carbon nanotubes (MWCNTs) (up to 2 wt%). PEEK has been sulfonated directly to reach 70 % degree of sulfonation. The manufactured membranes were examined by X-ray diffraction (XRD), scanning field emission electron microscopy (FESEM), Fourier transformed infrared spectroscopy (FTIR). The effect of the composition of SPEEK / PEI on membrane selectivity was investigated under different feed pressures (2 to 8 bar) and temperatures (25 to 55 °C). The values of selectivity and gas permeability were varied between the value of the individual polymers, fluctuating systematically with SPEEK / PEI content variation in the blends. TGA and tensile tests result obtained for prepared membranes shown that the hybrid membrane had good thermal and mechanical properties. The addition of MWCNTs to the blend led to simultaneously improve the selectivity and permeability of the pair gases of CO2 and CH4. The permeability of CO2, as well as CH4/CO2 selectivity for the membrane with the same weight of SPEEK and PEI, and 1 wt% of MWCNTs (coded SP55M1) experienced an increase of about 22 % compared with the neat membrane. Molecular dynamics simulations (MDS) were performed by employing the COMPASS force field to estimate the diffusivity of CH4 and CO2 gases through selected membranes. At last, with compared to the obtained experimetal data, the optimized nanocomposite membrane, integrated with MWCNTs was efficient, which makes it promising platform to separate mixed gase flows of CO2 and CH4 and other related environmental processes.
Keywords
Poly (ether ether ketone)
Poly (etherimide)
Multi-wall carbon nanotubes
Permeability
Molecular dynamics simulation

1 Introduction
The separation of gases by the membrane is a vital unit operation in several industrial processes and is attracting momentum in the improvement of natural gas (Koros and Fleming, 1993), the removal of carbon dioxide from combustion gases (Powell and Qiao, 2006), the purification of biogas (Basu et al., 2010), and landfill gas treatment. Natural gas sources with greater CO2 concentrations are being explored, as low CO2 natural gas sources are limited and nearly exhausted. CO2 decreases the calorific value of methane gas streams and results in corrosion of equipment and pipeline (Bhide et al., 1998); hence CO2 removal from natural gas is crucial before use.
Employing polymer-based membranes for CO2 separation is considered a competitive alternative to conventional technologies of absorption, including amine scrubbing (Rochelle, 2009) due to its simple design (which may be easily scaled up), higher energy efficiency, and the high surface-to-volume ratio (Simons, 2010).
In order to achieve the favorable strength and durability of the membrane, the polymers utilized for preparing the membranes must have the following requirements: proper chemical and thermal resistance, good mechanical properties, resistance to plasticization and tolerance to physical aging (Powell and Qiao, 2006; Haroon et al., 2017). Improving the efficiency of polymer membranes with high selectivity and permeability is one of the essential concerns of researchers (Akbarian et al., 2018). Much research has been carried out to enhance gas selectivity and permeability of polymer membranes, with an emphasis on the relationship between polymer backbone structure and gas separation properties (Tamiji and Ameri, 2017; Zare et al., 2021). The gas permeation properties of glass polymers are highly sensitive to the repeating unit’s chemical structure (Matteucci et al., 2006), and their chains have limited mobility below the transition temperature of the glass. It has been stated that increased stiffness of the spine improves selectivity by aiding in gases’ molecular sieving with similar solubility coefficients (Rose et al., 2015). However, it also leads to permeability reduction. The majority of the polymers studied tend to show the general tendency that greatly permeable polymers have quite low selectivity and vice versa, which is known as the permeability/selectivity compensation ratio (Robeson, 2008; Robeson, 1991). The most investigated polymer class for gas separation membrane materials are PEI and poly (ether ether ketone) (PEEK) (Alentiev et al., 2000). PEI and PEEK are recognized for high mechanical and thermal stability.
PEI is a unique thermoplastic polymer that has been designed to overcome problems of polyimides, including difficulty in shaping or processing. The addition of an ether group to the polyimide backbone leads to improve the thermal and mechanical properties. In addition, the cost of PEI is low in comparison with other polymers. PEI, like other polymers, suffers from the trade-off between selectivity and permeability. In order to solve this problem, fillers should be added during the membrane preparation to form a mixed matrix membrane (MMM). Such fillers provide voids through the polymer to improve gas transport property (Alqaheem and Alomair, 2019; Zhang et al., 2015; Goh et al., 2011; Haroon and Janjua, 2022).
PEEK is a polymer with promising gas separation properties; it is a modified amorphous PEEK (Jansen et al., 2006). It has been reported that sulfonic groups in membrane materials are effective in increasing the separation performance of the membrane (Khan et al., 2012; Liu et al., 2002; Seoane et al., 2013).
The incorporation of inorganic fillers into the polymer matrix to achieve a hybrid polymer-inorganic membrane has developed an efficient and easy method to intervene in the compaction of the polymer chain and improve the characteristics of free volume, particularly when the size of the filler is close to the polymer chain packing’s characteristic size (Zhang et al., 2008; Kim and Marand, 2008; Matteucci et al., 2008; Chong Lua and Shen, 2013; Ramzan Saeed Ashraf Janjua et al., 2011). Therefore, various types of fillers such as SiO2 (Ahmadizadegan and Esmaielzadeh, 2019; Mehboob et al., 2022), metal oxide (Thebo et al., 2018; Khan et al., 2019; Janjua et al., 2020), alumina (Ameri et al., 2015), clay (Ismail et al., 2019), zeolite (Zarshenas et al., 2016), carbon molecular sieve (Khan et al., 2019; Hu et al., 2019; Janjua et al., 2021), and MWCNTs (Azizi et al., 2017) were utilized. Among them, MWCNTs have aroused considerable research interest (Xue et al., 2017; Shameli and Ameri, 2017; Salahchini Javanmardi and Ameri, 2020; Janjua et al., 2023) due to their excellent mechanical properties and porous structure. When MWCNTs integrated into the polymer matrix, the robust interaction between the polymer chains and the MWCNTs can promote the polymer chains packing and considerably improve the diffusion behavior of the gases (Ismail et al., 2009).
In the present study, PEI and SPEEK were used as a polymer matrix, and MWCNT was used as filler to prepare gas separation mixed matrix membranes. The morphology of the membrane and the structure of the polymer were described and the CO2 / CH4 separation performances were explored. Furthermore, a molecular dynamics simulation was accomplished to calculate diffusion coefficient values in addition to the selectivity of the gases and in comparison them to experimental records.
2 Experimental
2.1 Materials
PEEK (Molecular weight of 20,800) and PEI (Molecular weight of 35,000) were purchased from Sigma-Aldrich. N-methyl-2-pyrrolidinone (NMP), sulfonic acid, and nitric acid were utilized as solvents, and obtained from Merck. CH4 and CO2 gases with 99.99 % purity were obtained from Roham Gas Company, Iran.
MWCNTs with 5–10 nm mean internal diameter were used as nanofillers and were obtained from Tecnan (Spain). Raw MWCNTs materials were purified using a 3:1 blend of H2SO4 (98 vol%) and HNO3 (70 vol%) to form open-ended MWCNTs. The blend was stirred at 80 °C for 4 h, then rinsed with deionized water. The purification method’s details have been provided elsewhere (Shameli and Ameri, 2017; Salahchini Javanmardi and Ameri, 2020; Ismail et al., 2009; Rao et al., 2008).
2.2 Polymer sulfonation
The PEEK sulfonation procedures were similar to those previously reported (Li et al., 2003; Huang et al., 2001; Jaafar et al., 2007). At 100° C in a vacuum oven (Memmert, Germany), it was dried overnight. PEEK was sulfonated using a sulfonating acidic solvent to produce an ion-containing polymer with –SO3 groups. In the present study, the SPEEK solution was prepared by mixing PEEK (4.5 g) concentrated H2SO4 (100 mL). After complete dissolution of the PEEK, we controlled the temperature at 30 °C ± 2 °C and stirred vigorously for 16 h before pouring the acidic solution into a large excess ice-water to precipitate the SPEEK. Then the precipitate rinsed using distilled water to reach a pH close to 7. In order to obtain the complete removal of the residual water, SPEEK was dried at 70° C in an oven (Shimaz Co., Iran) for at least 48 h before being ready for use (Fig. 1). The degree of sulfonation of SPEEK was found to be 72 % by titration technique (Xin et al., 2014).![Sulfonated poly (ether ether ketone) [SPEEK] synthesis.](/content/184/2024/17/1/img/10.1016_j.arabjc.2023.105400-fig2.png)
Sulfonated poly (ether ether ketone) [SPEEK] synthesis.
2.3 Preparation of membranes
At first, in order to remove moisture from the PEI and SPEEK, it was placed at 80 °C for 6 h in a vacuum oven. The solution casting method was used to prepare the membranes.
In order to prepare the pure membranes, the polymer solutions of PEI or SPEEK were prepared at 3 wt% concentrations in NMP with stirring at 60 °C for 8 h. Each solution was filtered through a steel filter to obtain a homogeneous and clear solution, then poured into a Teflon Petri plate, and placed at 50 °C in an oven for 24 h. Lastly, the membrane film was removed from the Petri dish and dried it further for 5 h at 50 °C in the vacuum oven for removal of residual solvent in the structure (Min and Kim, 2010).
In order to prepare the blend membranes (SP82, SP55, SP28), different compositions of PEI and SPEEK polymers consisting of 20/80, 50/50, and 80/20 wt% were separately added into the NMP solution with 3 wt% concentration. Then the similar procedure presented for the pure membrane preparation mentioned in above section was repeated.
In order to prepare the nano composite membranes, the MWCNTs were dispersed in NMP at the weight concentrations of 0.5, 1, and 2 %, followed by 3 h of sonication (model VCLEAN1-L13 made by Backer Co. (and a vigorous stirring for an one hour. Next, the polymer/polymers with 3 wt% concentration (respected to the NMP solution) were added to the MWCNTs mixture. After agitation the mixture for 8 h at 60 °C, it poured into a Teflon Petri plate, and placed at 50 °C in an oven for 24 h. Lastly, the membrane film was removed from the Petri dish and dried it further for 5 h at 50 °C in the vacuum oven for removal of residual solvent in the structure. These prepared membranes are coded and presented in Table 1.
Sample code
SPEEK (wt%)
PEI (wt%)
MWCNTs (wt%)
Pressure (bar)
Temperature (°C)
SPEEK
100
0
0
2
25
S3M0.5
100
0
0.5
4
35
S3M1
100
0
1
6
45
S3M2
100
0
2
8
55
SP82
80
20
0
4
45
SP82M0.5
80
20
0.5
2
55
SP82M1
80
20
1
8
25
SP82M2
80
20
2
6
35
SP55
50
50
0
6
55
SP55M0.5
50
50
0.5
8
45
SP55M1
50
50
1
2
35
SP55M2
50
50
2
4
25
SP28
20
80
0
8
35
SP28M0.5
20
80
0.5
6
25
SP28M1
20
80
1
4
55
SP28M2
20
80
2
2
45
PEI
0
100
0
2
25
P3M0.5
0
100
0.5
4
35
P3M1
0
100
1
6
45
P3M2
0
100
2
8
55
2.4 Orthogonal matrix and experimental parameters
In this study, the orthogonal design was used, as it was found to be the most operational method for studies with several variables to recognize which variables influence the objective experience the most. In order to achieve the objective, in the current work, the orthogonal matrix L20 of the Taguchi method has been taken. Table 1 presents the variables and their levels for the L20 orthogonal matrix plane.
The key step in this method is the selection of parameters for obtaining reliable and accurate results. The percentage of seed suspension for sowing media, MWCNTs content, pressure and temperature were four chief factors selected on the basis of previous studies focused on preparing the best membrane regarding the gas separation performance. In order to validate the results and remove the effect of each variable, four levels were chosen for each of them by performing 20 experimental tests, as presented in Table 1.
2.5 Characterization
FTIR spectra were gathered using an AVATAR FTIR spectrometer (Thermo, USA) within 400–4000 cm−1 range for functional groups analysis and determination of the changes of the chemical compositions of the polymer made when dissolved in various solvents. The morphology of the prepared membranes was studied with a field emission scanning electron microscope (FESEM) instrument (MIRA3-TESCAN). In order to obtain an obvious view of the cross-sections of the membranes, the samples were cryogenically fractured in liquid nitrogen and then vacuumed coated with Au. Also, XRD analysis was done using X-ray diffraction; Philips PW1730 diffractometer (Netherlands) with CuKa X-ray radiation in 5–80 range to assess the membranes’ crystallinity. The mechanical properties of rectangular membranes (50 × 10 mm) were determined using a tensile testing machine (Santam STM-50, Iran) with 20 N load cell and a crosshead speed of 1 mm/min at room temperature (23 ± 2 °C). For reproducibility, at least three specimens were tested for each sample, and the results were averaged. The thermogravimetric analysis (TGA) was carried out using a TA instrument (TGA SDT Q600, USA).Samples were heated in argon from 20 °C to 800 °C at a ramp of 10 °C/min. TGA analysis was performed to determine thermal stability and the amount of solvent remained in membrane samples.
2.6 Tests of gas permeation
The experiments of permeation of pure gases of CH4 and CO2 through the prepared membranes were carried out using the constant pressure / variable volume method. Before the permeation test, the membranes was placed in a vacuum oven to remove any adsorbed water. The operating conditions of these experiments were adjusted to different temperatures (25, 35, 45, and 55 °C) and different pressures (2, 4, 6, and 8 bar). The volumetric flow rate of the permeate gas was measured with a flowmeter of bubbles illustrated schematically in Fig. 2. After reaching the equilibrium state (1 h), the permeability values of the two gases through membranes were determined according to the Eq. (1) (Mahdavi et al., 2017):
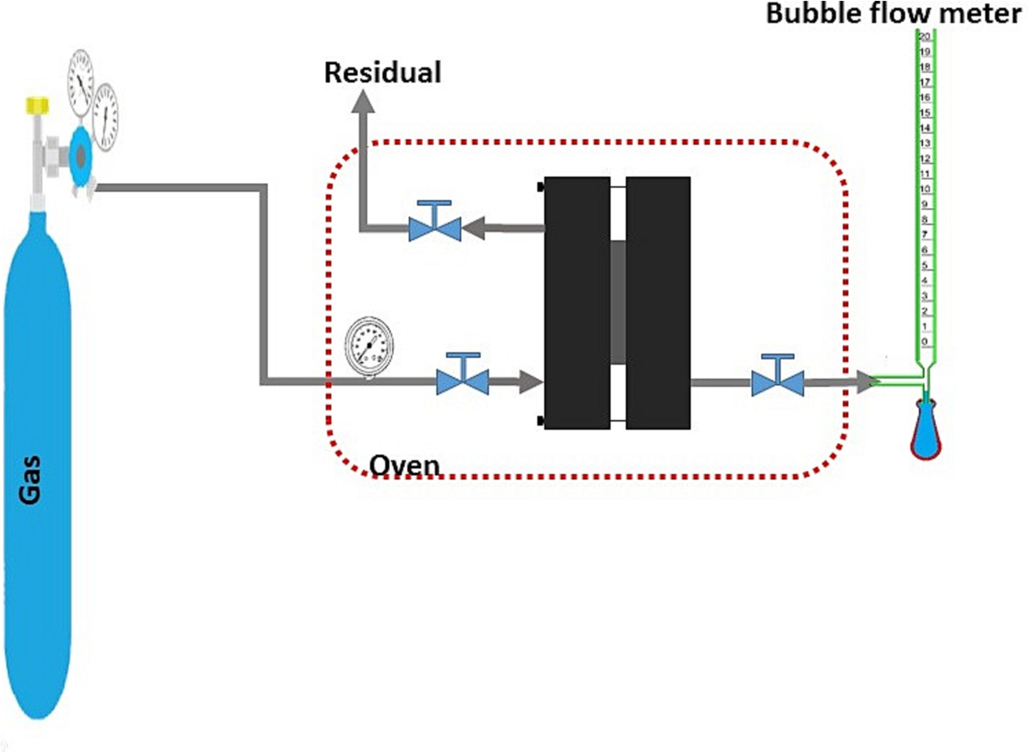
Schematic view of the gas separation test’s experimental setup.
In which P is the permeability expressed in barrer [1 barrer = 10−10 cm3(STP) cm cm−2s −1 cmHg−1]; Q represents the permeate gas’s flow rate passing through the membrane (cm3s −1); p1 and p2 are feed side and permeate side’s absolute pressures (cmHg), respectively; and A represents the effective area of the membrane (cm2). In order to minimize possible errors in the performed experiments, three membranes of each sample were examined, and the mean permeability values were reported.
In order to calculate the ideal selectivity (αA/B) of the membranes, the permeability for two studied gases (PA and PB) were used in Eq. (2) (Flaconnèche et al., 2001):
2.7 Molecular dynamic simulation
Molecular dynamics is a technique for observing atomic and molecular mobility at the microscale (Ali et al., 2023). Newton's formula is one of the mathematical models that may be addressed using MD for the microscopic movements of systems having N involving atoms (Ebadi-Dehaghani et al., 2015).
Eq. (2) states that the forces (Fi) are equivalent to the potential function (V).in which ri and t stand for the center-of-mass position vector related to penetrant i and the time, respectively.
Whereas these equations are being computed, the temperature and pressure should be maintained at prescribed levels. Each output file's coordinates are calculated at regular intermissions of a predetermined length. The path that the system is going to take can be deduced from these coordinates as a function of time. The system undergoes a change in the start while eventually arriving at a state of equilibrium, and the majority of the system's macroscopic features, including diffusion, can be understood by taking an average throughout the time period of an equilibrium trajectory (Ebadi-Dehaghani et al., 2015). Calculating the diffusivity of gases via organic solvents and polymers can be done with the too molecular dynamics simulation by providing the mean square displacement (MSD) for the corresponding gas with in polymer matrix. the diffusion coefficient can be determined using the best fitted linear curve of MDS time graph regarding to the Einstein equation (Ebadi-Dehaghani et al., 2015).
in which (|r(t)-r(0)|) signifies the movement of pervading gases away from their initial locations. The diffusion coefficient, denoted by D, can be calculated by looking at the slope of the plot that shows the MSD being plotted versus time, t.
2.7.1 Molecular dynamic simulation methodology
The rate of diffusion of CH4 and CO2 gases in the nanocomposites (NCs) was determined constructing an amorphous cell containing either CO2 or CH4 along with the NCs/blend. Following the completion of the cell's construction, a molecular dynamics simulation was run in order to determine the mean square displacement of the CO2 or CH4 molecules. The simulation was done in accordance with Charati and Stern's research (Charati and Stern, 1998). They employed silicon polymers as substrates to evaluate the diffusivity of the desired gases. All the MD simulations in this study have been performed using DS-Biovia Materials Studio 2020 Software. The following procedures were carried out in every single modeling exercise:
1) establishment the building the molecular structures, 2) the formation of an amorphous cell, 3) relaxation of amorphous cell, 4) the run of molecular dynamics simulations and the analysis of the results, 5) calculation of the diffusivity using Eq. (5).
The first thing that has to be done is to identify the molecules that make up the cell. The constructed amorphous cell has to have the molecules of CO2 or CH4 as well as investigative structures added to it. It was necessary to assemble the chains of the polymer molecules before beginning the simulation. After that, a cell was constructed that included ten chains of the polymer constituents or blends and either four molecules of CO2 or CH4 inside of it. The target density was set as 0.95 g/cm3. When an amorphous cell is formed, the molecules that make up the cell may not be dispersed evenly across the cell, resulting in the formation of void (vacuum) regions. In order to solve this issue a very was carried out. Following the completion of the minimization, a brief simulation of molecular dynamics should be undertaken in order to equilibrate the cell. Relaxing the structure is a process that involves minimization and molecular dynamics. Due to the fact that it is a more efficient ensemble, the constant-temperature, constant-volume (NVT) ensemble was chosen to be employed for the purpose of this simulation. In the MD runs, the systematic temperature was set at 300 K using a technique that controlled the temperature in a continuous manner (Charati and Stern, 1998; Hofmann et al., 2000; Salehi et al., 2018). Once the energy in the live update chart document reached a stable state, the NVT ensemble's system was considered to have reached a state of equilibrium. For the duration of the equilibration process, the velocity-scale thermostat was utilized. The sample rate was set to 250 fs, the iteration step was set to 50,000, and a total of 300 ps trajectories were gathered for the study. COMPASS force fields were selected throughout all of the systems. In a relatively short amount of time, the molecules of the gas run into a relatively tiny volume that is free. Because the molecules that are trapped are unable to disperse on this time scale, the MSD stops going up or down and continues without any change. Over a longer period of time, the molecule moves from the limited region to another free volume location and escapes the confines of the area. Diffusion is the motion that occurs as a consequence of repetitive leaps; it is distinguished by a mean square displacement (MSD) that is linear in time (Eq. (5)). The value of the MSD in Forcite is determined by taking an average of all the molecules’ atoms. In order to calculate the diffusion coefficient, the data must the fited in the diffusive regime to a straight line using the equation y = ax + b, and then extract the slope “a” from that line. Å2/ps will be the unit of the slope. Following directly from the aforementioned definition and (Eq. (5)), D can be follows:
3 Results and discussion
3.1 FT-IR spectra analysis
FT-IR analysis was employed to assess the structural properties of the prepared membranes, and presence of the MWCNTs in the nanocomposite membranes. The FTIR spectra of the synthesized SPEEK, PEI, blend and mixed matrix membrane containing 0.5 and 1 wt% of MWCNTs are shown in Fig. 3. Also, FTIR peaks and assigned functional groups clearly indicated in the Table 2. Based on the FTIR studies, the observed broad band at 3400 cm−1 in the SPEEK membrane may be attributed to the OH vibration of the sulfonic acid groups which interacted with the water molecular. Moreover, in the SPEEK membrane, symmetric and asymmetric sulfonic acid groups’ stretching vibration peaks were seen at 1020 cm−1 and 1220 cm−1, respectively (Xing et al., 2004; Luu et al., 2009; Rangasamy et al., 2015; Xi et al., 2015). According to the spectra of the characteristic PEI membrane, absorption peaks are as flowing: imide group 1716 cm−1 and 1775 cm−1 corresponding to symmetric and asymmetric stretching of carbonyl imide group, CN bending and stretching 737 cm−1 and 1348 cm−1 respectively, aromatic carbon C = C 1595 cm−1, aromatic ether (C-O-C) 1232 cm−1 (Rajagopalan et al., 2010; Yadav et al., 2020). As can be seen in Fig. 3 (MWCNTs), for pristine MWCNTs, the OH stretching vibrations were denoted at 3440 cm−1 as a broad absorption band. Moreover, in this Figure, the 1715 cm-1 absorption peak seems to correspond to the C = O groups typical stretching vibration in carboxyl functional units. Also, the distinguishing peak of about 1634 cm−1 can be attributed to the C = C aromatic bonds vibration. The broad 1170 cm−1 peak might be attributed to the alkoxy group’s CO branch (Park et al., 2018).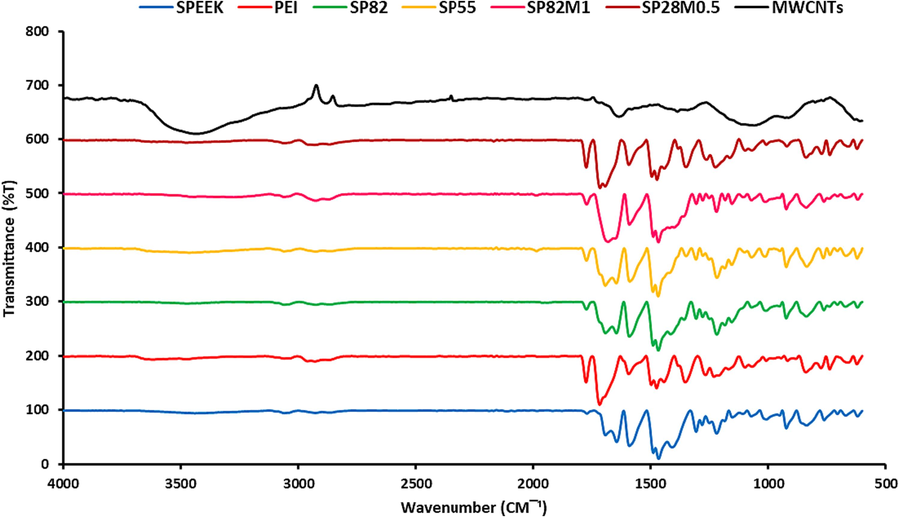
FTIR spectra of the neat and mixed matrix membranes.
Material
Wave number (cm -1)
Functional group
SPEEK
3400
O–H sulfonic acid groups
1220
asymmetric sulfonic acid groups
1020
symmetric sulfonic acid groups
PEI
1716
imide carbonyl group
1775
imide carbonyl group
1348
C-N stretching
737
C-N bending
1595
aromatic carbon C = C
1232
aromatic ether (C-O-C)
MWCNTs-COOH
3440
OH stretching
1715
C = O stretching carboxyl
In Fig. 3 (SP82M1), the addition of MWCNTs in the nanocomposite membranes showed a novel absorption peak at wave number 1717 cm−1 which belonged to the carbonyl stretch of the carboxylic acid groups of MWCNTs. Therefore, it was certain that the amino acid and sulfonic groups had been attached to the MWCNT-COOH after reacting with SPEEK and PEI. Similar results of the FTIR spectrum for different MWCNTs have been presented in other studies (Ramanathan et al., 2005; Li et al., 2018).
3.2 XRD analysis
The prepared membranes were analyzed using XRD to determine the extent of chain order. Crystalline regions were represented by sharp peaks in the XRD results, and small crystalline regions or disordered regions were represented by broad peaks. XRD patterns of pure, composite, and nano-composite membranes are presented in Fig. 4. Semi-crystalline polymers, pure SPEEK and PEI membranes exhibited a diffraction peak at 18.71° which was related to the crystalline zones in the pure polymers, and the rest of the peaks dedicated to the remaining amorphous zone which showed that the membranes were amorphous.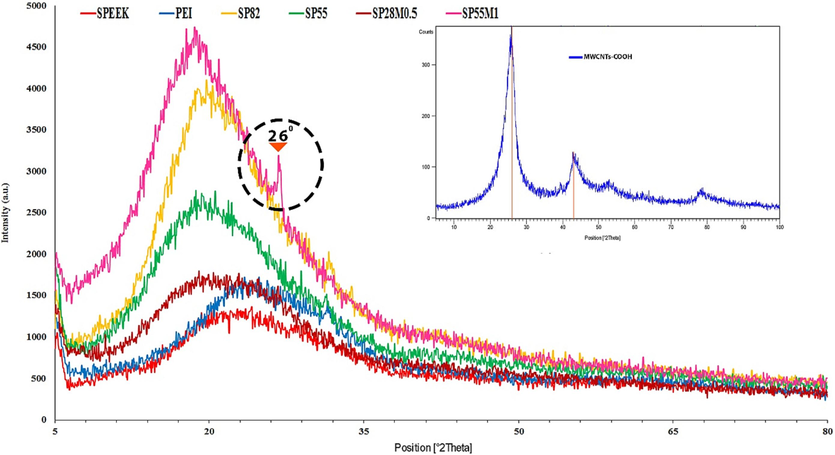
Nanocomposite membranes XRD pattern.
As shown in Fig. 4, blending of SPEEK and PEI polymers resulted in a shift in the sharp peaks and moves them to 18.68°. The peaks are also stronger that it refered to a sign of strong molecular interaction between the polymers. It is also visible that by blending the polymers, the location of the peak related to the crystalline phase was reduced, which it was a sign of increased D distance. On the other hand, this increased D distance could expand the amorphous zone and led to a higher permeability. The D distance of the membranes were calculated using Bragg’s equation (Castro-Landinez et al., 2021).
In this equation, n represents the refractive index associated with integer values, λ represents the incident beam wavelength (Cu Kα, λ = 0.15406 nm), 2θ represents the diffraction angle between scattered X-ray wave vectors and incident and finally, d is interlayer spacing related to the lattice planes.
Moreover, XRD results can be used to determine the crystallinity degree. In this method, the areas under the peaks of the crystallization region are separated into an overall sum of the areas under the amorphous and crystalline regions. Table 3 summarizes d-spacing data and crystallinity. Data represented in Table 3, showed that blending the polymers with different proportions results in 2.5 degrees less crystallinity compared to that for pure polymers.
Sample
Position (2θ)
d-Spacing (Å)
Crystallinity (%)
SPEEK
23.3
3.8
25
PEI
23.3
3.8
23
SP55
19.6
4.6
28.5
SP82
19.6
4.6
31.5
SP28M0.5
21.8
3.8
27
SP82M1
18.7 – 26
4.7 – 3.3
34
As a result, it could be led to an enhancement in permeability in the blend membranes. Fig. 4 (small image) displays an XRD pattern for MWCNTs-COOH. Typical MWCNT peaks (002 and 100) are observed at 2θ of 26° and 43°, respectively, which is similar to the previous results (Nie et al., 2015; Alimohammady et al., 2019). By addition 1 wt% of MWCNT to the polymer in SP55M1, a new peak was formed at 26° which proved the presence of carbon nanotubes in the filled membranes. Increasing crystallinity by addition MWCNT up to 1 % can enhance permeability and selectivity in nanocomposite membranes (Sadek et al., 2018; Yang et al., 2016; Wang et al., 2014).
3.3 FESEM analysis
Fig. 5 (A, B, C, and D) depict the cross-sectional image of pure PEI and SPEEK membranes, and SPEEK/PEI composite membranes without the addition of MWCNTs. The evident image of the thin and dense layer makes it possible to measure this layer’s thickness. FESEM images presented in Fig. 5 revealed that the prepared membranes were non-porous. Fig. 5 (E and F) demonstrates cross-sectional images of SPEEK/PEI/MWCNTs membranes. Based on Fig. 5 (E and F), MWCNT’s agglomeration was carried out with a loading of 0.5 wt% and 1 wt% of MWCNTs, and it was more observed in a membrane with higher MWCNT content. As depicted in Fig. 5 (E, F), MWCNTs shown in the cross-sectional view of the composite membranes demonstrated an effective interconnection between MWCNTs and the polymer matrix, increasing the efficiency of membrane performance. This was possibly owing to an interaction between the SPEEK’s sulfonic acid groups and the MWCNT’s oxygen group through hydrogen bonding. In addition, integration of MWCNT in the nanocomposite with 0.5 wt%, led to create some holes in the depth of the membrane. It may be occurred due to incompatibility between the polymer and MWCNTs in the membrane. However, the presence of holes in the depth of the membrane can play an important role in reducing the mass transfer resistance through it, and consequently obtaining increased fluxes, while it will not have a negative effect on the selectivity in the upper part of the membrane.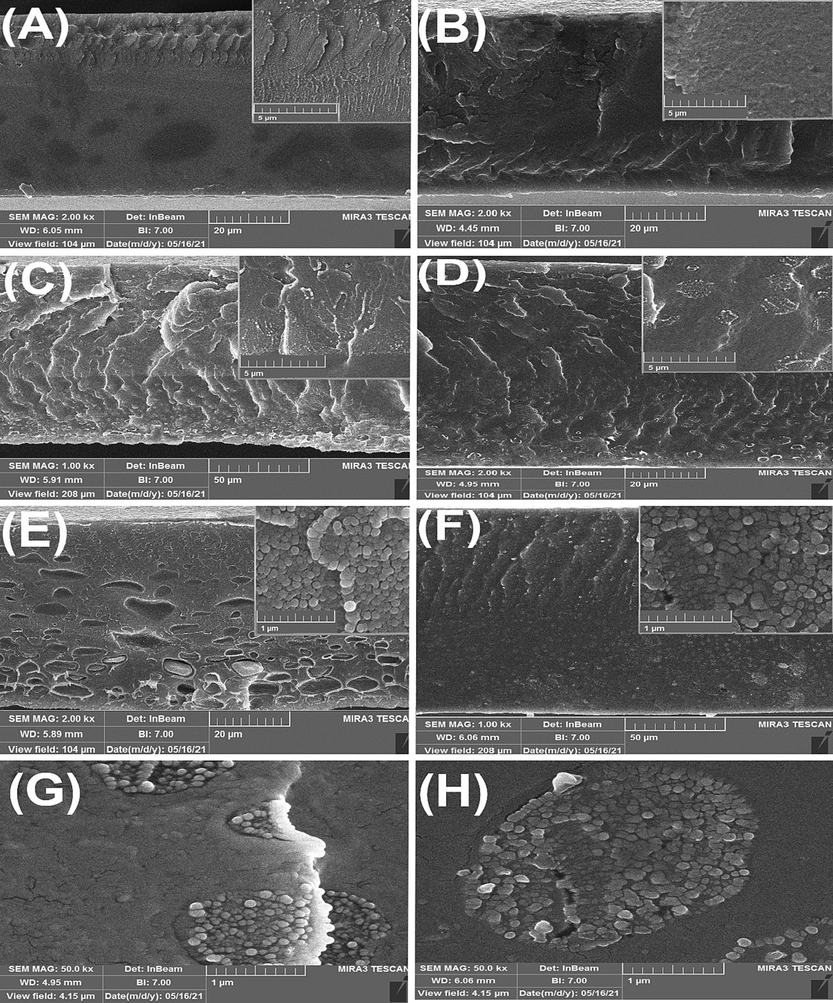
FESEM cross-sectional images of composite membranes, (A) PEI (B) SPEEK (C) SP55 (D) SP82 (E) SP28M0.5 (F) SP55M1 (G) SP28M0.5 (50.0 kx) (H) SP55M1 (50.0 kx).
3.4 Tensile properties
To assess the effect of the integrated MWCNTs on the mechanical properties of the membranes, the uniaxial tensile test was performed for both SP82 and Sp82M1 membranes, at a strain rate of 1 mm min−1. The results are shown in Fig. 6. The values of the determined parameters of elastic modulus, tensile strength at break, and elongation at break for the studied membranes are listed in Table 4. A significant intensification for both the elastic modulus as well as the tensile strength at break was found for SP82M1, as compared to that for the SP82. By integration the MWCNTs into the SP82 membrane, the elastic modulus was improved from 3 MPa to 3.14 MPa, and the tensile strength at break was increased from 4.51 MPa to 7.25 MPa. This effect was most likely due to the favorable physical interaction between MWCNTs and the polymer chains, creating additional entanglements at 1 wt%. Furthermore, elongation at break was increased by integration of MWCNTs into the SP82 from 9.4 to 52.4 corresponding to an increase of 43 %. This suggested that the interaction between the MWCNTs and the polymer matrix was very strong; therefore, the nanocomposites exhibited higher strength compared to the unfilled membrane. In this regard, improvement of mechanical performance by increasing CNTs into membrane was reported in other works (Bin et al., 2006; Ma et al., 2010; Liu et al., 2005).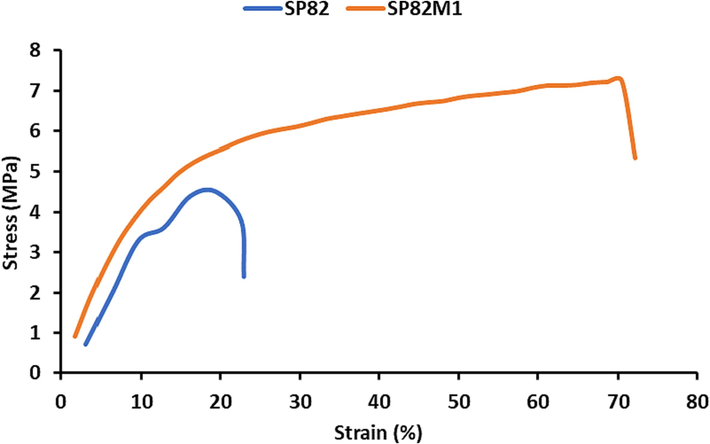
Stress–strain curves of the SP82 and SP82M1 membranes.
Elastic modulus (MPa)
Tensile strength at break (MPa)
Elongation at break (%)
3
4.51
9.4
3.14
7.25
52.4
3.5 TGA analysis
Fig. 7 shows the TGA graph of SP82 and SP82M1 membranes by heating from 120 °C to 800 °C under nitrogen atmosphere. As observed in Fig. 7, three steps of weight loss were indicated for the SP82 and SP82M1 membranes. The first step weight loss stage was attributed to the solvent loss in SP82 and SP82M1 membranes. The next loss in the mass of the membranes observed at nearly 285 °C was due to the pyrolysis of the functional group (SO3H) within the membrane’s matrix (Khan et al., 2016; Khan et al., 2016). The last step at around 550 °C was happened due to the decomposition of backbone of the polymer. From Fig. 7, it could be observed that the SP82M1 membrane initiated to decompose at higher temperatures compared with that for the unfilled SP82 membrane. With an enhancement in the content of MWCNTs in the mixed matrix membrane, the thermal properties of the polymer membrane was improved to some extent. It might be related to the excellent temperature stability and stable structure of the filled membrane, and it was also due to the strong interaction between the polymer and the MWCNT. The strong interaction reasoned the polymer chain to become rigid at the interface of the polymer- MWCNTs, therefor; extra heat is required to decompose the rigid polymer chain. In conclusion, the empirical data shown that the hybrid membrane had good thermal properties.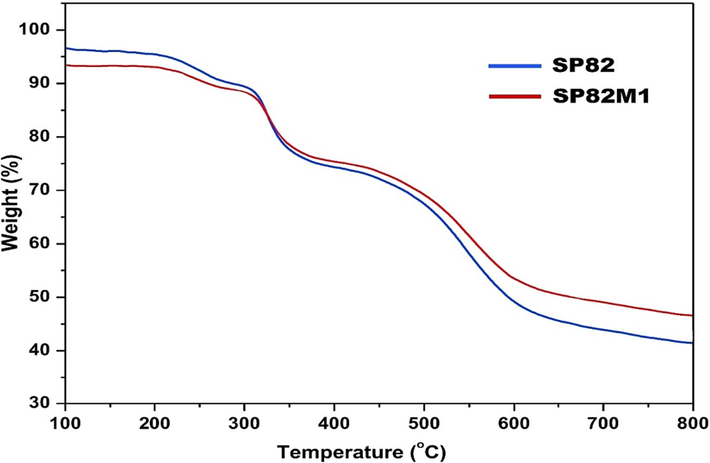
TGA curves of SP82 and SP82M1 membranes.
3.6 Analysis of pure gas permeation
3.6.1 Permeability study
The effect of the addition of MWCNTs on the CH4 and CO2 gas permeability for various prepared membranes is shown in Fig. 8. As shown in Fig. 8, the permeability of CO2 molecules was greater than that of CH4 molecules for all prepared membranes. The greater permeability obtained for CO2 molecules was attributed to its larger condensation capacity, and the quadrupole-dipole interaction between functional groups in the blend membranes (OH and/or amine groups) and CO2 molecules (Shamsabadi et al., 2013). Moreover, the increasing permeability of CO2 gas with enhanced MWCNT content may be attributed to the CO2 sorption on MWCNTs owing to the affinity between CO2 gas and MWCNTs. It is worth to mention that for the functionalized MWCNTs, the major group of carboxyl group led to greater interaction between the membrane and the CO2 molecules that caused finally an intense the CO2 permeability through the membrane (see Fig. 9).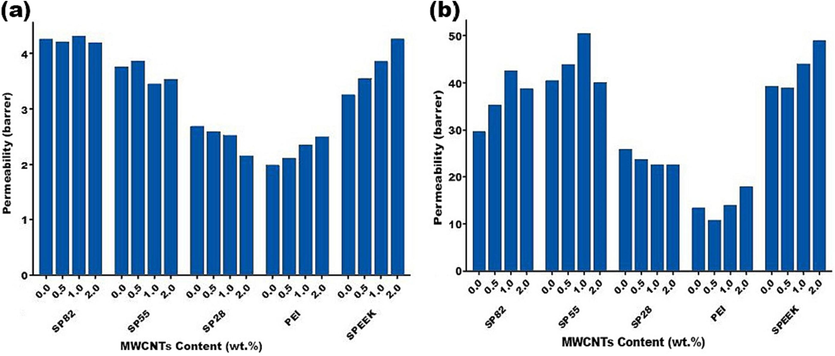
MWCNTs’ effect on (a) CH4 and (b) CO2 permeability in different mixed matrix membranes.
Schematic of interactions the membrane and the gas molecules.
Results also showed that the obtained values for permeability of both CO2 and CH4 gases was improved with the increasing MWCNTs content of the PEI and SPEEK membranes. The presence of MWCNTs in the membrane improved the diffusivity of the gases for two possible reasons: the MWCNTs embedded in the polymers modified the packing of the polymer chain and increased the free volume. On the other hand, nanofillers navigate the spatial distribution of polymeric chains and consequently their orientation in the bulk matrix, leading to enhance free volume (formation of voids at the interface) (Janakiram et al., 2018). In addition, gases are transported quickly inside the nanotubes because of carbon nanotubes’ highly smooth internal surface. So that, enlarged permeability for CO2 and CH4 gases was obtained, as the MWCNTs content increased in the membrane.
Moreover, for the SP55 and SP82 membranes, CO2 permeability of the nanocomposites with 0.5 % and 1 % MWCNT loading was greater than that of membranes with 2 % MWCNT loading. As presented in Fig. 5 (F), some bundles and agglomerates of MWCNT have formed in the PEI/SPEEK membrane, which can reduce the total free volume and increase the tortuosity of the agglomerated MWCNTs resulting in slight deterioration of permeation. The permeability and selectivity of the different MMMs are displayed in Table 5. As observed in Table 5, the selectivity of the membranes prepared in this work was lower than that in similar works. It may be due to the size of mean internal diameter (5–10 nm) of MWCNTs and its structure used as nanofillers, which facilitated the permeation of both CO2 and CH4 molecules gases. The diameter of the pores of nanotubes is much larger than the size of CO2 and CH4 molecules gases; In this way, gases could more easily transfer through the path created inside the nanotubes than the path preasented between the polymer chains. But in the other works mentioned in Table 5, the filler used in the membrane did not have the tube structure, and as observed, the permeability values had lower value than that obtained in this work. Therefore, the created channel by the integration of nanotubes through the membrane increased the diffusion of both CO2 and CH4 molecules gases. As a result, with compare to that reported in related researches, high permeation rates of CO2 and CH4 were achieved, and the selectivity values were consequently decreased.
Polymer
Fillers
Loading (wt.%)
PCO2 (Barrer)
PCO2/CH4 (Barrer)
SPEEK/PEI (50/50)
MWCNTs
1
48
15
Pure gas, 25 °C, 4 bar
This work
Matrimid/F-SPEEK (50/50)
–
–
20
35
Mixed gas, 25 °C,10 bar
(Li et al., 2003)
SPEEK
SO3H-MCM-41
30
21
22.9
Pure gas, 25 °C, 10 bar
(Khan et al., 2012)
SPEEK
MIL-101(Cr)
40
31
37
Pure gas, 30 °C, 1 bar
(Xin et al., 2014)
SPEEK
phosphate salts
10
17
36
Pure gas, 25 °C, 4 bar
(Huang et al., 2001)
3.6.2 Selectivity study
The magnitudes of the selectivity for the prepared membranes are presented in Fig. 10. Compared to the unloaded membrane, incorporation of MWCNT showed a substantial improvement in CO2 permeability and a trivial increase in CO2/CH4 selectivity at high loads. Integration of filler into the membrane, was causing a substantial advantage which is generally due to its polar groups such as OH which leads to form the bonding between the MWCNT and the CO2 molecules. Furthermore, as reported on FTIR results, the presence of the carboxylic group on the surface of MWCNT reasoned more interaction between the filler and CO2 molecules. Therefore, a good interaction between the CO2 molecule and polar groups in MWCNT enlarged the dissolution of CO2 molecules in the polymer chain. As a result, high permeability of CO2 was attained due to superior interaction of CO2 molecules with polar groups in the nano composite membrane, and its low kinetic diameter, too. This observation was reported with our previous works, which showed that the polymer chains displayed more mobility and flexibility at higher nano particles content, leading to increased transportation through membrane separation (Shameli and Ameri, 2017).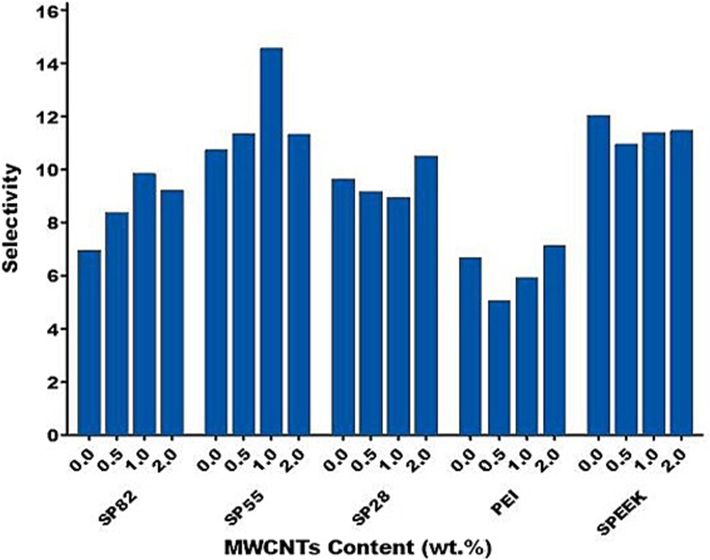
Selectivity in the different mixed matrix membranes.
At last, as resulted in Fig. 10, the selectivity achieved for the SP55M1 membrane were clearly higher in comparison with other prepared membranes, which is mainly due to the interaction between the CO2 molecules and abundant amine, OH, and carboxylic groups in the membrane that had more facilitated sites and elevated the possibility of collisions.
3.6.3 Effect of pressure in permeability
As Fig. 11 shows, the permeability of the CO2 and CH4 gases is increased with supply pressure increment from 2 to 8 bars both in SPEEK and PEI neat membranes and the PEI/SPEEK MWCNTs (Vinoba et al., 2017). The impact of the feed pressure on the gas permeability of the prepared membranes depends on the gas type and the composition of the polymer (see Fig. 11). Light nonpolar gases (such as CH4) permeability remains constant with pressure change. Though regarding condensable gases, their permeability is increased with elevating levels of pressure. This permeability enhancement for gases such as CO2 reported elsewhere (Saini et al., 2021).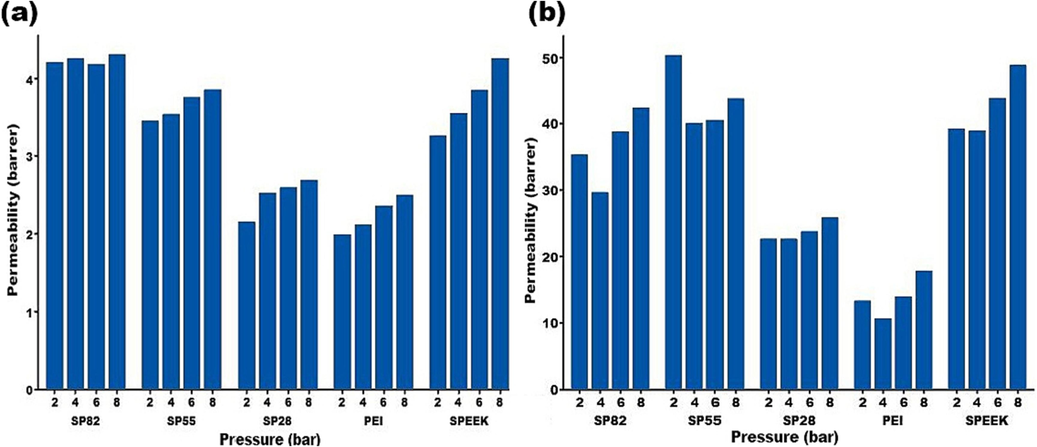
Feed pressure’s effect on (a) CH4 and (b) CO2 permeability in prepared membranes.
3.6.4 Effect of temperature in permeability
An illustration of the effect of operating temperature on gas permeability of the SPEEK and PEI membranes can be found in Fig. 12.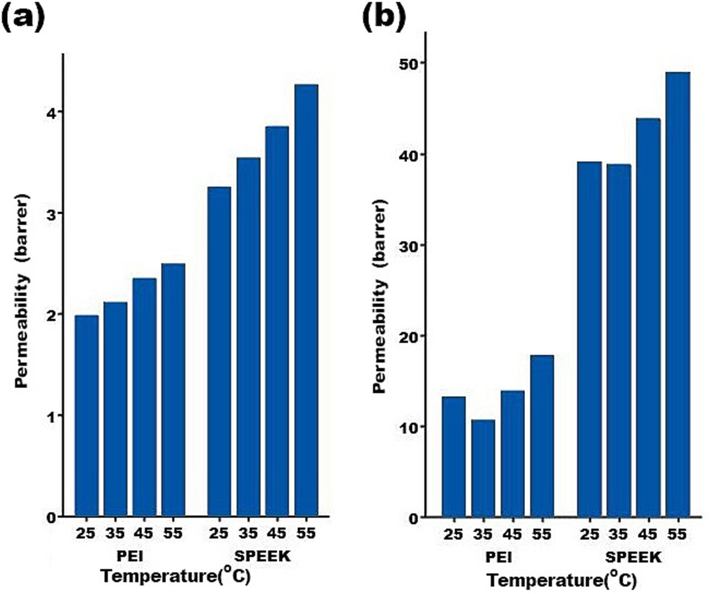
Feed temperature’s effect on (a) CH4 and (b) CO2 permeability in the different mixed matrix membranes.
According to Fig. 12, CH4 and CO2 gases become more permeable as temperature was increased. The gas molecules diffuse through the free volumes in the polymeric membranes. During thermal motions related to the polymer chains in amorphous regions, free volumes are formed randomly. As operating temperature were increased, polymer chains became more flexible, permitting more free volume cavities within the membrane, which facilitated gas diffusion (Khan et al., 2011).
3.7 Robeson upper limit
Robeson upper bound line between selectivity of CO2 /CH4 and CO2 permeability, for PEI, SPEEK, SPEEK / PEI, and SPEEK / PEI-MWCNT membranes are shown in Fig. 13. As shown in Fig. 13, the properties of the studied membrane were closer to or beyond the Robeson upper bound line, indicating the membrane exhibited a more desirable performance for CO2 /CH4 separation. Fig. 13, also shows that the permeability properties of the dense membrane containing MWCNT additives (1 wt%) were nearer to the Robeson upper limit and provided better permeability (Robeson, 2008; Robeson, 1991).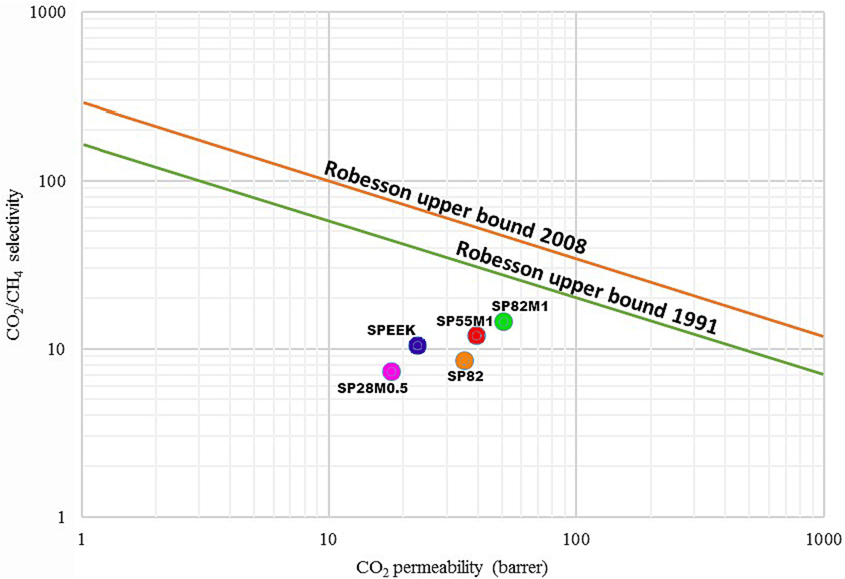
Robeson upper bound line between selectivity of CO2 /CH4 and CO2 permeability.
3.8 Analysis of MD simulation
The mean square displacement (MSD) of CH4 and CO2 levels over time is shown in Fig. 14 for SP55M1 and SP28M0.5 blends. On the basis of Equation (5), the diffusion coefficient can be derived from the slope of the trend line if the data follow a linear trend. In a system with N involving atoms, the displacement of the penetrant from its starting location [ri(t)-ri(0)] can be used to study the dynamic movement outline of penetrant gases in the host polymer. This can be done by comparing the original position of the penetrant to its current position.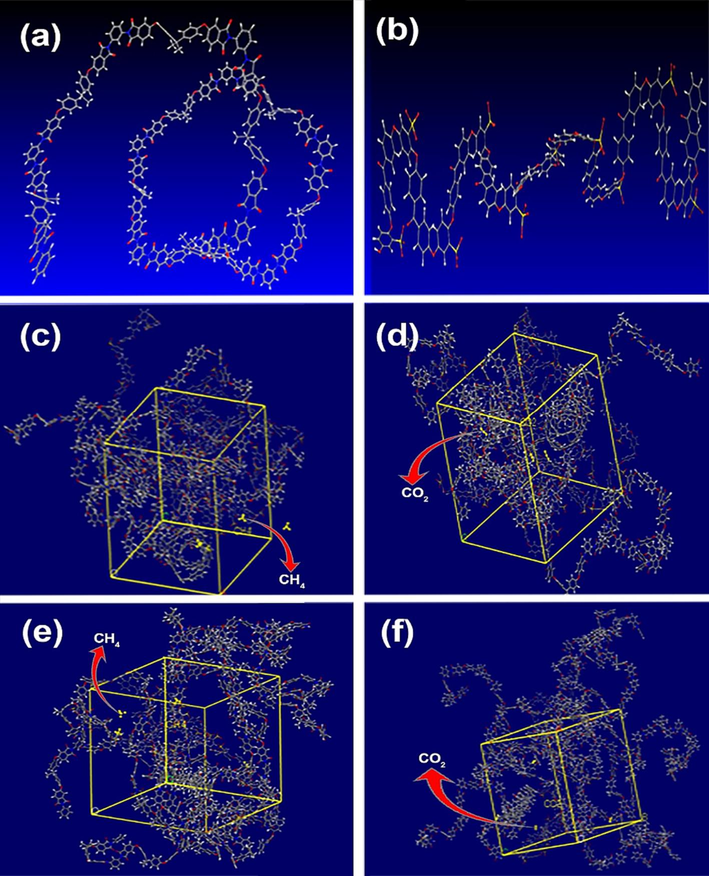
Various stages during molecular dynamics simulation: a) PEI and b) SPEEK chains’ initial configurations constructed from 20 iterating units; the amorphous cells to calculate the diffusion coefficient of c) CH4, d) CO2 over and done with SP55M1; the amorphous cells to calculate the diffusion coefficient of e) CH4,f) CO2 over and done with SP28M0.5.
The graphs of the MSD are indicated in Fig. 15 in terms of time. At that time, the value of the linear coefficient “a”, which is the slope of the fit line, has to be divided by 6 (Equation (6)) in order to get the diffusion coefficient in Å2/ps, and the value that is obtained then needs to be translated to the further intermutually unit of cm2/s.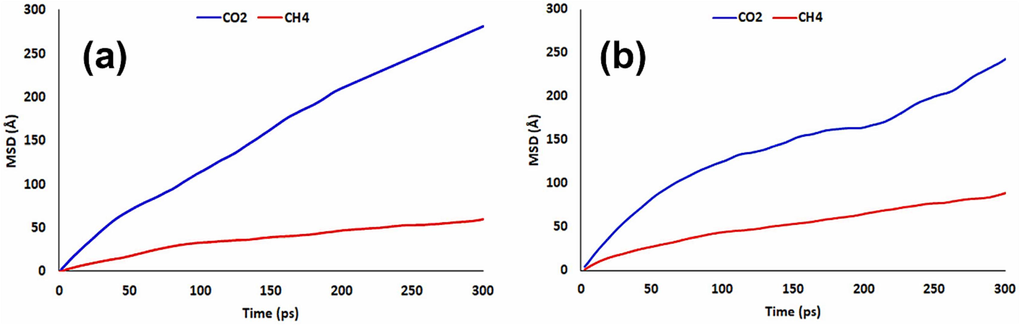
The MSD variation versus time for various gases flowing in the membranes under study: (a) SP55M1 (b) SP28M0.5.
Based on the simulation of MSD results obtained for a time span of 0–300 ps, the least square approach was used to extract and treat the results without discretionary leaving out any data. Considering the correlation coefficients of all plots, the linearity relation of the MSD plots versus simulation time was investigated and confirmed. Thus, the simulation of MSD results was consistent with the requirements related to Einstein's regime. For this reason, they can be applied in Equation (5) to evaluate the suitable diffusion coefficient for the investigated gases, which diffused in polymeric membranes. Table 6 shows the evaluation of diffusion coefficients, and as can be seen, in the case of the side branch of SP55M1, they are in order DCO2 > DCH4, which is similar to the experimental results. The validity of the diffusion coefficients can be confirmed by the agreement between the trend of the simulated results and the trend of experimental values.
Membranes
CO2
CH4
Selectivity (CO2/CH4)
SP55M1
225
93
2.4
SP28M0.5
182
62
2.9
(EXP. SP55M1)
115
57
2.1
(EXP. SP28M0.5)
105
14
7.5
These differences were happened because the diffusion coefficient determined by Einstein's approach is a self-diffusion coefficient. Since the chemical potential difference across the membrane isn't taken into account when evaluating the self-diffusion, the computed diffusion coefficient differs from the experimental values (Everett, 1972). However, the simulated results’ order related to SP55M1 and SP28M0.5 membranes matches the experimental results, especially selectivity (CO2/CH4) of SP55M1 is near to experimental value.
Polymer morphology and gas molecular size influence the gas diffusion rate through polymer membranes. The van der Waals volume and surface area of gases are presented in Table 7 to analyze the effect of molecular size on diffusion coefficients.
Gas
van der Waals volume (Å3)
Surface area (Å2)
Kinetic diameter (Å)
CO2
33.58
52.87
3.30
CH4
28.44
47.94
3.80
Moreover, CO2 has a smaller kinetic diameter compared to CH4, but it also has a lower diffusion coefficient. The affinity between the polymer matrix and CO2 molecules can explain this phenomenon. As a result of partial charge distribution on CO2, the affinity between the polymer matrix and CO2 molecules depends on their interaction. Thus, CO2, with its strong electrostatic attraction by the polymer matrix, will cause an increase in resistance to diffuse through the membrane. Diffusion coefficients for CO2 and CH4 molecules penetrating through the studied membranes are illustrated in Fig. 16. It is evident from Fig. 16 that diffusion coefficient achieved for CO2 molecules was higher than that for CH4 with larger diameter. This is because that these gases possess strong electrostatic interactions with the polymer chains that comprise the membrane. The compact packing of polymer chains would be disturbed by the presence of MWCNTs. Therefore, more cavities would be formed and larger pores would appear between the polymer chains. As a result, gas molecules would be able to diffuse through the membrane over a wider diffusion path (Holewinski et al., 2017; Pavel and Shanks, 2005; Karayiannis et al., 2004).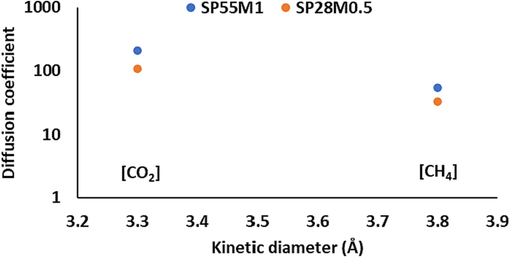
A comparison between the diffusion coefficients of gases into SP55M1 and SP28M0.5 and their kinetic diameters.
4 Conclusions
Membranes were successfully prepared using PEI and/or SPEEK polymers, and modified MWCNT as filler with different content. The gas separation performance of the membranes was investigated at various operating temperatures and feed pressures. Modified MWCNT incorporation into the MMMs resulted in an improvement in the selectivity of CO2 / CH4 at 2 bar and 35 °C, while a further increase in pressure resulted in an increase in the selectivity. The performance of gas separation of the prepared membranes was highly dependent on the penetrating gas molecules properties and the operating pressure and temperature. Regarding the separation of the CO2 /CH4, the dense membrane permeability properties for SP55M1 were nearer to the upper limit of Robeson and demonstrated better permeability. Molecular dynamics simulations showed a good correlation to the permeability values for different compositions. The MD simulation can be applied as an intense tool for evaluation and prediction of gas permeability through pure polymers, blends and its nanocomposites.
Declaration of competing interest
The authors declare that they have no known competing financial interests or personal relationships that could have appeared to influence the work reported in this paper.
References
- Fabrication and characterization of novel polyester thin-film nanocomposite membranes achieved by functionalized sio2 nanoparticles for gas separation. Polym. Eng. Sci.. 2019;59(S1):E237-E247.
- [Google Scholar]
- Gas-separation behavior of poly (ether sulfone)–poly (ethylene glycol) blend membranes. J. Appl. Polym. Sci.. 2018;135(44):46845.
- [Google Scholar]
- Development of the methods for prediction of gas permeation parameters of glassy polymers: Polyimides as alternating co-polymers. J. Membr. Sci.. 2000;167(1):91-106.
- [Google Scholar]
- A new cyano (− cn) free molecular design perspective for constructing carbazole-thiophene based environmental friendly organic solar cells. Phys. B Condens. Matter. 2023;652:414630
- [Google Scholar]
- Preparation and characterization of functionalized mwcnts-cooh with 3-amino-5-phenylpyrazole as an adsorbent and optimization study using central composite design. Carbon Letters. 2019;29(1):1-20.
- [Google Scholar]
- Recent developments in polyetherimide membrane for gas separation. J. Chin. Chem. Soc.. 2019;66(12):1738-1744.
- [Google Scholar]
- Study of nanostructure characterizations and gas separation properties of poly (urethane–urea) s membranes by molecular dynamics simulation. J. Membr. Sci.. 2014;462:28-41.
- [Google Scholar]
- Enhancement of the gas separation properties of polyurethane membranes by alumina nanoparticles. J. Membr. Sci.. 2015;479:11-19.
- [Google Scholar]
- Synthesis and characterization of poly (ether-block-amide) copolymers/multi-walled carbon nanotube nanocomposite membranes for co2/ch4 separation. Korean J. Chem. Eng.. 2017;34(9):2459-2470.
- [Google Scholar]
- Membrane-based technologies for biogas separations. Chem. Soc. Rev.. 2010;39(2):750-768.
- [Google Scholar]
- Hybrid processes for the removal of acid gases from natural gas. J. Membr. Sci.. 1998;140(1):27-49.
- [Google Scholar]
- Morphology and mechanical and electrical properties of oriented pva–vgcf and pva–mwnt composites. Polymer. 2006;47(4):1308-1317.
- [Google Scholar]
- Polypropylene/ethylene—and polar—monomer-based copolymers/montmorillonite nanocomposites: Morphology, mechanical properties, and oxygen permeability. Polymers. 2021;13(5):705.
- [Google Scholar]
- Diffusion of gases in silicone polymers: Molecular dynamics simulations. Macromolecules. 1998;31(16):5529-5535.
- [Google Scholar]
- Influence of inorganic fillers on the structural and transport properties of mixed matrix membranes. J. Appl. Polym. Sci.. 2013;128(6):4058-4066.
- [Google Scholar]
- On o2 gas permeability of pp/pla/clay nanocomposites: A molecular dynamic simulation approach. Polym. Test.. 2015;45:139-151.
- [Google Scholar]
- Manual of symbols and terminology for physicochemical quantities and units, appendix ii: Definitions, terminology and symbols in colloid and surface chemistry. Pure Appl. Chem.. 1972;31(4):577-638.
- [Google Scholar]
- Transport properties of gases in polymers: Experimental methods. Oil & Gas Science and Technology-Revue De L Institut Francais Du Petrole. 2001;56:245-259.
- [Google Scholar]
- Recent advances of inorganic fillers in mixed matrix membrane for gas separation. Sep. Purif. Technol.. 2011;81(3):243-264.
- [Google Scholar]
- Haroon, M., Janjua, M.R.S.A. 2022. “Exploring the effect of end-capped modifications of carbazole-based fullerene-free acceptor molecules for high-performance indoor organic solar cell applications”, Journal of Computational Electronics, Vol. No. 2022, pp. 1-12.
- An interesting behavior and nonlinear optical (nlo) response of hexamolybdate metal cluster: Theoretical insight into electro-optic modulation of hybrid composites. J. Clust. Sci.. 2017;28(5):2693-2708.
- [Google Scholar]
- Detailed-atomistic molecular modeling of small molecule diffusion and solution processes in polymeric membrane materials. Macromol. Theory Simul.. 2000;9(6):293-327.
- [Google Scholar]
- Aminopolymer mobility and support interactions in silica-pei composites for co2 capture applications: A quasielastic neutron scattering study. J. Phys. Chem. B. 2017;121(27):6721-6731.
- [Google Scholar]
- The gas separation performance adjustment of carbon molecular sieve membrane depending on the chain rigidity and free volume characteristic of the polymeric precursor. Carbon. 2019;143:343-351.
- [Google Scholar]
- Sulfonation of poly(ether ether ketone)(peek): Kinetic study and characterization. J. Appl. Polym. Sci.. 2001;82:2651-2660.
- [Google Scholar]
- Transport and separation properties of carbon nanotube-mixed matrix membrane. Sep. Purif. Technol.. 2009;70(1):12-26.
- [Google Scholar]
- Polymer clay nanocomposites for gas separation: A review. Environ. Contam. Rev. 2019;2:01-05.
- [Google Scholar]
- Physicochemical study of poly(ether ether ketone) electrolyte membranes sulfonated with mixtures of fuming sulfuric acid and sulfuric acid for direct methanol fuel cell application. Mater. Sci. Eng. A. 2007;460–461:475-484.
- [Google Scholar]
- Performance of nanocomposite membranes containing 0d to 2d nanofillers for co2 separation: A review. Membranes. 2018;8(2):24.
- [Google Scholar]
- Janjua, M.R.S.A., Jamil, S., Ahmad, H., Khan, S.R. 2020. Cobalt hydroxystannate nanocube fuel additive.
- Janjua, M.R.S.A., Jamil, S., Ahmad, H., Ur-Rehman, S., Khan, S.R. 2021. “Graphene oxide and cobalt tin oxide nanocomposite and method of use”.
- Janjua, M.R.S.A., Jamil, S., Khan, S.R. 2023. “Method for making mesoporous magnesium hydroxide nanoplates, an antibacterial composition, and a method of reducing nitroaromatic compounds”.
- Asymmetric membranes of modified poly (ether ether ketone) with an ultra-thin skin for gas and vapour separations. J. Membr. Sci.. 2006;272(1–2):188-197.
- [Google Scholar]
- Detailed atomistic simulation of the segmental dynamics and barrier properties of amorphous poly(ethylene terephthalate) and poly(ethylene isophthalate) Macromolecules. 2004;37(8):2978-2995.
- [Google Scholar]
- Layer by layer assembly of zinc oxide nanotubes and nanoflowers as catalyst for separate and simultaneous catalytic degradation of dyes and fuel additive. ChemistrySelect. 2019;4(19):5548-5559.
- [Google Scholar]
- Mixed-gas co2/ch4 and co2/n2 separation with sulfonated peek membranes. J. Membr. Sci.. 2011;372(1–2):87-96.
- [Google Scholar]
- Speek and functionalized mesoporous mcm-41 mixed matrix membranes for co 2 separations. J. Mater. Chem.. 2012;22(37):20057-20064.
- [Google Scholar]
- Porous bppo-based membranes modified by aromatic amine for acid recovery. Sep. Purif. Technol.. 2016;157:27-34.
- [Google Scholar]
- Preparation of pyrrolidinium-based anion-exchange membranes for acid recovery via diffusion dialysis. Sep. Sci. Technol.. 2016;51(11):1881-1890.
- [Google Scholar]
- High permeability nano-composite membranes based on mesoporous mcm-41 nanoparticles in a polysulfone matrix. Microporous Mesoporous Mater.. 2008;114(1–3):129-136.
- [Google Scholar]
- Sulfonated poly(ether ether ketone) membranes for direct methanol fuel cell. J. Membr. Sci.. 2003;226(1):159-167.
- [Google Scholar]
- Remarkable improvement in interfacial shear strength of carbon fiber/epoxy composite by large-scare sizing with epoxy sizing agent containing amine-treated mwcnts. Polym. Compos.. 2018;39:2734-2742.
- [Google Scholar]
- Mechanical properties of functionalized single-walled carbon-nanotube/poly (vinyl alcohol) nanocomposites. Adv. Funct. Mater.. 2005;15(6):975-980.
- [Google Scholar]
- Effect of diamine composition on the gas transport properties in 6fda-durene/3, 3′-diaminodiphenyl sulfone copolyimides. J. Membr. Sci.. 2002;202(1–2):165-176.
- [Google Scholar]
- Saxs and nmr analysis for the cast solvent effect on speek membrane properties. J. Phys. Chem. B. 2009;113(30):10072-10076.
- [Google Scholar]
- Dispersion and functionalization of carbon nanotubes for polymer-based nanocomposites: A review. Compos. A Appl. Sci. Manuf.. 2010;41(10):1345-1367.
- [Google Scholar]
- Performance evaluation of a synthesized and characterized pebax1657/peg1000/γ-al2o3 membrane for co2/ch4 separation using response surface methodology. J. Polym. Res.. 2017;24(5):67.
- [Google Scholar]
- Transport of gases and vapors in glassy and rubbery polymers. Materials Science of Membranes for Gas and Vapor Separation. 2006;1:1-2.
- [Google Scholar]
- Gas transport properties of mgo filled poly (1-trimethylsilyl-1-propyne) nanocomposites. Polymer. 2008;49(6):1659-1675.
- [Google Scholar]
- In silico modelling of acceptor materials by end-capped and π-linker modifications for high-performance organic solar cells: Estimated pce> 18%. Comput. Theor. Chem.. 2022;1208:113555
- [Google Scholar]
- Saxs cluster structure and properties of speek/pei composite membranes for dmfc applications. Solid State Ion.. 2010;180(40):1690-1693.
- [Google Scholar]
- Preparation and tribological properties of polyimide/carboxyl-functionalized multi-walled carbon nanotube nanocomposite films under seawater lubrication. Tribol. Lett.. 2015;58(1):1-12.
- [Google Scholar]
- A p-type multi-wall carbon nanotube/te nanorod composite with enhanced thermoelectric performance. RSC Adv.. 2018;8(16):8739-8746.
- [Google Scholar]
- Molecular dynamics simulation of diffusion of o2 and co2 in blends of amorphous poly(ethylene terephthalate) and related polyesters. Polymer. 2005;46(16):6135-6147.
- [Google Scholar]
- Polymeric co2/n2 gas separation membranes for the capture of carbon dioxide from power plant flue gases. J. Membr. Sci.. 2006;279(1–2):1-49.
- [Google Scholar]
- Electric-stimuli-responsive bending actuator based on sulfonated polyetherimide. Sens. Actuators B. 2010;151(1):198-204.
- [Google Scholar]
- Amino-functionalized carbon nanotubes for binding to polymers and biological systems. Chem. Mater.. 2005;17(6):1290-1295.
- [Google Scholar]
- Role of terminal positions of aryl ring towards second-order nonlinearity in arylimido-substituted molybdates: An interesting quantum study of organic-inorganic hybrid composites. Current Physical Chemistry. 2011;1(2):99-105.
- [Google Scholar]
- Vibrational spectroscopic study of pure and silica-doped sulfonated poly(ether ether ketone) membranes. Spectrochim. Acta A Mol. Biomol. Spectrosc.. 2015;138:693-699.
- [Google Scholar]
- A comparison of carbon/nanotube molecular sieve membranes with polymer blend carbon molecular sieve membranes for the gas permeation application. Microporous Mesoporous Mater.. 2008;113(1):499-510.
- [Google Scholar]
- Correlation of separation factor versus permeability for polymeric membranes. J. Membr. Sci.. 1991;62(2):165-185.
- [Google Scholar]
- Highly permeable benzotriptycene-based polymer of intrinsic microporosity. ACS Macro Lett.. 2015;4(9):912-915.
- [Google Scholar]
- Study on the properties of multi-walled carbon nanotubes reinforced poly (vinyl alcohol) composites. J. Polym. Res.. 2018;25(12):249.
- [Google Scholar]
- Conjugate polymer-based membranes for gas separation applications: Current status and future prospects. Mater. Today Chem.. 2021;22:100558
- [Google Scholar]
- Pervaporation characteristics of pdms/pmhs nanocomposite membranes inclusive multi-walled carbon nanotubes for improvement of acetic acid–methanol esterification reaction. Polym. Bull.. 2020;77(5):2591-2609.
- [Google Scholar]
- Temperature dependency of gas barrier properties of biodegradable pp/pla/nanoclay films: Experimental analyses with a molecular dynamics simulation approach. J. Appl. Polym. Sci.. 2018;135(35):46665.
- [Google Scholar]
- Nh2-mil-53 (al) and nh2-mil-101 (al) in sulfur-containing copolyimide mixed matrix membranes for gas separation. Sep. Purif. Technol.. 2013;111:72-81.
- [Google Scholar]
- Synthesis of cross-linked pva membranes embedded with multi-wall carbon nanotubes and their application to esterification of acetic acid with methanol. Chem. Eng. J.. 2017;309:381-396.
- [Google Scholar]
- Role of critical concentration of pei in nmp solutions on gas permeation characteristics of pei gas separation membranes. J. Ind. Eng. Chem.. 2013;19(2):677-685.
- [Google Scholar]
- Simons, K. 2010. “Membrane technologies for co2 capture”, Vol. No. 2010, pp.
- Preparation, characterization, and gas permeation properties of blend membranes of polysulfone and polyethylene glycol inclusive alumina nanoparticles. Int. J. Environ. Sci. Technol.. 2017;14(6):1235-1242.
- [Google Scholar]
- Reduced graphene oxide/metal oxide nanoparticles composite membranes for highly efficient molecular separation. J. Mater. Sci. Technol.. 2018;34(9):1481-1486.
- [Google Scholar]
- Recent progress of fillers in mixed matrix membranes for co2 separation: A review. Sep. Purif. Technol.. 2017;188:431-450.
- [Google Scholar]
- Pebax–peg–mwcnt hybrid membranes with enhanced co2 capture properties. J. Membr. Sci.. 2014;460:62-70.
- [Google Scholar]
- Effect of degree of sulfonation and casting solvent on sulfonated poly(ether ether ketone) membrane for vanadium redox flow battery. J. Power Sources. 2015;285:195-204.
- [Google Scholar]
- Speek/amine-functionalized tio2 submicrospheres mixed matrix membranes for co2 separation. J. Membr. Sci.. 2014;467:23-35.
- [Google Scholar]
- Synthesis and characterization of sulfonated poly(ether ether ketone) for proton exchange membranes. J. Membr. Sci.. 2004;229(1):95-106.
- [Google Scholar]
- Effective enhancement of gas separation performance in mixed matrix membranes using core/shell structured multi-walled carbon nanotube/graphene oxide nanoribbons. Nanotechnology. 2017;28(6):065702
- [Google Scholar]
- Polyetherimide based anion exchange membranes for alkaline fuel cell: Better ion transport properties and stability. Colloids Surf A Physicochem Eng Asp. 2020;588:124348
- [Google Scholar]
- Novel hydrophilic pvdf ultrafiltration membranes based on a zro2–multiwalled carbon nanotube hybrid for oil/water separation. J. Mater. Sci.. 2016;51(19):8965-8976.
- [Google Scholar]
- Dehydration of natural gas using polyether sulfone (pes) membrane and its nanocomposite with silica particles and nitrogen sweeping gas. Chemical Methodologies. 2021;5(4):308-316.
- [Google Scholar]
- Mixed matrix membrane of nano-zeolite nax/poly (ether-block-amide) for gas separation applications. J. Membr. Sci.. 2016;510:270-283.
- [Google Scholar]
- Mixed-matrix membranes composed of matrimid® and mesoporous zsm-5 nanoparticles. J. Membr. Sci.. 2008;325(1):28-39.
- [Google Scholar]
- Preparation and characterization of carbon and carbon/zeolite membranes from odpa–oda type polyetherimide. J. Membr. Sci.. 2015;474:114-121.
- [Google Scholar]


