

Translate this page into:
Effect of low blockage ratio obstacle on explosion characteristic in methane/air mixture
⁎Corresponding author. gaoke@lntu.edu.cn (Ke Gao)
-
Received: ,
Accepted: ,
This article was originally published by Elsevier and was migrated to Scientific Scholar after the change of Publisher.
Abstract
Methane/air explosion is one of the common hazards in process and mining industries. In this study, the methane explosion propagation is studied, and two-dimensional configuration is considered. The gas phase equations are solved using an OpenFOAM code for compressible reacting flow, EXiFOAM. The effects of the low blockage ratio (LBR) obstacles are investigated. The results show that the flame propagation speed, flame structure, shock wave propagation, and gas flow are considerably affected by LBR obstacles. Specifically, the flame propagation speed first increases and then decreases. As the initial pressure increases, the flame propagation speed gradually increases. The maximum speed is up to 500 m/s, when the initial pressure is 1.5 MPa. If the flame propagation is prevented, resulting in the flame deformation. Moreover, the flame disruptive phenomenon is captured due to the reflected waves. In front of the obstacle, the cellular structures of the high-pressure distribution are formed. Note that the tiny cellular structures are produced in the wake of the leading shock. Furthermore, a high-speed flow region and two low-speed flow regions are produced around the LBR obstacles. It is found that as the initial pressure increases, the explosion pressure is larger, while the temperature change is not obvious. These research findings have implications for enhancing safety production in coal mines.
Keywords
Low blockage ratio obstacle
Gas explosion
Flame propagation
Pressure gradient distribution
Gas flow speed

1 Introduction
Methane, a naturally occurring, highly flammable, and explosive gas found in coal seams, presents considerable hazards when released during mining activities. A methane/air explosion is one of the major types of accidents in coal mines, as discussed in the literature (Wang et al., 2022). These accidents may result in disastrous consequences, including considerable casualties, substantial economic losses, and negative societal impacts Yu et al., 2024. Methane control has become the primary concern in underground coal mines (Yang et al., 2023). Scholars have conducted significant research on gas explosions in coal mines, as discussed below.
For the effects of the coal particles, methane mass fraction, roadway structure, Li et al. (Li et al., 2023) studied the autoignition of methane/coal particle/air mixtures under constant-volume conditions. They found that small particles can promote the gas ignition. Furthermore, shorter ignition delay times occur with smaller particle diameters and lower concentrations. Recently, Shi et al. (Shi et al., 2023) investigated the methane/coal detonation, and found that the average leading shock speed decreases with higher particle concentration and smaller particle size. Additionally, this study demonstrated that intricate interactions between gas and burning particles led to highly unsteady detonation phenomena, including extinction and re-initiation Wu et al., 2023. Azam et al. (Mishra and Azam 2018, Azam and Mishra 2019) emphasized the impact of particle concentration and size on explosion outcomes. In their work, they found a direct correlation between the particle diameter and the quantity of inhibitive materials required to mitigate hybrid explosions. Sun et al. (Sun et al., 2020) revealed that the methane mass fraction significantly impacts gas explosion characteristics. In particular, the methane mass fraction influences the peak pressure, pressure rise time, and pressure oscillation during the explosion. Additionally, the methane mass fraction affects the internal flame propagation distance and the generation of acoustic change in the chamber. Bai et al. (Bai et al., 2020) found that the methane mass fraction impacts explosion parameters such as the maximum explosion pressure ( ), explosion duration time ( ), the maximum rate of pressure rise ( ), and the deflagration index (KG). Zhou et al. (Zhou et al., 2021) pointed out that the higher methane mass fraction leads to faster flame propagation and higher flame velocities. Furthermore, the methane mass fraction can shift these flammability limits, increasing the potential for ignition and explosion. Liu et al. (Liu et al., 2021) investigated the impact of the roadway section shapes on the propagation of gas explosion. Their results demonstrate that the overpressure peak tends to be stable and attenuates after the shock wave propagates 40 m. It indicates that the shape of the roadway influences the stability and propagation characteristics of the gas explosion. Zhang et al. (Zhang et al., 2013) studied the effects of branch roadway on explosion propagation, and the corresponding experiments were performed in five different roadway structures. It turns out that the branch roadways could increase the maximum overpressure, rate of overpressure rise, and KG. This is because the turbulence is induced by the branch roadways. Moreover, the overpressure rise rate and KG increase as a function of the number of branch roadways. Specifically, the maximum flame speed dropped when the number of branch roadways exceeded 3.
It is well known that the obstacles can promote the interaction of flame and pressure waves, increasing the gas explosion risk (Oh et al., 2001). An increase in the obstacle number distorts the flame front and increases the overpressure. However, when the number reaches its limit, the overpressure no longer follows this rule (Hall et al., 2009, Na'inna et al., 2013, Lv et al., 2016). Gubba et al. (Gubba et al., 2008) conducted experimental research to examine the influence of obstacle spacing on gas explosions. The study suggests that delayed combustion of unburned mixed gases between obstacles can lead to a robust jet flow, thereby accelerating the flame's speed Tang et al., 2024. Nonetheless, if the spacing between obstacles is excessively small, the flame speed may become too rapid, posing a potential risk of subsequent explosions. Squares, rectangles, triangles, and circles have been extensively researched. Findings suggest that obstacles with sharp edges, such as squares and rectangles, produce higher overpressure compared to obstacles with circular edges, like cylinders. This phenomenon arises because obstacles with sharp edges can generate a larger flame surface area, leading to an elevated combustion rate. Simultaneously, a higher combustion rate induces a faster flame propagation speed and intense flame turbulence, consequently producing a larger explosion pressure. Furthermore, longer obstacles also contribute to increased overpressure (Masri et al., 2000, 2001, Park et al., 2007, 2008). It's important to note that the blockage ratio (BR) of obstacles in a given space plays a crucial role in gas explosions. The BR serves as a vital parameter during the flame acceleration process. Scholars have suggested that augmenting the BR can intensify the stimulating effect of obstacles on both flame and shock waves (Phylaktou and Andrews 1991, Masri et al., 2006, Wan et al., 2018). Modifications to the blockage ratio (BR) exert a significant impact on the evolution of flame areas and the corresponding acceleration of flame tips. (Goodwin et al., 2016). Johansen and Ciccarelli (Johansen and Ciccarelli, 2009) captured flame surfaces and unburned gas flows employing a novel Schlieren-based photographic technique under blockage ratios (BRs) of 0.33, 0.5, and 0.67.
For the effects of the blockage ratios, the previous research results almost exclusively focus on cases with a large blockage ratio. However, the researches on the low blockage ratio obstacles (LBR) are limited. In coal mines, the support systems are commonly used for protection to mitigate and reduce the movement of surrounding rock. Meanwhile, these support systems can prevent the excessive narrowing of roadway cross-sections and avert the collapse of already loosened and damaged surrounding rock. During a gas explosion in the roadway, these support systems act as obstacles. Despite their small volumes and resulting small blockage ratios, the sheer number of these supports forms a substantial group of obstacles significantly influencing the gas explosion process. These obstacles can alter the propagation path of explosion pressure waves, leading to complex wave reflections and refractions that change the overall pressure distribution. They also affect the intensity and distribution of shock waves, potentially increasing local pressure and enhancing the destructive force in certain areas. Furthermore, obstacles influence the flame propagation speed and shape, with multiple small obstacles potentially accelerating the flame and creating more dangerous explosion conditions. The generation and development of turbulence are also affected by obstacles, which can enhance the reaction rate of hybrid gas and intensify the explosion. Accordingly, it is necessary to study the impact of supports on the gas explosion. In addition, the initial pressure significantly impacts the intensity of explosions, flame propagation speed, explosion dynamics characteristics, and turbulence intensity. Consequently, it is crucial to study the effects of initial pressure on gas explosions under the LBR condition. The rest of the paper is structured as follows: the physical and mathematical models are introduced in Sections 2 and 3, respectively. Section 4 presents the simulation results with a detailed discussion, followed by the conclusions in Section 5.
2 Mathematical model
2.1 Governing equation
The physics behind the gas explosion are governed by the conservation laws of mass, momentum, energy and species, respectively (Hajialigol and Mazaheri 2020). The equations read:
In the realm of coal safety, practical considerations require affordable simulation costs. However, the detailed modeling of turbulence and combustion properties encounters challenges owing to its vast volume and extended time. Therefore, it is customary to use RANS (Reynolds-averaged Navier-Stokes) turbulence treatment and simplified combustion modeling. These approaches require affordable simulation resources and the ability to provide sufficiently accurate results in the studied conditions. For the turbulence model, the viscosity of turbulence and eddy viscosity are used to close the momentum equation. The SST k-ω model is adopted in this work (Menter 1994).
The thermophysical and transport properties are calculated using the open-source software Cantera (Franzelli et al., 2010). It simultaneously invokes the GRI-Mech 3.0 library for chemical calculations. In the combustion model, the progress variable (c) is used to define the premixed flame, indicating the reaction progress toward the unburned gas. Under the assumption of simple one-step chemistry with the unity Lewis number and adiabatic conditions, the species transport equations can be reduced to a single combustion progress variable equation. Under the assumption of simple one-step chemistry with the unity Lewis number and adiabatic conditions, the species transport equations can be reduced to a single combustion progress variable equation. The complement of the progress variable, the regress variable, models the flame front propagation and is calculated as follows:
All convective fluxes are determined using the HLLC (Harten–Lax–van Leer contact) (Toro 2019), with multidimensional slope limiters (“cellMDLimited”) (Ettner et al., 2014). This scheme is very suitable for the simulation of compressible flow with the high Mach number. It leads to much better shock capturing than the standard schemes used in most pressure-based codes like the PISO scheme (Issa 1986). The HLLC solver, which is one of the most popular and versatile Riemann solvers (Fleischmann et al., 2020). Toro et al. (Toro et al., 1994) define the HLLC flux as.
2.2 Numerical method and solver validation
The gas phase equations are solved using an OpenFOAM code, EXiFOAM, self-developed based on compressible premixed/partially-premixed combustion solver XiFoam in OpenFOAM 9.0. The first-order implicit scheme is applied as the time scheme. The Courant-Friedrichs-Lewy criterion is considered, and the time step is 1
10-7 s. Here, we further validate the solver (EXiFOAM) against the results presented in the literature (Jiang et al., 2017). In this study, four grid sizes are used, namely 0.005 m, 0.01 m, and 0.015 m, respectively. Fig. 1 shows that the comparison of the maximum overpressure. The results show that the overpressure value deviates significantly from that of experience for the large grid, e.g., 0.015 m. However, when the grids are 0.005 m and 0.01 m, the results closely match the experimental values. This is because of the piecewise nature of the selected distribution function in the discretization-solving process, resulting in only a limited number of grid points being engaged in the equation discretization process for large grid. This implies that the variables within a grid cell can influence the distribution of variables only in its immediate neighboring area. As the grid cell spacing decreases, the variation between variables in adjacent grid cells diminishes. Consequently, within an acceptable range, augmenting the number of grids enhances numerical simulation accuracy. Additionally, the results for 0.005 m and 0.01 m grids exhibit substantial similarity, suggesting a low sensitivity to refining the grid by a factor of two. Therefore, the 0.01 m grid is selected for the subsequent numerical simulation.
Comparison of the maximum overpressures between numerical calculation and experimental data.
3 Physical model and numerical implementation
The primary focus of the study is to examine the impact of the roadway support structure on gas explosions in coal mine roadways. The size of the calculation domain is designed as a square (0.1 m × 0.1 m). The roadway is about 50 m with a cross-section measuring 2.7 m × 2.7 m, see Fig. 2(a). Utilizing the symmetry of the structure, a quarter-size model is employed, and the cross-section is reduced to 1.35 m × 1.35 m, as depicted in Fig. 2(b). The roadway support structures are positioned within the range of 6 to 25 m at 1 m intervals. A monitoring point is established along the center of the model every 1 m, resulting in a total of 49 monitoring points. The ignition position is located at the left end center, and the diameter is 0.5 m. The flame propagates towards the model end along the free part of the model.
Schematic diagrams of (a) actual working conditions; (b) two-dimensional numerical simulation model. Monitor size and distance are not to scale.
Non-slip and adiabatic boundary conditions are adopted at the model walls and roadway support structure. The courant number is 0.1. The reaction of methane/air mixture is considered using a single-step global kinetics, and the methane/air mixture is an equivalent ratio of 1 (ϕ = 1). The initial temperature (T0) is 300 K. Moreover, the range of initial pressure (p0) is from 0.1 MPa to 1.5 MPa. The blockage ratio (BR) for the roadway support structure within the cross-section is defined as , where “a” and “l” are the length of the roadway support structure and cross-section, respectively, labeled in Fig. 2(b). In this study, the specific value of BR is 0.07, and it is considered small (Goodwin et al., 2016). Consequently, the roadway support structure is referred to as an LBR obstacle. It's important to note that a group of LBR obstacles is formed by multiple roadway support structures.
4 Discussion
4.1 Flame propagation characteristic
4.1.1 Flame speed
Fig. 3 shows that the flame front speed under different initial pressures. Specifically, Fig. 3(a) represents that the flame front speed when the initial pressure is 0.1 MPa. The flame front speed exhibits an initial increase followed by a decrease. Three stages are identified from the flame propagation in Fig. 3(a) speed profile in Fig. 3(a). Specifically, in Stage I (x < 6 m), the flame front has not yet reached the obstacle, and the flame propagation speed is lower than 200 m/s. In Stage I, the flame propagation distance is only ten percent of the overall model length. However, the consumed time accounts for 26 % of the total duration. It indicates that the flame propagation speed is very slow, and the flame acceleration is relatively small. This is because the disturbances within the flow field are minimal in the initial stage. Additionally, the flame propagation is determined by heat conduction and thermal diffusion. Moreover, the difference in pressures is not significant in this stage.
Flame front speed under different initial pressure. ϕ = 1, T0 = 300 K, p0 = 0.1–––1.5 MPa.
In Stage II (6 m x 27 m), see Fig. 3(a), when the flame front meets the LBR obstacles, the flame front speed is starting to oscillate. Moreover, the flame front speed demonstrates periodic changes under the influence of LBR obstacles. In particular, the flame front speed consistently increases, reaches a peak, and then decreases within each cycle. When the flame front encounters the low blockage ratio obstacle, the propagation path narrows, causing the fluid velocity to increase according to the Bernoulli effect, which in turn increases the flame propagation speed. Conversely, after passing the low blockage ratio obstacles, the propagation path widens, reducing the fluid velocity and subsequently decreasing the flame propagation speed. Compared to Stage I, the overall trend of the flame propagation speed shows an accelerating phenomenon. The presence of LBR obstacles induces disturbances in the gas flow, leading to the formation of turbulence. It indicates that the flame front speed significantly increases due to changes in the flame passage area and the increase in local turbulent kinetic energy. In fact, the influence of LBR obstacles on flame acceleration primarily includes turbulence, local fuel concentration increase, vortex, and gas compression, respectively. Therefore, the flame speed reaches its maximum after passing through all obstacles (x 27 m) in Fig. 3(a).
In Stage III (27 m x 50 m), when the flame completely leaves the group of LBR obstacles, the flame propagation speed may decrease. It is worth noting that the flame front speed drops rapidly (x 40 m), and the speed is only 50 m/s. This is because the propagation speed of the leading shock front is faster. When the flame propagates to the back position of the model, the shock wave reflected from the end collides with the flame, causing the flame to retreat and significantly reducing the flame speed. Additionally, the flame speed gradually increases with an increase in different pressures (see Fig. 3b), and the speed curve distribution is similar. Furthermore, the maximum flame front speed occurs at = 1.5 MPa, reaching a maximum speed of 500 m/s. This is because the relative density of the gas increases with the increase in initial pressure, according to the ideal gas state equation, . It results in an increased concentration of methane and oxygen within a unit volume. Moreover, under high-pressure environments, the gas flow speed increases, allowing more oxygen to be transported to the vicinity of the flame, promoting combustion, and increasing flame propagation speed.
4.1.2 Flame structure
The fundamental characteristics of premixed flames are centered on substantial morphological and structural changes that take place during the flame propagation process. The intricate structure of the flame represents the fundamental dynamics of flame propagation. In the early stage of flame development, the smooth flames become wrinkled at 20 ms, see Fig. 4. This phenomenon is a result of thermal diffusion during the flame propagation process. Moreover, the surface area of the flame front gradually increases under the influence of thermal diffusion. When the flame speed is sufficiently low, the outward expansion of the burned area takes place at a slow pace. The impact of buoyancy induces the flame to curve from the center towards the rear, a phenomenon dictated by the hydrodynamic instability of the flame (Radulescu et al., 2007). Before the flame front arrives around obstacles (x < 6 m), the flame shape undergoes a transition from a spherical flame to a tulip-like flame (Xiao et al., 2015), as depicted in Fig. 4. It's worth noting that before 75 ms, the upper and lower parts of the flame display a symmetrical structure. However, at 80 ms, the flame propagates notably faster on the lower side, resulting in a distinct asymmetry between the upper and lower segments of the flame. This is because the reflected waves and vortices caused by the LBR lead the upper flame to retreat.
Flame shape development within 80 ms. ϕ = 1, T0 = 300 K, p0 = 0.1 MPa.
Following the passage of the flame front beyond the initial obstacle, the gas flow generates a recirculation zone near the obstacle, impeding the spread of the flame, as illustrated in Fig. 5. Simultaneously, the variations in reaction rates between the upper and lower parts of the flame front lead to a gradual deformation of the flame. Until 88 ms, the flame front completely circumvented the first obstacle. The limited impact of LBR obstacles results in minimal influence on the flame on the lower side. Consequently, the lower section of the flame advances more rapidly, leading to a more comprehensive flame development. In turn, generates a substantial volume of hot air on the lower side, which has a tendency to ascend. As the hot air rises, it triggers the movement of surrounding air, establishing a flow around the flame. After experiencing the obstacle effect, the flame on the lower side gradually rises. Moreover, as the flame traverses the roadway support structures, the reflection and diffraction effects of obstacles give rise to the existence of local unburned gas pockets, as illustrated in Fig. 5 at 94 ms. The temperature of the combustion products behind the flame front is affected by both the disturbance of local airflow and the re-ignition of unburned gas pockets. This results in an uneven temperature distribution in the combustion products.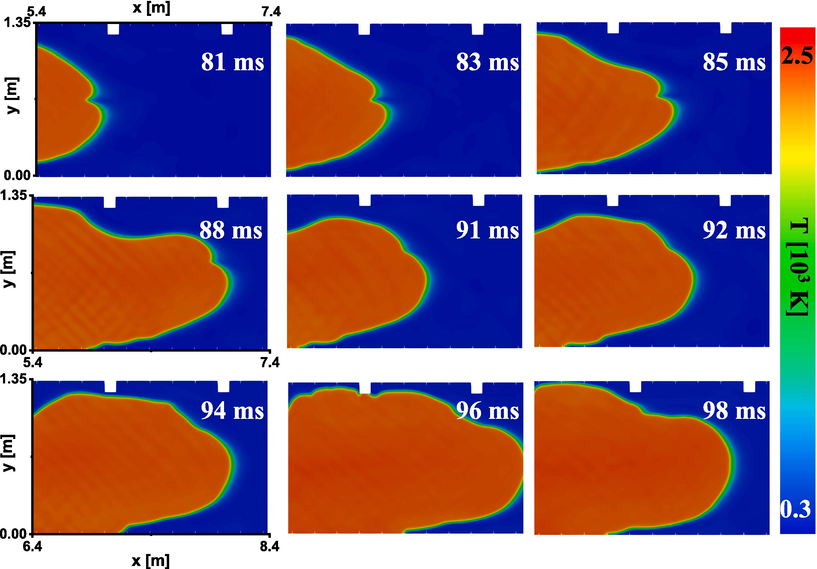
Flame shape development from 81 ms to 98 ms. ϕ = 1, T0 = 300 K, p0 = 0.1 MPa.
This could elevate the likelihood of secondary explosions, consequently increasing the explosion risk. Subsequently, the flame continues to propagate forward, and by 91 ms, the upper part of the flame gradually approaches the obstacles. Until 96 ms, the upper part of the flame collides with the obstacle, leading to flame wrinkles. Meanwhile, the surface area of the flame front increases, promoting flame development.
Fig. 6 illustrates that, at 153 ms, the upper flame front accelerates faster than the lower flame due to the influence of the LBR obstacle group. The flame successfully passes through the obstacle by 154 ms. However, the acceleration loss on the upper side results in the gradual development of the lower part of the flame, leading to the formation of a symmetrical flame again at 190 ms. With the development of the cellular instability the flame surface grows and the flow generated due to the expansion of the combustion products accelerates. Moreover, the thermal expansion of the combustion products produces movement in the unburned gas. The flow interaction with the confinement causes an increase of the flame surface on the lower side. This results in the moderate increase of the flow velocity and flame speed. Eventually, a local high temperature area is formed, and the flame on the lower side spreads faster. A symmetrical flame was re-formed. It is crucial to observe that, at this juncture, prominent wrinkles emerge at the front of the flame. From 203 ms to 225 ms, the flame undergoes a linear retreat. Furthermore, at 225 ms, the flame wrinkles become more pronounced due to the faster speed of the leading shock wave, leading to a collision with the reflected wave and causing a disruptive phenomenon, ultimately resulting in the retreat of the flame.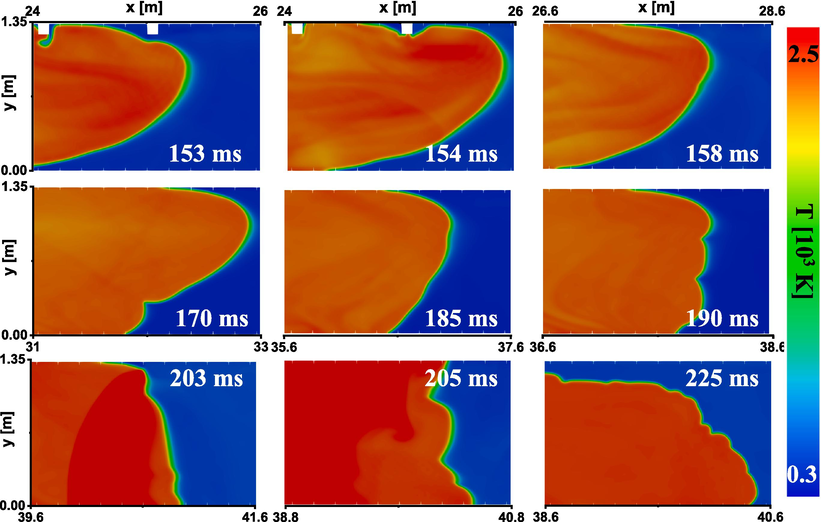
Flame shape development from 153 ms to 225 ms. ϕ = 1, T0 = 300 K, p0 = 0.1 MPa.
4.2 Shock wave propagation
Figs. 7 and 8 depict the pressure gradient cloud under an initial pressure of 0.1 MPa. Before the leading shock front arrives at the first obstacle, a distribution of cellular structure with a substantial pressure gradient is established behind the leading shock front from 6 ms to 12 ms, marked by the white dotted line in Fig. 7 at 6 ms. At the initial time (t = 0.42 ms), the spherical flame aligns with a typical semicircular pressure gradient distribution. As the leading shock front advances, a prominent pressure gradient of the arc distribution emerges in the reverse region of the leading shock front, illustrated by the blue dotted line at 2 ms. Gradually, the initially arc-shaped structure undergoes stretching and transforms into a larger cellular structure by 4 ms. Although the resulting cellular structure resembles the cells observed in one-dimensional detonation, it's important to note that the underlying mechanisms differ significantly. In this study, the flame front and the leading shock front have not remained consistently coupled throughout the entire process. Generally, the observed scenario can be classified as an explosion rather than a detonation. The pressure distribution of the cellular structure in the context of premixed gas explosions has not been documented previously. Notably, the cellular structures exhibit remarkable regularity before the 12 ms mark. Once the leading shock front encounters an obstacle, an emission phenomenon occurs, resulting in the generation of local high pressure. At 14 ms, two reflected waves (R1 and R2, as illustrated in Fig. 7) are formed in opposite directions. Specifically, R1 propagates opposite to the shock wave, while R2 travels in the same direction as the shock wave. As the forward-propagating shock wave (R2) bypasses the obstacle, it overlaps with the original leading shock wave, increasing the pressure and density in the local area. As shown in Fig. 7, with the gradual expansion of R1, the reflected wave R1 collides multiple times with the initial shock wave, leading to an increase in energy, forming a stronger shock wave, and consequently creating a high-temperature and high-pressure region. Additionally, Fig. 4 shows that the flame propagation will be hindered by R1 at 80 ms, resulting in slower flame propagation on the upper side.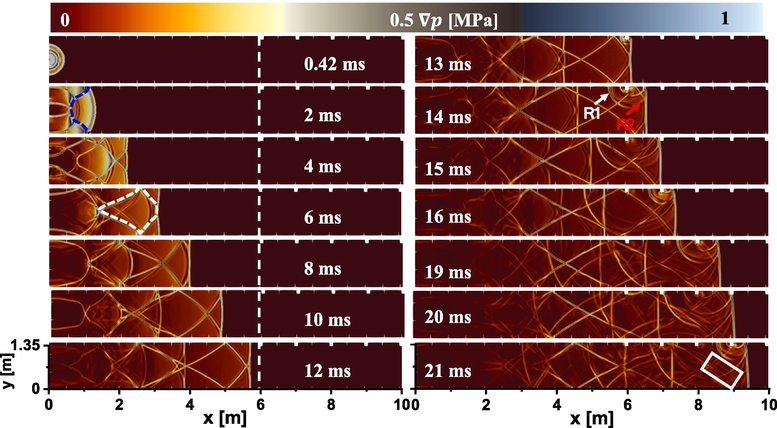
Pressure gradient distribution within 21 ms. ϕ = 1, T0 = 300 K, p0 = 0.1 MPa. Blue dotted line: arc pressure gradient distribution; white dotted line: cellular structure; R1: Reflected wave 1; R2: Reflected wave 2; white box: cellular structure group.
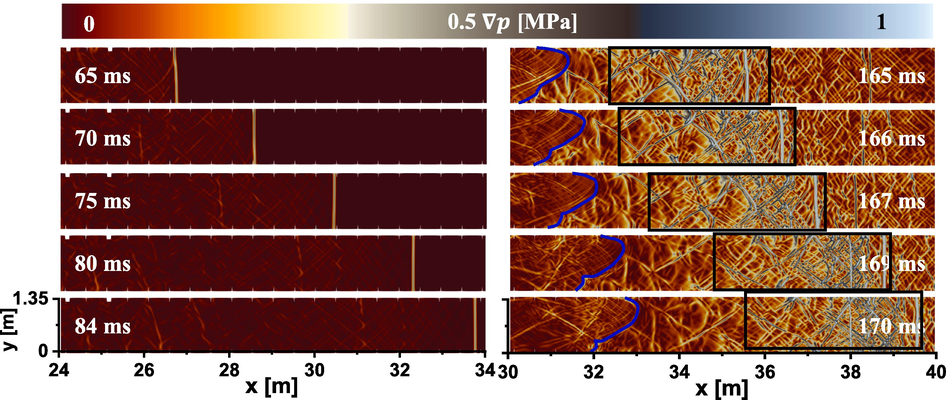
Pressure gradient distribution from 65 ms to 170 ms. ϕ = 1, T0 = 300 K, p0 = 0.1 MPa. Black box: local high-pressure regions. Blue line: flame front.
Furthermore, when passing through a group of LBR obstacles, two distinct phenomena take place. Firstly, the cellular structure is disrupted by the reflected wave R1, leading to an irregular distribution of the pressure gradient, such as 16 ms and 19 ms in Fig. 7. Meanwhile, the reflected wave R2 overlays behind the leading shock front, giving rise to the creation of smaller cellular structures in the wake of the leading shock front, as depicted in Fig. 7 from 15 ms to 21 ms, see white box in 21 ms. In particular, a group of cellular structures emerges, characterized by smaller sizes and a more regular distribution. Fig. 8 illustrates the extent of the group cellular structures when the leading shock front fully traverses the obstacles from 65 ms to 84 ms. This suggests that the shock waves are intensified by the presence of a group of LBR obstacles. Notably, during the time interval 165 ≤ t ≤ 170 ms, the flame front (see blue line in Fig. 8) encounters the shock wave reflected from the right wall, resulting in the creation of local high-pressure regions, as indicated by the black boxes, see Fig. 8.
We have also quantified the different temperatures and pressures at various monitoring points, as depicted in Fig. 9. Notably, the temperature readings across different initial pressures exhibited a remarkable similarity. However, a discernible contrast emerged in the pressure data. Specifically, as the initial pressure increases, a corresponding gradual increase in pressure is observed at each monitoring point. This observation underscores the influential role of initial pressure in dictating pressure variations throughout the system. Its heightened sensitivity to initial pressure is of paramount importance, as it directly correlates with the potential hazards associated with explosion incidents. As is widely acknowledged, the destructive impact of shockwaves stands out as a predominant threat in such scenarios. Therefore, the data from our monitoring points strongly suggests a proportional relationship between the magnitude of initial pressure and the inherent risk level of an explosion incident. In essence, the greater the initial pressure, the more severe the potential consequences of an explosion event. This insight emphasizes the critical need for understanding and managing initial pressure conditions to effectively mitigate the risks associated with explosive events.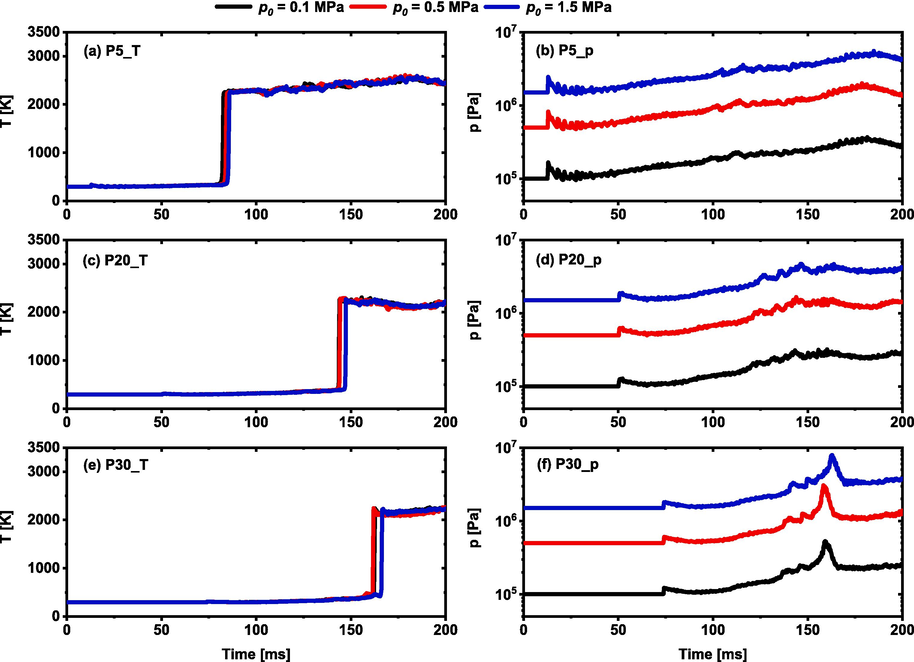
Profiles of pressure and temperature for each monitoring point under different initial pressure. ϕ = 1, T0 = 300 K, p0 = 0.1–––1.5 MPa.
4.3 Gas flow speed
Fig. 10 illustrates the impact of the obstacles on the gas flow. It is evident that the gas flow attains its maximum speed at the leading shock front before reaching the obstacles. Notably, when the gas flow passes through the obstacle at 14 ms and 16 ms, a high-speed flow region manifests in front of the obstacles. The highest flow speed reaches up to 160 m/s, as observed in the enlarged figures at 14 ms and 16 ms. The acceleration is attributed to the hindrance of the gas flow on the left side of the obstacles as it traverses over them. A local high-speed area (GA) forms through a series of reflections and refractions, leading to higher pressure on the left side of the obstacle compared to the right side. Consequently, the gas flow accelerates through the narrow channel. Additionally, vortices are generated due to the fluid dynamics effects as the gas flow passes over the obstacle. Subsequently, the additional power generated by these vortices enhances the acceleration of the gas flow. Furthermore, low-speed flow regions (LA1 and LA2) form on both sides of the obstacles, as observed in Fig. 10 at 14 ms and 16 ms. Despite their proximity to the high-speed area, the gas flow is only at a speed of 40 m/s. Note that LA1, LA2, and GA are labeled in the enlarged figure at 16 ms. This is attributed to the back-pressure effect, which slows down the gas flow once it bypasses the obstacles and is influenced by the surrounding gas flow.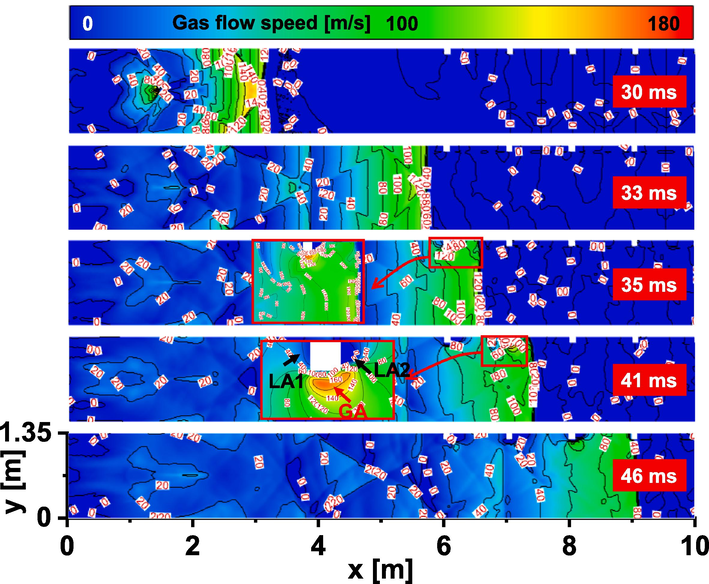
Gas flow speed around the obstacles. ϕ = 1, T0 = 300 K, p0 = 0.1 MPa. LA1: low-pressure area 1; LA2: low-pressure area 2; GA: high-pressure area.
5 Conclusion
Methane explosion dynamics under the influence of LBR obstacles are computationally studied. The two-dimensional configuration and stoichiometric methane/air mixture are considered. The dynamic process of flame propagation speed, flame structure, pressure gradient distribution, and gas flow are investigated. The main conclusions drawn from this article are as follows:
The dependence of flame propagation speed on propagation distance can be divided into Stages I, II, and III. Specifically, in Stage I, the flame propagation speed is low due to heat conduction and thermal diffusion. Moreover, the difference in pressures is not significant in this stage. In Stage II, the flame front speed exhibits periodicity under the influence of LBR obstacles. In particular, the flame front speed consistently increases, reaches a peak, and then decreases within each cycle. Finally, in Stage III, when the flame ultimately leaves the group of LBR obstacles, the flame propagation speed may decrease. Furthermore, the flame speed gradually increases with an increase in different pressures.
Before the flame front arrives around obstacles, the flame shape transitions from a spherical flame to a tulip-like flame. After the flame front passes the initial obstacle, gas flow creates a recirculation zone near the obstacle, preventing flame spread. Moreover, the wrinkles of the flame increase under the influence of the LBR obstacles. The reflected waves make the flame disruptive, and ultimately resulting in the retreat of the flame.
Distribution of cellular structure with a substantial pressure gradient is established behind the leading shock front. Under the influence of the LBR obstacles, the large cellular structure is replaced by a group of tiny cellular structures. Moreover, far away from the LBR obstacles, the range of a group of cellular structures is expanded, characterized by smaller sizes and a more regular distribution. Further, the greater the initial pressure, the greater the overpressure generated during gas explosions.
The LBR obstacles have significant effects on the gas flow. When the gas flow passes through the LBR obstacles, a high-speed flow region manifests in front of the obstacles, and the highest speed is about 160 m/s. Moreover, two low-speed flow regions (LA1 and LA2) form on both sides of the obstacles, and the gas flow is only at a speed of 40 m/s. This study demonstrates that low blockage ratio (LBR) obstacles significantly affect methane/air explosion dynamics, influencing flame speed, structure, and shock wave propagation. These effects highlight the critical role of LBR obstacles in altering explosion behavior. The findings provide practical insights for enhancing safety measures and optimizing support system design in underground coal mines, thereby contributing to safer mining operations. It is recommended to further investigate the impact of obstacles with different geometrical shapes and blockage ratio gradients on explosion propagation to enhance safety measures in coal mine.
CRediT authorship contribution statement
Shengnan Li: Writing – review & editing, Writing – original draft, Data curation. Ke Gao: Writing – review & editing, Funding acquisition. Huihuang Xia: Software, Methodology. Yingbing Yang: Supervision. Xiaoqi Wang: Formal analysis, Data curation.
Acknowledgements
This work was financially supported by the National Natural Science Foundation of China (Nos. 52274205, 52074148, and 52104194) and the LiaoNing Revitalization Talents Program (XLYC2203176).
Declaration of competing interest
The authors declare that they have no known competing financial interests or personal relationships that could have appeared to influence the work reported in this paper.
References
- Effects of particle size, dust concentration and dust-dispersion-air pressure on rock dust inertant requirement for coal dust explosion suppression in underground coal mines. Process Saf. Environ.. 2019;126:35-43.
- [CrossRef] [Google Scholar]
- Impacts of turbulence on explosion characteristics of methane-air mixtures with different fuel concentration. Fuel. 2020;271:117610
- [CrossRef] [Google Scholar]
- Visualization of the unburned gas flow field ahead of an accelerating flame in an obstructed square channel. Combust. Flame. 2009;156:405-416.
- [CrossRef] [Google Scholar]
- Numerical simulation of the deflagration-to-detonation transition in inhomogeneous mixtures. J. Combust.. 2014;2014
- [CrossRef] [Google Scholar]
- A shock-stable modification of the HLLC Riemann solver with reduced numerical dissipation. J. Comput. Phys.. 2020;423:109762
- [CrossRef] [Google Scholar]
- A two-step chemical scheme for kerosene–air premixed flames. Combust. Flame. 2010;157:1364-1373.
- [CrossRef] [Google Scholar]
- Effect of decreasing blockage ratio on DDT in small channels with obstacles. Combust. Flame. 2016;173:16-26.
- [CrossRef] [Google Scholar]
- LES modeling of premixed deflagrating flames in a small-scale vented explosion chamber with a series of solid obstructions. Combus. Sci. Technol.. 2008;180:1936-1955.
- [CrossRef] [Google Scholar]
- The dissipation and dispersion of the entropy wave caused by a turbulent lean premixed flame in a combustor. Appl. Therm. Eng.. 2020;165:112900
- [CrossRef] [Google Scholar]
- Effects of position and frequency of obstacles on turbulent premixed propagating flames. Combust. Flame. 2009;156:439-446.
- [CrossRef] [Google Scholar]
- Solution of the implicitly discretised fluid flow equations by operator-splitting. J. Comput. Phys.. 1986;62:40-65.
- [CrossRef] [Google Scholar]
- Multiparameter acceleration characteristics of premixed methane/air explosion in a semi-confined pipe. J. Loss Prev. Process Ind.. 2017;49:139-144.
- [CrossRef] [Google Scholar]
- Autoignition of methane/coal particle/air mixture under constant-volume conditions. Combust. Flame. 2023;258:113111
- [CrossRef] [Google Scholar]
- Influence of Roadway Cross-Section Shape on Gas Explosion Shock Wave Law in U-Type Ventilation Working Faces. Shock Vib.. 2021;2021:1-12.
- [CrossRef] [Google Scholar]
- Combined effects of obstacle position and equivalence ratio on overpressure of premixed hydrogen–air explosion. Int. J. Hydrogen Energ.. 2016;41:17740-17749.
- [CrossRef] [Google Scholar]
- Experimental study of premixed flame propagation over various solid obstructions. Exp. Therm. Fluid Sci.. 2000;21:109-116.
- [CrossRef] [Google Scholar]
- Measurements and large eddy simulation of propagating premixed flames. Exp. Therm. Fluid Sci.. 2006;30:687-702.
- [CrossRef] [Google Scholar]
- Two-equation eddy-viscosity turbulence models for engineering applications. AIAA J.. 1994;32:1598-1605.
- [CrossRef] [Google Scholar]
- Experimental investigation on effects of particle size, dust concentration and dust-dispersion-air pressure on minimum ignition temperature and combustion process of coal dust clouds in a G-G furnace. Fuel. 2018;227:424-433.
- [CrossRef] [Google Scholar]
- The acceleration of flames in tube explosions with two obstacles as a function of the obstacle separation distance. J. Loss Prev. Process Ind.. 2013;26:1597-1603.
- [CrossRef] [Google Scholar]
- A study on the obstacle-induced variation of the gas explosion characteristics. J. Loss Prev. Process Ind.. 2001;14:597-602.
- [CrossRef] [Google Scholar]
- Experimental studies on interactions between a freely propagating flame and single obstacles in a rectangular confinement. Combust. Flame. 2007;150:27-39.
- [CrossRef] [Google Scholar]
- Experiments on the effects of multiple obstacles in vented explosion chambers. J. Hazard Mater.. 2008;153:340-350.
- [CrossRef] [Google Scholar]
- The acceleration of flame propagation in a tube by an obstacle. Combust. Flame. 1991;85:363-379.
- [CrossRef] [Google Scholar]
- The hydrodynamic structure of unstable cellular detonations. J. Fliud Mech.. 2007;580:31-81.
- [CrossRef] [Google Scholar]
- Effects of dilute coal char particle suspensions on propagating methane detonation wave. Combust. Flame. 2023;249:112618
- [CrossRef] [Google Scholar]
- Effects of concentration and initial turbulence on the vented explosion characteristics of methane-air mixtures. Fuel. 2020;267
- [CrossRef] [Google Scholar]
- The influence of tunnel aspect ratio on the gas temperature distribution in advancing tunnel. Tunn. Undergr. Sp. Tech.. 2024;149:105818
- [CrossRef] [Google Scholar]
- Restoration of the contact surface in the HLL-Riemann solver. Shock Waves. 1994;4:25-34.
- [CrossRef] [Google Scholar]
- Influence of obstacle blockage on methane/air explosion characteristics affected by side venting in a duct. J. Loss Prev. Process Ind.. 2018;54:281-288.
- [CrossRef] [Google Scholar]
- Suppression of methane explosion in pipeline network by carbon dioxide-driven calcified montmorillonite powder. Arab. J. Chem.. 2022;15:104126
- [CrossRef] [Google Scholar]
- Experimental study on the suppression of coal dust explosion by silica aerogel. Energy. 2023;267:126372
- [CrossRef] [Google Scholar]
- Formation and evolution of distorted tulip flames. Combust. Flame. 2015;162:4084-4101.
- [CrossRef] [Google Scholar]
- Polyethylene deflagration characterization and kinetic mechanism analysis. Energy. 2024;303:131990
- [CrossRef] [Google Scholar]
- Explosions of gasoline–air mixture in the tunnels containing branch configuration. J. Loss Prev. Process Ind.. 2013;26:1279-1284.
- [CrossRef] [Google Scholar]
- Investigations on unconfined large-scale methane explosion with the effects of scale and obstacles. Process Saf. Environ.. 2021;155:1-10.
- [CrossRef] [Google Scholar]


