

Translate this page into:
Effect of metal ions on structural, morphological and optical properties of nano-crystallite spinel cobalt-aluminate (CoAl2O4)
⁎Corresponding author. ahmedfarid@bcsir.gov.bd (Md. Farid Ahmed)
-
Received: ,
Accepted: ,
This article was originally published by Elsevier and was migrated to Scientific Scholar after the change of Publisher.
Peer review under responsibility of King Saud University.
Abstract
The bright blue nano crystallite cobalt aluminate (CoAl2O4) was synthesized by sol–gel method using a mixture of chelating agent of glycerol and citric acid. The effects of changing (0.05, 0.075, 0.10, 0.25, 0.50, and 0.75 mol/L) metal ion concentration on the structural, morphological and color properties of synthesized CoAl2O4 were characterized by using X-ray diffraction (XRD), Scanning electron microscopy (SEM), Energy dispersive X-ray spectroscopy (EDX), Fourier transform infrared spectroscopy (FTIR), Nanoparticle size analyzer, Simultaneous Thermal Analyzer (STA), UV–vis absorption spectroscopy, and CIE-LAB colorimetric analysis. From the X-ray peak profile analysis, the crystallite size was measured by Debye-Scherrer (D-S) equation, and three different models presenting average crystallite sizes between 88.3 and 125.4 nm.The average lattice strain, dislocation density, lattice constant, cell volume, and zeta potential were between 0.00021 and 0.0058, (1.73 to 12.8) × 1014 (lines/m2), 8.10658 to 8.11181 Å, 533.60 to 533.81 Å3, −56.4 to − 63.5 mV, respectively. Using UV–vis absorption spectroscopy, the band gap was calculated from Kubelka-Munk method, and the values of band gap increasing from 1.82 to 1.84 eV, respectively. The reflectance spectra and the CIE-L*a*b* values of cobalt aluminate is also measured which confirmed the formation of blue nano crystallite cobalt aluminate.
Keywords
CoAl2O4 nanoparticles
Sol-gel method
XRD
Color properties

1 Introduction
Nano structured aluminates are a class of chemical compounds which have been the center of attraction for various applications due to their high thermal stability, chemical resistance, high quantum yield, low surface acidity, and large surface area (Sharma and Ghose, 2014; Ravikumar et al., 2015; Bayal and Jeevanandam, 2012). Spinel aluminates have a general formulae AB2O4, where A and B represent two different crystal sites of tetrahedral and octahedral structure, respectively, and the oxygen ions are arranged in a cubic closed structure (Gul et al., 2010;Tielens et al., 2006 ; Ballarini et al., 2009). The metal ion arrangements in spinels are the key factors contributing to its properties such as color, optical properties, catalytic activity, magnetic behavior, and diffusibility (Bersuker, 1996; Burns, 1993). Among these family of spinel aluminates, Cobalt aluminate (CoAl2O4) has unique optical property, stable and resistant to light and weather. For these reasons, now a days researchers are trying to find out the best method of obtaining spinel structure which could be processed at an appropriate temperature by controling homogeneity, purity, size and shape of the product, and thus be expected to control the color purity. This spinel Cobalt aluminate has found widespread use as a ceramic pigment (Burdett et al., 1982; Wang et al., 2006). The color of CoAl2O4 is bright blue due to the electronic d-d transition of Co2+ in tetrahedral co-ordination and bright blue synthetic cobalt aluminate is called as Thenard’s blue (Wang et al., 2016; Iakovleva, 2015; Zaharko, 2014; Xu 2015; Dumitru, 2017). Some author reported that calcination temperature is one of the factors that change the color properties of CoAl2O4 (Taguchi, 2013). The synthesis method also influences the optical and catalytic properties and it has a significant effect on the crystallinity, purity, particle size, surface area and morphology of nano-crystalline CoAl2O4 (Stringhini et al., 2014; Davar and Salavati-Niasari, 2011; Quirino et al., 2016). Due to the distribution of cations, spinels structure are classified into three types: normal, inverse and mixed spinels. Cobalt aluminate exhibits mostly as a normal spinel with Al3+ in octahedral sites and Co2+ in tetrahedral sites (Zayat and Levy, 2000). It has been extensively used in decoration, protective coatings, paint and coloration of ceramic particles (Zhang et al., 2017; Pan et al., 2015; Peymannia et al., 2014; Tong et al., 2016); fibres, glass, cement, rubber, glazes, paper, contrast enhancing luminescent pigment and ceramic bodies (Pan et al., 2015; Lewis, 1988; Alarcon et al. 1985; Jüstel et al., 1998). In addition, CoAl2O4 is non-toxic inorganic nanoparticles and so it is an environmental friendly (Peymannia et al., 2014). The structural property of CoAl2O4 makes it perfect for wide range of potential application in sensors, high density magnetic recording, magnetic fluids, microwave devices, absorbant materials and heterogeneous catalysis (Bid and Pradhan, 2003; Ayala and Marsh, 1991).
A variety of techniques have been applied for preparation of cobalt aluminate nanoparticles such as solid-state reaction (Srisawad et al., 2012), polymeric precursor method (Desouza, 2009), sol–gel method (Salavati-Niasari et al., 2009), co-precipitation method (Melo et al., 2003), hydrothermal method (Chen, 2004); dip coating (Grosso, 2011); etc. Methods have been reported to prepare CoAl2O4 by reverse microemulsion using surfactant explaining as tedious process (Chandradass et al., 2010), by co-precipitation method preventing the aggregation to some extent which needs alkaline medium (Zhang et al., 2017), by sol–gel method mentioning that sol–gel method has better particle distribution and dispersity (Tang, 2017).
Sol-gel method is widely known as a simple, fast, high reproducibile and low cost process for the production of pure nano structured cobalt aluminate powders (Salem et al., 2011;Salem et al., 2012; Salem, 2014) and the nano-particles formed with fast heating and compact reaction time (Ianoş et al., 2014; Ragupathi et al., 2014; Visinescu et al., 2011). Sol-gel method requires inorganic salt to prepare metal oxide sol by hydrolysis and poly-condensation reaction and the nano pigment cobalt aluminate powders were obtained after gelation and calcination process (Kurajica et al., 2012).
Cobalt aluminate nanoparticles were synthesized by a environment friendly method from tamarind fruit extract and developed a new and sustainable approach toward green chemistry (Mindru, 2019). Another synthesized method includes solution combustion by using Mentha piperita where aluminum nitrate and cobalt nitrate were used as reagent and Mentha piperita leaves extract as fuel and studied their photocatalytic activity on methylene blue (MB) under visible light irradiation (Gingasu, 2021). Ioana Mindru et.al prepared the un-doped and Tb3+doped calcium and strontium aluminates by using the tartarate multimetallic precursors and studied the effects of the preparation method on the structure, the morphology, the photoluminescence and thermoluminescence properties of CaAl2O4, CaAl2O4:Tb3+, SrAl2O4 and SrAl2O4:Tb3+ powders. (Mindru, 2017) (Fig. 1).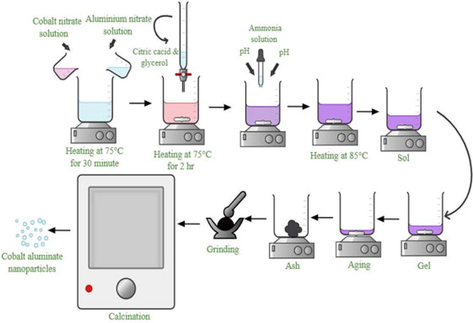
Schematic diagram for the preparation of cobalt aluminate nano-crystallites by sol–gel method.
The key point of this study is to develop of CoAl2O4 for using as blue pigment in ceramic ink and to know the effect of metal ion concentration on the structure, morphology, color properties and dispersion of CoAl2O4. In the current investigation, CoAl2O4 nanoparticles have been synthesized through first and cheap Sol-Gel route where the Co2+ and Al3+ molar ratio was fixed at 1:2. The intermediate products were synthesized at six different concentrations of Co2+ and Al3+ ions and the consequences of thermal treatment have been explored by calcining the intermediate product at a fixed temperature.
2 Experimental
2.1 Chemicals and materials
Cobalt nitrate [Co(NO3)2·6H2O], aluminum nitrate [Al(NO3)3·9H2O],glycerol (GC, C3H8O3) and citric acid (C6H8O7) were purchased from Merck, Germany. Aqueous ammonia (25 wt%) was purchased from Merck, Mumbai. Deionized (DI) water was utilized in all experiments for making aqueous solution.
2.2 Sample preparation
Cobalt aluminate nano-crystallites were prepared by using different metal ion concentration denoted as S1 = 0.05, S2 = 0.075, S3 = 0.10, S4 = 0.25, S5 = 0.50, S6 = 0.75 mol/L.
Aqueous solutions including highly pure salts of cobalt nitrate [Co(NO3)2·6H2O] and aluminum nitrate [Al(NO3)3·9H2O] with the molar ratio of 1:2 which were stirred for 30 min at 75 °C on the hotplate. A mixture of chelating agent, citric acid and glycerol with molar ratio of 1:1 was added into the mixed metal solution and the resultant solution was stirred for 2 hr with a magnetic stirer. An ammonia solution was added dropwise to adjust the pH value to ∼ 7.00 and the mixed solution was then allowed to evaporate at 85 °C on the hotplate with continuous stirring until a highly viscous gel was formed. Then the dry gel was placed in an oven at 110 °C for 5 h and black precursor was obtained. Finally, the resulting powder was calcined at desired temperature 1200 °C in a furnace for 4 h at the heating rate of 5 °C/ minute to obtain blue CoAl2O4.
3 Results and discussion
3.1 X-ray diffraction (XRD) analysis
The phase composition of synthesized CoAl2O4 was studied by X-ray Diffractometer (Smart Lab SE, Rigaku, Japan) by using Cu-Kα radiation with scan speed 10°/ min in the range of 10°≤2θ ≤ 90°. In this analysis, the characteristic peaks of the samples were compared with the standard values (2θ) of cobalt aluminate. Different diffraction peaks were found in the pattern and the position of these peaks were very well matched that of the cubic CoAl2O4 spinel according to JCPDS Card no.01–082-2242. Major peaks at (2 2 0), (3 1 1), (4 4 0), (5 1 1) and two weak peak at (4 0 0), (4 2 2) which confirm the presence of the single spinel phase. In this XRD analysis, no secondary phases were identified in any of the samples which indicates high purity and well crystallized of CoAl2O4. The XRD results showed similar pattern for all the samples which confirm that the change of metal ion concentration has no significant effect on the phase and stoichiometry of the prepared CoAl2O4 nano-crystallites. Fig. 2. shows the XRD peaks of CoAl2O4 spinel calcinied at 1200 °C for 4 h.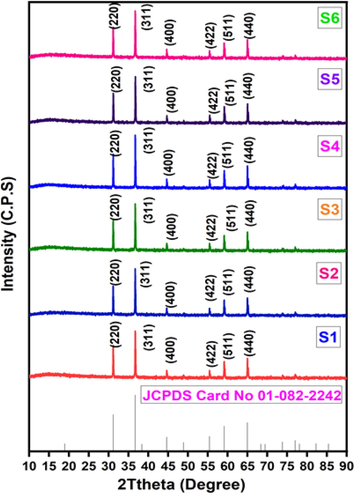
XRD patterns of cobalt aluminate nano-crystallites calcinated at 1200 °C.
The average crystallite size is determined by using the Debye-Scherrer and Wilson method, Williamson-Hall method, Halder-Wagner method and Size-Strain Plot method.
3.1.1 Crystallite size and lattice strain determination
3.1.1.1 The Debye-Scherrer and Wilson method
The Debye Scherrer method, in X-ray diffraction and crystallography, is a technique to measure the crystallite size of the particles by peak broadening analysis (Sen et al., 2020). By this technique, the average crystallite size (D) is calculated from the full width at half maximum (FWHM) value of the highest peak by the Eq.(1).
Where, DD-S is the crystallite size (nm), k is the shape factor (k = 0.9), λ is the wavelength of Cu-Kα radiation (λ = 0.154060 nm), βD is the internal breadth of the most intense peak FWHM (in radians) and θ is the diffraction angle of Bragg.
The internal breadth can be calculated by rearranging the Eq. (1).
By Stokes and Wilson equation, the lattice strain of the sample can be expressed as (Stokes and Wilson, 1944)
Where, lattice strain is denoted by Ɛstrain and internal breadth for strain effect is denoted by βstrain (Sen, 2020). The values of average crystallite size (DD-S) and lattice strain (€) are given in Table 1.
Sample ID
D-S and Wilson method
W-H plot
H-W plot
SSP technique
DD-S(nm)
Strain ƐW × 10-3
DW-H(nm)
Ɛ W-H × 10-4
DH-W(nm)
ƐW-H × 10-4
DSSP(nm)
ƐSSP × 10-4
S1
101.41
0.58
240.63
0.81
197.00
0.70
197.00
0.70
S2
96.10
1.20
101.21
0.81
88.30
1.60
88.30
1.60
S3
97.89
1.09
96.29
0.23
95.60
1.50
95.60
1.50
S4
153.29
0.92
189.29
1.94
120.00
1.20
120.00
1.20
S5
110.11
1.07
103.47
2.21
101.00
1.40
101.21
1.40
S6
97.55
1.12
108.32
1.22
99.00
1.40
99.00
1.40
The crystallite size calculation using the Debye-Scherrer uses one single peak and then calculate the average crystallite size which presented the value from 96 to 153 nm. There might be some error to estimate the average crystallite size and similar types of errors are discussed in the literature (Hossain, 2022).
3.1.1.2 Williamson-Hall method
Williamson-Hall technique is an easiest integral breadth method where crystallite size and lattice strain dependent on the line broadening are differentiated by considering the peak breadth as a function of 2theta (Mote et al., 2012). The peak broading observed from the lattice strain can be calculated with the help of Stokes-Wilson relation (Sen et al., 2020; Stokes and Wilson, 1944):
The breadth of the observed peak is the addition of the of βstrain and βD
Where, Βhkl is the full width at half maximum (FWHM) of a radiant peak, βstrain and βD are the width due to size strain respectively. From the Eqs. (2) and (4) the value of βD and βstrain putting in Eq. (5), we get,
Rearranging the Eq. (6),
Eq. (6) follows the straight line equation, y = mx + c. By plotting the value of 4sinθ along the x-axis and the value of βhklcosθ along the y axis (Yadav et al., 2016) in Fig. 3, the crystallite size and lattice strain of the synthesized six samples were estimated by the value of y-intercept and the slope of the straight line.The values of crystallite size (DW-H) and lattice strain (€W-H) using Williamson-Hall method are recorded in Table 1. The crystallite size calculated from this model were from 96 to 240 nm but too large crystallite size is not possible for the XRD technique using this instrument which made this model invalid. And, similar types of large crystallite sizes are found in the literature which also explained as invalid model (Hossain et al., 2022). Using the W-H plot, the plotted straight lines are not well fit as the correlation co-efficient value of R2 is 0.00687, (-0.05015), (-0.11366), (-0.05252), (-0.14286), 0.00976 for sample S1, S2, S3, S4, S5, and S6, respectively.
W-H plot of sample S1, S2, S3, S4, S5 and S6 Cobalt aluminate nano-crystallites.
3.1.1.3 Halder-Wagner method
By H-W analysis,the details about crystallite size (DH-W) and lattice strain (€H-W) of the nano-crystallites were measured from βhkl and planar spacing dhkl (the length between near by planes in the set (h k l)) (Sen et al., 2020). Halder and Wagner given an alternative formula which contains β* (integral width) of the reciprocal lattice point and d*(interplanar spacing).
Where,
By putting the value of β* and d* in Eq. (8) we get,
Rewritting the Eq. (11)
Eq. (11) is resembles as y = mx + c, where slope =
and y intercept = 16
(Sen, 2020). In H-W analysis, putting the value of
along y axis and
along × axis which are shown in Fig. 4. The crystallite size and lattice strain observed from the slope and y intercept and listed in Table 1. Similar types of observation were found in the literatures (Leila et al., 2018). The straight lines plotted using H-W technique are good fit, as the correlation coefficient value of R2 is 0.96334, 0.99216, 0.99179, 0.94899, 0.97232, and 0.96274, respectively.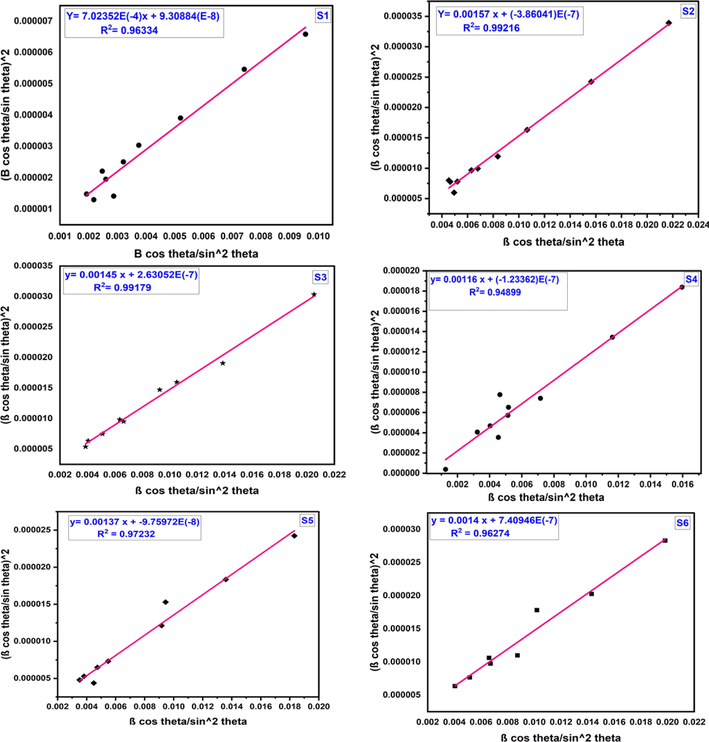
H-W plot of Samples S1, S2, S3, S4, S5 and S6 cobalt aluminate nano-crystallites.
3.1.1.4 Size-strain plot (SSP) method
The SSP technique is used for isotropic crystal structure determination (Sen et al., 2020; Venkatalaxmi et al., 2004). The crystallite size described by a Lorentz function and the lattice strain explained by a Gaussian function (Kafashan, 2018; Ahemen et al., 2016) to check back W-H calculation. By this method, average particle size and strain of the nano crystallites can be estimated easily due to considering the SSP technique as isotropic. Eq. (13) can be used for determining the crystaillte size and strain values of the nano crystallites with SSP method.
In Fig. 5, by plotting the values of (d2βcosθ) along the × axis and (dβcosθ)2 along the y axis for all the samples, the crystallite size were estimated from the slope and lattice strain determined from the y-intercept of the linear extrapolated data (Mohammed et al., 2020) respectively and recorded in Table 1.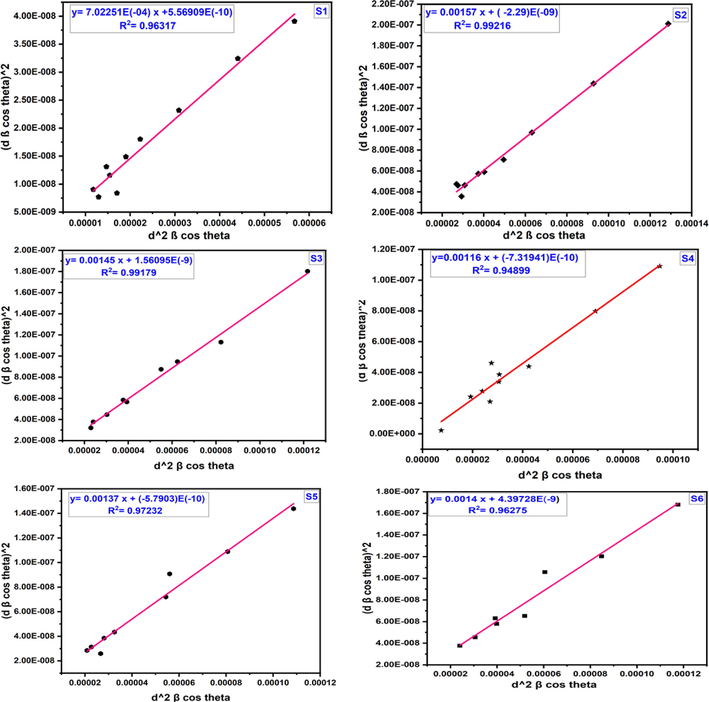
SSP plot of S1, S2, S3, S4, S5, S6 cobalt aluminate nano-crystallites.
The straight lines plotted using SSP method are good fit, as the correlation coefficient value of R2 is 0.96317, 0.99216, 0.99179, 0.94899, 0.97232, 0.96275 respectively.The result which obtained from the SSP and H-W method is more correct than W-H method since the data more accurately fits in this method (Venkatalaxmi et al., 2004; Irfan et al., 2018). The results obtaining structural parameters are quite similar for SSP and H-W plot. So, it is clear that SSP and H-W method is the best method. The values of crystallite size and lattice strain for different metal ion concentration of CoAl2O4 nano-crystallites from 4 different techniques are more or less similar. All the models used in the crystallite size calculation may not be applicable or fit for all the samples that is why different types of models are studied in this research work. The variation of the crystallite size are also reported in a number of literature (Hossain and Ahmed, 2022; Hossain et al. 2023; Hossain et al. 2022; Hossain et al. 2022; Tuntun et al., 2023). From the Table 1, it is observed that the sample S3 has the lowest crystallite size using all the methods.
3.1.2 Different microstructural parameters determination
The length of dislocation lines per unit volume of crystallite particle is called dislocation density (δ) that can be expressed as (Stokes and Wilson, 1944):
From the following Eqs. (15) and (16) the lattice constant of the nano crystallites has been estimated (Das, Jun. 2020). Here ‘‘d’’ is the interplanar spacing and n is the order of diffraction which is usually equal to 1 (Sen, 2020).
Here, a is the lattice constant and the integers h, k and l are Miller indices of refractor planes (Boda, 2019; Durga Prasad and Hemalatha, 2019). The cube of the lattice constant ‘’a’’ is expressed in Eq. (17) which is equal to the cell volume (Majid, 2020). Different microstructural parameters of 4 different method for different concentration of cobalt aluminate are recorded in Table 2.
Sample ID
Dislocation density,δ × 1014(lines/m2)
Lattice constant (Ȧ)
Cell volume(Ȧ3)
D-S method
W-H plot
H-W plot
SSP method
S1
10.30
1.73
2.58
2.58
8.11095
533.60
S2
11.50
9.76
12.80
12.80
8.11204
533.81
S3
9.02
10.80
10.90
10.90
8.11105
533.62
S4
6.34
2.79
6.94
6.94
8.10948
533.31
S5
8.70
9.34
9.80
9.80
8.10658
532.74
S6
9.59
8.52
10.20
10.20
8.11181
533.77
From the above Table 2, it is found that the value of dislocation density, lattice constant and cell volume calculated by all the four methods are very consistent with each other.
3.2 FTIR analysis
The FTIR analysis with different metal ion concentration of cobalt-aluminate was performed with a Fourier Transform Infrared Spectrometer (Model-IRAffinity-1S, MIRacle 10, Shimadzu, Japan). All the samples were showed almost the same FTIR absorption band shown in Fig. 6. Three frequency bands were detected at around 670, 560 and 460 cm−1 respectively which attributed the presence of CoAl2O4 spinel (Duan et al., 2011).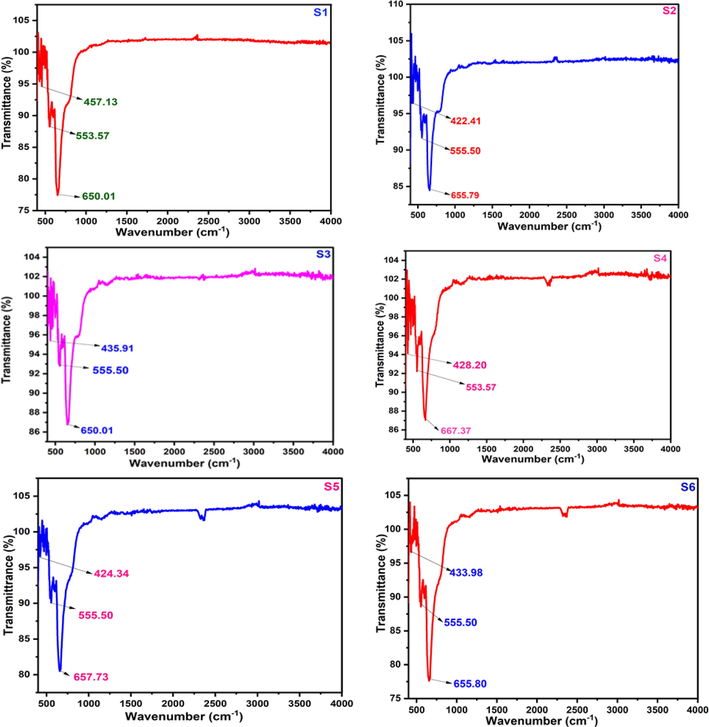
FTIR spectra of cobalt aluminate nano-crystallites.
The highest two bands observed at about 600 cm−1 assigned to intrinsic stretching vibrations of MTetrahedral-O bond at the tetrahedral site and the lowest band observed at about 400 cm−1 is attributed to the octahedral MOctahedral-O bond stretching (Mazzoli and Favoni, 2012).
Similar results are also found in a study where the strong absorption bands at 667 cm−1; 475 cm−1 and 418 cm−1 show the formation metal oxide groups. In this, 667 cm−1 of band appears indicates the formation of stretching vibrations of Co–O in the octahedral sites and 550 cm−1 indicates the stretching vibrations of Al-O in the tetrahedral sites (Venkatesan, 2022).
For all the samples, we get two strong bands around 650 cm−1 and 550 cm−1 which is responsible for intrinsic stretching vibrations of MTetrahedral-O bond at the tetrahedral site whereas the weak band at around 420 cm−1 reprsents the octahedral MOctahedral-O bond stretching.
3.3 Morphological analysis
The morphology of the synthesized CoAl2O4 samples were analyzed with the help of Scanning Electron Microscopy (MA15 VP-SEM, Carl Zeiss Evo, UK). SEM images for all of the samples are shown in Fig. 7. SEM images reveal that the surface of the nano crystallites were huge agglomerated with different shape. The agglomerated property of CoAl2O4 increased at higher temperature due to the increased surface energy and leading to large particle size. In the case of CoAl2O4 powder, the low magnification FE-SEM image shows the presence of irregular aggregates (Mindru, 2019).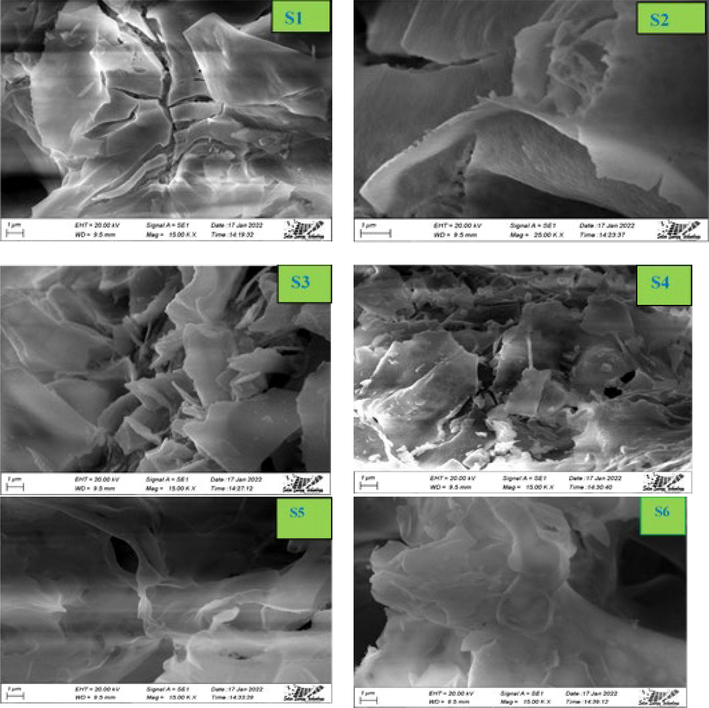
SEM micrographs of CoAl2O4 samples.
3.4 Compositional analysis:
The compositional analysis was obtained from EDX. The values of atomic weight percentage at 20 KeV for the CoAl2O4 samples presented in Fig. 8 and Table 3.The atomic ratio of Co and Al for all the samples near the stoichiometric value of 0.5. The experimental ratio of Co:Al are close to 1:2. The EDX pattern of the CoAl2O4 shows that the Co/Al ratio of S1,S2,S3,S4,S6 comparatively close to 0.5 except S5 sample. The major peaks of Co, Al and O exhibit the formation of CoAl2O4 nano crystallites with no other impurities.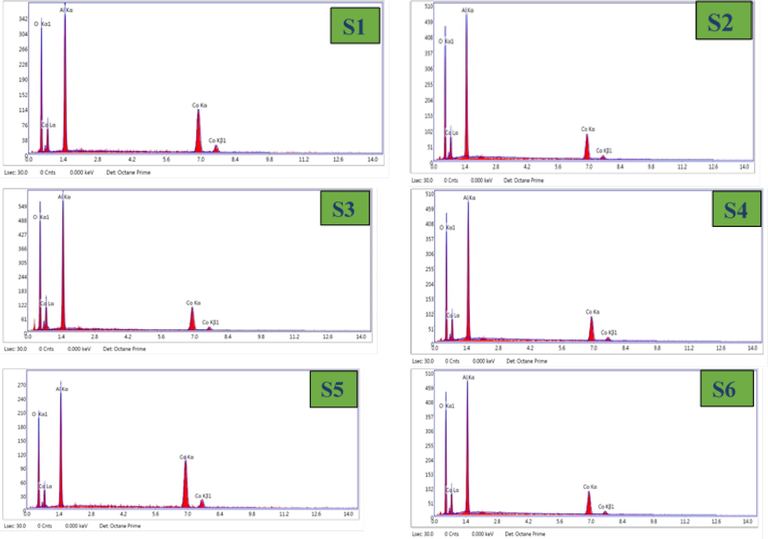
EDS results of CoAl2O4 nano-crystallites.
Sample ID
Atomic Weight (%)
Co/Al
Co
Al
S1
19.79
30.60
0.65
S2
12.14
29.78
0.41
S3
12.71
29.92
0.42
S4
13.31
30.29
0.44
S5
27.58
29.81
0.93
S6
13.34
30.47
0.44
3.5 Zeta potential
Zeta(ζ) potential of the cobalt-aluminate samples in liquid environment were estimated by Nanoparticle size Analyzer (nanoParticaSZ-100-S2, HORIBA scientific ltd, Japan) for measuring the dispersion stability. In this study, the samples were dispersed in 0.005 % de-ionized water solutions. To obtain the values of zeta potential, the samples were treated in neutral (pH ∼ 7) water suspension (Prabhakar and Samadder, 2018).
The results of zeta potential at different concentration are listed in Table 4 and are shown in Fig. 9. If the zeta potential value exists in the range (above + 30 mV and below −30 mV), the nano crystallite is said to be stable dispersion (Madhavi et al., 2013). In this analysis, all the samples were proved to be high dispersion stability in water. According to Ohshima’s model, the zeta potential value is lower for large particles and higher for having smaller particle size. The reason is due to the density of opposite charged ion for smaller particles is more intense than the particles having larger size (Holmberg et al., 2013). The highest zeta potential value (-63.5 mV) is obtained for the sample S4. It may be possible due to the particle size of these sample may be smaller than the other synthesized samples.
Sample ID
Zeta potential (mV)
S1
−59.8
S2
−61.8
S3
−57.8
S4
−63.5
S5
−56.5
S6
−56.4
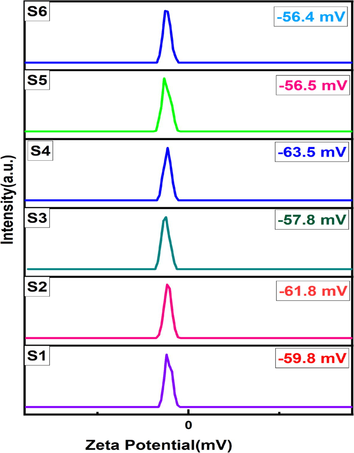
Zeta potentials results of S1, S2, S3, S4, S5 and S6 samples.
3.6 Particle size analysis
The size distribution of the synthesized cobalt-aluminate particles in the solution form were analyzed at 22.5 °C using a Nanoparticle Size Analyzer (nanoParticaSZ-100-S2, HORIBA scientific ltd, Japan). Particle size were measured using dynamic light scattereing method. The resultant particle size distribution of cobalt-aluminate nano crystallites are presented in Table 5. The synthesized products were dispersed in 0.005 % water solution and nano-particles analyzer gives hydrodynamic diameter which is always higher than the other dehydrated diameter (de la Calle et al., 2019; Bootz et al., 2004). The average particle size decreases from (3602–2887 nm) with the increasing of metal ion concentration. The particles remained in the cluster form which increased the size of hydrodynamic volume and the aggregated particles were also visualized in the SEM image.
Sample ID
Average Particle Size (nm)
S1
3602.4
S2
2901.3
S3
3450.7
S4
2887.5
S5
3390
S6
3243
3.7 Thermal analysis
The thermogravimetric analysis (TGA) and Differential scanning calorimetry (DSC) have been carried out by using a NETZSCH STA 449 F5 simultaneouss thermal analyzer (STA) under nitrogen atmosphere with heating rate of 10 K/min. Fig. 10. exhibits the thermogravimetric character of the samples before calcination from room temperature to 1200 °C.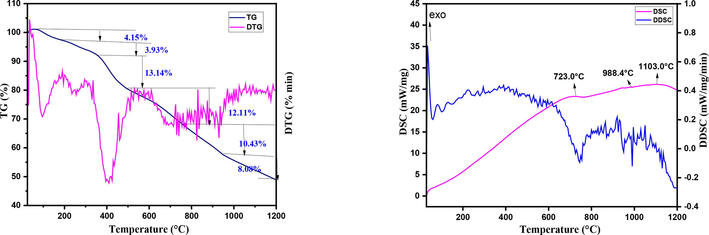
Thermal behaviour of the S6 sample before calcination (A) TGA, and (B) DSC.
The investigation confirms the CoAl2O4 formation as decomposition product with total 50 % weight loss.The first weight loss of about 4.15 % occurred in the range of 30–205 °C due to the loss of interstitial water.The second weight loss of about 3.93 % attributed in the range of 205–380 °C due to the loss of co-ordinated water. The significant weight loss of about 13.14 % occurs in the range of 380–580 °C may be due to the decomposition of citrate and nitrate ions. The temperature higher than 580 °C, the weight loss corresponds to the reduction of Co3+ to Co2+ in the presence of residual carbon and spinel CoAl2O4 was formed (Dumitru, 2017).From DSC data curve an exothermic peak is found at 723 °C which is occurred during the formation of cobalt aluminate.
3.8 Optical property of CoAl2O4
3.8.1 Color and reflectance spectra of CoAl2O4
UV–visible Spectrophotometer (Perkin Elmer Lambda 1050+) was used to determine the color factors L*, a* and b*. The colorimetric data of CIE-L*a*b* values in Table 6 summarized the color performance of the particles. The blue color was mainly denoted by the parameter b* value and the more the magnitude of the negative value the more bluer the sample. It can be seen that with the increasing of metal ion concentration, the b* value gradually decreased from (-19.55 to −15.96) and its chroma also decreased from 30.07 to 29.45. This means that the metal ion concentration had a significant effect on color properties of the resulting nano crystallites and it was found that S1 sample at 0.05 mol/L corresponded more to blue color (b*= −19.55) and its saturation is 30.07 indicating that the samples S1 represents high color purity and brightness. The changes in a certain amount of the Co concentration, the crystal lattice structure of CoAl2O4 will exhibit distortion, including Co with coordination tetrahedral as the center. The density of electron cloud in the 3d orbital of Co has also great influence, which changes the level of energy splitting and the pigment color. The reflectivity of the cobalt aluminate nano crystallites was observed in the visible wavelength range and shown in Fig. 11. The intensity of the reflection peak of cobalt aluminate at 400–492 nm (blue) was decreased significantly with the increasing of metal ion concentration which is congruous with the colorimetric data (Song et al., 2017).
Sample ID
L*
a*
b*
Chroma
S1
61.72
1.59
−19.55
30.07
S2
59.60
−0.01
−13.72
29.92
S3
59.20
1.50
−19.18
29.67
S4
58.49
−0.15
−17.63
26.48
S5
60.49
−0.19
−16.48
26.48
S6
61.18
0.23
−15.96
29.45
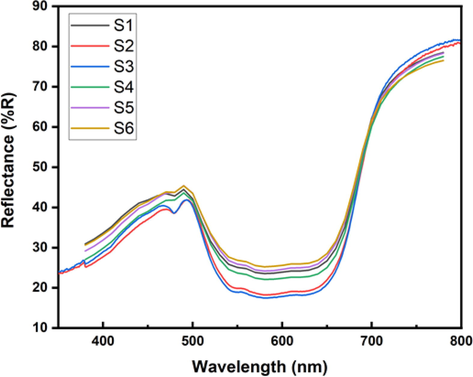
Reflection spectra of CoAl2O4 nano crystallites in the visible wavelength range.
3.8.2 Band gap energy
The band gap of all the synthesized samples were carried out in solid powder form by using UV–visible Spectrophotometer (Perkin Elmer Lambda 1050+).
The optical band gap energy (Egap) of synthesized cobalt aluminate was determined by Kubelka-Munk (K-M) function as follows:
Where, F(R) stands for Kubelka-Munk function and R is related to the percentage reflectance. The Kubelka-Munk function is related to the absorption co-efficient of the material.
Where, Egap is the band gap energy, hɣ is the incident photon energy, n is the optical transition process. For the direct allowed transition, the value of n is considered as 1/2.The energy band gap calculated by plotting (αhɣ)2 against hɣ is shown in Fig. 12. (Debnath and Das, 2020). In semiconductors, the energy band gap plays a important role, from which we can find out the application in the optoelectronic devices. The direct band gap value of the undoped CoAl2O4 was observed to be 1.82–1.84 eV which is lesser than the reported value of pure cobalt aluminate i.e., 2.57 eV (Dash et al., 2021). There is no significant changes are found in the calculation of band gap energy. Though there is a small variation in the band gap energy, this may be due to the manual calculation from the plot.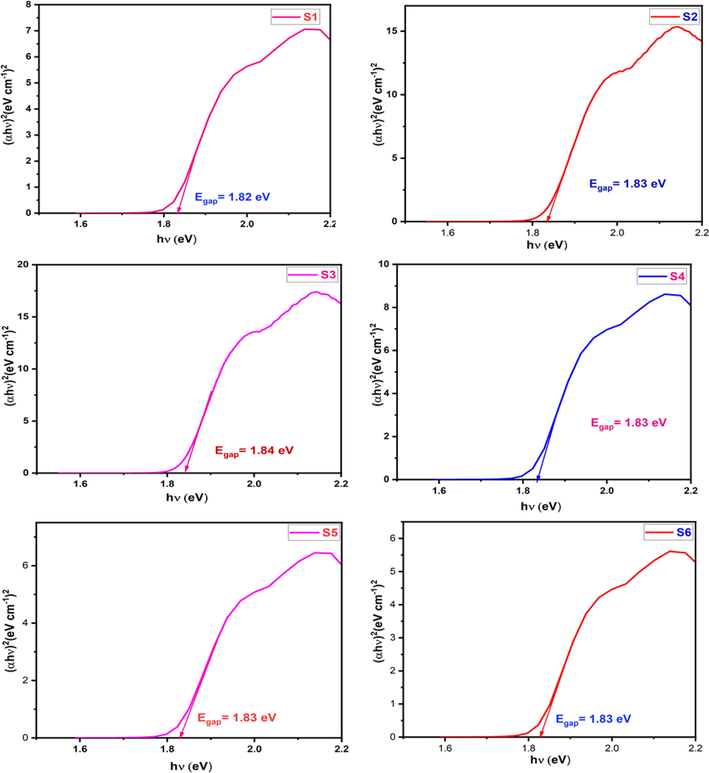
Optical band gap energy calculated from Kubelka-Munk method for cobalt aluminate.
4 Conclusion
Nano crystalline cobalt aluminate (CoAl2O4) was prepared successfully with varying metal ion concentration by sol–gel method with a calcination temperature of 1200 °C for 4 hr which was confirmed by XRD, FTIR, SEM, EDX, UV–vis, etc. The lowest crystalline size (95–97 nm) obtained for the sample, where metal ion concentration was 0.10 mol/L, using four different models. The zeta potential results of the S4 (0.25 mol/L) sample in aqueous solution was obtained as −63.5 mv, indicating that the sample has better dispersion stability than other synthesized samples, which will be demanding in the application sector of ceramic ink. The parameter b* value gradually decreased with the increasing of metal ion concentration, and the colorimetric data presented that the b* value of the S1 sample could be reached as high as (-19.55) at 1200 °C. The saturation (30.07) revealed that the sample S1 (0.05 mol/L) represented high color purity as well as brightness. The band gap values (1.82–1.84 eV) indicated a small changes when metal ion concentrations were varied.
CRediT authorship contribution statement
Monmon Podder: Investigation, Formal analysis, Software, Data curation, Writing – review & editing, Writing – original draft. Farid Ahmed: Conceptualization, Methodology, Resources, Supervision, Project administration, Visualization, Writing – review & editing. Rassel Moni: Validation, Resources, Writing – review & editing. Lutfor Rahman: Validation, Resources, Writing – review & editing. Bristy Biswas: Validation, Resources, Writing – review & editing. Nahid Sharmin: Project administration, Supervision, Writing – review & editing, Funding acquisition.
Acknowledgements
This work was supported by the Ceramic Raw Materials & Ceramic Materials Testing Division, Institute of Glass and Ceramic Research & Testing (IGCRT), Strengthening of Institute of Glass and Ceramic Research & Testing (SIGCRT) project, Glass Research Division, IGCRT and Institute of Fuel Research & Development (IFRD), Bangladesh Council of Scientific and Industrial Research (BCSIR), Dhaka, Bangladesh.
Declaration of Competing Interest
The authors declare that they have no known competing financial interests or personal relationships that could have appeared to influence the work reported in this paper.
References
- White light tunable emissions from ZnS: Eu 3+ nanophosphors over 330–465 nm excitation range for white LED applications. Mater. Res. Express. Apr. 2016;3(4):045016
- [CrossRef] [Google Scholar]
- Characterization and long-range reactivity of zinc ferrite in high-temperature desulfurization processes. Ind. Eng. Chem. Res.. Jan. 1991;30(1):55-60.
- [CrossRef] [Google Scholar]
- Phenol methylation over nanoparticulate CoFe2O4 inverse spinel catalysts: the effect of morphology on catalytic performance. Appl. Catal. A: General. Sep. 2009;366(1):184-192.
- [CrossRef] [Google Scholar]
- Synthesis of metal aluminate nanoparticles by sol–gel method and studies on their reactivity. J. Alloy. Compd.. Mar. 2012;516:27-32.
- [CrossRef] [Google Scholar]
- Electronic structure and properties of transition metal compounds: introduction to the theory. New York: Wiley; 1996.
- Preparation of zinc ferrite by high-energy ball-milling and microstructure characterization by Rietveld’s analysis. Mater. Chem. Phys.. Sep. 2003;82(1):27-37.
- [CrossRef] [Google Scholar]
- Effect of rare earth elements on low temperature magnetic properties of Ni and Co-ferrite nanoparticles. J. Magn. Magn. Mater.. Mar. 2019;473:228-235.
- [CrossRef] [Google Scholar]
- Comparison of scanning electron microscopy, dynamic light scattering and analytical ultracentrifugation for the sizing of poly(butyl cyanoacrylate) nanoparticles. Eur. J. Pharm. Biopharm.. Mar. 2004;57(2):369-375.
- [CrossRef] [Google Scholar]
- Role of the crystal-field theory in determining the structures of spinels. J. Am. Chem. Soc.. Jan. 1982;104(1):92-95.
- [CrossRef] [Google Scholar]
- R. G. Burns, Mineralogical Applications of Crystal Field Theory, 2nd ed. Cambridge University Press, 1993. doi: 10.1017/CBO9780511524899.
- Size effect on the magnetic property of CoAl2O4 nanopowders prepared by reverse micelle processing. J. Alloy. Compd.. Sep. 2010;506(1):395-399.
- [CrossRef] [Google Scholar]
- Preparation of nanosized cobalt aluminate powders by a hydrothermal method. Mater. Sci. Eng. B. Mar. 2004;107(2):217-223.
- [CrossRef] [Google Scholar]
- Effect of substrate temperature on the properties of RF sputtered CdS thin films for solar cell applications. Results Phys.. Jun. 2020;17:103132
- [CrossRef] [Google Scholar]
- C. S. Dash et al., “Magnetic property applications of microwave method prepared zinc ion modified CoAl 2 O 4 nanoparticles.,” Digest Journal of Nanomaterials & Biostructures (DJNB), vol. 16, no. 4, 2021.
- Synthesis and characterization of spinel-type zinc aluminate nanoparticles by a modified sol–gel method using new precursor. J. Alloy. Compd.. Feb. 2011;509(5):2487-2492.
- [CrossRef] [Google Scholar]
- Particle size characterization of Sepia Ink Eumelanin biopolymers by SEM, DLS, and AF4-MALLS: a comparative study. Food Anal. Methods. May 2019;12(5):1140-1151.
- [CrossRef] [Google Scholar]
- Study of the optical properties of Zn doped Mn spinel ferrite nanocrystals shows multiple emission peaks in the visible range –a promising soft ferrite nanomaterial for deep blue LED. J. Mol. Struct.. Jan. 2020;1199:127044
- [CrossRef] [Google Scholar]
- Blue pigments based on CoxZn1−xAl2O4 spinels synthesized by the polymeric precursor method. Dyes Pigm.. Jun. 2009;81(3):187-192.
- [CrossRef] [Google Scholar]
- Synthesis, structure and optical properties of CoAl2O4 spinel nanocrystals. J. Alloy. Compd.. Jan. 2011;509(3):1079-1083.
- [CrossRef] [Google Scholar]
- Synthesis, characterization of nanosized CoAl2O4 and its electrocatalytic activity for enhanced sensing application. J. Therm. Anal. Calorim.. Jun. 2017;128(3):1305-1312.
- [CrossRef] [Google Scholar]
- P. Durga Prasad and J. Hemalatha, “Enhanced magnetic properties of highly crystalline cobalt ferrite fibers and their application as gas sensors,” Journal of Magnetism and Magnetic Materials, vol. 484, pp. 225–233, Aug. 2019, doi: 10.1016/j.jmmm.2019.04.026.
- Mentha piperita-mediated synthesis of cobalt aluminate nanoparticles and their photocatalytic activity. J. Mater. Sci. Mater. Electron.. 2021;32(8):11220-11231.
- [Google Scholar]
- How to exploit the full potential of the dip-coating process to better control film formation. J. Mater. Chem.. 2011;21(43):17033.
- [CrossRef] [Google Scholar]
- Optical, magnetic and electrical investigation of cobalt ferrite nanoparticles synthesized by co-precipitation route. J. Alloy. Compd.. Sep. 2010;507(1):201-206.
- [CrossRef] [Google Scholar]
- Surface charge and interfacial potential of titanium dioxide nanoparticles: experimental and theoretical investigations. J. Colloid Interface Sci.. Oct. 2013;407:168-176.
- [CrossRef] [Google Scholar]
- New analytical models for precise calculation of crystallite size: application to synthetic hydroxyapatite and natural eggshell crystalline materials. Chem. Pap. 2022:1-7.
- [Google Scholar]
- Synthesis of nano-crystallite gypsum and bassanite from waste Pila globosa shells: crystallographic characterization. RSC Adv.. Aug. 2022;12(38):25096-25105.
- [CrossRef] [Google Scholar]
- Assessment of crystallite size of UV-synthesized hydroxyapatite using different model equations. Chem. Pap. 2022:1-9.
- [Google Scholar]
- Crystallographic dependency of waste cow bone, hydroxyapatite, and β-tricalcium phosphate for biomedical application. J. Saudi Chem. Soc.. 2022;26(6):101559
- [Google Scholar]
- Enhancement of photocatalytic efficacy by exploiting copper doping in nano-hydroxyapatite for degradation of Congo red dye. RSC Adv.. 2022;12(52):34080-34094.
- [Google Scholar]
- Synthesis and characterization of nano crystallite plaster of Paris prepared from waste eggshells and exploration of cytotoxicity, hemolysis and antimicrobial properties. J. Mater. Chem. B 2023
- [Google Scholar]
- Ground state and low-energy magnetic dynamics in the frustrated magnet CoAl 2 O 4 as revealed by local spin probes. Phys. Rev. B. Apr. 2015;91(14):144419
- [CrossRef] [Google Scholar]
- Large surface area ZnAl2O4 powders prepared by a modified combustion technique. Chem. Eng. J.. Mar. 2014;240:260-263.
- [CrossRef] [Google Scholar]
- X-ray peak profile analysis of CoAl2O4 nanoparticles by Williamson-Hall and size-strain plot methods. MoEM. May 2018;4(1):31-40.
- [CrossRef] [Google Scholar]
- New developments in the field of luminescent materials for lighting and displays. Angew. Chem. Int. Ed.. Dec. 1998;37(22):3084-3103.
- [CrossRef] [Google Scholar]
- Structural characterizations of pure SnS and In-doped SnS thin films using isotropic and anisotropic models. Mater. Res. Express. Apr. 2018;5(4):046417
- [CrossRef] [Google Scholar]
- The effect of annealing temperature on the structure and optical properties of sol–gel derived nanocrystalline cobalt aluminate spinel. Mater. Chem. Phys.. Aug. 2012;135(2–3):587-593.
- [CrossRef] [Google Scholar]
- Effect of polyethylene glycol and propyltrimethoxysilane on structural and optical properties of zinc oxide nanoparticles synthesized by sol–gel process. J. Theor. Appl. Phys.. Sep. 2018;12(3):159-167.
- [CrossRef] [Google Scholar]
- Lewis P.A., ed. Pigment Handbook (2nd ed.). New York: Wiley; 1988.
- V. Madhavi, T. N. V. K. V. Prasad, A. V. B. Reddy, B. Ravindra Reddy, and G. Madhavi, “Application of phytogenic zerovalent iron nanoparticles in the adsorption of hexavalent chromium,” Spectrochimica Acta Part A: Molecular and Biomolecular Spectroscopy, vol. 116, pp. 17–25, Dec. 2013, doi: 10.1016/j.saa.2013.06.045.
- Effect of hydrothermal reaction time on electrical, structural and magnetic properties of cobalt ferrite. Z. Phys. Chem.. Feb. 2020;234(2):323-353.
- [CrossRef] [Google Scholar]
- Particle size, size distribution and morphological evaluation of airborne dust particles of diverse woods by scanning electron microscopy and image processing program. Powder Technol.. Jul. 2012;225:65-71.
- [CrossRef] [Google Scholar]
- Evaluation of CoAl2O4 as ceramic pigments. Mater. Res. Bull.. Sep. 2003;38(9–10):1559-1564.
- [CrossRef] [Google Scholar]
- Tb3+-doped alkaline-earth aluminates: Synthesis, characterization and optical properties. Mater. Res. Bull.. 2017;85:240-248.
- [Google Scholar]
- A new approach: synthesis of cobalt aluminate nanoparticles using tamarind fruit extract. Mater. Sci. Eng. B. 2019;246:42-48.
- [Google Scholar]
- Preparation and investigation of the structural properties of α-Al2O3 nanoparticles using the sol-gel method. Chem. Data Collect.. Oct. 2020;29:100531
- [CrossRef] [Google Scholar]
- Williamson-Hall analysis in estimation of lattice strain in nanometer-sized ZnO particles. J. Theor. Appl. Phys.. Dec. 2012;6(1):6.
- [CrossRef] [Google Scholar]
- Recent development on preparation of ceramic inks in ink-jet printing. Ceram. Int.. Dec. 2015;41(10):12515-12528.
- [CrossRef] [Google Scholar]
- Production of a stable and homogeneous colloid dispersion of nano CoAl2O4 pigment for ceramic ink-jet ink. J. Eur. Ceram. Soc.. Oct. 2014;34(12):3119-3126.
- [CrossRef] [Google Scholar]
- Low cost and easy synthesis of aluminium oxide nanoparticles for arsenite removal from groundwater: a complete batch study. J. Mol. Liq.. Jan. 2018;250:192-201.
- [CrossRef] [Google Scholar]
- Synthesis of zinc aluminate with high surface area by microwave hydrothermal method applied in the transesterification of soybean oil (biodiesel) Mater. Res. Bull.. Feb. 2016;74:124-128.
- [CrossRef] [Google Scholar]
- Synthesis, characterization of nickel aluminate nanoparticles by microwave combustion method and their catalytic properties. Mater. Sci. Eng. B. May 2014;184:18-25.
- [CrossRef] [Google Scholar]
- Calotropis procera mediated combustion synthesis of ZnAl2O4:Cr3+ nanophosphors: structural and luminescence studies. Spectrochim. Acta A Mol. Biomol. Spectrosc.. Feb. 2015;136:1027-1037.
- [CrossRef] [Google Scholar]
- Bright blue pigment CoAl2O4 nanocrystals prepared by modified sol–gel method. J. Sol-Gel Sci. Technol.. Dec. 2009;52(3):321-327.
- [CrossRef] [Google Scholar]
- Effect of calcination temperature on colorant behavior of cobalt-aluminate nano-particles synthesized by combustion technique. J. Ind. Eng. Chem.. May 2014;20(3):818-823.
- [CrossRef] [Google Scholar]
- Characterizing thermal behavior of ceramic glaze containing nano-sized cobalt-aluminate pigment by hot stage microscopy. Thermochim. Acta. Jul. 2011;521(1–2):191-196.
- [CrossRef] [Google Scholar]
- CoAl2O4 nano pigment obtained by combustion synthesis. Int. J. Appl. Ceram. Technol.. Sep. 2012;9(5):968-978.
- [CrossRef] [Google Scholar]
- X-ray peak profile analysis of pure and Dy-doped α -MoO 3 nanobelts using Debye-Scherrer, Williamson-Hall and Halder-Wagner methods. Adv. Nat. Sci: Nanosci. Nanotechnol.. Apr. 2020;11(2):025004
- [CrossRef] [Google Scholar]
- XRD peak profile and optical properties analysis of Ag-doped h-MoO3 nanorods synthesized via hydrothermal method. J. Mater. Sci.: Mater. Electron.. Jan. 2020;31(2):1768-1786.
- [CrossRef] [Google Scholar]
- Synthesis and characterization of nanocrystalline zinc aluminate spinel powder by sol–gel method. Ceram. Int.. Mar. 2014;40(2):3209-3214.
- [CrossRef] [Google Scholar]
- Fabrication and stability of CoAl2O4 ceramic pigment for 3D printing. MSF. Jun. 2017;898:1935-1939.
- [CrossRef] [Google Scholar]
- Formation of CoAl 2 O 4 nanoparticles via low-temperature solid-state reaction of fine gibbsite and cobalt precursor. J. Nanomater.. 2012;2012:1-8.
- [CrossRef] [Google Scholar]
- The diffraction of X rays by distorted crystal aggregates - I. Proc. Phys. Soc.. May 1944;56(3):174-181.
- [CrossRef] [Google Scholar]
- F. M. Stringhini, E. L. Foletto, D. Sallet, D. A. Bertuol, O. Chiavone-Filho, and C. A. O. do Nascimento, “Synthesis of porous zinc aluminate spinel (ZnAl2O4) by metal-chitosan complexation method,” Journal of Alloys and Compounds, vol. 588, pp. 305–309, Mar. 2014, doi: 10.1016/j.jallcom.2013.11.078.
- Reaction temperature variations on the crystallographic state of spinel cobalt aluminate. Dalton Trans.. 2013;42(19):7167.
- [CrossRef] [Google Scholar]
- Preparation and characterization of nanoscale cobalt blue pigment for ceramic inkjet printing by sol-gel self-propagating combustion. Mat. Res.. Jul. 2017;20(5):1340-1344.
- [CrossRef] [Google Scholar]
- Periodic DFT study of the structural and electronic properties of bulk CoAl 2 O 4 spinel. J. Phys. Chem. B. Jan. 2006;110(2):988-995.
- [CrossRef] [Google Scholar]
- Highly dispersed re-doped CoAl 2 O 4 nanopigments: synthesis and chromatic properties. J. Nanomater.. 2016;2016:1-7.
- [CrossRef] [Google Scholar]
- Crystallographic characterization and application of copper doped hydroxyapatite as a biomaterial. New J. Chem. Jan. 2023
- [CrossRef] [Google Scholar]
- Synthesis, characterization and magnetic properties of Mg2+ doped green pigment Cobalt aluminate nanoparticles. J. Mater. Sci.: Mater. Electron.. Sep. 2022;33(27):21246-21257.
- [CrossRef] [Google Scholar]
- Starch – a suitable fuel in new low-temperature combustion-based synthesis of zinc aluminate oxides. Polyhedron. Nov. 2011;30(17):2824-2831.
- [CrossRef] [Google Scholar]
- Ultrafine CoAl2O4 ceramic pigment prepared by Pechini-sacrificial agent method. Mater. Lett.. Jun. 2016;173:64-67.
- [CrossRef] [Google Scholar]
- Synthesis of cobalt–aluminate spinels via glycine chelated precursors. Mater. Chem. Phys.. Apr. 2006;96(2–3):361-370.
- [CrossRef] [Google Scholar]
- One-step synthesis of ordered mesoporous CoAl 2 O 4 spinel-based metal oxides for CO 2 reforming of CH 4. RSC Adv.. 2015;5(60):48256-48268.
- [CrossRef] [Google Scholar]
- Eu-doped ZnO nanoparticles for dielectric, ferroelectric and piezoelectric applications. J. Alloy. Compd.. Dec. 2016;689:333-341.
- [CrossRef] [Google Scholar]
- Unconventional magnetic order in the frustrated diamond-lattice antiferromagnet CoAl 2 O 4 studied by neutron diffraction and classical Monte Carlo simulation. Phys. Rev. B. Oct. 2014;90(13):134416
- [CrossRef] [Google Scholar]
- Blue CoAl 2 O 4 particles prepared by the sol−gel and citrate−gel methods. Chem. Mater.. Sep. 2000;12(9):2763-2769.
- [CrossRef] [Google Scholar]
- Bright blue halloysite/CoAl 2 O 4 hybrid pigments: preparation, characterization and application in water-based painting. Dyes Pigm.. Apr. 2017;139:473-481.
- [CrossRef] [Google Scholar]


