

Translate this page into:
Effect of micropatterning with nanowire-based microcavity array on bacterial enrichment and selective distribution
⁎Corresponding author at: Guangdong Provincial Key Laboratory of Medical Immunology and Molecular Diagnostics, Guangdong Medical University, Dongguan, Guangdong, China. zhengly3@mail3.sysu.edu.cn (Liyuan Zheng)
-
Received: ,
Accepted: ,
This article was originally published by Elsevier and was migrated to Scientific Scholar after the change of Publisher.
Abstract
The micro-patterned topography can affect bacterial enrichment and selective distribution by modifying the characteristics of material surface. In this study, we fabricated microcavity patterned silicon surfaces, and quantitatively explored the amount and distribution of Escherichia coli (E. coli) cells attached on a series of defined topographies. The results showed that E. coli cells enrichment was significantly increased on silicon nanowires-based microcavity array when compared to nanowires patterned silicon wafer. Furthermore, the microcavity diameter can control bacterial distribution by changing hydrophilic performance of interface. With the microcavity diameter of 7 µm, the cells colonized into the microcavity almost in its entirety, whilst distributed around the microcavity completely with 10 µm diameter, regardless of centre distances. This phenomenon can be explained by the Cassie-Baxter model equation according to the wettability. The distribution of bacterial enrichment changed with the silicon surfaces turning from non-wetting status to wetting status when treated with oxygen plasma to modify the hydrophobicity. These results demonstrated that microcavity patterned surface could favor bacterial enrichment on silicon and strictly confined bacterial distribution inside/outside the microcavity. Moreover, the nanowires inside microcavity can also increase electron conductivity and reduce the internal resistance, thus providing scientific evidence for the design of wearable microbial fuel cell with rational optimization and integration of different components for electronic skin.
Keywords
Microcavity
Nanowires
Bacterial distribution
Bacterial enrichment
Wettability

1 Introduction
A microbial fuel cell (MFC), which use electrogenic microbes as a biocatalyst to autonomously transform the chemical energy into electrical power through bacterial metabolism, have shown to be a promising alternative to traditional bulky batteries as one of sustainable energy systems in many application fields such as sensor, fuel production and wastewater treatment (Priya et al., 2022; Srivastava et al., 2021(Aug.)). Presently a wearable MFC was constructed as an autonomous power supplier based on a sandwich electrode assembly (Mohammadifar et al., 2020; Ryu and Choi, 2021). The wearable MFC can be attached directly on the skin and utilizes human sweat to generate electricity through the skin-inhabiting electrogenic bacteria (e.g., Staphylococcus epidermidis). Such wearable MFC has demonstrated promising power-delivery efficiency when integrated into electronic skin. However, the lower output power seriously hindered the further development of wearable MCF. To further improve the efficiency of wearable MFC, optimizing MFC components and integrating more MFC subunits array are both needed.
Actually, integrating multiple MFC subunits within an superthin patch can be realized by electrically connecting each independent subunits in series or parallel (Ryu and Choi, 2021). Thus, optimizing various components of MFC is more crucial to improve the efficiency of wearable MFC, including electrode material, semi-permeable membrane, electrogenic bacteria, etc. Unluckily, the semi-permeable membrane increased the internal resistance and reduced the output power of MCF. Moreover, the traditional immobilized microbial technologies such as adsorption and crosslinking method have been mainly used to control the bacterial attachment and colony on the anode surface of MCF, while the number of bacterial attachment is limited, and the crosslinking agent used will damage the activity of bacteria (Lu et al., 2020; Asim et al., 2021; Rambabu et al., 2022). The bacterial enrichment and selective distribution on electrode material surfaces can be affected by numerous factors, mainly including the properties of the materials (surface topography, energy, chemistry, roughness, wettability), the characteristics of bacterial cells (size, pili, fimbriae), as well as the environmental conditions of the adhesion area (temperature, pH, etc.) (Mauclaire et al., 2010; Katsikogianni and Missirlis, 2010; Perni and Prokopovich, 2013), among which the surface topography is more feasible and controllable by various techniques to pattern specific features at the micro- and nano-scale levels (Manabe et al., 2013). Numerous studies claimed that the different shapes and spacing of the micropatterns have significant impacts on bacterial enrichment and selective distribution, such as lines (Naiyan et al., 2016); grooves (Irving and Allen, 2011); rectangular grooves (Irving and Allen, 2011); cones (Perni and Prokopovich, 1844), holes (Graham M V. State University of New York at Albany., 2014), squares (Naiyan et al., 2016); and pillars (Epstein et al., 2011), triangle (Schumacher et al., 2008). Furthermore, with micropatterning, the surface hydrophobicity and roughness of the material surface had changed without the addition of other chemical components, so as to achieve the purpose of surface modification of the material (Mohamed et al., 2022; Agrahari et al., 2022). Therefore, adjusting the physical properties of the material, without the addition of carriers or chemical reagents, to indirectly regulate the bacterial enrichment and selective distribution on the surface of the material can not only obtain a highly active electrogenic bacteria enrichment, but also can be reused, which can provide new ideas for the design of wearable MFC (Hou et al., 2011).
To solve above problems, in this work, we fabricated a kind of silicon nanowires-based microcavity array structure, which can arrange biofilm distribution on it surface. Due to the air cushion formed in microcavity, it will prevent the bacterial suspension stay in nanowire-based microcavity even with stronger hydrophilicity. On the contrary, the bacterial suspension was prefer to adhering to the flat silicon region with high surface hydrophobicity. Furthermore, we find the microcavity diameter can effect the air cushion formation and changes the surface wettability, thus influence biofilm distribution. We also use Wenzel and Cassie-Baxter model equation identified the relationship between microcavity diameter and surface wettability. As konwn that, the microbial fuel cell (MFC) need bacterial enrichment and selctive distribution on electrode surface, and our designed silicon surface just satisfied with the entire requirement. this study designed a microcavity array with different diameters and centre distances on silicon wafer, in which each microcavity contains a varying number of nanoscale wires, using ultraviolet photolithography combined with chemical wet etching techniques, and explored the bacterial enrichment and selective distribution on the patterned surfaces. We found that the nanowire-based microcavity array on a silicon surface could affect bacteria enrichment and selective distribution. The results demonstrated that E. coli cells enrichment was significantly increased on silicon nanowires-based microcavity array when compared to nanowires patterned silicon wafer. Furthermore, the microcavity diameter can control bacterial distribution by changing hydrophilic performance of interface. With the microcavity diameter of 7 µm, the cells colonized into the microcavity almost in its entirety, whilst distributed around the microcavity completely with 10 µm diameter, regardless of centre distances. Moreover, the distribution of bacteria enrichment changed with the silicon surfaces turning from non-wetting status to wetting status when treated with oxygen plasma to modify the hydrophobicity. It should be noted that each microcavity can be designed as an independent MFC, and bacteria can be strictly confined inside/outside the microcavity. Moreover, the nanowires inside microcavity can also increase electron conductivity and reduce the internal resistance of MFC.
This study will guide the rational optimization and integration of different wearable MFC components and also provide useful insights for the design of wearable MFC for electronic skin.
2 Experimental methods
2.1 Preparation of patterned surfaces
The nanowire-based microcavity patterned surfaces with different diameters and centre distances were prepared using ultraviolet photolithography combined with chemical wet etching techniques on regular 1 × 1 cm2 silicon wafers with 1 mm thick (Rochester, MN, USA). Firstly, four photomasks with different parameters were designed using the CAD software (Autodesk Computer Aided Design) as shown in Fig. 1. Secondly, the silicon wafers were cleaned by ultrasonication at 40 kHz for 3 min (Crest CP200HT Ultrasonic Cleaners) in lotion, acetone and ethanol in turn respectively. After drying in air, silicon wafers were treated in an oxygen plasma chamber (Diener Electronic Pico, 6 cm3 min−1 oxygen flow rate) at 120 W for 3 min. Afterwards, a photoresist (S1813) was spin-coated on silicon wafers with a thin layer of ∼ 1 μm using a ws-400B-6Npp/Lite spinner system, and then silicon wafers were baked on a hot plate at 185 ℃ for 3 min. The samples were exposed to UV (OAI Model 200 Mask Aligner) under a designed photolithography mask for 10 s to achieve positive photoresist. After exposure, samples were baked for 3 min to develop the photoresist. Next, the uncross-linked photoresist was removed using DI water and the samples were dried in air. Subsequently, chemical wet etching was used to create wires. All samples were dipped in 5 % hydrofluoric acid (HF) for 2–3 min to remove the surface oxide layer, and then etched in etching solution which contained 4.8 M HF and 0.005 M AgNO3 for 1.5 h under dark condition at room temperature. After etching, the samples were rinsed thoroughly with DI water and then immersed in 50 % nitric acid for 8 min to remove Ag nanoparticles. Finally, all samples were immediately washed with acetone to remove residual photoresist layer and soaked in ethanol solution for 20 min followed by drying in air. Prior to use, the samples were sterilized with 75 % ethanol and drying in air for 30 min in a sterile cabinet.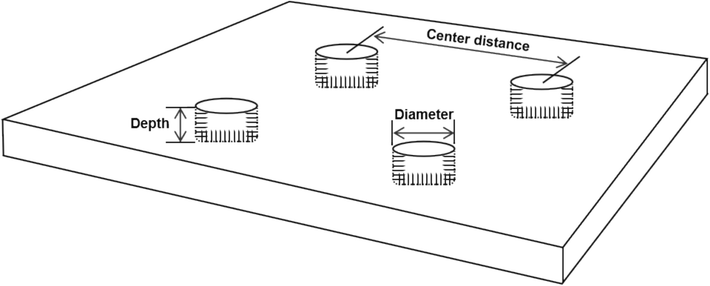
Scheme of the micro-patterned silicon surface with the main dimensions of the features.
A total of five different topographies were presented in this study (Fig. 2), and described as below: (i) a wires patterned surface, (ii) nanowire-based microcavity with 7 µm diameter and 30 µm centre distance, (iii) nanowire-based microcavity with 7 µm diameter and 50 µm centre distance, (iv) nanowire-based microcavity with 10 µm diameter and 30 µm centre distance, (v) nanowire-based microcavity with 10 µm diameter and 50 µm centre distance, among which (i) was defined as control group.
The optical microscopic (A-E) and SEM images (F-J) of micro-patterned silicon surface with five different dimensions.
2.2 Surface characteristic analysis
The patterned surface morphology was characterized by using a optical microscopic (Nikon Eclipse 80i) and a surface mapping microscope (Leica DMLM, Germany). Micrographs were scanned using an scanning electron microscope (SEM, Hitachi SU8010) at 20 kV with different magnifications. The depth of microcavity was determined using a step profiler (KLA-Tencor D500 Stylus Profiler). The obtained photographs were further processed to determine the diameter and centre distance of the microcavity using Image J software (NIH, USA). All samples were tested at least three times and all data were presented as the average of three replicates for each sample.
2.3 Bacterial culture conditions
An enhanced green fluorescent protein (eGFP) labeled E. coli was obtained through transferring plasmid DNA of PET 6XH7S/eFGP into Escherichia coli BL21 (DE3) competent cells, and then positive colonies were selected by cultivation on LB plates with 100 µg/mL ampicillin. Subsequently, the single eGFP-expressing E. coli colony was cultured in 20 mL of sterilized LB media containing 1 mM IPTG and 100 µg/mL ampicillin. After 16 h of growing at 37 ℃ while being agitated at 120 rpm in an orbital shaker incubator, bacteria were harvested by centrifugation at 1200 g for 5 min, washed twice with PBS buffer, and finally the pellet was re-suspended in PBS at a desired concentration of 106 ∼ 108 CFU ml−1 for further experiments.
2.4 Bacterial attachment assays
Firstly, a 200 µL of eGFP-expression E. coli suspension was dropped onto the surface of silicon wafer in triplicate, and incubated at 37 ℃ for 1 h. After incubation, the samples were gently washed with fresh sterile PBS to remove residual bacterial suspension. Then images were captured in ten random views on the surface of each sample using an upright fluorescence microscope (Nikon-NI-U, Japan), and were further analyzed with Image J software to calculate the average cells intensity of bacterial adhesion. To identify the effect of wetting states on bacteria adhesion and distribution, the wires-based cavities patterned samples were subjected to O2-plasma treatment using a low temperature plasma treatment apparatus (SY-DT03S, China) for 2 min at 50 Hz.
2.5 Statistical analysis
The statistical analysis was performed using GraphPad Prism 8 software (San Diego, 265 California), and the statistically significant differences using one-way ANOVA were determined at an p level of 0.05.
3 Results and discussion
3.1 Characterization of patterned surfaces
We prepared five topographies with different patterned surfaces were shown in Fig. 2. The nanowires patterned surface was composed of a series of random vertical wires and as the control, while the nanowire-based microcavity patterned surfaces were consist of microcavity with vertical and horizontal nanowires inside, and were defined as experimental group with 4 subtypes according to the diameter of microcavity (7 µm or 10 µm) and distance between adjacent microcavity centers (30 µm or 50 µm). As the optical microscopic images (Fig. 2A-E) shown, silicon surfaces exhibited the uniform microcavity array structures. In addition, SEM images of the patterned surfaces revealed that silicon surface exhibited microcavity shaped features and the dense nanowires were fabricated inside each microcavities after the etching solution (Fig. 2F-J). The microcavity structure made it possible for capturing air inside the microcavity and forming a stable air cushion to inhibit the enrichment of bacteria. Moreover, the magnified images of microcavity revealed that nanowires were densely distributed inside the microcavity, which could increase bacterial surface contact area, in turn, enhance bacterial enrichment and electron transfer (Chen et al., 2018).
3.2 Bacterial enrichment and selective distribution
This study aims to assess bacteria enrichment and selective distribution on micro-patterned surfaces using experimental and computational approaches. Firstly, to evaluate the experimental effect of patterned surfaces on bacteria enrichment and selective distribution, we add the suspended bacteria with fluorescence-labeled E. coli onto the patterned surface of silicon wafer, which were then incubated 1 h under static conditions. The results of bacteria enrichment were observed by fluorescence microscopy and shown in Fig. 3A. All the silicon nanowires-based microcavity patterned surfaces tended to have a significantly increased cells enrichment, as compared to the nanowires patterned surface control. Furthermore, the diameter of microcavity seemed to be relevant to the distribution of adhered E. coli, but not the centre distance. With the microcavity diameter of 7 µm, cells colonized into the cavities almost in its entirety, whilst distributed around the cavities completely with 10 µm diameter. However, on nanowires patterned surface, bacteria appeared to be randomly distributed on the surface. The quantitative analyses of fluorescence intensities with bacterial enrichment on patterned surfaces were presented in Fig. 3B. A previous study (Wang et al., 2014) also indicated that the oval micrometer topology with different radius and side length could affect the attachment of bacteria. This difference between different patterned surfaces was also highlighted by a series studies (Ploux et al., 2009; Diaz et al., 2009; Hochbaum and Aizenberg, 2010).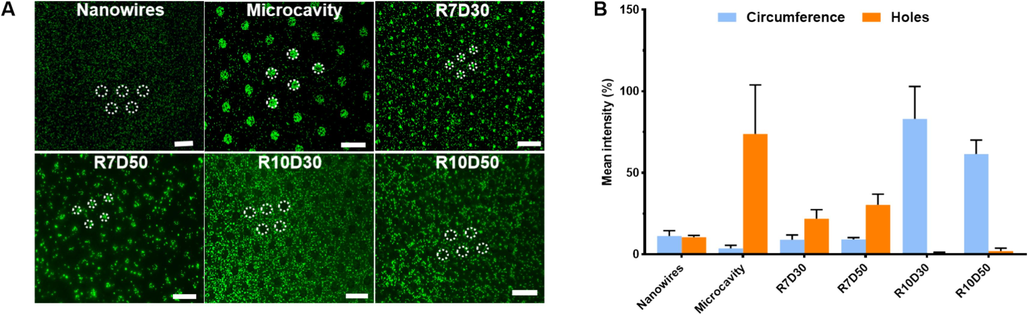
(A) Fluoroscopic images of E. coli adhesion on the patterned silicon surface. (B)The coverage rate of E. coli counted base on the fluoroscopic images as determined by the instrument's software.
Moreover, the amount of bacterial cells enrichment increased with time on the silicon nanowires-based microcavity patterned surfaces with 10 µm, while almost no bacterial cells were observed inside the microcavities throughout the whole incubation (Fig. 4). As we known, when a droplet was placed onto the surface with special microstructure, the wetting may be either in a Wenzel state or a Cassie-Baxter state, which are relatively systematic theories about the surface wettability of materials (Xuxmwang, 2010). In the Wenzel state; the droplet contacts in direct with the concave and convex surface of the microstructure, and completely occupies the grooves of solid rough surface. While, in the Cassie-Baxter state, the droplet contacts only with the convex surface of the microstructure, and is suspended on the grooves, but not fill in the grooves of solid rough surface, thus lead to the formation of air cushion inside microcavity. This maybe explain why bacterial enrichment and distribution on the nanowire-based microcavity patterned surface differ between the diameter of 7 µm and 10 µm.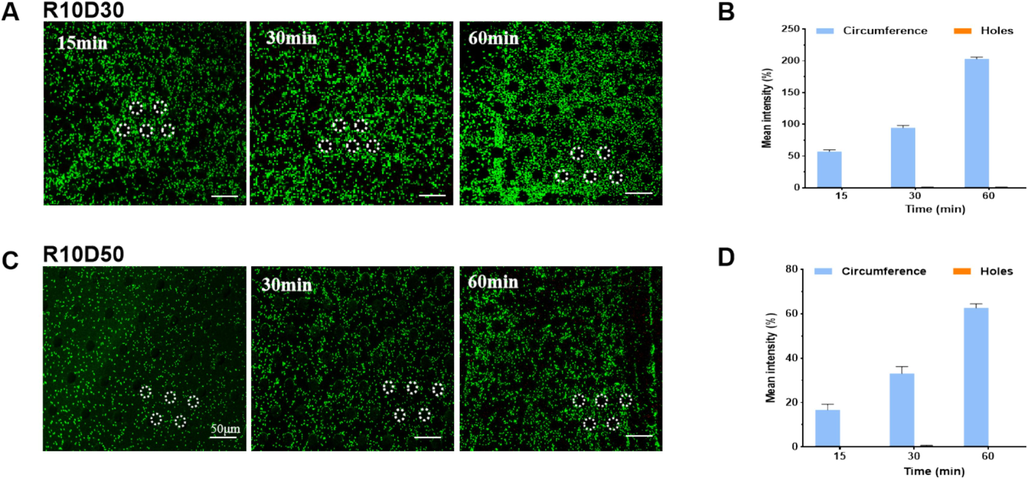
(A) Fluoroscopic images of E. coli adhesion on the patterned silicon surface. (B)The coverage rate of E. coli counted base on the fluoroscopic images as determined by the instrument's software.
3.3 Effect of wettability on bacterial distribution and theoretical analyses
Bacterial enrichment and selective distribution are a complex process (Berne et al., 2018 Oct), and the properties of the material (such as surface wettability, roughness and chemical component, etc.) directly determine the interaction between bacteria and surface (Song et al., 2015; Privett et al., 2011; Thewes et al., 2014). As one of the important characteristics of material surface, the wettability changes with different microstructure of material surface (Sun et al., 2021). Generally, the contact angle represent the wettability of solid surface. Lower contact angle (< 90°) means that the solid surface is not hydrophobic, namely wettability, while higher contact angle (> 90°) means that the material is hydrophobic, not wetting. One of the most classic examples is the self-cleaning function of lotus leaves. In 1997, Barthlott and Neinthuis et al. (Barthlott and Neinhuis, 1997) found that the self-cleaning function of lotus leaves comes from the special infiltration of micro-nano structures on its surface. Feng et al. (Feng et al., 2002) further revealed that air cushion formed between the micro and nano structures on lotus leaf surface enables it to have super hydrophobic function, thus preventing suspended bacteria and fungi in air or liquid from sinking into the interior of lotus leaf, and further calculated that the composite contact angle of lotus leaf is 161° ± 25° according to the Cassie-Baxter model (Cassie, 1994).
Considering that complex chemical compositions on rough and patterned surfaces of silicon wafer, we hypothesized that the above differential distribution of bacterial enrichment could be explained by the wettability of solid surface. For the 7 µm microcavity, droplets of bacteria suspension could completely penetrate inside the microcavity and this could be explained by the Wenzel model. In the Wenzel equation (Fig. 5A), the parameter “R” represents the surface roughness. Through the profiometer test, we know the surface roughness of “R7D30” and “R7D50” is 0.22 and 0.54 respectively. cosθe is intrinsic contact angle, this data can be obtained based on cosθ = r cosθ0. “r” is actual roughness of the material, θ is actual contact angle. “d” is diameter of microcavity, “a” and “b” are center-to-center distance, “h” is depth of microcavity. we based on the Wenzel equation, the 7 µm microcavity with centre distance 30 µm and 50 µm had similar contact angles with 28.24° and 34.11°, respectively (Fig. 5A). In Cassie-Baxter equation, f1 and f2 representative the area ratio of liquid droplets on the surface of micro-structured convex and concave parts (f1+ f2 = 1). Cosθ1 represents the contact angel between the liquid droplet and the protruding part of the micro-structured surface (the contact angel between flat silicon and liquid droplet). Cosθ2 represents the contact angle between the liquid droplet and concave part of the micro-structured surface. (because the concave part is in the gas phase, the contact angel is 180°). According to the Cassie-Baxter model, after droplets of bacteria suspension contacted the 10 µm microcavity, they had more relatively larger contact angles (70.97° and 64.51°) than the 7 µm microcavity (Fig. 5B). This could be attributed to the formation of air cushion inside the 10 µm microcavity, which prompted liquid drop to stay on the top of microcavity and inhibited the permeation of suspended bacteria. Air cushion that trapped into microcavity have been reported to inhibit liquid drop infiltration, and can change the contact angle of microcavity based on the Cassie-Baxter model equation.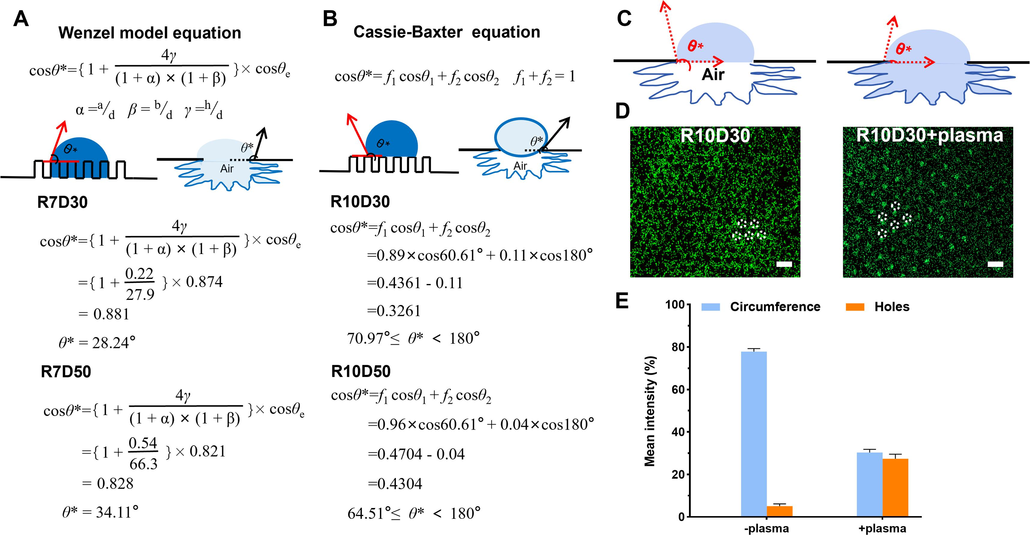
Wenzel and Cassie-Baxter models for hydrophobicity of patterned surfaces. (A) Wenzel models equation, where θe denotes the contact angle on a rough surface, a and b is the center distance, d is the diameter, and h is the depth. (B) Cassie-Baxter models equation. In these models, the surface is composed of two different components, where θ1 and θ2 denote the intrinsic contact angles of the two components, and the area fraction of total area is f1 and f2. (C) Schematic diagram of Wenzel and Cassie models. Fluoroscopic images (D) and coverage rate (E) of E. coli adhesion on the patterned silicon surface.
To better understand the effect of air cushion inside microcavity on bacteria distribution, we treated the nanowire-based microcavity patterned surface of 10 µm diameter with O2-plasma to dislodge air cushion from microcavity and improved the hydrophilic property. As shown in Fig. 5C, the contact angle of the surface decreased to 8.10° after O2-plasma treatment, which suggested that the wettability changed and the surface became more hydrophilic. Consistently, we observed that bacteria solution wicked into the 10 µm microcavity (Fig. 5D-E). Collectively, these results demonstrated that bacterial distribution would change with the silicon surface turning from non-wetting status to wetting status.
4 Conclusion and future work
The microstructure of material surface plays a vital role in the bacteria enrichment and selective distribution. In this study, based on the Cassie-Baxter model in the infiltrated interface system, microcavity patterned surfaces with different diameters and centre distances were prepared by photolithography and wet etching technology, and the effect of surface topography and wettability on bacterial distribution were explored. The aperture size and the shape of micrococavity can determine whether bacterial suspension enable to occupy the microcavity interior. The microcavity with 10 µm diameter can prevent the immersion of bacterial suspension by utilizing the air cushion formed inside the microcavity. Additionaly, the air cushion is quite stable, and the bacterial suspension remained outside the micorcaviy for hours. While, when we used the O2-plasma to treat materials surface or reduce the diameter of microcavity to help liqued displaced air cusion, the amount of bacterial suspesion penetrated into microcavity. The theoretical analysis showed that changing the diameter of microcavity can alter the surface wettability. In addition, compared with planar silicon, silicon wires have a stronger increase electron conductivity (Hou et al., 2011), and the densely distributed silicon nanowires were etched inside the microcavity to enhance electron transfer.
This work has provided a new idea for the design of anode and cathode materials of MFC. In the follow-up work, we will design a wearable flat plate MFC array (Fig. 6) based on the above theory and further explore its output power when provided with human sweat, as well as the conductivity of silicon nanowires.
A schematic diagram of a wearable flat plate MFC array.
Author contributions
Yifang Wang prepared the patterned surfaces. Yuting Huang designed and performed the study. Yifan Wang and Yutinghuang contributed equally to this work. Bacterial culture and analysis were performed by Yuting Huang and Hui Che. Some parts of draft were written by Biaowen Wei, and Liyuan Zheng reviewed and edited the manuscript.
CRediT authorship contribution statement
Yifan Wang: . Yuting Huang: . Hui Che: . Biaowen Wei: . Liyuan Zheng: Funding acquisition, Conceptualization.
Acknowledgements
The funding sources is from Guangdong Medical University. The Grant number is 4SG24215G.
Declaration of competing interest
The authors declare that they have no known competing financial interests or personal relationships that could have appeared to influence the work reported in this paper.
References
- Microchem. J.. 2022;172:106980
- Desalination Water Treat.. 2021;214:379-389.
- Planta.. 1997;202:1.
- Nat Rev Microbiol.. 2018 Oct;16(10):616-627.
- Transactions of the Faraday Society.. 1994;40(1)
- ACS Appl Mater Interfaces.. 2018;10(17):14389-14398.
- ACS Appl. Mater. Interfaces. 2009;1:136-143.
- Nanotechnology. 2011;22(49):494007
- Adv. Mater.. 2002;14(24)
- Graham M V. State University of New York at Albany. 2014.
- Nano Lett.. 2010;10:3717-3721.
- Langmuir. 2011;27:2686-2691.
- Appl. Microbiol. Biotechnol.. 2011;92:283-294.
- Acta Biomater.. 2010;6:1107-1118.
- Joule. 2020;4:2149-2161.
- ACS Applied Materials & Interfaces. 2013;5(22):11900-11905.
- Colloids Surf., B. 2010;76:104-111.
- A. Chemosphere. 2022;296:133983
- Nano Energy. 2020;75:104994
- Food Control. 2016;68:344-351.
- Soft Matter. 1844;2013:9.
- Soft Matter. 2013;9:1844-1851.
- Langmuir. 2009;25:8161-8169.
- Langmuir.. 2011;27(15):9597-9601. 2
- Environ Res.. 2022;210:112930
- J. Mater. Sci.. 2022;57:16739-16754.
- Biosens. Bioelectron.. 2021;186:113293
- Langmuir. 2008;24:4931-4937.
- J Dent Res.. 2015;94:8.
- Sustain. Energy Technol. 2021(Aug.):46.
- Journal of Forestry Engineering. 2021;6(2):1-11.
- Beilstein J Nanotechnol.. 2014;10(5):1501-1512.
- J Biomater Appl.. 2014;29:10.
- SIAM Journal on Applied Mathematics. 2010;70(7/8):2929-2941.


