

Translate this page into:
Effect of MoS2-PEG nanozymes on tumor cell multiplication
⁎Corresponding authors at: 393#, Binshuixi Road, Xiqing District, Tianjin 300387, China. dejunli@tjnu.edu.cn (Dejun Li), zml0506@tjnu.edu.cn (Mengli Zhao)
-
Received: ,
Accepted: ,
This article was originally published by Elsevier and was migrated to Scientific Scholar after the change of Publisher.
Peer review under responsibility of King Saud University.
Abstract
Molybdenum disulfide (MoS2), as a nanozyme, can effectively kill tumor cells by catalyzing H2O2 to produce extremely poisonous hydroxyl radical (*OH). In this work, spherical MoS2-PEG nanozymes were prepared by hydrothermal synthesis under the modification of polyethylene glycol (PEG). Firstly, XRD, XPS, SEM, TEM, and BET were used to analyze the phase, morphology, oxidation state, and distribution of each element of nanozyme. Secondly, the determination and verification of *OH as the main reactive oxygen species (ROS) in the MoS2-PEG nanozyme catalyzed Fenton reaction based on 3,3′,5,5′-tetramethyldiphenylamine (TMB) color reaction and electron spin resonance (ESR). Interestingly, MoS2-PEG nanozymes exhibited cytostatic rates of 43.9 % and 47.2 % in vitro in mouse breast cancer cell (4 T1) and mouse glioma cell (GL261) tumor cell models. In mouse fibroblast (L929) models, MoS2-PEG nanozymes showed excellent cytocompatibility and safety. Therefore, MoS2-PEG nanozyme may serve as an impactful drug to inhibit cancer cell growth.
Keywords
MoS2-PEG nanozymes
Fenton reactions
Inhibit tumor
Hydrothermal synthesis

1 Introduction
To date, surgical resection, radiation, and chemotherapy are still the principal remedies for cancer. Nevertheless, they cannot completely eradicate tumors due to their shortcomings, such as surgical resection is difficult to remove residual tumor cells, highly penetrating ionizing radiation during radiotherapy inevitably causes damage to normal cells, chemotherapy drugs do not have targeting effects or have relatively low targeting efficiency, and normal cells can cause strong cytotoxicity after phagocytosis (Brincker and Wilbek, 1974; Hur and Yoon, 2017; Wang et al., 2018; Deng et al., 2012). As a result, there is an immediate demand to explore a reliable and secure approach to tumor treatment. So much research has been undertaken recently on the development of reliable and efficient nanoplatforms for tumor-targeted therapy (Wang et al., 2019; Gong et al., 2020a; Gong et al., 2020b). Nanozymes have been reported for biotherapeutic applications, including oncology treatment, antimicrobial applications, anti-infection and non-invasive treatment of neurotrauma (Huo et al., 2019a; Huang et al., 2019; Huo et al., 2019b; Yan et al., 2019). The proposal of nano-catalytic medicine (NCM) has brought a safe and efficient approach and strategy for tumor treatment (Lin et al., 2018). The Fenton reaction, as a typical kind of advanced oxidation processes (AOPs), induces apoptosis and necrosis of tumor cells by introducing safe and non-toxic nanozymes into an acidic solution of hydrogen peroxide (H2O2) in vitro or in the tumor microenvironment (TME) in vivo to initiate relevant enzymatic reactions that catalyze the decomposition of H2O2 and produce extremely harmful hydroxyl radical (*OH) (Zhu et al., 2021; Cao et al., 2020). In addition to raising the concentration of reactive oxygen species (ROS) in cells, the produced *OH species also cause the expression of apoptotic proteins and further damage the DNA strands of cells (Dizdaroglu et al., 2012; Noh et al., 2015). Therefore, the use of nanozymes in situ catalysis to produce *OH is one of the effective strategies to prevent tumor cell proliferation. Unfortunately, because of the poor biodegradability of these inorganic catalysts, they still face considerable challenges in clinical applications. Scientists are increasingly focusing on the logical development and research of nanozymes with excellent performance and biodegradability (He et al., 2016; Fan et al., 2018). As a main representative of transition metal dihalides, molybdenum disulfide (MoS2) has indeed been widely applied in catalytic and nano-catalytic medicine due to its extremely high surface area, abundant defects, and sulfur vacancies (Wang et al., 2021; Luo et al., 2022; He et al., 2020; Tao et al., 2017; Feng et al.,2022; Dong et al.,2020). The abundant surface-active sites and sulfur vacancies of MoS2 increase the electron density on its surface, which is conducive to H2O2 capturing electrons more easily and catalyzing the Fenton reaction to produce *OH, causing tumor cells apoptosis (Yang et al., 2022; Yang et al., 2020; Lu et al., 2020; Wang et al., 2023).
In this work, MoS2-PEG nanozymes were prepared by hydrothermal synthesis, which could be used to effectively inhibit tumor cell proliferation in response to the Fenton reaction. By constructing two tumor cell models, mouse breast cancer cell (4 T1) and mouse glioma cell (GL261), the mechanism of tumor cell inhibition by this nanozyme was explored. The results showed that MoS2-PEG nanozymes selectively and efficiently inhibited the growth of tumor cells, while the normal cells were not harmed, in response to the overexpression of H2O2 and the slightly acidic nature of cancer cells as well as the generation of a significant amount of *OH catalyzed by Fenton reaction (Sch. 1.).
2 Materials and methods
2.1 Preparation of MoS2-PEG nanozymes
Typically, 1.235 g (NH4)6Mo7O24·4H2O (99 %, Aladdin), 2.284 g thiourea (99 %, Aladdin), and 1.083 g polyethylene glycol (PEG-8000, 99 %, Aladdin) (Mo:S = 1:3, PEG: 3 wt%) were mixed in 35 mL of deionized water with stirring vigorously to make the solution even. After ultrasound (KH-600KDB, Kunshan Hechuang Ultrasonic Instrument Co., Ltd.) for 40 min, the solution was transferred to 50 mL polytetrafluoroethylene lined, and the mixture was processed in a program-controlled blast oven at 220 ℃ for 24 h. When the reaction system was reduced to ambient temperature, the muddy black sediment was collected by centrifugal machine at a speed of 9000 rpm. To eliminate additional contaminants, the precipitate was washed three times and then dried at 80 ℃ for 12 h. Black MoS2-PEG nanozymes were collected for subsequent experiments. Different from the preparation method of MoS2-PEG, the preparation of MoS2 did not include PEG-8000, and the other preparation conditions were the same.
2.2 Material characterization
The structure and phase distribution of samples were collected by XRD (D8 Advanced, Bruker, Germany) with Cu Kβ (40 kV, 30 mA, step 10°/min). The surface appearance of MoS2-PEG nanozymes was examined by SEM (SU-8010, Hitachi, Japan). The chemical states and binding energies of MoS2-PEG nanozymes were evaluated by XPS (Thermo Scientific ESCALAB 250Xi, USA). The binding energies of C 1 s (284.8 eV) were used for energy calibration. The fine structure and elemental distribution of the samples were analyzed by TEM (Thermo Fisher Talos F200s, USA). TMB chromogenic assays and enzyme-like activity assays of the samples were analyzed using UV–Vis (UV-3600, Japan). The hydroxyl radical and sulfur vacancy tests of the samples were obtained on ESR (Bruker EMXplus-6/1, Germany). The nitrogen sorption measurements of MoS2-PEG were performed on the automatic surface and porosity analyzer (Micromeritics, ASAP2460, USA).
2.3 Enzyme-like ability
The peroxidase-like activities of MoS2-PEG nanozymes were assessed by colorimetric experiments. The reaction system was formed by 800 µL of TMB substrate, 600 µL of acidic HAc-NaAc buffer (0.2 M, pH = 3.6), 400 µL of MoS2-PEG nanozymes (100 µg/mL) solution and 200 µL H2O2 (20 mM). The absorbance of reaction system in the presence or absence of MoS2-PEG nanozymes was investigated using the UV–Vis absorption spectrometer at 652 nm. Color changes were indicated by the peroxide-like activity of samples. In addition, H2O2 solutions at different concentrations (1 mM, 5 mM, 10 mM, 15 mM, 20 mM) were respectively added into the reaction system to explore the correlations between the enzyme-like activity of MoS2-PEG nanozymes and the concentration of H2O2 solution.
2.4 Hydroxyl radicals and sulfur vacancies evaluation
For the *OH assessment, 5,5-Dimethyl-1-pyrroline N-oxide (DMPO) was used as hydroxyl radical trapping agent. DMPO (12 µL) was mixed in the reaction system (PBS, pH = 7.4, 50 µL, or HAc-NaAc buffer, pH = 6, 50 µL) containing H2O2 (300 µM, 70 µL) and MoS2-PEG nanozymes (1 mg/mL, 70 µL). Compared with the treatment group, the blank control group did not contain H2O2 solution. The reaction system was evenly mixed and then transferred to a quartz tube for ESR test. Sulfur vacancy tests of the sample were performed on ESR spectrometer at room temperature and dark conditions.
2.5 Cell culture
4 T1 cells were raised in 89 % standard RPMI 1640 (Gibco, China) medium mixed with 10 % fetal bovine serum (FBS, Gibco, Australia) and 1 % penicillin streptomycin solution (HyClone, Utah). GL261 cells and L929 cells were grown in 89 % H-DMEM medium containing 10 % FBS and 1 % penicillin streptomycin. All cells were grown in a 5 % CO2 direct heat and water jacket incubator at 37 °C.
2.6 In vitro cytocompatibility and cytotoxicity of MoS2-PEG nanozymes
L929 cells were used to assess the cytocompatibility of MoS2-PEG nanozymes in vitro, by a standard Cell Counting Kit-8 (CCK-8) assay. The cells were cultured into the 24-well plate (approximately 4 × 10⁴ cells per well, three wells for each concentration) for 24 h in a direct heat and water jacket incubator. Cells stick to the wall and grow overnight. Next, different concentrations of MoS2-PEG nanozymes (0, 25, 50, 100, and 200 µg/mL) were respectively lysed to the complete medium as well as L929 cells were co-incubation with samples for 24 h. After L929 cells were rewashed with PBS and stained for 2 h in serum-free medium (300 µL per well) including 3 % CCK-8 mixture. At last, 100 µL supernatant per well was immediately subjected to an enzyme-labeled instrument (ELX808IU, BioTek, USA) to detect the absorbance value at 450 nm. At each concentration, three parallel trials were carried out.
To assess the cytotoxicity of MoS2-PEG nanozymes, 4 T1 cells, and GL261 cells were chosen as the main investigation object. The two types of cells were inoculated separately into the 24-well plate for 24 h and allowed to adhere overnight. Next, the old medium discarded as well as 1 mL fresh medium (including 0, 25, 50, and 100 µg/mL MoS2-PEG nanozymes, 100 µM H2O2, pH = 6) was added to each plate. Then the cells were co-incubation with nanozymes and the CCK-8 experiment was used to evaluate the cytotoxicity. The absorbance was examined using the enzyme-labeled instrument at the wavelength of 450 nm.
2.7 In vitro staining of living / dead cells and ROS
To deeper investigate the impact of MoS2-PEG nanozymes inhibiting the growth of 4 T1 cells and GL261 cells without obvious toxic effect on L929 cells. Calcein AM and prodium iodide (PI, Beyotime) were utilized to dye cells and observed with a laser confocal microscope. 5 × 10⁵ cells (4 T1 cells, GL261 cells, and L929 cells) respectively were floated in medium (1 mL) and cultivated overnight into the glass bottom cell culture dish. Next, 4 T1 cells and GL261 cells were co-incubated in 1 mL fresh medium (including 100 µg/mL MoS2-PEG nanozymes, 100 µM H2O2, pH = 6) for 24 h. L929 cells were merely bred with MoS2-PEG nanozymes (100 µg/mL, pH = 7.4) for 24 h. After PBS rinsing, Calcein AM, PI, and detection buffer (1:1:1000) were added to the culture dish and incubated in dark for 30 min. In the end, cells were washed twice with PBS to remove excess dye solution and observed with confocal laser scanning microscopy (CLSM).
The fluorescence probe 2′,7′-Dichlorodihydrofluorescein diacetate (DCFH-DA) was chosen to explore the production of ROS in cells. 5 × 10⁵ 4 T1 cells and 5 × 10⁵ GL261 cells were respectively grown in the cell culture dish. And then, 1 mL fresh medium (including 100 µg/mL MoS2-PEG nanozymes, 100 µM H2O2, pH = 6) was added into the culture dish and further nurtured for 6 h. Next, the ROS dye liquor was added for 30 min and then rinsed the cells multiple times. Eventually, the samples were observed with CLSM.
2.8 Statistical analysis
Three parallel groups were conducted in each experimental group. All data are presented as mean ± standard deviation. The statistical significance of the data between groups was analyzed by one-way analysis of variance (ANOVA). * P < 0.05, ** P < 0.01, *** P < 0.001, **** P < 0.0001, and P > 0.05 no significant.
3 Results and discussion
In this work, the MoS2-PEG nanozymes were successfully prepared by a one-pot hydrothermal approach, whereby (NH4)6Mo7O24·4H2O and thiourea were used as the Mo and S source, and PEG-8000 was selected as a nonionic surfactant (Scheme 1a). The addition of PEG in hydrothermal reaction made the prepared MoS2-PEG nanozymes have excellent solubility and peroxidase-like activity in the current work. The XRD patterns of MoS2 and MoS2-PEG are shown in Fig. 1a. The five diffraction peaks (0 0 2), (1 0 0), (1 0 1), (1 0 3), (1 1 0) are nicely consistent with the standard pattern of 2H-MoS2 (JCPDS No. 37–1492), and no other miscellaneous peaks are seen (Li et al., 2019). It is worth noting that the diffraction patterns of MoS2 and MoS2-PEG are primely identical, indicating PEG has no impact on the high crystallinity and phase of MoS2. Further, the amount of PEG in the MoS2-PEG was assessed via TGA within the temperature range of 0 ℃ to 600 ℃ (Soltani et al., 2021; Chen et al., 2017; Wu et al., 2019; Chen et al., 2020). There is a weight loss (0.84 wt%) below 230 ℃, which can be ascribed to the removal of absorbed water. Fig. 1b demonstrates that little weight loss occurs during the heating process while a pronounced endothermic peak at around 230 ℃ to 300 ℃. The 5 wt% weight loss at around 230 ℃ to 300 ℃ is ascribed to the decomposition of the amorphous carbon present in the MoS2-PEG. The amorphous carbon corresponds to the PEG contained in the sample. Therefore, the weight loss at around 230–300 ℃could be interpreted as the decompositions of PEG in the samples. At the same time, the differential thermal analysis (DTA) of MoS2, and MoS2-PEG were shown in Fig. 1c. Compared with MoS2-PEG (red curves), the endothermic peak of MoS2 can be ignored. MoS2-PEG (red curves) shows a significant endothermic peak at 230 °C to 300° C, which is due to the elimination of PEG that is matched with the weight loss in the TGA curve. Therefore, the DTA results indicate that the modification of MoS2 by PEG is successful. To further prove the existence of PEG on MoS2-PEG nanozymes, Fourier transform infrared spectroscopy (FTIR) spectrum was performed. As depicted in Fig. 1d, the characteristic peaks of Mo-O and Mo-S vibrations at around 609 and 473 cm−1, respectively (Kasinathan et al., 2020). The peaks located at around 3415 and 1637 cm−1 are in correspondence to the stretching mode and O–H bending of the free or absorbed water in samples. The peaks at 1399 cm−1 are assigned to C–H stretching vibration and the peaks at 1107 cm−1 is assigned to the C-O stretching vibration. Specially, FTIR spectrum of MoS2-PEG and PEG exhibited strong absorption at around 1747 cm−1 corresponding to carboxyl group of PEG (Chen et al., 2017), indicating the successful presence of PEG in MoS2-PEG nanozymes. Next, the chemical states and binding energies of MoS2 and MoS2-PEG were assessed using XPS (Xie et al., 2013). The full spectrum demonstrates in Fig. 1e that the main components of MoS2-PEG are Mo and S, with a little bit of C and O. Distinctly, MoS2 and MoS2-PEG have the same constituent elements, which indicates that they were successfully prepared. In the high-resolution spectrum of Mo 3d (Fig. 1f), the two characteristic peaks at 231.14 and 228 eV are respectively assigned to Mo4+ 3d3/2 and Mo4+ 3d5/2, indicating the dominance of Mo4+ in the samples. Further, the two characteristic peaks at 162 and 160 eV in the high-resolution spectrum of S 2p (Fig. 1g) respectively are related to S2- 2p1/2 and S2- 2p3/2. The XPS spectrum of MoS2 exhibits extremely similar characteristics to MoS2-PEG, but the MoS2-PEG has a negative shift of about 1.2 eV at the same time for the Mo and S peaks (Lu et al., 2020). This means that the emergence of PEG enhances the electronegativity of the MoS2-PEG, making it more conducive to capturing electrons by H2O2 in the Fenton reactions, further promoting the production of *OH. Whereas the two characteristic peaks at 284.8 and 283 eV in the high-resolution spectrum of C 1 s (Fig. 1h) separately are corresponded to C = C / C–C and Mo-C, indicating the polymer has electron interaction with Mo, thereby forming Mo-C chemical bonds (Kumar et al., 2018). Therefore, the XPS spectrum also proves that the modification of MoS2 by PEG is successful and does not affect the atomic valence state of the material. For nitrogen sorption measurements, Brunauer–Emmett–Teller (BET) analysis and the related pore size distribution (Fig. 2) showed that MoS2-PEG nanozymes had a porous structure with a large surface area (6.56 m2/g), which was conducive to the exposure of defects and sulfur vacancies. And the pore size distribution of the MoS2-PEG is 23.64 nm.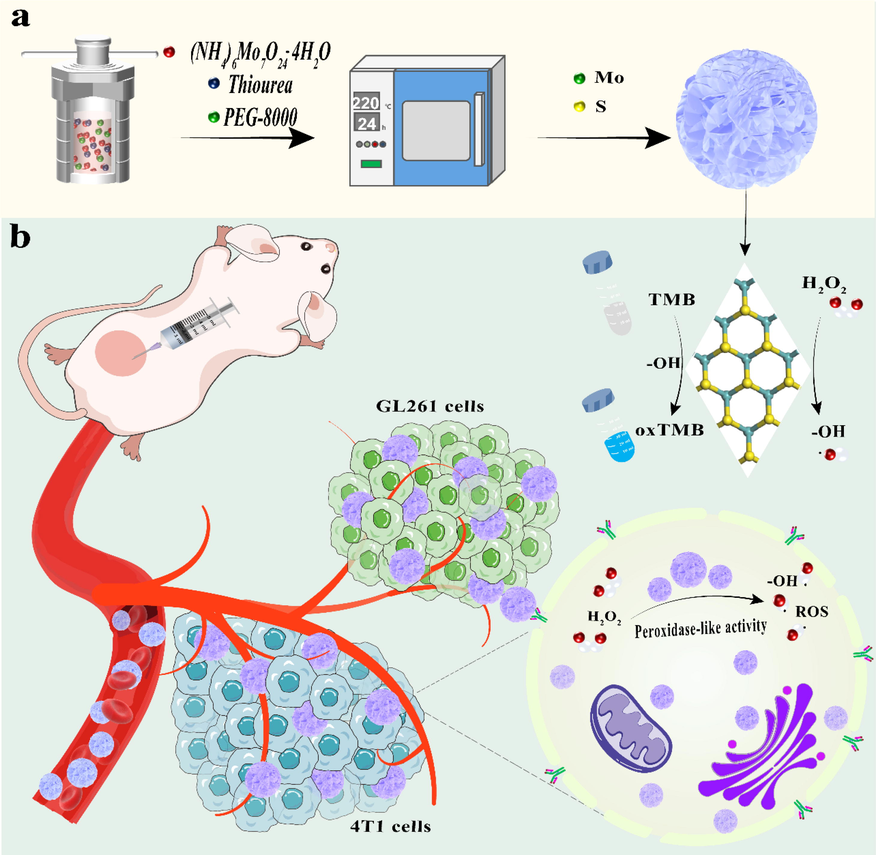
Schematic illustration of (a) one-pot hydrothermal approach to synthesize MoS2-PEG nanozymes and (b) MoS2-PEG nanozymes with peroxidase-like activity.
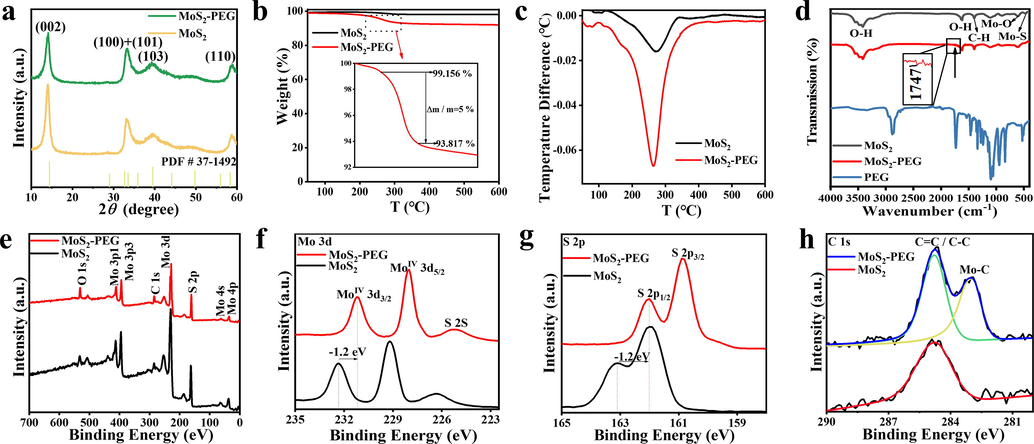
Structural characterizations of MoS2 and MoS2-PEG. (a) XRD patterns of the MoS2 and MoS2-PEG. The standard pattern of 2H-MoS2 (JCPDS No. 37–1492) is shown as reference. (b) TGA curves of MoS2 and MoS2-PEG. (c) DTA curves of MoS2 and MoS2-PEG. (d) FTIR spectrum of MoS2, MoS2-PEG, and PEG (e) XPS full spectrum of MoS2 and MoS2-PEG and high- resolution spectra of (f) Mo, (g) S, and (h) C.
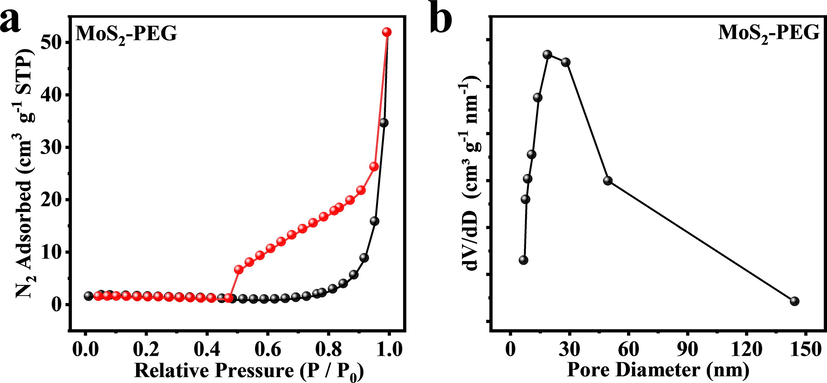
(a) N2 adsorption (black symbols) and desorption (red symbols) isotherm for the MoS2-PEG. BET surface area of the MoS2-PEG is 6.56 m2/g. (b) pore size distribution for the MoS2-PEG.
The morphological features of MoS2 and MoS2-PEG were observed in Fig. 3. In Fig. 3 (a & b), the MoS2 is of nanosheet structure with homogeneous transverse dimensions between 200 and 300 nm. Fig. 3 (c & d) reveal that the morphologies of MoS2-PEG are composed of spheres with a uniform diameter of 2–3 µm, which are stacked on top of each other by nanosheet. This means that the introduction of PEG changes the morphology of the sample from nanosheet MoS2 to microspheres MoS2-PEG. However, the spheres shown in Fig. 3d are made of ultrathin nanosheets stacked vertically, and the layers of the nanosheets are clearly separated from each other without stacking. Therefore, the change in sample morphology proves the successful surface modification of MoS2-PEG nanozymes.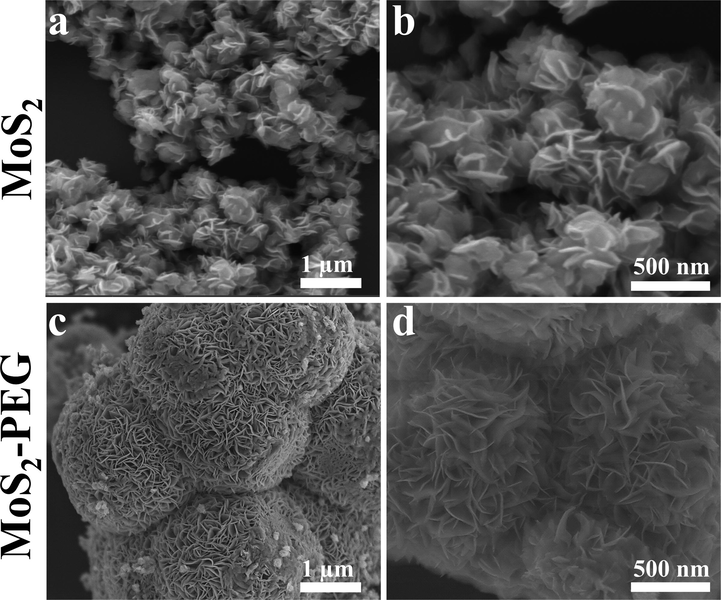
SEM images of (a, b) MoS2 and (c, d) MoS2-PEG.
As shown in Fig. 4a-d, the high angle annular dark field (HAADF) image and corresponding EDS mapping images of MoS2- PEG indicate Mo, S, and C are distributed uniformly throughout the sphere. The TEM image of MoS2-PEG (Fig. 4e) further illustrates spheres are made up of stacked rippled and wrinkled nanosheets. In the meantime, the selected area electron diffraction (SAED) image (Fig. 4f) reveals the circles can be matched to the reflections of (0 0 2), (1 0 0), (1 0 3), (1 1 0) planes of MoS2-PEG, which is well consistent with the XRD pattern of MoS2-PEG. Further, the HRTEM image (Fig. 4g) shows MoS2-PEG nanozymes have a multilayer structure. The layer spacing of 0.61 nm can be found in the bottom right corner inset, which can be matched to the (0 0 2) crystal face of MoS2, and the clear lattice fringes prove that MoS2-PEG has a good crystallization effect (Qiao et al., 2016). It is strikingly apparent that there are abundant defects at the surface, as shown in the white dotted line. Moreover, the corresponding fast fourier transform patterns (Fig. 4g inset, top right) clearly show that MoS2-PEG is a polycrystalline nanomaterial. The TEM image of MoS2 (Fig. 4h) also manifests its nanosheet morphology with uniform transverse size between 200 and 300 nm, which is compatible with the SEM results.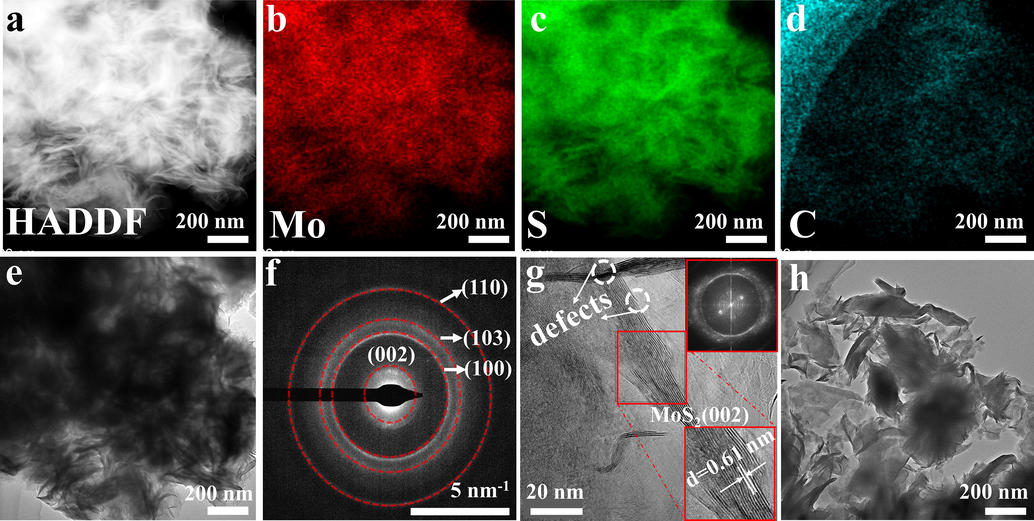
(a-d) HAADF image and corresponding EDS mappings images of MoS2-PEG. (e) TEM image of MoS2-PEG. (f) selected area electron diffraction (SAED) image of MoS2-PEG (g) HRTEM images of MoS2-PEG. The enlarged image of the selected area (inset, bottom right) and corresponding FFT patterns (inset, top right). (h) TEM image of MoS2.
The electron spin resonance (ESR) method was applied to evaluate the catalytic properties of MoS2-PEG nanozymes for the production of *OH, and the death mechanism of tumor cells was further explored in Fig. 5. MoS2-PEG nanozymes (1 mg/ml) and H2O2 (300 μM) are respectively added to acidic acetic acid-sodium acetate (HAc-NaAc) buffer (pH = 6) and phosphate buffered saline (PBS) solution (pH = 7.4), thereby mimicking the tumor cell environment and normal cell environment (Chen et al., 2012). As shown in Fig. 5a, the characteristic signals of *OH (1:2:2:1) are shown in ESR spectra (Huo et al., 2019b). Obviously, this characteristic signal intensity is much stronger in an acidic buffer than in a neutral buffer, suggesting that MoS2-PEG nanozymes have higher peroxidase activity in acidic environments and more easily initiate Fenton reactions, resulting in more *OH. Therefore, based on the characteristics of excessive H2O2 in the TME, MoS2-PEG nanozymes efficiently inhibited the growth of tumor cells by catalyzing the Fenton reaction to produce a large number of highly toxic *OH. The ESR spectra of MoS2-PEG nanozymes (Fig. 5b) exhibit standard signals at g = 2.0 belonging to the sulfur vacancies of MoS2-PEG, indicating that the MoS2-PEG nanozymes have a substantial number of sulfur vacancies (Lu et al., 2020). These vacancies and defects increase the electron density on the nanozyme surface, which favors H2O2 to obtain electrons, promoting the Fenton reaction to generate *OH. To evaluate the peroxidase-like activity of MoS2-PEG nanozymes, the UV absorption spectra at 652 nm were determined for the constructed reaction system (a-d), where the control groups were system (b-d). The reaction system (a) exhibits a distinct adsorption peak at 652 nm, and the system transforms to a blue solution, indicating that the nanozymes can catalyze the Fenton reaction to generate *OH, which can oxidize the colorless substrate TMB to a blue oxTMB (Fig. 5c). As shown in Fig. 5d, the color depth of the reaction system evolved significantly with the concentration of H2O2. It is obvious that when the concentration of H2O2 is 20 mM, the solution has the darkest color and the strongest absorbance. This demonstrated that the greater the concentration of H2O2, the more *OH produced by the MoS2-PEG nanozymes catalyzed the Fenton reaction, and therefore the greater the yield of oxTMB, which ultimately results in a darker color of the solution.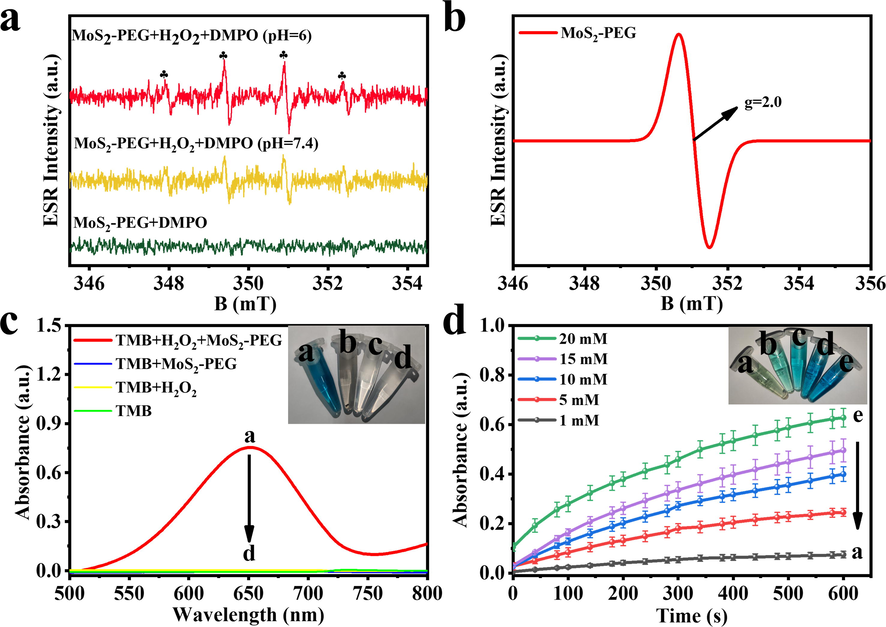
(a) ESR spectra of MoS2-PEG under various conditions. (b) ESR spectra of MoS2-PEG. (c) Ultraviolet absorption spectrum and corresponding picture of different systems. system a: TMB + H2O2 + MoS2-PEG nanozymes; system b: TMB + MoS2-PEG nanozymes; system c: TMB + H2O2 and system d: TMB. (d) Reaction–time curves of the TMB colorimetric reaction.
The in vitro inhibitory effect of MoS2-PEG nanozymes on normal cells and tumor cells was methodically analyzed by the CCK-8 method in Fig. 6. To evaluate the in vitro biosafety of MoS2-PEG nanozymes, it was co-cultured with mouse fibroblast (L929) cells for 24 h. As shown in Fig. 6a, when the MoS2-PEG nanozymes concentration is increased to 100 µg/mL, it has a negligible inhibitory effect on L929 cells compared to the control group (MoS2-PEG nanozymes concentration of 0 µg/mL). When the concentration is raised to 200 µg/mL, the cell viability is 88.8 %, exhibiting negligible cytotoxicity, therefore confirming the biosafety of MoS2-PEG nanozymes for biological normal tissues. As shown in Fig. 6b, the different concentrations of H2O2 have a negligible effect on the activity of 4 T1 cells and GL261 cells under slightly acidic conditions. It can be observed in Fig. 6c that MoS2-PEG nanozymes have no discernible inhibitory effect on 4 T1 cells and GL261 cells in a neutral environment. It is important to note that in Fig. 6d, 4 T1 cells and GL261 cells are introduced with different concentrations of MoS2-PEG nanozymes and 100 µM H2O2 (to mimic the tumor microenvironment) in an acidic medium (Huo et al., 2019a; Lu et al., 2020). When the MoS2-PEG nanozymes concentration is increased to 100 µg/mL, it can be remarkably observed that the inhibition rate of nanozymes on 4 T1 cells and GL261 cells are 43.9% and 47.2%, respectively. This excellent inhibitory effect is attributed to the fact that MoS2-PEG nanozymes catalyze the Fenton reaction in an acidic environment to produce highly toxic *OH that has an inhibitory effect on tumor cells. However, normal tissues are in a neutral environment, and the nanozymes cannot initiate the Fenton reaction to produce highly toxic *OH. Therefore, MoS2-PEG nanozymes have no significant inhibitory effect on normal tissues.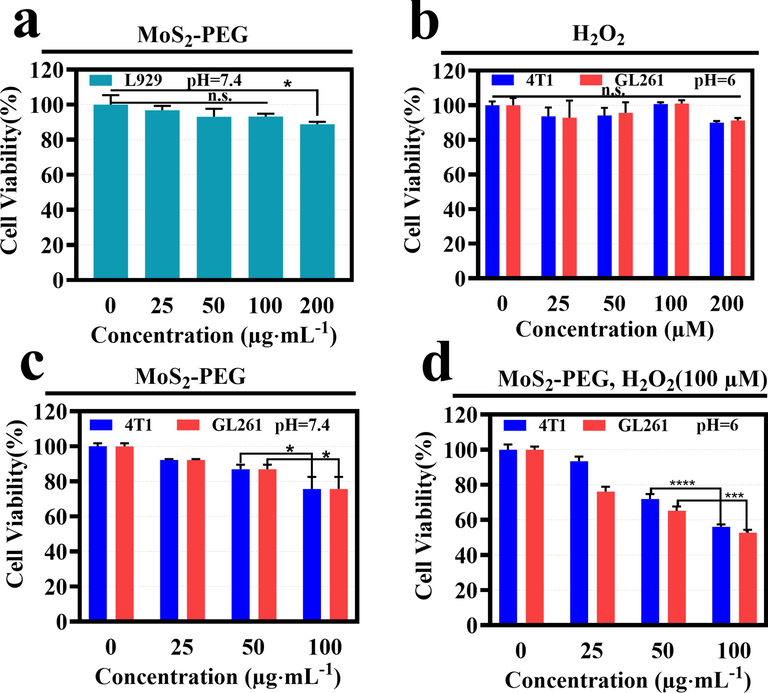
(a) Cell viabilities of L929 cells incubated by MoS2-PEG nanozymes; (b) Viability assays of 4 T1 cells and GL261 cells treated with mildly acidic culture medium (pH = 6.0) by H2O2 at various concentrations; (c) Cell viability of 4 T1 cells and GL261 cells handled with neutral culture medium (pH = 7.4) by MoS2-PEG nanozymes at different concentrations for 24 h; (d) 4 T1 cells and GL261 cells relative cell viability analyses of MoS2-PEG nanozymes + H2O2 under mildly acidic culture medium (pH = 6.0).
Cells were stained with Calcein-AM and PI to directly observe the inhibitory effect of nanozymes on tumor cells in Fig. 7. Confocal images also prove negligible and slight anticancer results of MoS2-PEG nanozymes (Fig. 7c & g) and H2O2 (Fig. 7b & f) treated group, respectively. However, MoS2-PEG + H2O2 treated group in Fig. 7 (d & h) possesses a remarkable anticancer effect, which is consistent with the conclusion of the CCK-8 experiment. Furthermore, it is further suggested in Fig. 7 (i-l) that the nanozyme has good biological safety. In the meanwhile, the ROS probe DCFH-DA was utilized to detect the generation of reactive oxygen species within tumor cells after different treated groups in Fig. 8. The colorless DCFH-DA is oxidized to green DCF by intracellular reactive oxygen species, so the green fluorescence brightness of DCF indicates the level of ROS in the cell. In Fig. 8, compared with MoS2-PEG and H2O2 treated groups, MoS2-PEG + H2O2 treated group shows extraordinary evident green fluorescence, indicating that the MoS2-PEG nanozymes have good enzyme-like activity in the MoS2-PEG + H2O2 treated group and can promote the production of ROS in cells. In general, H2O2 can promote the production of reactive oxygen species in cells. Therefore, the H2O2 treated group also shows weak green fluorescence in Fig. 8 (b & f). Finally, based on the in-situ generation of H2O2 within tumor cells, the MoS2-PEG treated group produced a small amount of bright green fluorescence in Fig. 8 (c & g).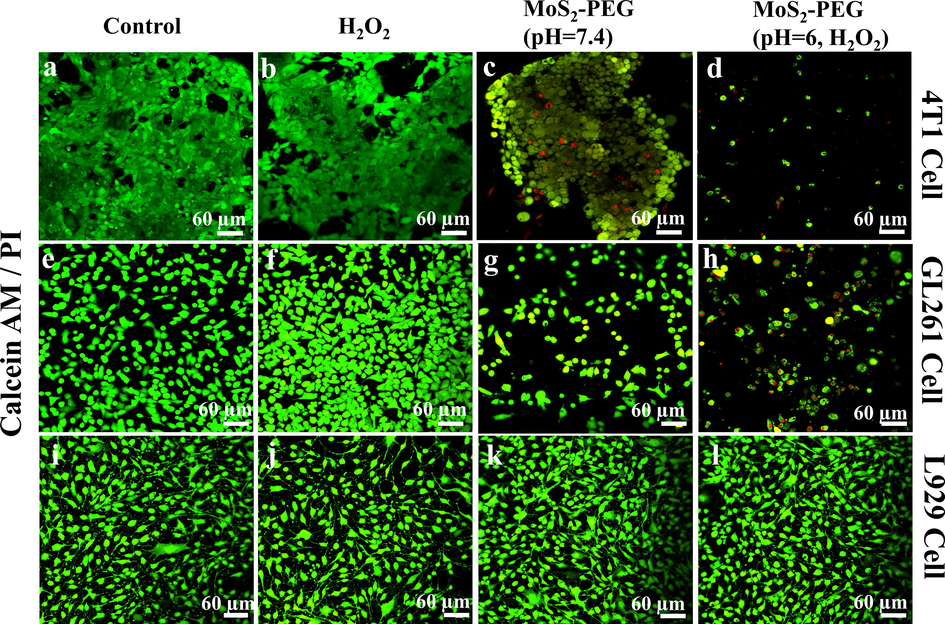
Confocal images for 4 T1 cells (a-d), GL261cells (e-h), and L929 cells (i-l) treated with MoS2-PEG nanozymes, H2O2, and their combination before Calcein-AM/PI cell-staining.
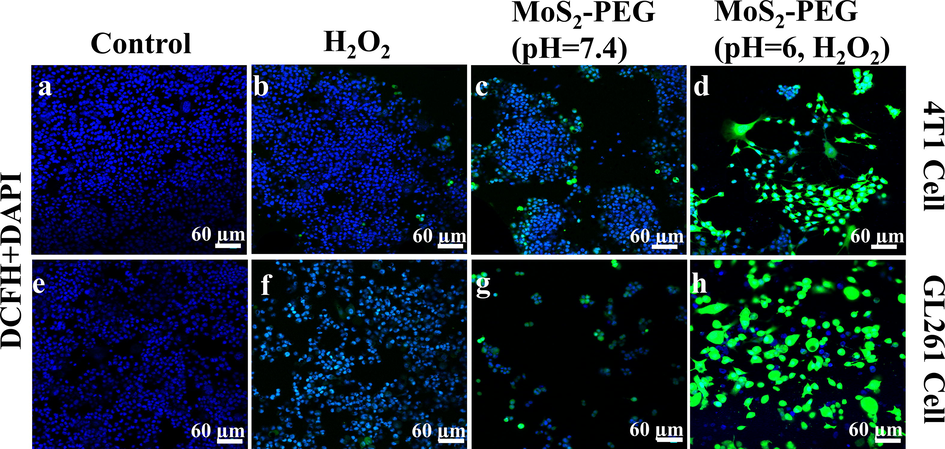
Confocal images for 4 T1 cells (a-d) and GL261 cells (e-h) stained by DCFH-DA.
4 Conclusion
In this paper, MoS2-PEG nanozymes have been successfully prepared by a pot hydrothermal method. According to research, it has great peroxidase activity and considerable biological safety, and it is projected to become a nano-catalytic medication for tumor treatment in the future. The abundance of sulfur vacancies and defects on the surface of MoS2-PEG nanozymes increases its surface electron density, making it more prone to trigger Fenton reaction. Consequently, The MoS2-PEG nanozymes can efficiently kill tumor cells by utilizing the highly toxic *OH generated by the Fenton reaction. In the meantime, in vitro cell experiments have shown that by simulating the tumor microenvironment, MoS2-PEG nanozymes have a significant inhibitory effect on tumor cells. Due to the abundant sulfur vacancies and the large specific surface area of MoS2-PEG nanozymes, surface modification to further enhance peroxidase activity is the future research direction of our research group.
CRediT authorship contribution statement
Zuoda Liu: Writing – original draft, Data curation, Conceptualization. Jianmin Feng: Methodology. Dejun Li: Funding acquisition, Supervision. Mengli Zhao: Writing – review & editing.
Acknowledgments
The authors gratefully acknowledge the financial support from National Natural Science Foundation of China (No. 51772209), Tianjin Research Program of Application Foundation and Advanced Technology (21JCZDJC00960) and Tianjin Research Innovation Project for Postgraduate Students. (No. 2022SKYZ126).
Declaration of Competing Interest
The authors declare that they have no known competing financial interests or personal relationships that could have appeared to influence the work reported in this paper.
References
- The incidence of malignant tumours in patients with respiratory sarcoidosis. Br. J. Cancer. 1974;29:247-251.
- [CrossRef] [Google Scholar]
- An enzyme-mimicking single-atom catalyst as an efficient multiple reactive oxygen and nitrogen species scavenger for sepsis management. Angew. Chem. Int. Ed.. 2020;59:5108-5115.
- [CrossRef] [Google Scholar]
- One-pot synthesis of MoS2 nanoflakes with desirable degradability for photothermal cancer therapy. ACS Appl. Mater. Interfaces. 2017;9:17347-17358.
- [CrossRef] [Google Scholar]
- PEG-assisted solvothermal synthesis of MoS2 nanosheets with enhanced tribological property. Lubr. Sci.. 2020;32:273-282.
- [CrossRef] [Google Scholar]
- Dual enzyme-like activities of iron oxide nanoparticles and their implication for diminishing cytotoxicity. ACS Nano. 2012;6:4001-4012.
- [CrossRef] [Google Scholar]
- Biodegradable polymeric micelles for targeted and controlled anticancer drug delivery: promises, progress and prospects. Nano Today. 2012;7:467-480.
- [CrossRef] [Google Scholar]
- Mechanisms of free radical-induced damage to DNA. Free Radic. Res.. 2012;46:382-419.
- [CrossRef] [Google Scholar]
- GSH-depleted nanozymes with hyperthermia-enhanced dual enzyme-mimic activities for tumor nanocatalytic therapy. Adv. Mater.. 2020;32:2002439.
- [CrossRef] [Google Scholar]
- In vivo guiding nitrogen-doped carbon nanozyme for tumor catalytic therapy. Nat. Commun.. 2018;9:1440.
- [CrossRef] [Google Scholar]
- Ultrasonic interfacial engineering of MoS2-modified Zn single-atom catalysts for efficient osteomyelitis sonodynamic ion therapy. Small. 2022;18:2105775.
- [CrossRef] [Google Scholar]
- Bimetallic oxide FeWOX nanosheets as multifunctional cascade bioreactors for tumor microenvironment-modulation and enhanced multimodal cancer therapy. Adv. Funct. Mater.. 2020;30:2002753.
- [CrossRef] [Google Scholar]
- Oxygen-deficient bimetallic oxide FeWOX nanosheets as peroxidase-like nanozyme for sensing cancer via photoacoustic imaging. Small. 2020;16:2003496.
- [CrossRef] [Google Scholar]
- Low-temperature molten salt synthesis of MoS2@CoS2 heterostructures for efficient hydrogen evolution reaction. Chem. Commun.. 2020;56:5548-5551.
- [CrossRef] [Google Scholar]
- Advances in biodegradable nanomaterials for photothermal therapy of cancer. Cancer Biol. Med.. 2016;13:299-312.
- [CrossRef] [Google Scholar]
- Nanocatalytic tumor therapy by single-atom catalysts. ACS Nano. 2019;13:2643-2653.
- [CrossRef] [Google Scholar]
- Construction of single-iron-atom nanocatalysts for highly efficient catalytic antibiotics. Small. 2019;15:1901834.
- [CrossRef] [Google Scholar]
- Molecular pathogenesis of radiation-induced cell toxicity in stem cells. Int. J. Mol. Sci.. 2017;18:2749.
- [CrossRef] [Google Scholar]
- Synthesis of biogenic chitosan-functionalized 2D layered MoS2 hybrid nanocomposite and its performance in pharmaceutical applications: In-vitro antibacterial and anticancer activity. Int. J. Biol. Macromol.. 2020;149:1019-1033.
- [CrossRef] [Google Scholar]
- Tribochemistry of contact interfaces of nanocrystalline molybdenum carbide films. Appl. Surf. Sci.. 2018;447:677-686.
- [CrossRef] [Google Scholar]
- Effect of molecular weight of polyethylene glycol on the sheet-thickness and photocatalytic performance of MoS2 nanoparticles. Appl. Surf. Sci.. 2019;469:312-315.
- [CrossRef] [Google Scholar]
- Nanoparticle-triggered in situ catalytic chemical reactions for tumour-specific therapy. Chem. Soc. Rev.. 2018;47:1938-1958.
- [CrossRef] [Google Scholar]
- Bioinspired copper single-atom catalysts for tumor parallel catalytic therapy. Adv. Mater.. 2020;32:2002246.
- [CrossRef] [Google Scholar]
- Band engineering induced conducting 2H-phase MoS2 by Pd-S-Re sites modification for hydrogen evolution reaction. Adv. Energy Mater.. 2022;12:2103823.
- [CrossRef] [Google Scholar]
- Amplification of oxidative stress by a dual stimuli-responsive hybrid drug enhances cancer cell death. Nat. Commun.. 2015;6:6907.
- [CrossRef] [Google Scholar]
- PEG assisted hydrothermal synthesis of hierarchical MoS2 microspheres with excellent adsorption behavior. Mater. Lett.. 2016;169:241-245.
- [CrossRef] [Google Scholar]
- NIPAM/PEG/MoS2 nanosheets for dual triggered doxorubicin release and combined chemo-photothermal cancer therapy. Curr. Drug Deliv.. 2021;18:1292-1302.
- [CrossRef] [Google Scholar]
- Antimonene quantum dots: synthesis and application as near-infrared photothermal agents for effective cancer therapy. Angew. Chem. Int. Ed.. 2017;56:11896-11900.
- [CrossRef] [Google Scholar]
- Single atom Ru doping 2H-MoS2 as highly efficient hydrogen evolution reaction electrocatalyst in a wide pH range. Appl Catal B-Environ.. 2021;298:120490
- [CrossRef] [Google Scholar]
- Programmed degradation of a hierarchical nanoparticle with redox and light responsivity for self-activated photo-chemical enhanced chemodynamic therapy. Biomaterials. 2019;224:119498
- [CrossRef] [Google Scholar]
- Influence of polycrystalline MoS2 nanoflowers on mouse breast cancer cell proliferation via molten salt sintering. Arab. J. Chem.. 2023;16:104596
- [CrossRef] [Google Scholar]
- Glutathione depletion in a benign manner by MoS2-based nanoflowers for enhanced hypoxia-irrelevant free-radical-based cancer therapy. Small. 2019;15:e1904870.
- [Google Scholar]
- Controllable disorder engineering in oxygen-incorporated MoS2 ultrathin nanosheets for efficient hydrogen evolution. J. Am. Chem. Soc.. 2013;135:17881-17888.
- [CrossRef] [Google Scholar]
- Nanozyme-based bandage with single-atom catalysis for brain trauma. ACS Nano. 2019;13:11552-11560.
- [CrossRef] [Google Scholar]
- Ascorbate tumor chemotherapy by an iron-engineered nanomedicine-catalyzed tumor-specific pro-oxidation. J. Am. Chem. Soc.. 2020;142:21775-21785.
- [CrossRef] [Google Scholar]
- Enhancing tumor catalytic therapy by co-catalysis. Angew. Chem. Int. Ed.. 2022;61:e202200480.
- [Google Scholar]
- Stimuli-responsive manganese single-atom nanozyme for tumor therapy via integrated cascade reactions. Angew. Chem. Int. Ed.. 2021;60:9480-9488.
- [CrossRef] [Google Scholar]


