

Translate this page into:
Effect of process production on antinutritional, nutrition, and physicochemical properties of modified sorghum flour
⁎Corresponding author at: Department of Chemical Engineering, Faculty of Industrial Technology, Institut Teknologi Sepuluh Nopember, Keputih Sukolilo, Surabaya 60111, Indonesia. gunawan@chem-eng.its.ac.id (Setiyo Gunawan)
-
Received: ,
Accepted: ,
This article was originally published by Elsevier and was migrated to Scientific Scholar after the change of Publisher.
Peer review under responsibility of King Saud University.
Abstract
Increasing wheat flour consumption makes increasing of wheat import value in Indonesia. Wheat flour has good nutritions, sufficient gluten compound, high glucose and high glycemic index. Therefore, substituting wheat with sorghum (local crop) which has gluten free, a low glucose and glycemic index value, can overcome food security problem in Indonesia. However, it has a high phytic acid and tannin (antinutrients). This study focuses on the reduction of antinutrients by three processes (fermentation treatment using lactic acid bacterias (LAB), including Lactobacillus bulgaricuss, Lactobacillus casei, and Lactobacillus brevis (1); NaOH solution submersion (2); and combining NaOH solution submersion followed by fermentation (3)). It was found that combining NaOH solution submersion and fermentation resulted in reduction of antinutrient contents (phytic acid decreased from 11.9% to 0.117% and the tannin decreased from 6.16% to 0.063%) and improved nutrition composition (such as protein content increased from 8.59% to 14.67%) on sorghum so that sorghum could be feasible to be an alternative source of wheat substitution in flour production. Moreover, the glucose content and glycemic Index (GI) of modified sorghum flour was decreased from 2.75 to 1.83%, and decreased from 40.79 to 36.33, respectively.
Keywords
Antinutritional
Fermentation
Glycemix index
Healthy
Physicochemical properties
Sorghum bicolor L. moench

1 Introduction
Recently, baking goods are a popular product variant in the food industry. They are including of bread, bakery, and pastry. Wheat flour is the most crucial ingredient in various commercially baked foods (Martínez et al., 2013). Increasing wheat flour consumption makes increasing of wheat import value in Indonesia, while Indonesia had a score of 18 based on the Global Hunger Index (GHI, 2021). This score indicates that Indonesia is in a moderate-risk category for food security or the food crisis. Indonesia accepts wheat imports because Indonesia's tropical climate is not suitable for wheat growth, so the wheat plant cannot be grown in Indonesia.
Wheat cereals have good nutrition and sufficient gluten content to make a typical loaf of bread without being mixed with other grains (Kanojia et al., 2018). On the other side, gluten is harmful content for people with celiac disease. Celiac disease (CD) is an autoimmune disorder characterized by symptoms caused by a unique immunological and cell structure profile triggered by gluten consumption in genetically susceptible people (Caio et al., 2019). These systemic disorders damage the small intestine lining and insufficient nutrients, such as calcium, folate, iron, and vitamins (A, D, E, K). This disease has the symptoms of gastrointestinal and extra-intestinal diseases in patients (Jnawali et al., 2016). In addition, wheat flour contains high glucose and glycemic index. This condition is not suitable for diabetics.
Therefore, an alternative cereal grain is needed to replace wheat. Barley, corn, millet, oats, rice, rye, and sorghum are some of the grains included in cereal grains (Mckevith, 2004; Curti et al., 2022). Sorghum is a gluten-free cereal that contains phenolic compounds which could inhibit tumor development, such as flavonoids. Its starches and sugars are released more slowly than those in other grains; therefore, it may be advantageous to people with diabetes (Kulamarva et al., 2009). Sorghum grain, on the other hand, has antinutrient chemicals, which limit its utilization. Tannin and phytic acid are two antinutrients of special concern, as they interfere with protein and mineral digestion, lowering nutrient bioavailability (Adeyemo et al., 2016). Tannin has antinutritional qualities because it forms compounds with carbs and proteins, preventing the body from using them. It also forms complexes with enzymes that help in carbohydrate, protein, and pectin digestion. Then they were unable to take action, resulting in a decrease in the nutritious quality of the food (Sharma et al., 2019). Phytic acid creates mixed-salt molecules when it binds strongly to metallic cations (Ca Fe, K, Mg, Mn, and Zn), decreasing the vitamins and minerals in one stomach (monogastric) animals and humans (Ram et al., 2020).
Due to these reasons, reducing antinutrients compounds (tannin and phytic acid) in sorghum is necessary. Boiling, soaking, grinding, roasting, germination, and fermentation are traditional and technology processing procedures used to lower the number of antinutrients in foods (Samtiya et al., 2020). Fermentation in food processing can help to eliminate antinutritive chemicals, improve protein digestibility, and boost the biological value of cereal crops (Handa et al., 2017). Furthermore, supplementing food substrates with essential fatty acids, essential amino acids, proteins, and vitamins, lactic acid bacteria (LAB) in fermented meals may help digestibility and nutrient quality (Nuraida, 2015).
As a result, the primary goal of this research was to look at the effects of fermentation using lactic acid bacterias (Lactobacillus bulgaricuss, Lactobacillus casei, and Lactobacillus brevis) to reduce antinutrients and to increase nutritional compounds in sorghum grain. Besides that, it also investigated the effect of pretreatment by alkali NaOH solution submersion. Then, as a sorghum flour product, chocolate brownies were analyzed by bread properties and organoleptic hedonic.
2 Material and methods
2.1 Materials
Brown sorghum seed was obtained from Jombang, East Java, Indonesia. Sorghum seeds were peeled and rinsed. The pealed sorghum was then dried in a 60 °C oven for 2 h. In the next step, the sorghum grain would be processed. Lactic acid bacteria of L. bulgaricuss, L. casei, and L. brevis were obtained from Microbiology Laboratories, Universitas Airlangga, Surabaya, East Java, Indonesia. All chemicals were purchased from Sigma-Aldrich, USA.
2.2 Starter preparation
The Erlenmeyer flasks were sterilized by autoclave at 121 °C for 15 min. After the flasks have cooled to ambient temperature, the inoculation materials could be prepared (Ravikrishna, 2013). Approximately 10 g of sorghum grain was soaked by 30 mL of distilled water in 100 mL Erlenmeyer flasks. L. bulgaricuss, L. casei, and L. brevis (1 ose) were inoculated separately then covered the top surface of the flasks with cotton and aluminum foil. Those starters were incubated at 37 °C for a certain time. The microorganism number of L. bulgaricuss, L. casei, and L. brevis were counted by hemocytometer every 1 h. Then, fitted the growth curve in OriginPro 2018 Software to define the time of moving the starter to the fermenter (1x10⁸ cell/ml of bacteria).
2.3 Process 1: Anaerobic fermentation
The Erlenmeyer was inserted into the autoclave to sterilize at a temperature of 121 °C for 15 min (Ravikrishna, 2013). Approximately 100 g of sorghum grain was soaked by 270 mL distillate water (1:3 w/v) in 500 mL Erlenmeyer flasks. Next, the samples were inoculated with 1x10⁸ cell/ml of L. bulgaricuss, L. casei, and L. brevis separately then covered the top surface of the flasks with cotton and aluminum foil. Those fermenters were incubated at 37 °C for different periods (4, 8, 12, 16, 20, 24, 28, 32, 36, 40, 44, 48, 52, and 56 h). After each anaerobic fermentation period, solid samples were filtered by a sieve, spread over metal bowls, and dried by an oven at 60 °C for 2 h. A grinder milled the sorghum to a 95 mesh size.
2.4 Process 2: NaOH solution submersion
Approximately 100 g sorghum grain was soaked by NaOH solution with several concentration variables and some periods at the temperature of 55 °C. The ratio of sorghum seeds and NaOH solution was 1:3 and 1:11 (g/mL). The concentration range was 0.03 M and 0.09 M. The time of submersion was on range 4 and 8 h. Design experiment of NaOH solution submersion was using Response Surface Methodology (RSM) Box Behnken Design on Design of Experiment (DOE) software Minitab 18.1. The continuous factor was used 15 factors. After the submersion process, the sample was dried by oven at 60 °C for 2 h. The sorghum seeds were milled by a grinder to a 95 mesh size.
2.5 Process 3: NaOH solution submersion and fermentation
The first, on process 1, was defined as the optimum setting operation with the lowest antinutrients result. Besides that, process 2 was defined as the optimum setting operation with the lowest antinutrients by box Behnken analyzed. Both optimizations were combined on one process in process 3 with the order of NaOH solution submersion process and fermentation. The sorghum seeds were milled by a grinder to 95 mesh size.
2.6 Sample analysis
A number of microbial was counted by the counting chamber method (AOAC, 2012). The antinutritional chemical and proximate composition (ash, carbohydrate, crude fiber, crude protein, fat, and moisture contents) of the raw material and fermented samples were determined using AOAC standard analytical techniques. (AOAC, 2005). The glucose and glycemic index value were identified by standard analytical techniques of AOAC (AOAC, 1980). The amylose and amylopectin contents were defined as determined by AOAC's standard analytical procedures (AOAC, 1990). Phycochemical properties were defined as determined by AOAC's standard analytical techniques (AOAC, 1995).
3 Results and discussion
Substituting wheat with sorghum which has gluten-free, a low glucose and glycemic index value, can overcome food crisis in Indonesia. It is a suitable commodity plant to be planted in mainland Indonesia. In this study, the authors arranged three processes (a fermentation process, a NaOH solution submersion process, and a combination of the previous processes) to reduce the antinutritional compounds.
3.1 Starter preparation
The purpose of making a microbial growth curve in starter preparation was to determine the incubation time for achieving 1x10⁸ cell/ml of bacteria. The growth curve can determine the growth phase consisting of the lag phase, log phase, stationary phase, and death phase. A counting chamber method (hemocytometer) was used for counting the number of bacteria (Selvakumaran and Jell, 2007). In this study, the growth curve of L. bulgaricuss, L. casei, and L. brevis was maintained at the temperature of 37 °C as shown in Fig. 1. The cell numbers of each microbe were presented in log numbers. The log phase of L. bulgaricuss, L. casei, and L. brevis occur at 1 to 25 h, at 1 to 18 h, and at 1 to 14 h, respectively. Then, the growth curve data was taken from the 0th to the 27th h for fitting on the OriginPro 2018 software. The curve fitting is to get the incubation time of each bacteria with the same value of microbial cell number used in the fermenter (1x10⁸ cell/ml of bacteria).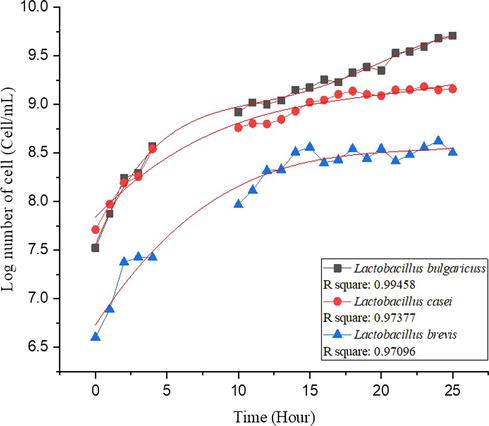
The curve fitting of microbial growth curve L. bulgaricuss, L. casei, and L. brevis.
Moreover, Fig. 1 shows that 1 ose of each microorganism has a different number of cells. L. bulgaricuss has a log number of cells of 7.52 cell/mL (3.33 × 10⁷ cell/mL), L. casei has a log number of cells of 7.71 cell/mL (5.13 × 10⁷ cell/mL), while L. brevis has a log number of cell of 6.6 cell/mL (4 × 10⁷ cell/mL). Moreover, L. bulgaricuss, L. casei, and L. brevis can reach a log number of cells of 8 cell/mL (1 × 10⁸ cell/mL) on different incubation times of 1.43, 1.13, and 8.16 h, respectively.
3.2 Proces 1: Anaerobic fermentation
The purpose of this process is to reduce tannin, phytic acids, and glucose contents in sorghum. A single complete factorial design with two factors (bacterial type and incubation time) was employed in this study. Lactic Acid Bacteria (LAB) was used in this fermentation process. Gunawan et al. (2015) investigated that L. plantarum (bacteria) was more efficient than S. cerevisiae (yeast), and R. oryzae (filamentous fungi) on modified cassava flour production. Moreover, Roger et al. (2015) revealed that LAB fermentation could reduce antinutritional contents and improve nutrition contents on food materials. Another, Casado et al. (2017) also discovered that the mechanical qualities of bread made with fermentation process were better than those of bread made without it. The fermentation process participated directly or as precursors in aroma, taste, and color.
During the fermentation process, the growth profile of each microbe is seen by making its growth curve, as shown in Fig. 2. The microbial growth curves were made based on the number of cells calculated by the counting chamber method and presented in log numbers. Samples were taken every 4 h during incubation time of 56 h. The growth phase in this anaerobic fermentation consists of the lag phase, log phase, and stationary phase. It was found that L. bulgaricuss has a log phase from 1st h to the 26th h. It is quite different from previous research by Hamidreza et al. (2016), who cultured L. bulgaricus in MRS media, log phase occurred from 1st h to the 36th h. Moreover, L. casei has a log phase from 1st h until the 20th h. Gunawan et al. (2021) had different time ranges of log time. They inoculated L. casei in bitter cassava, with the log phase occurring from 2nd h to the 24th h. Meanwhile, L. brevis has a log phase from 1st h to 16th h. It is pretty different to previous studies by Fatima (2016) reported that the log phase occurred from 2nd h to the 12th h with tomatoes juice fermentation. The most probability of the varying results is the causes of different nutrition concentrations of those media. Panesar et al. (2010) compared two different concentrations of fermentation media (MRS) proved that microorganisms are cultured from a medium with low concentration to be higher concentration will acquire a more prolonged lag phase since cells should produce enzymes for use (Panesar et al., 2010).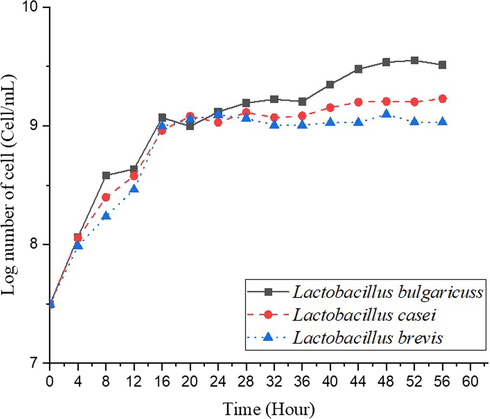
Cell growth profile of L. bulgaricuss, L. casei, and L. brevis with the same initial cell number in the fermenter.
3.2.1 Effect of fermentation on protein content
Protein is a polypeptide macromolecule composed of several l-amino acids bounded by peptide bonds. Oxygen, carbon, nitrogen, and hydrogen are the elements that makeup amino acids. Phosphorus and sulfur are also found in protein molecules, and some proteins contain metal elements such as iron and copper (Probosari, 2019). In this study, fermentation’s impact on the protein content of sorghum was studied. Protein content was increasing during the fermentation process, as shown in Fig. 3.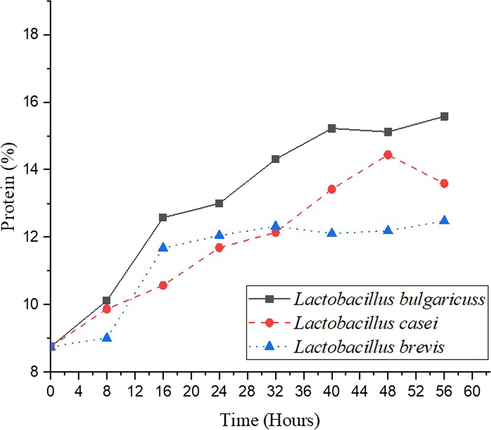
Effect of fermentation on protein content.
The protein content of sorghum fermented using L. bulgaricuss, L. casei, and L. brevis increases from 8.75 % to 15.58 %, 13.59 %, and 12.48 %, respectively. In accordance with a previous experiment by Gunawan et al. (2015), protein content from their fermentation process by L. plantarum is increasing. Enhancement of protein because of the ability of microorganisms to change substrate that includes the nitrogen and carbon to be a protein. Besides that, during the fermentation process, lactic acid bacteria produce protease enzymes. Protease enzyme causes a long polymer chain from protein to become several amino acids and peptides, increasing in the amino acid nitrogen concentration. Moreover, microorganisms utilize food substances in the substrate as energy to reproduce. The greater the number of bacteria, there will increase the protein content. The protein obtained from microbial sources is initialed as ‘Single Cell Protein’ (SCP). Single-cell protein is microbial cells grown and harvested to produce food with high protein content (Shashank et al., 2016).
3.2.2 Effect of fermentation on glucose content
Glucose is one of the monosaccharides, the building blocks of carbohydrate chemistry. Because it contains an aldehyde group and six carbon atoms, glucose is classified as an aldohexose (C6H12O6). It comes in two forms: open-chain (acyclic) and ring (cyclic). (Zaitoun et al., 2018). The glucose content of sorghum seeds was decreasing during the fermentation process, as demonstrated in Fig. 4. The glucose content of sorghum fermented by using L. bulgaricuss, L. casei, and L. brevis decreases from 2.66 % to 2.01 %, 2.17 %, and 2.21 %, respectively. The reducing glucose content during the fermentation process is consistent with the previous studies by Agnieszka et al. (2014). They reported that sugar content (glucose and fructose) was degraded in black tea and goji berries fermentation. After 6 h of black tea fermentation, 83.5 % of sugars were decreased. Decreasing of 87.3 % sugar content in goji berries fermentation was observed after 24 h. The sugar content did not reduce further, even by extending the fermentation time.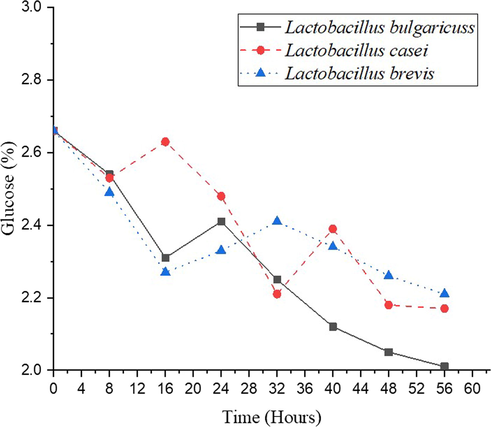
Effect of fermentation on glucose content.
3.2.3 Effect of fermentation on phytic acid content
Phytic acid (PA; myo-inositol [MI] hexaphosphoric acid) is a chemical found in various foods that binds to important minerals in the digestive tract and prevents them from being absorbed by the body. Many plant foods, such as grains, legumes (including soybeans and peanuts), seeds, and nuts, contain phytic acid or phytate (Jasia et al., 2017). The phytic acid content of sorghum seeds decreased during the fermentation process. Fig. 5 shows that the phytic acid content of sorghum by a fermentation process using L. bulgaricuss, L. casei, and L. brevis is decreasing from 11.9 % to 0.58 %, 0.71 %, and 0.96 %, respectively. The reduction of phytic acid content because microorganism activity produces phytase enzyme in the medium that hydrolyzes phytic acid (Sanjoy and Rani, 2011). In this step, fermentation could reduce phytic acid content on sorghum seeds but still higher than 0.3 %, as food maximum value standard (WHO, 2019).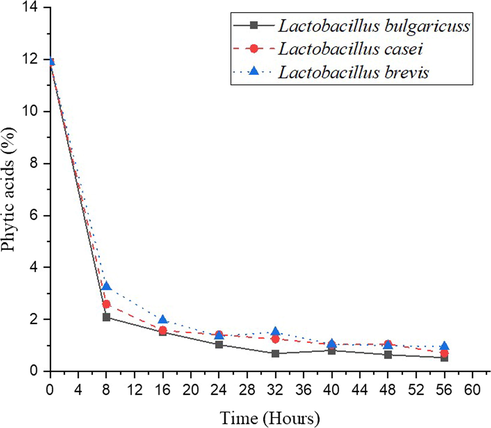
Effect of fermentation on the phytic acid content.
3.2.4 Effect of fermentation on tannin content
Tannin is an organic molecule that binds to proteins and other organic substances, such as alkaloids and amino acids and precipitates them. Tannins may reduce protein in both animals and humans digestibility by inhibiting digestive enzymes or raising fecal nitrogen by making protein partially accessible or inhibiting digestive enzymes (Gemede and Ratta, 2014). The tannin content of sorghum seeds decreases during the fermentation process, as demonstrated in Fig. 6. The tannin content of sorghum fermented using L. bulgaricuss, L. casei, and L. brevis decreases from 6.16 % to 0.36 %, 0.53 %, and 0.61 %, respectively. Microbial fermentation produces tannase enzyme. Tannase activity can degrade tannin content. In hydrolyzable tannins like tannic acid and chebulinic acid, ester and depside bonds are cleaved by it (Beniwal1 et al., 2014). In this step, fermentation could reduce tannin content on sorghum seeds but still higher than 0.3 %, as food maximum value standard (WHO, 2019).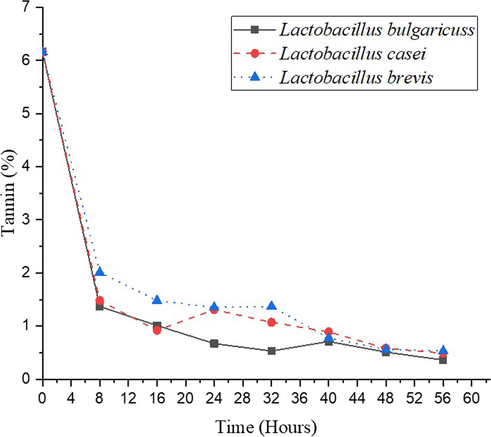
Effect of fermentation on the tannin content.
3.3 Process 2: NaOH solution submersion
The purpose of this process is to reduce the antinutrients content in sorghum seeds. Protein and glucose contents are needed analysis to ensure that this step still maintains the proximate content. This stage is carried out by soaking the sorghum seeds with NaOH solution. The design of experiment submersion using NaOH solution is shown in Table 1. Nawal et al. (2008) revealed that the tannins problem had been successfully minimized by several methods, such as soaking, fermentation, and germination. They could reduce 84 % tannin content by soaking the sorghum grain with NaOH solution (Nawal et al., 2009). The immersion temperature is maintained at 50 °C as supports the degradation process of tannins and phytic acid but does not affect the protein content of sorghum seeds. Variables of this step are ratio, concentration, and time. The ratio is compares the weight of sorghum grain (g) and solution volume (mL), on range 1:3 to 1:11, concentration starts from 0.03 M until 0.09 M. Duration of submersion is about 4 to 8 h.
No
A
B
C
Protein (%)
Glucose (%)
Phytate (%)
Tannin (%)
1
−1
−1
0
8.77
2.56
10.03
3.14
2
1
−1
0
8.67
2.65
9.87
2.85
3
−1
1
0
8.60
2.45
10.01
3.02
4
1
1
0
8.75
2.76
8.66
2.72
5
−1
0
−1
8.63
2.55
9.75
3.9
6
1
0
−1
8.78
2.54
9.76
3.53
7
−1
0
1
9.01
2.77
8.03
2.13
8
1
0
1
8.79
2.66
8.76
1.5
9
0
−1
−1
8.55
2.59
9.87
3.71
10
0
1
−1
8.67
2.75
9.05
3.48
11
0
−1
1
8.56
2.76
8.02
2.03
12
0
1
1
8.87
2.66
7.65
1.54
13
0
0
0
8.66
2.65
9.66
2.52
14
0
0
0
8.78
2.69
8.99
2.48
15
0
0
0
8.44
2.75
9.87
2.62
Based on Table 1, run order sequence on Response Surface Methodology (RSM) Box Behnken Design on Design of Experiment (DOE) software Minitab 18.1. The responses of this process are protein, glucose, phytate, and tannins content will be analyzed by Minitab 18.1. The regression result of the box Behnken for protein and glucose responses is tabulated in Table 2.
Source
Calculation of regression model
Protein
Glucose
Phytate
Tannins
P-Value
P-Value
P-Value
P-Value
Model
0.52
0.529
0.066
0
Linear
0.465
0.422
0.023
0
Ratio
0.962
0.358
0.585
0.004
Concentration
0.432
0.837
0.126
0.028
Time
0.192
0.189
0.006
0
Square
0.44
0.551
0.101
0.027
Ratio*Ratio
0.21
0.196
0.299
0.01
Concentration*Concentration
0.657
0.768
0.575
0.042
Time*Time
0.381
0.864
0.032
0.887
2-Way Interaction
0.468
0.431
0.538
0.505
Ratio*Concentration
0.415
0.312
0.259
0.966
Ratio*Time
0.246
0.631
0.476
0.299
Concentration* Time
0.53
0.241
0.65
0.299
R- square
64.76 %
64.38 %
88.19 %
99.18 %
P-value on a linear model, square model, and 2-way interaction model revealed P-value was higher than 0.05. R-square values of protein and glucose are 64.76 % and 64.38 %, respectively, so this process does not affect protein and glucose levels. This result is consistent with previous research by Nawal et al. (2009). They reported that pre-treatment alkali solution couldn’t reduce the fraction of protein, water, fiber, fat, and ash on sorghum grain.
The P-value of the regression result of the box behnken for phytic acid on the linear model is 0.023 (lower than 0.05). The P-value of regression result of the box behnken for tannin on the linear model and square model are 0 and 0.027, respectively (0.023 lower than 0.05). R-square values of phytic acid and tannins are 88.19 % and 99.18 %, respectively. The R-square value of tannin is higher than 95 %, which means that this process can significantly affect to tannin content. The reduction of tannin content is 75.65 %, from 6.16 % to 1.5 %. This result is consistent with previous research by Nawal et al. (2009). They reported that alkaline solution degrades flavon and flavonol compounds. Then tannin is a flavon compound (Nawal et al., 2009). In this step, NaOH solution submersion process could reduce phytic acid and tannin content to 6.99 % and 1.43 % on sorghum seeds, respectively. This value is still higher than 0.3 %, as the maximum standard of tannin and phytic acid content (WHO, 2019).
3.4 Process 3: NaOH solution submersion and fermentation
In process 1, the highest of reducing phytic acid and tannins content is in fermentation with L. bulgaricuss, decreasing from 11.9 % to 0.58 % and 6.16 % to 0.36 %, respectively. In process 2, NaOH solution submersion could reduce phytic acid and tannins content from 11.9 % to 6.99 and 6.16 % to 1.43 %. Phytic acid and tannin values on both processes are higher than 0.3 %, as the minimum standard of tannin and phytic acid content (WHO, 2019). So that, the author combined 2 single steps above in this process.
The proximate analysis of sorghum seeds compared the composition between unfermented and fermented sorghum seeds as shown in Table 3. 50 g of pealed sorghum seeds were analyzed for the content of water, fat, fiber, protein, ash, and carbohydrates (starch). In wet weight, the moisture content of sorghum decreased from 5.76 % to 3.18 %. For fermented sorghum grain to be used as flour, this state is favorable since decreased moisture provides better protection against spoiling microbes. Dried meals are maintained moisture levels of 7 % and below to arrest the growth of bacteria, molds, and yeasts (Prabhakar, 2014). Note: WW: Wet weight; DW: Dry Weight.
Parameter
Raw Sorghum
Peeled Sorghum
Process 1:
FermentationProcess 2:
NaOH SubmersionProcess 3: NaOH Submersion + Fermentation
SNI Standard (2009)
WW
DW
WW
DW
WW
DW
WW
DW
WW
DW
Water (%)
3.32
0
5.76
0
3.14
0
6.63
0
3.18
0
max. 14,5
Fat
2.97
3.08
2.6
2.86
0.92
0.95
2.43
2.6
1.06
1.09
–
Fiber (%)
3.61
3.74
3.3
3.62
1.96
2.02
2.61
2.79
1.96
2.03
–
Protein (%)
12.46
12.9
8.59
9.43
15.03
15.52
8.3
8.89
14.67
15.15
min 7.0
Ash (%)
1.38
1.42
1.37
1.5
0.81
0.84
1.06
1.14
0.55
0.57
max 0,70
Carbohy-drate (%)
76.25
78.96
78.38
86
78.14
80.68
78.96
84.58
78.58
81.16
–
In dry weight, fat content decreased from 2.86 % to 1.06 %. Lower fat is helpful for low-fat bakery products. For a patient with heart difficulties or at risk of lipid-induced diseases, low crude fat could be possibly be suggested as a good food supplement source (Olagbemide and Ogunnusi, 2015). During the fermenting process, the fiber content is reduced. The fiber content of the fermented sorghum sample in this study is 1.96 %. Adequate dietary fiber is essential for the proper working of the gut. It lowers the risk of certain chronic diseases, such as heart disease, diabetes, and certain cancer. For most legume grains humans consume, their fiber content ranges from approximately 0.9–5.3 % (Kamboj and Nanda, 2017). Ash content decreased from 1.50 % to 0.55 %. Flour with a lower ash content is usually better refined and includes fewer tiny bran particles. As a result, ash is widely used as an indicator of rate extraction during milling and flour purity (Czaja et al., 2020). Protein content increased from 8.59 % to 14.67 %. This result is consistent with previous research by Istianah et al. (2018). They reported that protein content in modified sorghum (filtrate and residue) is increasing. The protein content of the filtrate is lower than that of the residue (flour). It signifies that the amount of water-soluble protein detected was lower than the amount of water-insoluble protein (Istianah et al., 2018).
This third process also affects the antinutrient content in the form of phytic acid and tannins in sorghum grains. The effect of soaking sorghum seeds using NaOH solution on the phytic acid and tannin content can be seen in Table 4.
Antinutrients
Raw Sorghum
Peeled Sorghum
Process 1:
FermentationProcess 2:
NaOH SubmersionProcess 3: NaOH Submersion + Fermentation
WHO
Standard
Phytic Acid (%)
13,50
11.9
0.58
6.99
0.177
0.3
Tannin (%)
6,73
6.16
0.36
1.43
0.063
0.3
Submersion with NaOH solution and fermentation gave the effect of decreasing phytic acid from 11.9 % to 0.117 % and the tannin from 6.16 % to 0.063 %. The phytic acid and tannin content has reached the standard, indicating that sorghum seeds are suitable for human consumption and can be used as an alternative material to wheat flour (WHO, 2019). Besides that, soaking the sorghum grain with NaOH solution also impacts the sugar content and glycemic index, as shown in Table 5.
Parameter
Raw Sorghum
Peeled Sorghum
Process 1:
FermentationProcess 2:
NaOH SubmersionProcess 3: NaOH Submersion + Fermentation
(Nuzul et al., 2016)
Glucose (g/100 g)
2,69
2,75
2.01
2.28
1.83
7,34
Glycemic
Index40.76
36.33
43
The glucose content of sorghum grains was decreased from 2.75 to 1.83 %. Glycemic Index (GI) decreased from 40.79 to 36.33. The glycemic index (GI) is a dietary assessment technique that refers to the amount of carbohydrate-containing meal that causes blood sugar to rise after 2 h or longer (postprandial glycemia). GI provides clinical benefits in the prevention, management, and treatment of various of chronic diseases, including cardiovascular disease (CVD), diabetes, obesity, and cancer (Oluwole et al., 2015). The GI of carbohydrate-containing foods is in the range between 1 and 100, then classified as high (>70), intermediate (56–690, or low (<55). It all depends on how quickly the blood sugar levels rise. The GI of a food is determined by the rate of digestion and absorption of sugars and carbohydrates in that food (FAO, 1998). The high GI breaks down rapidly during digestion, but the low GI releases the glucose into the bloodstream gradually. Low-GI foods have a better reaction to postprandial glucose, resulting in a modest increase in circulating insulin and gastrointestinal hormones, which increases satiety (Bornet et al., 2007; Jenkins et al., 2002). On the other hand, a high GI diet induces increased insulin secretion, which leads to postprandial hyperinsulinemia, as well as increased hunger and food intake (Renata et al., 2011).
3.5 Physicochemical properties
The physicochemical properties of modified sorghum flour consists of amylose and amylopectin content, solubility test, swelling power test, and white degree of flour.
3.5.1 Amylose and amylopection content
Wheat flour has 25 % amylose and 75 % amylopectin. Amylopectin is made up mostly of long chains (1–4) of d-glucopyranosyl units with a few branching (1–6) links that form tandem connected clusters (each 9–10 nm long). Amylose is a linear molecule made up of (1–4) d-glucopyranosyl units (Guan-Xing et al., 2016). The amylose content of sorghum flour increased from 21.35 % to 36.51 % during the fermentation process, while the amylopectin content of sorghum flour decreased from 57.03 % to 42.07 %, shown in Table 6. A previous study by Gunawan et al. (2018) also reported that fermented sago flour with L. plantarum can increase amylose content from 20.61 % to 33.06 % because of the termination of amylopectin branches by the enzyme isoamylase at α 1–6 glycoside bonds. Therefore, the number of amylopectin branches was decreased (Gunawan et al., 2018). Amylose content affected the volume expansion of flour, and this result was consistent with the previous experiment by Ana et al. (2010). They reported that the highest amylose content of flour has the best volume expand of the result.
Parameter
Fermentation time, h
0
28
56
Amylose, %
21.35
30.56
36.51
Amylopectin, %
57.03
47.96
42.07
Solubility, %
2.33
4.98
10.53
Swelling power, %
1.96
3.53
5.79
White degree, %
31.18
35.2
4.11
3.5.2 Solubility
Wheat flour solubility has a range of 4.33–8.99 % (Saeid et al., 2015). Solubility indicates the degree to which flour is dissolved in water. Solubility is the ability of the material to interact with starch granule molecules to replace hydrogen interactions between molecules. Then granules were quickly absorb moisture and have high swelling power (Sasaki and Matsuki, 1998). Table 6 shows that the solubility of sorghum flour was increased from 2.33 % to 10.53 %. This result is consistent with a previous study by Mohamed et al. (2018). They reported that the solubility of cassava flour is increasing, causing starch granules to break during the fermentation process, and the flour has better porosity.
3.5.3 Swelling power
Swelling power is one functional characteristic of starch to support food product quality (Merynda et al., 2018). The swelling power of wheat flour is about 4.57 % (Gunawan et al., 2019). Data analysis of the effect of fermentation on swelling power in this study can be seen in Table 6. Swelling power increased from 1.96 % to 5.79 % during the fermentation process. This result is consistent with previous research by Samson et al. (2019). They reported that the swelling power of starch extracted from cassava root increases after fermentation (Samson et al., 2019). The increasing swelling power is related to the amylose content of sorghum flour. Amylose can absorb the water and expand the bread. Increasing amylose content because of pullulanase enzyme activity by lactic acid bacteria to hydrolyze α-1,6 glycosidic unit bounding of amylopectin then produce amylose chain (Gunawan et al., 2019).
3.5.4 White degree of flour
The white degree is the ability of the ingredient to reflect light on the surface area. An excellent white degree will give a good appreciation to consumers (Iswari et al., 2016). Gunawan et al. (2016) reported that the white degree of wheat is approximately 80.32 %. The white degree of sorghum flour increased from 31.18 % to 41.11 % during the fermentation time, as presented by Table 6. The fermentation process can resist Maillard reaction activity. Maillard’s reaction caused brown color on food products (Gunawan et al., 2015).
4 Conclusion
The applied fermentation or NaOH submersion processes on sorghum grain made a good impact on sorghum proximate content. The single process has not reached the quality standard of antinutritional value maximum. Phytic acid and tannin contents of sorghum flour with a combination process of NaOH solution submersion followed by fermentation were 0.177 % and 0.063 %, respectively. In this study, the combination process reduces antinutrients content and improves the nutrition composition of sorghum. Therefore, sorghum could be feasible to be an alternative source of wheat flour.
Acknowledgments
The authors gratefully acknowledge financial support from the Institut Teknologi Sepuluh Nopember for this work, under project scheme of the Publication Writing and IPR Incentive Program (PPHKI).
Declaration of Competing Interest
The authors declare that they have no known competing financial interests or personal relationships that could have appeared to influence the work reported in this paper.
References
- Reduction of antinutritional factors of sorghum by lactic acid bacteria isolated from Abacha-an African fermented staple. Front. Sci.. 2016;6(1):25-30.
- [Google Scholar]
- Fermentation of Plant Material – Effect on Sugar Content and Stability of Bioactive Compounds. Pol. J. Food Nutr. Sci.. 2014;64(4):235-324.
- [Google Scholar]
- The effects of acid and oxidative modification on the expansion properties of rice flours with varying levels of amylose. Food Sci. Technol.. 2010;43(8):1213-1219.
- [Google Scholar]
- Official Methods of Analysis of AOAC International (13th ed.). Washington DC: Association of Official Analytical Chemists; 1980.
- Official Methods of Analysis of AOAC International (15th ed.). Washington DC: Association of Official Analytical Chemists; 1990.
- Official Methods of Analysis of AOAC International (16th ed.). Washington DC: Association of Official Analytical Chemists; 1995.
- Official methods of Analysis of AOAC International (18th Ed.). Washington DC: Association of Officiating Analytical Chemists; 2005.
- Official Methods of Analysis of AOAC International (19th Ed.). Washington DC: Association of Officiating Analytical Chemists; 2012.
- Microbial Production of Tannase Microbes in The Service of Mankind. NJ: JBC Press; 2014.
- Glycemic response to foods: impact on satiety and long-term weight regulation. Appetite.. 2007;49:535-553.
- [Google Scholar]
- Effect of fermentation on microbiological, physicochemical and physical characteristics of sourdough and impact of its use on bread quality. Czech J. Food Sci.. 2017;35:496-506.
- [Google Scholar]
- Effect of sorghum flour properties on gluten-free sponge cake. J. Food Sci. Technol.. 2022;59:1407-1418.
- [Google Scholar]
- Quantification of Ash and Moisture in Wheat Flour by Raman Spectroscopy. Foods.. 2020;9(280):1-7.
- [Google Scholar]
- FAO (Food and Agriculture Organization of the United Nations), 1998. Carbohydrates in Human Nutrition. FAO Food and Nutrition Paper.
- Characterization of bacteriocin produced by Lactobacillus brevis isolated from traditional fermented tomatoes juice. Researcher. 2016;8(1):1-8.
- [Google Scholar]
- Antinutritional factors in plant foods: Potential health benefits and adverse effects. Int. J. Nutr. Food Sci.. 2014;3(4):284-289.
- [Google Scholar]
- GHI, 2021. Global Hunger Index: Indonesia, https://www.globalhungerindex.org/pdf/en/2021/Indonesia.pdf (Accessed on 17 May 2022)
- Biosynthesis and Regulation of Wheat Amylose and Amylopectin from Proteomic and Phosphoproteomic Characterization of Granulebinding Proteins. Sci. Rep.. 2016;6:33111.
- [Google Scholar]
- Effect of Fermenting Cassava with L. plantarum, Saccharomyces cerevisiae, and Rhizopus oryzae on the Chemical Composition of Their Flour. Int. Food. Res. J.. 2015;22(3):1280-1287.
- [Google Scholar]
- Effect of Initial Bacteria Cells Number and Fermentation Time on increasing Nutritive Value of Sago Flour. Mal. J. Fund. Appl. Sci.. 2018;14(2):246-250.
- [Google Scholar]
- Effect of fermentation time on the quality of modified gadung flour from gadung tuber (Dioscorea hispida Dennst.) IOP Conf. Series: Mater. Sci. Eng.. 2019;673:012002
- [Google Scholar]
- Reaction Kinetics of Lactic Acid Fermentation from Bitter Cassava (Manihot glaziovii) Starch by Lactobacillus casei. Indones J. Biotechnol.. 2021;26(1):7-14.
- [Google Scholar]
- A study on the effect of parameters on lactic acid production from whey. Pol. J. Chem. Technol.. 2016;18(1):58-63.
- [Google Scholar]
- Effect of soaking and germination on physicochemical and functional attributes of horsegram flour. J. Food Sci. Technol.. 2017;54(13):4229-4239.
- [Google Scholar]
- Application of modified sorghum flour for improving bread properties and nutritional values. Int. Food Res. J.. 2018;25(1):166-173.
- [Google Scholar]
- Pengaruh Lama Fermentasi Terhadap Mutu Tepung Cassava Termodifikasi. BPTP Sumatera Barat. 2016
- [Google Scholar]
- A review phytic acid: As antinutrient or nutraceutical. J. Pharmacogn. Phytochem.. 2017;6(6):1554-1560.
- [Google Scholar]
- Glycemic index: overview of implications in health and disease. Am. J. Clin. Nutr.. 2002;76:266S-273S.
- [Google Scholar]
- Celiac disease: Overview and considerations for development of gluten-free foods. Food Sci. Hum. Wellness.. 2016;5:169-176.
- [Google Scholar]
- Proximate composition, nutritional profile and health benefits of legumes – A review. Agric. Res.. 2017;41(3):325-332.
- [Google Scholar]
- Products and by-products of wheat milling process. Int. J. Chem. Stud.. 2018;6(4):990-993.
- [Google Scholar]
- Nutritional and Rheological Properties of Sorghum. Int. J. Food Prop.. 2009;12(1):55-69.
- [Google Scholar]
- Trends and Innovations in Bread, Bakery and Pastry. J. Culin. Sci. Tech.. 2013;11(1):56-65.
- [Google Scholar]
- Swelling power and WSI of modified Bangka sago starch. Indian J. Nat. Prod. Resour.. 2018;9(1):66-69.
- [Google Scholar]
- Optimization of the fermentation time and bacteria cell concentration in the starter culture for cyanide acid removal from wild cassava (Manihot glaziovii) MATEC Web Conf.. 2018;156:01004.
- [Google Scholar]
- Effect of alkaline pretreatment and cooking on protein fractions of a high-tannin sorghum cultivar. Food Chem.. 2009;114:649-651.
- [Google Scholar]
- A review: Health-promoting lactic acid bacteria in traditional Indonesian fermented foods. Food Sci. Hum. Wellness.. 2015;4(2):47-55.
- [Google Scholar]
- Evaluasi Kandungan Glukosa Dan Indeks Glikemik Beberapa Sumber Karbohidrat Dalam Upaya Penggalian Pangan Ber-Indeks Glikemik Rendah. Jurnal Farmasi Dan Ilmu Kefarmasian Indonesia. 2016;3(2):67-73.
- [Google Scholar]
- Proximate Analysis and Chemical Composition of Cortinarius Species. EJARBLS.. 2015;3(3):1-9.
- [Google Scholar]
- Determination of nutrient compositions, glycemic index, and anti-diabetic potentials of multi- plant based functional foods in rats. J. Food. Pharm. Sci. 2015:64-73.
- [Google Scholar]
- Production of L (+) lactic acid using Lactobacillus casei from whey. Braz. Arch. Biol. Technol.. 2010;53(1):219-226.
- [Google Scholar]
- Antinutritional factors and bioavailability: approaches, challenges, and opportunities. Wheat and Barley Grain Biofortification Book, NJ: Elsevier Inc; 2020.
- Glycaemic index and glycaemic load of breakfast predict cognitive function and mood in school children: a randomized controlled trial.. 2011;106:1552-1561.
- Nutritional Properties and Antinutritional Factors of Corn Paste (Kutukutu) Fermented by Different Strains of Lactic Acid Bacteria. Int. J. Food Sci. 2015:1-13.
- [Google Scholar]
- Comparative studies on nutritional quality of commercial wheat flour in Bangladesh. Bangladesh J. Sci. In. Res.. 2015;50(3):181-188.
- [Google Scholar]
- Effect of fermentation time on physicochemical properties of starch extracted from cassava root. Food Biosci.. 2019;33
- [Google Scholar]
- Plant food antinutritional factors and their reduction strategies: an overview. Food Prod., Process., Nutr.. 2020;2(6):1-14.
- [Google Scholar]
- Production of phytase under solid-state fermentation using Rhizopus oryzae: Novel strain improvement approach and studies on purification and characterization. Bioresour. Technol.. 2011;102(22):10641-10649.
- [Google Scholar]
- Effect of Wheat Starch on Structure on Swelling Power. Cereal Chem.. 1998;75:525-529.
- [Google Scholar]
- A guide to basic cell culture and applications in biomaterials and tissue engineering. Biomaterials, Artificial Organs, and Tissue Engineering. NJ: Woodhead Publishing; 2007.
- Health effects, sources, utilization and safety of tannins: a critical review. Toxin Rev. 2019:1-13.
- [Google Scholar]
- Microbial Protein: A Valuable Component for Future Food Security. Microbes and Environmental Management. NJ: Studium Press (USA); 2016.
- SNI standard. Wheat flour. SNI 3751, 2009. National Standardization Agency of Indonesia, Jakarta.
- WHO (World Health Organization), 2019.Codex Alimentarius International Food Standard Food. Stand. Sorghum flour (CXS 173-1989) 1–9.
- Sugars: Types and Their Functional Properties in Food and Human Health. Int. J. Public Health Res.. 2018;6(4):93-99.
- [Google Scholar]


