

Translate this page into:
Effect of seasonal variation on the chemical composition and antioxidant and antifungal activities of Convolvulus althaeoides L. leaf extracts
⁎Corresponding author at: Department of Biomedical, Dental, Morphological and Functional Imaging Sciences, University of Messina, 98125 Messina, Italy. cacciolaf@unime.it (Francesco Cacciola)
-
Received: ,
Accepted: ,
This article was originally published by Elsevier and was migrated to Scientific Scholar after the change of Publisher.
Peer review under responsibility of King Saud University.
Abstract
First characterization of the chemical profile of Convolvulus althaeoides L. leaf extracts, with a focus on polyphenol, chlorophyll and carotenoid content. Chemical and biological profiles were correlated with season variability and the difference in solvents used for extraction. C. althaeoides L. leaf extracts had great effect against Candida spp. proliferation and C. albicans filamentation. Ethyl acetate and ethanol extracts of C. athaeoides L. leaves, collected in winter and spring seasons were considered as strong anti-dermatophyte agent. All C. athaeoides L. leaf extracts demonstrated high antioxidant potential.
Abstract
The composition of polyphenols, chlorophylls and carotenoids of eight extracts of Convolvulus althaeoides L. leaves, harvested in two different seasons, winter and spring, and extracted by hot extraction method using four solvents (dichloromethane, chloroform, ethyl acetate and ethanol) with increasing polarity, were evaluated along with their antioxidant and antifungal activities. Qualitative and quantitative variations were observed in the composition based on two different high performance liquid chromatography systems, liquid chromatography-photodiode array detection coupled to either atmospheric pressure chemical ionization mass spectrometry or to electrospray ionization mass spectrometry, permitting the identification of 22 polyphenols, 11 chlorophyll derivatives and 10 carotenoid compounds. Polyphenolic compounds were predominant in extracts from leaves collected in winter, whereas pigments were predominant in the spring collections. Antioxidant activities of the extracts were determined by DPPH radical scavenging method, revealing a half inhibition concentration (IC50) ranging from 0.1369 ± 0.0272 mg g−1 to 0.432 ± 0.0018 mg g−1, with no correlation to seasonal fluctuation. Concerning antifungal assays, ethyl acetate and ethanol extracts have been shown to be the most active against dermatophytes (T. rubrum, T. menthagrophytes, M. canis), with inhibiting percentages reaching 100% with 50 mg mL−1. Moreover, ethyl acetate and ethanol extracts showed a maximum inhibition potential with minimum inhibitory/fungicidal concentrations ranging from 0.78 to 6.25 mg mL−1 on Candida spp. cultures. The winter collect of these extracts showed an inhibitory effect of 90% on Candida albicans germ tubes formation, at a concentration of 3.1 mg mL−1. In conclusion, seasonality seems to influence the quality and the quantity of natural substances from leaves of C. althaeoides L., which have major importance on the antioxidant and the antifungal effectiveness.
Keywords
Convolvulus
Polyphenols
Carotenoids
Liquid chromatography
Antioxidant activity
Antifungal activity

1 Introduction
The climate is an important seasonal parameter, directly affecting functions and structures of plant ecosystems, such as photosynthesis, transpiration, nutrient cycle and production of primary and secondary metabolic (Goyal et al., 2012). The secondary metabolites are defined as the set of chemical compounds that are not directly required for the survival of the plant but which are synthesized to increase its performances towards natural factors, pathogen attacks or nutriment deprivation. The key roles of these secondary metabolites are the protection (antioxidants) and the defense (antibiotics, insecticides and herbicides) activities against external aggressions (Arshad et al., 2017). Bioactive compounds from plant material are the chemicals that occur in small amounts in plants. Natural extracts of plants are a complex of bioactive groups, such as polyphenols, terpenoids, alkaloids and carotenoids. Indeed, phenols are one of the most bioactive compounds (Kumar and Naraian, 2019). Convolvulus is one of the most important genus of the Convolvolaceae family, it includes over than 250 species, present as herbs, shrubs and occasionally trees (Arora and Malhotra, 2011). Convolvulus scammonia, Convolvulus arvensis L., Convolvulus austroaegyptiacus, Convolvulus pilosellifolius Desr., Convolvulus pluricaulis and Convolvulus dorycnium L. are previously studied Convolvolaceae species, that have demonstrated a large panel of bioactive chemicals, specially flavonoids, alkaloids and phenolic compounds, based on different screening and identification methods (Direct Analysis in Real Time coupled to Time of Flight Mass Spectrometry (DART-ToF- MS), Matrix-Assisted Laser Desorption Ionization Time-Of-Flight (MALDI-TOF), Nuclear Magnetic Resonance (NMR)) which showed interesting antioxidant (Elzaawely and Tawata, 2012) and antimicrobial proprieties, and a neuroprotective role (Al-Rifai et al., 2017; Azman et al., 2015; Bihaqi et al., 2009; Nacef et al., 2010; Tawaha et al., 2007). In Tunisia, there are 12 species belonging to the genus Convolvulus L. (Hassine et al., 2014). The species Convolvulus althaeoides L., commonly known as bindweed (English) or “leblab elhokul” (Arabic), is a perennial herb, native to the Mediterranean region (Egypt, Libya, Tunisia, Algeria, Morocco, Palestine and Spain) (Le Houérou, 1995) and a few detailed reports on its chemical composition and biological potential are available. A recently published Tunisian study showed the chemical composition, cytotoxic effect and antibacterial activity of the essential oil from flowers of C. althaeoides L. (Hassine et al., 2014). Terpenes were the major detected compounds in C. althaeoides L. oil using gas chromatography coupled to mass spectrometry (GC and GC–MS). Anti-cancerous tests revealed a promising role of the oil towards the human MCF-7 breast cancer cells. However, no significant antibacterial effect seemed to characterize this oil. A novel acylated anthocyanintrioside was isolated from C. althaeoides L. flowers from Portugal, on the basis of MALDI-TOF and NMR spectrophotometric technologies, after extraction with methanol (MeOH) solution (Cabrita, 2015). To our best knowledge, no other investigations were done on the other organs of the plant, or revealed other biological properties. In the present study we aimed to compare the phytochemical composition of the dry extracts of C. althaeoides L. leaves harvested in two seasons (winter and spring) and extracted by different solvents. The polyphenol and carotenoid profiling of the different extracts was performed based on Liquid Chromatography coupled to Photodiode Array and MS (LC-PDA/MS) by an electrospray source (ESI) and atmospheric pressure chemical ionization interface (APCI), respectively. Moreover, the effect of seasonality on the potential antioxidant and antifungal activities was evaluated.
2 Experimental
2.1 Season description
North Africa’s eastern seaboard has a weather pattern with four distinct seasons. As tropical areas, Tunisia is characterized with a mild warm and rainy winter. This season covers the period from December to February, where the vegetation grows and blooms. Spring marks the transition from winter into summer and covers the period from March to May, where the plant flowers. Followed by a hot and humid summer, in which plant leaves dry and change color. Autumn is the last season of the year from September to November, where all the annual plants die (Thomas and Nigam, 2018; “Tunisia climate”, 2019).
2.2 Plant material
Fresh leaves of the species Convolvulus althaeoides L. were collected at first in the late of each January on the winter (none flowering period) and then in the late of March in the spring (flowering period), and this for two years (2017–2018). The plants were obtained from the same area and the same land located at Kondar (latitude 35 ͦ 49′34” N, longitude 10 ͦ 38′24” E), a rural region in the Tunisian Sahel, situated about 30 km from the north-west of Sousse governorate. The plant materials were air dried at room temperature in the shadow and ground to a fine powder, then later used for extractions.
2.3 Chemicals and reagents
Analytical grade ethanol, chloroform, ethyl acetate, dichloromethane and methanol were acquired from Merck Life Science (Merck KGaA, Darmstadt, Germany). LC-MS grade methanol 99.9%, acetonitrile 99.9%, acetic acid 99.9%, and water were obtained from Merck Life Science (Merck KGaA, Darmstadt, Germany). The employed polyphenol standards for the quantification were five, namely chlorogenic acid, gallic acid, caffeic acid, coumarin, and rutin, obtained from Merck Life Science (Merck KGaA, Darmstadt, Germany). Stock solutions of 1000 mg L-1 were prepared for each standard by dissolving 10 mg in 10 mL of methanol. Culture media were purchased from Sigma-Aldrich (CHEMIE GmBH, Riedstr, Germany). Dimethyl sulfoxide (DMSO) was purchased from BIO BASIC INC (Desk, Canada).
2.4 Preparation of plant extracts from leaves of C. althaeoides L.
Dried leaf powders were subjected to hot extraction. Briefly 100 g of the powder were extracted successively with 300 mL of solvents: dichloromethane (CH2Cl2), chloroform (CHCl3), ethyl acetate (C4H8O2) and ethanol (C2H5OH), having different polarities, for a time of 90 min for each solvent, considering the corresponding boiling temperature (CH2Cl2 at 40 °C, CHCl3 at 61 °C, C4H8O2 at 77 °C and C2H5OH at 78 °C). For each solvent the obtained solution was filtered through a filter paper under reduced pressure to obtain a liquid extract and solid residue. Extracts were evaporated using a Rotavapor (heidolph VV2000) to obtain a dry extract, and the residue was subjected to a next extraction.
2.5 Chemical analysis
2.5.1 Polyphenol analysis by LC-PDA-ESI/MS
Polyphenol analysis was preceded by a sample preparation, in which the dichloromethane and the chloroform extracts were redissolved in 1 mL chloroform (10 mg), the ethyl acetate and ethanol extracts were redissolved in 1 mL methanol (10 mg). The obtained solutions were subsequently filtered through a 0.45 μm Acrodisc nylon membrane (Merck Life Science, Merck KGaA, Darmstadt, Germany) prior to HPLC-PDA-MS analysis.
Calibration curves for polyphenol quantification were recently reported by Haoujar et al., 2019.
LC analyses were performed on a Nexera-e liquid chromatograph (Shimadzu, Kyoto, Japan), consisting of a CBM-20A controller, two LC-30AD dual-plunger parallel-flow pumps, a DGU-20A5R degasser, a CTO-20AC column oven, a SIL-30AC autosampler, an SPD-M30A photo diode array detector and an LCMS-8050 triple quadrupole mass spectrometer, through an ESI source (Shimadzu, Kyoto, Japan). Separations were carried out on an Ascentis Express RP C18 column (2.7 µm, 150 mm, and 4.6 mm) (Merck Life Science, Merck KGaA, Darmstadt, Germany). The mobile phase was consisted of water/acetic acid (99.85/0.15 v/v, solvent A) and acetonitrile (solvent B), with the following gradient elution: 0–5 min, 5% B, 5–15 min, 10% B, 15–30 min, 20% B, 30–60 min, 50% B, 60 min, 100% B. Photodiode array detector was applied in the range of λ = 200–400 nm, where polyphenols were detected at λ = 280 nm (sampling frequency: 40 Hz, time constant: 0.08 s). MS analysis was performed in negative and positive ion mode and scan range was set at m/z 100–800; scan speed of 2500 u sec-1; the conditions of ESI were as follows: event time 0.3 sec; nebulizing gas (N2) flow rate 1.5 L min−1; drying gas (N2) flow rate, 15 L min−1; interface temperature: 350 °C; heat block temperature: 300 °C; DL (desolvation line) temperature: 300 °C; DL voltage: 1 V; interface voltage: −4.5 kV; Qarray DL voltage 0 V. Data acquisition and processing were performed by means of the LabSolution software, version 5.65 (Shimadzu, Kyoto, Japan).
2.5.2 Carotenoid analysis by LC-PDA-APCI/MS
In order to determine the carotenoid content, 200 mg of each extract were dissolved in 1 mL of methanol/methyl tert-butyl ether (v/v) mixture solution. The obtained solutions were filtered through a 0.45 µm Acrodisc nylon membrane (Merck Life Science, Merck KGaA, Darmstadt, Germany) prior to be analyzed by HPLC-PDA-APCI/MS.
For the characterization of the native carotenoid composition, a Nexera X2 liquid chromatography system (Shimadzu, Milan, Italy), consisting of a CBM-20A controller, two LC-30AD dual-plunger parallel-flow pumps, a DGU-20 A5R degasser, a CTO-20AC column oven, and a SIL-30AC autosampler was employed. A 0.1 mm I.D. stainless steel tube (zero dead volume) was used for the linkage between the column connection and the SPD-M30A diode array detector. The LC system was coupled to an LC-qMS-2020 mass spectrometer through an APCI source (Shimadzu, Kyoto, Japan). Separations were carried out on a 250 mm × 4.6 mm i.d., 5 μm, YMC C30 column. The mobile phases were: A (MeOH/MTBE/H2O, 81:15:4, v/v/v) and phase B (MeOH/MTBE/H2O, 15:81:4, v/v/v); a linear gradient program was used as follows: 0–20 min, 0% B, 20–140 min, 100% B, 141–150 min, 0% B. The flow rate was set at 0.8 mL/min, the injection volume was 20 µL, the column temperature was maintained at 35 °C, the UV/vis spectra were acquired between 220 and 700 nm, and the chromatograms were processed at 450 nm. The MS detection was achieved through an APCI interface operated in both positive and negative ion modes; detector voltage: 1.05 kV; interface temperature: 350 °C; DL temperature: 300 °C; heat block temperature: 300 °C; nebulizing gas flow (N2): 2.0 L/min; drying gas flow (N2): 5.0 L/min; full scan range (positive and negative ion mode): 300–1200 m/z; event time: 0.2 s. Data acquisition and processing were performed by means of the LabSolution software, version 5.93 (Shimadzu, Kyoto, Japan).
2.6 In vitro antioxidant activity
The antioxidant activity of C. althaeoides L. leaves was evaluated using the DPPH (radical 2-2′-diphenyl-1-picrylhdrozyle) radical scavenging method (Mahfoudhi et al., 2016). Two mg of each dry extract was dissolved in 1 mL of ethanol and six concentrations from 2 to 0.0625 mg mL−1 were obtained with two folds serial dilution of the first solution. Then, 100 µL of each sample were mixed with 100 µL of DPPH dissolved in ethanol (1 mM), the control contained 100 µL of DPPH solution mixed with 100 µL of ethanol. The antioxidant activity of the eight studied extracts, with respect to the DPPH were determined using a UV–visible spectrophotometer at λ = 517 nm (Nanodrop, 2000) after 30 min of incubation at room temperature in obscurity conditions. The decrease in absorbance was converted to inhibition percentage radical scavenging (I%) according to the formula: I%= [(A0-A1)/A0]x100, with A0: absorbance of control solution (DPPH) and A1: absorbance of tested solution (extract/ethanol). The ascorbic acid standard was treated as a sample and was used for comparison. The half inhibitory concentration of a test sample is the concentration for which the extract inhibits 50% (IC50) of DPPH radicals, was determined from the DPPH inhibition curve for each sample, traced with values corresponding to different concentrations.
2.7 Antifungal activity
2.7.1 Strains and culture media
Antifungal activity of the different extracts was evaluated against yeast, dermatophyte and Aspergillus strains: two Candida spp. strains from the American type Culture Collection ATCC (Candida albicans ATCC® 90028™ and Candida glabrata ATTC® 64677™) and one clinical Candida strain isolated from a clinical hand nail sample (Candida tropicalis 988); three dermatophyte Microsporum canis MS 8972, Trichophyton metagrophytes MS45 and Trichophyton rubrum MS 7793.1 isolated from clinical scalp samples, and four Aspergillus isolated from clinical nail samples (A. niger, A. flavus, A. fumigates and A. terreus). The fungal clinical isolates were identified by the professional team in the laboratory of parasitology and mycology of the teaching hospital Fattouma Bourguiba (Monastir-Tunisia). Before the antifungal sensitivity tests, each fungal strain was maintained on the Sabouraud dextrose agar (SDA) medium.
2.7.2 Antifungal toxicity screening assay
The evaluation of the potential antifungal activity was performed based on the food poisoning method. Extracts and plant powder were directly incorporated in SDA at a final concentration of 100 mg mL−1 and 10%, respectively, then cooled in 24 wells culture plates at 45 °C, and let to solidify at room temperature before to be incubated overnight at 30 °C for sterility test. Fungal inoculums were prepared from fresh cultures of Candida spp. (24 h) and Aspergillus spp. (72 h) in sterile distilled water, and adjusted to 104 UFC mL−1 using a Malassez Counting Chambe. Plates were inoculated with 10 µL of each inoculum and incubated in 30–35 °C for 24 h-72 h, depending on the strain. Two millimeter plug from 7 days culture of dermatophytes were cut and deposit on each extract-SDA well to control the mycelial growth. Controls consisted of free extract/antifungal SDA medium wells. In order to control the sensitivity of the Candida spp. and Aspergillus spp. strains, the antifungal drug Amphotericin B was incorporated to a concentration of 16 µg mL−1. The experiments were performed twice. Fungal growth was visibly controlled and the percentage of inhibition (I%) was estimated in relation to the number of colonies/radial mycelium growth counted in the growth control well and calculated according to the following formula: I%=[(NCC-NCE)/NCC] × 100, NCC: Number of Colonies/radial growth on the control-SDA, NCE: Number of Colonies /radial growth on the extract-SDA.
2.7.3 Determination of minimum inhibitory concentration (MIC)
2.7.3.1 Anti-candidal activity
The minimum inhibitory concentration (MIC) of an antifungal agent was determined against the three Candida spp. (C. albicans, C. glabrata and C. tropicalis) using a colorimetric assay with resazurin redox indicator, in 96-well microplates, according to the microdilution method where MIC was recorded as the lowest concentration required to inhibit fungal growth. The extract solutions used in the test were prepared at a concentration of 200 mg mL−1, dissolved in 10% DMSO solution. The control antifungal solution (Amphotericin B) was prepared in sterile distilled water at a concentration of 16 µg mL−1. Two hundred microliters of each extract solution were introduced in the first well of the sterile 96-well culture plate and subjected to twofold dilution in RPMI 1640–2% glucose (100 µL deposit in the remaining wells), to obtain a range of concentrations decreasing from 100 to 0.195 mg mL−1. A positive (RPMI 1640–2% glucose with inoculum) and negative (RPMI 1640–2% glucose) controls growth were included in all trials and experiments were performed twice.
2.7.3.2 Anti-dermatophytic activity
Minimum inhibitory concentration (MIC) of plant powder and active extracts of C. althaeoides L. leaves against three clinical strains of dermatophytes (M. canis, T. rubrum and T. metagrophytes) were evaluated using cultures in 24-wells macro-plates. Five percentages 7.5%, 5%, 2.5%, 1%, 0.5% for plant powder and four concentrations ranging from 50 to 6.25 mg mL−1 of each extract were incorporated in a final volume of 1.5 mL of SDA medium. A substance free well served as negative control to follow the dermatophyte growth in normal conditions. Antifungal activity tests were performed by placing 2 mm mycelial agar discs, cut from the actively growing culture of 7 days old in the centre of each well, including the negative control. Radial growth was surveilled 7 days after incubation at 28 °C, until the negative control reaches the well borders. The percentage of growth inhibition of each extract was calculated by the formula: % I inhibition = [growth in control - growth in sample/ growth in control] × 100. Concentrations giving moderate inhibition, were examined by light microscopy in the presence of lactophenol bleu.
2.7.4 Inhibition of hyphae formation in Candida albicans
In the present work, we aimed to estimate the effect of our extracts on C. albicans morphology. Initially, 3 to 5 colonies of 24 h C. albicans growing on SDA media were transferred to a test tube containing 10 mL of YDP (Yeast extract-peptone-dextrose) medium and incubated at 30 °C during 24 h. In sequence, the solution was diluted 1:30 in YDP medium, containing 10% of foetal calf serum (Eurobio) to obtain a final concentration of strain 1 × 10⁶ CFU mL−1. Then, 100 mg of each extract were diluted in 1 mL of 10% DMSO solution. Then, 200 µL of each sample were twofold diluted in YDP medium resulting in concentrations from 100 to 0.195 mg mL−1. Finally, 100 µL of the inoculum were add to all the plat wells and incubated for 3 h in 37 °C. The minimal inhibitory filamentation concentration (MIFC) was then determined by estimating the number of hyphae formes of C. albicans compared to simple cell forms, using light microscopy. Plats were re-incubated for 24 h and MIFC were checked again.
2.8 Statistical analysis
Principal component analysis was performed using MVSP 3. 20, elucidate the correlation between different chemical compounds across the type of extract and season variation. IC50 values for DPPH radical scavenging method were calculated and the percentages of inhibition were illustrated in graphs using the software GraphPad Prism version 8. 0. (GraphPad Software Inc., La Jolla, CA). One-way analysis of variance (ANOVA) with Tukey’s post hoc test was used on data obtained from antifungal activity using the same software.
3 Results and discussion
3.1 Extraction of secondary metabolites
Hot extraction was followed by fractionation and adapted to give four different extracts yielding 2.23 and 2.06% for dichloromethane, 2.50 and 2.34% for chloroform, 1.98 and 1.81% for ethyl acetate and 2.45 and 2.37% for ethanol for winter and spring harvests, respectively. The usefulness of different solvents with decreasing polarity is related to obtain the maximum of chemical compounds that the plant biosynthesis. The obtained extracts were subjected to chemical and biological investigations, to evaluate their potential antifungal and antioxidant activities, and show its relationship with chemical structures (qualitative and quantitative) and seasonal fluctuation.
3.2 Chemical analysis
3.2.1 Identification of polyphenolic compounds of C. Althaeoides L. Leaves from different seasons
LC-PDA-ESI/MS analyses were carried out on each extract of C. althaoides L. leaves from different seasons to compare its polyphenol composition. The identification of twenty two polyphenol compounds was based on the comparison of UV–Visible absorption (λmax) and specific mass-to-charge ratio (m/z) with data reported by previous literature (Table 1).
No
Compounds
tR (min)
UV
Formula
[M−H]-
Major fragments
Ref
1
Quinic acid
1.7
275
C7H12O6
191
173
(Mighri et al., 2019; Rameshkumar et al., 2013)
2
Gallic acid
4.4
263
C7H6O5
169
–
(Mighri et al., 2019)
3
Caffeic acid hexoside
12.3
247,326
C15H18O9
341
313
(Rameshkumar et al., 2013)
4
Caffeic acid hexoside
13.8
240,321
C15H18O9
341
137
(Rameshkumar et al., 2013)
5
Chlorogenic acid
15.1
222,245, 324
C16H18O9
353
355*,191 , 163*
(Mighri et al., 2019; Li et al., 2017; Hegab and Abdelgawad, 2010)
6
Caffeic acid hexoside
15.5
241, 324
C15H18O9
341
313
(Rameshkumar et al., 2013)
7
Caffeic acid
16.7
220, 241, 322
C9H8O4
179
181*, 163*
(Mighri et al., 2019; Rameshkumar et al., 2013; Hegab and Abdelgawad, 2010)
8
Caffeic acid hexoside
20.8
215, 325
C15H18O9
341
–
(Li et al., 2017; Rameshkumar et al., 2013)
9
Umbelliferone
22.1
323
C9H6O3
161
163*
(Al-Snafi, 2016)
10
p-coumaric acid
22.8
219,309
C9H8O3
163
–
(Mighri et al., 2019; Al-Rafai et al., 2017; Li et al., 2017; Hegab and Abdelgawad, 2010)
11
Ferulic acid
25.9
216,322
C10H10O4
193
195*
(Mighri et al., 2019; Li et al., 2017; Hegab and Abdelgawad, 2010)
12
Quercetin derivative
26.2
255, 352
–
741
743*,303*, 447, 370
13
Rutin
28.1
255, 353
C27H30O16
609
611*, 303*
(Mighri et al., 2019)
14
Hyperoside
28.6
206, 227, 255, 353
C21H20O12
463
465*,303*
(Ye et al., 2005)
15
Quercetin 3-O-arabinoside
30.9
255, 352
C20H18O11
433
435*, 301, 303*
16
Dicaffeoylquinic acid
31.74
247, 326
C25H24O12
515
–
(Mighri et al., 2019; Rameshkumar et al., 2013; Ye et al., 2005)
17
Naringin7-O- glucoside
32.30
210, 255, 352
C33H42O19
433
435*
18
Quercetin 3-O-glucosyl-xylose
37.98
283, 371
C26H28O16
595
19
Dicaffeoylquinic acid
33.84
247, 327
C25H24O12
515
–
(Mighri et al., 2019; Rameshkumar et al., 2013; Ye et al., 2005)
20
Quercetin
40.33
210,254, 365
C15H10O7
301
303*
(Mighri et al., 2019; Al-Rifai et al., 2017; Ye et al., 2005)
21
Lignans
49.55
220, 259, 269, 280
–
–
309, 212, 274*,391
49.67
220, 259, 268, 280
–
–
309, 274*, 677, 325, 391
50.22
220, 259, 268, 281, 382
–
–
309, 391, 293*, 641
50.34
220, 259, 268, 280
–
–
309, 341, 391, 325, 293*, 275*
50.88
220, 259, 268, 328
–
–
309, 641, 391, 235*, 275*, 293*, 333*, 447*
51.23
220, 268, 328, 338
–
–
309, 641*, 391, 235*, 275*, 333*, 447*.
22
Luteolin diglucuronide
52.18
220,314
C27H26O18
637
285, 287*, 291*
(Rehecho et al., 2011)
The two species C. austroaegyptiacus and C. pilosellifolius Desr. demonstrated fewer compounds number with thirteen and fifteen polyphenolic compounds, respectively, by using the DART-ToF-MS technique (Al-Rifai et al., 2017). In contrast, LC-PDA-ESI/MS detects more than twenty individual compounds in C. althaeoides L. leaves (chromatograms) (Fig. 2), showing different composition between the extracts with increasing polarity. Ethyl acetate and the ethanol were the richest polyphenolic extracts compared to dichloromethane and chloroformic extracts. This difference could be explained by the factor of polarity, since polyphenols are polar compounds. Therefore, the identified polyphenolic compounds were classified according to their chemical structure (Table 1). Major polyphenolic compounds identified in our study belonged to phenolic acid and flavonoid subfamilies.
3.2.1.1 Phenolic acids
Phenolic acids were abundantly found in the extracts of C. althaeoides L. leaves from both winter and spring collects and in total 12 derivatives were identified. Peak 1 (tR = 1.7 min) showed a maximal absorption at a 275 nm (λmax) and two deprotonated moleculars at m/z 191 [M−H]- and m/z 173 [M−H−H2O]-, it was identified as quinic acid (Mighri et al., 2019; Rameshkumar et al., 2013). Peak 2 (tR 4.4 min), λmax at 263 and 365 nm showed a deprotonated molecular ions at m/z 169 [M−H]-, which correspond to gallic acid (Mighri et al., 2019). The spectral data for peaks 3, 4, 6 and 8 led to the identification of four caffeic acid derivatives, due to their UV–Vis absorptions at 241 and 324 nm and to their fragments at [M−H]- m/z 341. In fact, based on this spectrum information and literature data (Rameshkumar et al., 2013), these compounds were identified as caffeic acid conjugated with hexoside. Peak 5 had a tR =15.1 min showing three maximal absorption values at 222, 245 and 324 nm and showed two molecular ions, one at m/z 353 [M−H]- (negative ion mode) and the other at m/z 355 [M + H]+ (positive ion mode), all this characteristics led to identify it as chlorogenic acid. Peak 7 was identified as caffeic acid according to their spectrum information, it had three maximal absorption at 220, 241, 322 and mass fragment [M−H]- at m/z 179. Successively, peak 10 (tR 22.8 min, λmax 219 and 309 nm) displayed a negative molecular ion fragmentation at m/z 163, characteristic of the p-coumaric acid (Li et al., 2017; Mighri et al., 2019). The chloroformic extract from leaves of spring collect showed a peak (11) at tR 25.9 min having molecular negative ion at 193 and molecular positive ion at 195, based to literature data (Al-Rifai et al., 2017; Li et al., 2017; Rameshkumar et al., 2013), this compound was identified as ferulic acid. Finally, the two peaks 16 and 19 showed two similar UV–Vis spectra with maximum absorptions at 247 and 327 nm and mass spectral fragmentation [M−H]- at m/z 515, according to the literature data (Mighri et al., 2019; Rameshkumar et al., 2013; Ye et al., 2005), these compounds were identified as two isomers of dicaffeoylquinic acid. Altogether, six forms of caffeic acid derivatives were identified in our extracts (caffeic acid, two isomers of dicaffeoylquinic acid, three isomers of caffeic acid hexoside), nevertheless, only methyl caffeate was identified in C. dorycnium L. (Nacef et al., 2010) and the precursor caffeic acid was found in the methanol extract of the species C. arvensis (Hegab and Abdelgawad, 2010), using silica gel flash column chromatography and HPLC, respectively. Chlorogenic, ferulic and p-coumaric acids were also previously reportyed in C. arvensis species (Hegab and Abdelgawad, 2010).
3.2.1.2 Flavonoids
The most representative flavonoids detected in the leaves of C. althaeoids L. were coumarins, flavonols, flavanones, lignans and flavones sub-class, identified in the different extracts by comparing the fragmentation MS spectrum and with UV–Vis spectrum with those reported in the literature data. Peak 9 (tR 22.1 min, λmax 323 nm) showed a fragmentation in negative ion mode at m/z 163 and in positive ion mode at m/z 165 indicating a possible attribution to the umbelliferon coumarin compound already detected in Convolvulaceae species (Al-Snafi, 2016). Peaks 12, 13, 14, 15, 17 and 20 showed typical MS fragments in negative ion mode at m/z 301 [M−H]- and in positive ion mode at m/z 303 [M+H]+, correspondingto quercetin. Additionally, mass spectrum for peaks 13 and 14 showed fragment in negative ion mode [M−H]- m/z 609, 463 and major fragment in positive ion mode at 303, which corresponds to a quercetin units. Thus, peaks 13 and 14 were identified as rutin and hyperoside, respectively (Mighri et al., 2019; Ye et al., 2005). Peaks 15 and 18 displayed the [M−H]- at 433, and 595, respectively and the fragmentation ion at m/z 301 due to a quercetin ion. A loss of 132 da and 294 da corresponds to 3-O-arabinose and 3-O-glucosyl-xylose, respectively, and after confrontation of these outcomes with literature data (Ye et al., 2005), these compounds were identified as quercetin 3-O-arabinose (peak 15) and quercetin 3-O-glucosyl-xylose (peak 18). The peak 17 was identified based on its three maximum absorptions of 210, 255 and 352 nm, and an MS fragmentation ion in negative ion mode 433 and in positive ion mode 435, was identified as a flavanone compound, specifically a naringenin 7-O- glucoside. Seven peaks having similar UV–visible spectrum and major MS fragmentation at m/z 309, were compared with literature data (Ye et al., 2005) and were tentatively identified as lignan compounds. Finally, the peak 22 displayed fragmentation ion in negative ion mode [M−H]- at m/z 637 and [M−H−diGlu]- at m/z 285, it was identified as the flavone compound luteolin diglucuronide (Rehecho et al., 2011). Quercetin, naringenin and ferulic acid were common compounds with C. austroaegyptiacus and C. pilosellifolius (Al-Rifai et al., 2017).
3.2.2 Quantification of polyphenolic compounds of C. althaeoides L. Leaves from different seasons
The distribution of polyphenolic compounds showed a notable variation in the quality, but also in quantity between the studied extracts, and seasonality seems to affect the composition of the extracts (Table S1). In fact, ethanol extracts demonstrated the presence of 14 compounds, and the same profiling was observed through chromatograms for both winter and spring collects. The total polyphenolic content of compounds was more important in winter (3904.55 µg g−1) than in spring (2948.04 µg g−1) for the ethanol extract. The ethanol solvent seemed to be the most appropriate solvent for a maximum extraction of polyphenolic compounds (Table S1). Higher total polyphenolic contents of the ethanol extracts deriving from the sister species Convolvulus austroaegyptiacus (125440 µg g−1) and Convolvulus pilosellifolius (129970 µg g−1) have been recorded using Folin-Ciocalteu method (Sousa et al., 2007) whereas ethyl acetate extract seemed to be the most effective solvent to dissolve polyphenolic compounds for C. austroaegyptiacus (146830 µg g−1) and C. pilosellifolius (158140 µg.g−1) (Al-Rifai et al., 2017). However, the used method overestimated the quantities of phenolic compounds compared to chromatography LC-PDA-ESI/MS and LC-PDA-APCI/MS methods. Chlorogenic acid was the predominant polyphenolic compound with a maximum concentration for the ethanol winter extract (1299.4 µg g−1) (Table S1). Caffeic acid hexoside isomers and quercetin 3-O-arabinoside were positively correlated (r = 0.30) to spring ethanol extract (Fig. 2). These compounds were also positively correlated to winter ethyl acetate extract (r = 0.30) (Fig. 2). The highest concentration of polyphenolic compounds in ethyl acetate extracts was caffeic acid, with 1951.7 µg g−1 for winter and 1822.21 µg g−1 for spring collects. This compound was less abundant in the ethanol extracts and no difference due to seasonality was observed. The distribution of the two isomers of dicaffeoylquinic acid was also independent form season fluctuation and was positively correlated to the ethanol extract (r = 0.36) (Fig. 1, Fig. 2). Naringin glucoside, p-coumaric acid and quercetin were correlated to the ethyl acetate extract with maximum abundance in the winter collect (Fig. 2). The dichloromethane and chloroformic extracts had similar polyphenol profiles with a few difference the detected compounds (Fig. 1, Table S1). The flavonoid compound umbelliferone was detected only in the winter dicloromethane and chloroformic extracts. Quercetin and quercetin-3-O-glucosyl-xylose distribution was positively correlated to spring dichloromethane and chloroformic extracts. Finally, luteolin diglucuronide was a major flavonoid of dichloromethane extract of winter collect (63 µg g−1, r = 0.31) (Table S1, Fig. 2).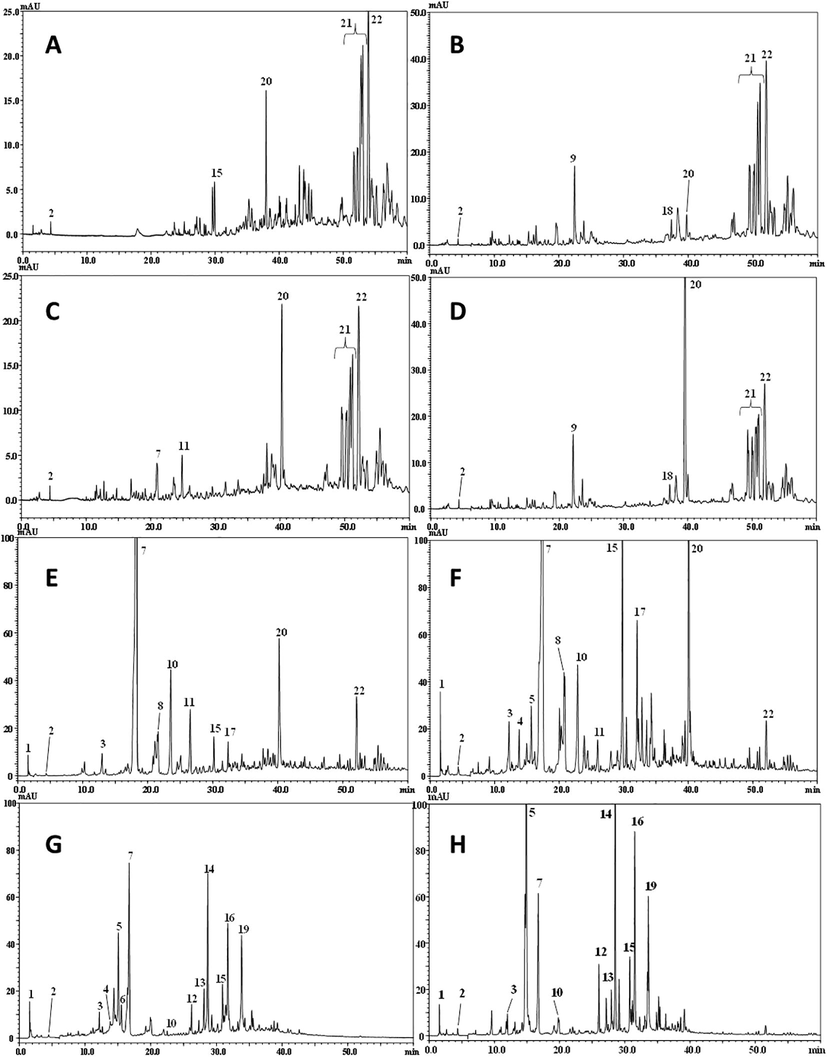
Polyphenolic profiles of different extracts obtained by HPLC-PDA analysis. A; winter dichloromethane extract, B; spring dichloromethane extract, C; winter chloroformic extract, D; spring chloroformic extract, E; winter ethyl acetate extract, F; spring ethyl acetate extract, G; winter ethanol extract, H; spring ethanol extract of C. althaeoides L. leaves.
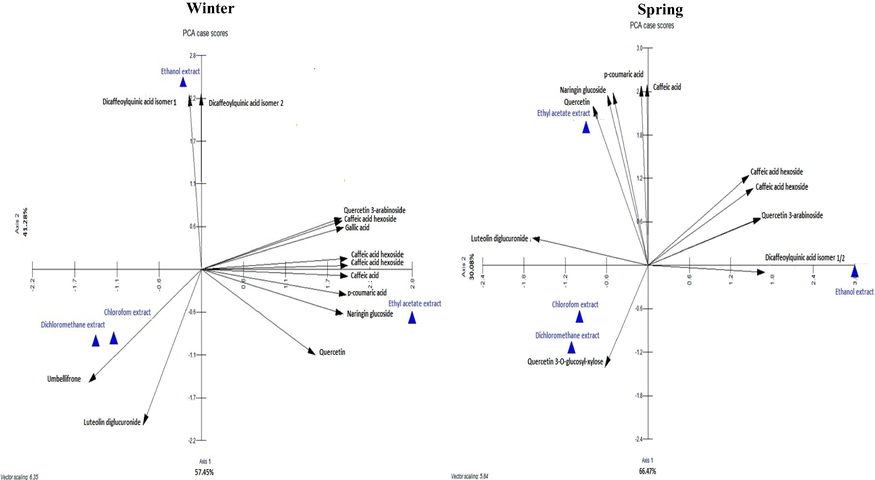
Principal Components Analysis (PCA) showing the distribution of polyphenolic composition of different extracts from C.althaeoides L. leaves from winter and spring collects.
3.2.3 Identification of the pigment compounds of C. althaeoides L. leaves from different seasons
Chlorophylls, chlorophyll derivatives and carotenoids are pigments produced by green plants which are involved in the photosynthetic process. Moreover, important functions are attributed to those pigments, such as antioxidant properties. Both natural factors and analytical ones can affect the plant tissue composition in pigments, such as the solvent used for the tissue extraction and the yearly seasonal climate variation (Saini and Keum, 2018). In this study, pigment compounds in C. althaeoides L. leaf extracts were characterized using LC-PDA-APCI/MS analysis. Compounds were identified by comparing UV–visible and mass spectra data with those of literature (Table 2). In the eight different extracts of C. althaeoides L. leaves, 27 compounds were detected, including ten identified as carotenoids, eleven identified as chlorophyll derivatives and six unidentified compounds (Table 2). All analyzed extracts showed the same chromatographic profile (Fig. 3). Peak 1 (tR = 3.3 min) showed UV maximum at 268 nm and specific spectrum mass at [M + H]+ m/z 409, was tentatively identified as 4,4′-diapophytoene (Kaiser et al., 2012). Peaks 2, 10, 16, 21 and 22 were identified as a chlorophyll derivatives, they showed five maximum absorbance in the UV–visible spectrum and fragment ions [M + H]+ at m/z 617, 593, 893 and 872 due to the loss of magnesium with the loss of a C19H38 molecule. Thus, based on the spectrum information and literature data of these compounds they were identified as chlorophyllide a, pheophorbide a, chlorophyll a and two pheophytins type (Milenković et al., 2012). Peaks 3, 8, 17, 19 and 20 were tentatively identified as chlorophyll b derivatives, they showed five maximum absorbance in the UV–vis spectrum and fragment ions [M + H] + at m/z 631 and 607, 908 and 885, by comparison with literature data those compounds were identified as chlorophyllide b, pheophorbide b, chlorophyll b and two pheophytins b type, respectively (Maurer et al., 2014; Milenković et al., 2012). Peak 4 (tR 6.4 min), with five maximum UV–visible absorbance at 281, 314, 421, 434, 658 nm and fragment ion [M + H] + at m/z 613 was tentatively identified as chlorophyll c. Peak 6 (tR 8.1 min), showed a maximum UV–vis absorbance at m/z 238, 266, 401, 498 nm and fragment ion [M + H] + at m/z 625, and accordingly to literature data, it has been identified as actinioerythrin (Leboeuf et al., 1981). Peaks 9, 11 displayed similar maximum UV–V is absorption spectral viz. 415, 437, 464 nm, and 422, 444, 473 nm and MS fragment in positive ion mode (protonated molecule) at m/z 551, which was attributed to the molecule of lutein isomer and lutei itself. Other characteristic fragment ion [M−H]- at m/z 568 detected for peaks 9 and 11 confirmed them as lutein isomer and lutein according to literature data (Gupta et al., 2015). Peak 15 had maximum absorption at 409 nm and 507 nm and MS fragmentation in positive ion mode at m/z 535 (protonated) and in negative ion mode at 534 (deprotonated); it was tentatively identified as torulene (C40H54). The successive peaks 23 and 24, had a similar λmax at 400, 422, 450 and MS fragment in positive ion mode at m/z 601, these peaks were identified by comparison with the data reported in literature (Meléndez-Martínez et al., 2007) as luteoxanthin isomers.
N°
Compounds
tR (min)
λ max
Formula
[M + H]+
[M−H]-
Ref
1
4,4′-diapophytoene
3.3
268
C30H48
409
–
(Kaiser et al., 2012)
2
Chlorophyllide a
3.5
530, 604, 658
C35H34MgN4O5
617
–
(Milenković et al., 2012)
3
Chlorophyllide b
5.7
227, 270, 314, 403, 664
C35H34MgN4O6
629, 611
–
(Maurer et al., 2014; Milenković et al., 2012)
4
Chlorophyll c
6.4
281, 314, 421, 434, 658
C35H32MgN4O5
613
–
5
Unknown
7.3
229,279, 407, 504, 667
–
696, 609
712, 607
–
6
Actinioerythrin
8.1
238, 266, 401, 498
C40H48O6
625
–
(Leboeuf et al., 1981)
7
Unknown
9.05
232, 322, 407, 504, 666
–
637, 619
635, 389
–
8
Pheophorbide b
10.6
232, 331, 372, 437, 657
C35H34 N4O6
607
605
(Maurer et al., 2014; Milenković et al., 2012)
9
Isomer lutein
11.6
415,437, 464
C40H56O2
551
568
(Haoujar et al., 2019; Gupta et al., 2015)
10
Pheophorbide a
12.3
274, 340, 425, 507, 658
C35H36N4O5
593
592
(Milenković et al., 2012)
11
Lutein
14.0
422, 444, 473
C40H56O2
551
568
(Haoujar et al., 2019; Gupta et al., 2015)
12
Unknown
16.7
231, 409, 448, 467, 668
–
622
620
–
13
Echinenone
19.05
471
C40H54O
551
–
(Haoujar et al., 2019)
14
Unknown
23.5
233, 269, 415, 438, 468
–
873, 765, 654
763, 652,568
–
15
Torulene
26.43
409, 507
C40H54
535
534
(Zoz et al., 2015)
16
Chlorophyll a
33.5
297, 326, 370, 436, 661
C55H72MgN4O5
893
–
(Milenković et al., 2012)
17
Chlorophyll b
37.7
227, 279, 407, 504, 667
C55H70MgN4O6
908, 887, 682
886,680
(Maurer et al., 2014; Milenković et al., 2012)
18
Unknown
39.9
282, 279, 407, 499, 504, 667
–
903
902
–
19
Pheophytin b
43.14
331, 373, 437, 529, 661
C55H72N4O6
885, 827
884, 826
(Maurer et al., 2014; Milenković et al., 2012)
20
Pheophytin b
45.77
331, 371, 432, 441, 657
C55H72N4O6
885, 827
884, 826
(Maurer et al., 2014; Milenković et al., 2012)
21
Pheophytin a
47.5
276, 408, 507, 538, 667
C55H74N4O5
–
870
(Milenković et al., 2012)
22
Pheophytin a
48.9
275, 340, 425, 507, 658
C55H74N4O5
872
870
(Milenković et al., 2012)
23
Luteoxanthin isomer I
51.2
411, 469, 533
C40H56O4
601
–
(Meléndez-Martínez et al., 2007)
24
Luteoxanthin isomer II
52.68
411, 470, 535
C40H56O4
601
–
(Meléndez-Martínez et al., 2007)
25
β-carotene
53.45
428, 452, 478
C40H56
537
–
(Haoujar et al., 2019; Meléndez-Martínez et al., 2007)
26
9-Z-β -carotene
55. 8
333, 421, 446, 472
C40H56
537
–
(Haoujar et al., 2019; Meléndez-Martínez et al., 2007)
27
Unknown
58.15
412, 436, 507, 544, 663
–
827
826
–
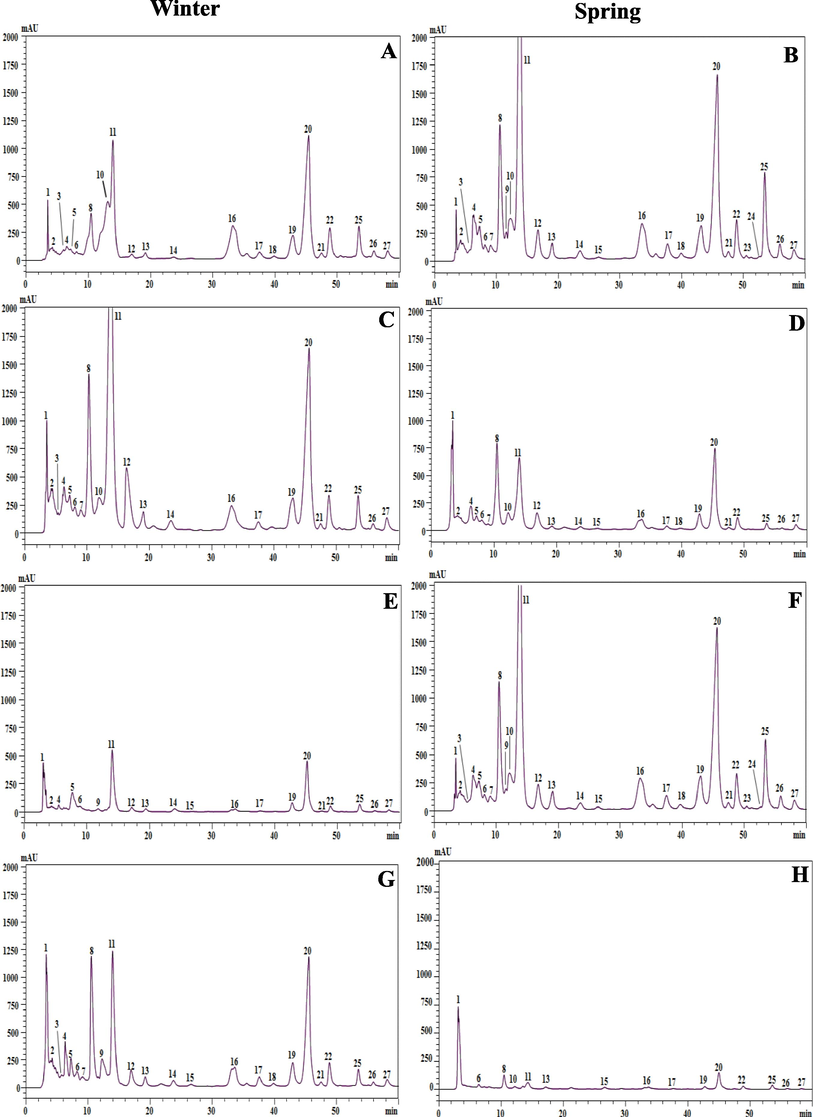
Carotenoids profiles of different extracts obtained by HPLC-PDA analysis. A; winter dichloromethane extract, B; spring dichloromethane extract, C; winter chloroformic extract, D; spring chloroformic extract, E; winter ethyl acetate extract, F; spring ethyl acetate extract, G; winter ethanolic extract, H; spring ethanolic extract of C. althaeoides L. leaves.
Finally, peaks 25 and 26 had a similar MS fragment in positive ion mode 537 characteristic to carotene molecules and specific UV–vis absorbances at 428, 452, 478 nm (peak 25) and 333, 421, 446, 472 nm (peak 26) permitted to identify them as β carotene and 9-Z-β-carotene, respectively.
3.2.4 Quantification of carotenoid compounds in C. althaeoides L. leaves from different seasons
C. althaeoides L. leaves, harvested in different seasons were treated successively with solvents of decreasing polarity. The chromatograms showed a complex carotenoid profile and a total of 10 compounds were identified (Table S2, Fig. 4). The chloroform was the best solvent to extract carotenoids, with similar total contents for the winter (2693. 93 µg g−1) and the spring (2655. 26 µg g−1) collects. Interestingly, the dichloromethane extract from the spring collect of leaves was the most diversified in carotenoids, with 10 detected compounds and total concentration of 2607.96 µg g−1 compared to the same extract from the winter collect of leaves, with 6 compounds and total concentration of 893.79 µg g−1. On the other hand, ethanol extracts contained negligible amounts of carotenoids, for both winter (401.71 µg g−1) and spring (333. 06 µg g−1) collects. In view of all these findings, no important difference in total contents between seasons was observed. Nevertheless, interesting deviation were observed in the composition and concentration of each identified pigment within extracts and according to seasonality. Lutein was the major carotenoid identified in all extracts with concentrations ranging from 287.04 to 2014.7 µg g−1, except for the ethanol extract from spring collect for which the most abundant compound was the 4, 4′-diapophytoene (Table S2). Furthermore, PCA analyses demonstrated that lutein and lutein isomer were correlated to dichloromethane and chloroform in both winter and spring extracts. 9-Z- β-carotene and β-carotene were positively correlated to the dichloromethane extracts with a maximum of 379.94 µg g−1 and 71.7 µg g−1, respectively, for the spring collect (Table S2, Fig. 4). Luteoxanthin isomer 1 and luteoxanthin isomer 2 were detected only for spring extract, with positive correlation (r = 0.65) for the chloroform and dichloromethane extracts, respectively (Fig. 4). Torulene was present in both winter and spring season extracts with a positive correlation, with the ethyl acetate (r = 0.62) for winter collect and less significant correlation (r = 0.40) for both dichloromethane and chloroform of spring leaf collect (Fig. 4). 4,4′-diapophytoene was more abundant in winter chloroformic extract, however it was the most correlated to the ethyl acetate extract in the spring collect. Finally, actinioerythrin and echinenone were positively correlated to the chloroformic extract in both winter (r = 0.40) and spring (r = 0.57) collects (Fig. 4). The high diversity of carotenoids and chlorophylls suggested that C. althaeoides L. leaves are a potential source of natural pigment. Pigment compounds were shown to have many health benefits such as antioxidant activity and proven to have an antimicrobial activity (Moreira et al., 2018). Seasonal variations in the total phenolic compounds and flavonoids were demonstrated by (Ncube et al., 2011) for four plants from South Africa. In addition, a recent research showed that the quantity of these compounds from I. helenium, greatly differs regarding the different time periods (Zlatić et al., 2019). By the way, metabolites seems to have major roles in the adaptation of plants to unfavorable conditions generated by climatic and environmental factors across season fluctuations, which could explain the difference of nature and the concentration of the identified compounds.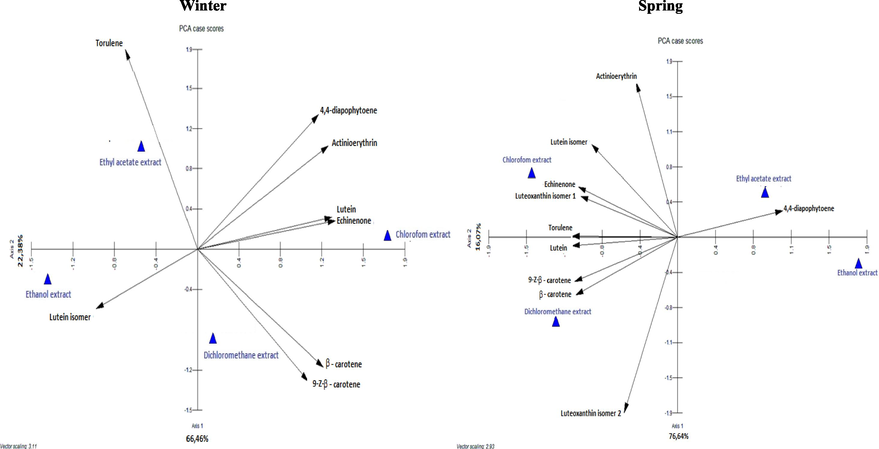
Principal Component Analysis PCA for quantitative of carotenoid composition of different extracts from C. althaeoides L. leaves from winter and spring collects.
3.3 Antioxidant activity
The antioxidant activity of C. althaeoides L. leaf extracts from different seasons were evaluated by DPPH radical scavenging assay, comparing to ascorbic acid. Seven varying concentrations (0, 0.0625, 0.125, 0.25, 0.5, 1 and 2 mg mL−1) of C. althaeoides L. leaf extracts demonstrated different percentage of inhibition. Interestingly, scavenging activity of each extract was increased in a concentration dependent manner. The 2 mg mL−1 concentration showed the best antioxidant activity of each extract, where among them, the ethanol extracts showed the highest percentages of inhibition (86.37% and 85.22%), followed by ethyl acetate (72.94% and 73.32%), and dichloromethane extract (48.17% and 44.15%), for spring and winter seasons, respectively (Fig. 5). Dichloromethane, ethyl acetate and chloroform extracts exhibited antioxidant activity, and similar half maximal inhibitory concentrations (IC50) were detected for the winter and the spring collects, ranging from 0.2449 ± 0.1489 to 0.432 ± 0.1118 mg mL−1 (Table S3, Fig. 5). IC50 of the ethanol extract (0.1369 ± 0.0272 mg mL−1) was very close to the standard ascorbic acid (0.1285 ± 0.0141 mg mL−1). In accordance with photochemical results of the different extracts, the content of ethanol and ethyl acetate extracts in polyphenol compounds can explain their high potential in radical scavenging. Common compounds of these extracts have been reported exihibiting antioxidant capacity such as caffeic acid derivative (Koroleva et al., 2014), p-coumarinic (Aguilar-Hernández et al., 2017), and chlorogenic acid (Xu et al., 2019), and the flavone quercetin 3-O-arabinoside (Xu et al., 2019). In addition, ethanol extract from C. althaeoides L. leaves was shown to provide supplementary polyphenolic coupounds that made it the most efficient in radical scavenging assay, especially quercetin derivative (Xu et al., 2019), rutin (Mecenas et al., 2018), hyperoside (Xing et al., 2015) and dicaffeoylquinic acid (Kim et al., 2011). In fact, it was reported previously that the catechol structure in phenolic compounds is an important factor for the radical-scavenging effect (San Miguel-Chávez, 2017). A negligible contribution of carotenoids to the antioxidant capacity was observed (Choi et al., 2007; de Ancos et al., 2002), and this could be related to the lipophilic nature of carotenoids, and to their different mode of action compared to the phenolic molecules (Rodriguez-Amaya, 2010).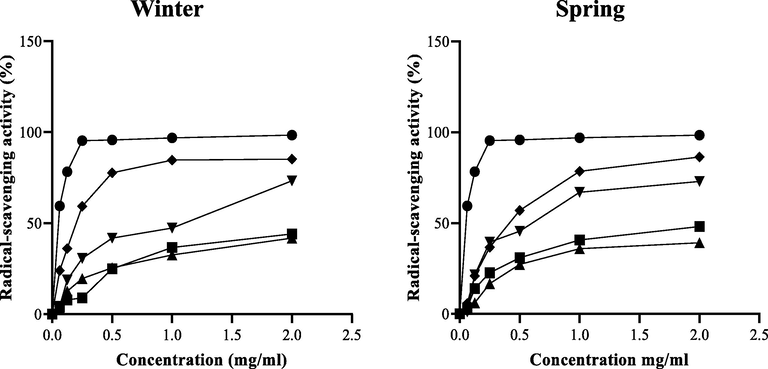
DPPH radical scavenging activities of the different extracts of C. althaeoides L. from winter and spring seasons, compared to ascorbic acid. (●) Ascorbic acid; (♦) ethanol extract; (▾) ethyl acetate extract; (▲) chloroformic extract and (■) dichloromethane extract.
3.4 Antifungal activity
3.4.1 Anti-dermatophytic activity
The screening of the susceptibility of T. rubrum, T. mentagrophytes and M. canis clinical strains for each evaluated powder and extract from C. althaeoides L. leaves, for winter and spring collects, showed different results (Fig. 6, Fig. 7). Sterilized powder showed an important increasing inhibition percentage for both T. rubrum and T. mentagrophytes, reaching 52% for the winter collect and not exceeding 37.5% for the spring collect within 15 days of culture, and this with an initial concentration of 10%. In the same conditions, the inhibition percentage for M. canis was important in the beginning of culture evolution (46–50%), however it slightly decreased within 15 days for both winter and spring collects (12–15%) (Fig. 7). Attempting to estimate the MIC values, decreasing percentage of powder (7.5%, 5%, 2.5%, 1%, 0.5%) were tested, showing an inhibitory effect of 20% maintained up to a 0.5% of powder concentration, and this up to 15 days on T. rubrum culture, for both winter and spring collects (Fig. 7). Less important inhibition was shown for T. mentagrophytes and M. canis with an inhibitory effect not exceeding 6.2% for a concentration of 0.5% and 10% for a concentration of 2.5% within 15 days, respectively (Fig. 7). In the other hand, ethanol and ethyl acetate extracts obtained from different collects of C. althaeoides L. leaves showed 100% of inhibition for T. rubrum, T. mentagrophytes and M. canis with a concentration of 100 mg mL−1, and this up to 15 days. Gallic acid, a constant composite of these extracts, have been demonstrated efficient against T. rubrum (MIC = 43.75 μg mL−1) (Li. Z.-J et al., 2017). p-coumarinic acid derivatives (3-Prenyl-p-coumaric acid and 3,5-diprenyl-p-coumaric acid) were also active towards T. rubrum with MICs ranging from 100 to 125 μg mL−1 (Feresin et al., 2003). Similarly, the flavonoid quercetin present in ethanol and ethyl acetate extracts, particularly the quercetin 3-O-arabinoside, have been shown to be actif against T. rubrum, and thus via the ergosterol reduction and membrane damage mechanisms (Bitencourt et al., 2013). Phenolic compounds belonging to the cinnamic acid derivative group (chlorogenic acid and caffeic acid derivatives) were proven to defend plants against the filamentous fungi Fusarium graminearum and to limit the accumulation of mycotoxins in cereals (Xu et al., 2019). Seasonality seems not to influence the antifungal capacity of the ethanol and ethyl acetate extracts towards dermatophytes (Fig. 9). Nevertheless, the chloroformic extract demonstrated a significant difference, and this with 100% of inhibition for the spring collect compared to 14.28–33.34% for the winter extract. With a return to chemical composition, ferulic acid was the only element that was found to be in favor of this variation, regardless its limited presence in the chloroformic spring extract (6.88 µg g−1). A previous study highlighted an inhibitory effect reaching 81.45% ± 0.05 for the ferulic acid against filamentous fungi from Fusarium, Penicillium and Aspergillus genus (Zabka and Pavela, 2013). For all the studied dermatophyte strains, dichloromethane extract showed a minor inhibitory effect for the spring collect of leaves (14.28–25%) and a surprising growth stimulating effect on the tested fungi cultures (-21.43 to −41.67%) for the winter collect of leaves (Fig. 6). The inhibition of dermatophyte cultures was also verified at the microscopic scale and numerous cytopathologic effects on mycelium growth were noted comparing powder agar and extract incorporated agar plates to negative control. T. rubrum demonstrated very limited mycelium abundance with a total absence of fructification elements (microconidia) for powders from both winter and spring collects (Fig. 8). However, the ethanol extract treatment enhanced the fructification of T. rubrum and the appearance of chlamydioconida was noted. The species T. mentagrophytes showed less abundant microconidia and pencil-shaped macroconidia. Moreover, the emergence of terminal chlamydoconidia, which are in general observed when fungi are under suffering conditions, was clearly detected as a result of the powder treatment (Fig. 8). For the ethanol extract micro and macroconidia were less abundant than for the negative control for T. mentagrophytes. Finally, M. canis evolution was regressive and the characteristic barrel-shaped macroconidia were less numerous, reduced in size and sometimes without septation, and this for the powder of both winter and spring collects (Fig. 8). The ethanol extract showed cultures with only filaments, and with no fructification elements. An attempt to determinate the MIC/MFC was realized with decreased concentrations of the extract by the screening approach on SDA 24 well plates. The concentration of 100 mg mL−1 was proven effective against the three dermatophyte species with 100% of inhibition of radial growth, and this for the ethanol and ethyl acetate extracts from both spring and winter seasons and chloroform extract of spring collect (Fig. 9). However, this efficacy was maintained only for ethanol and ethyl acetate extracts of winter leaves collect, when the concentration was decreased up to 25 mg. The species T. mentagrophytes have been more sensitive with a MIC50 of 6.25 mg mL−1, followed by M. canis (MIC50 = 12.5). T. rubrum was resistant to low concentrations of extracts with large interval of MIC50 (12.5–50 mg/ml). All extracts from C. althaeoides L. leaves demonstrated no mycelia inhibition on the filamentous fungi from Aspergillus genus (A. flavus, A. fumigates, A. terreus and A. niger) with an initial concentration of 100 mg mL−1.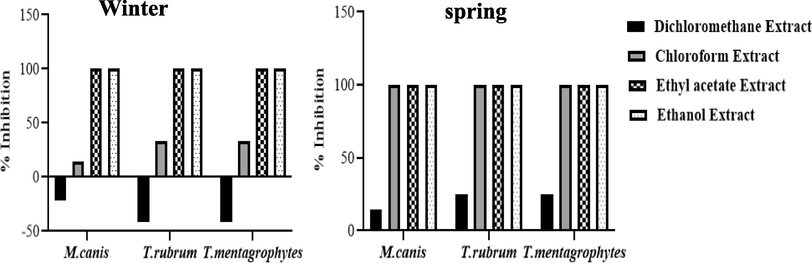
Screening anti-dermatophyte activities of the different extracts from C. althaeoides L. leaves, harvested in winter and spring seasons. Signification difference, one-way ANOVA test, p < 0.05.*100% of inhibition was attributed when no mycelia growth was observed on the dermatophyte disc.
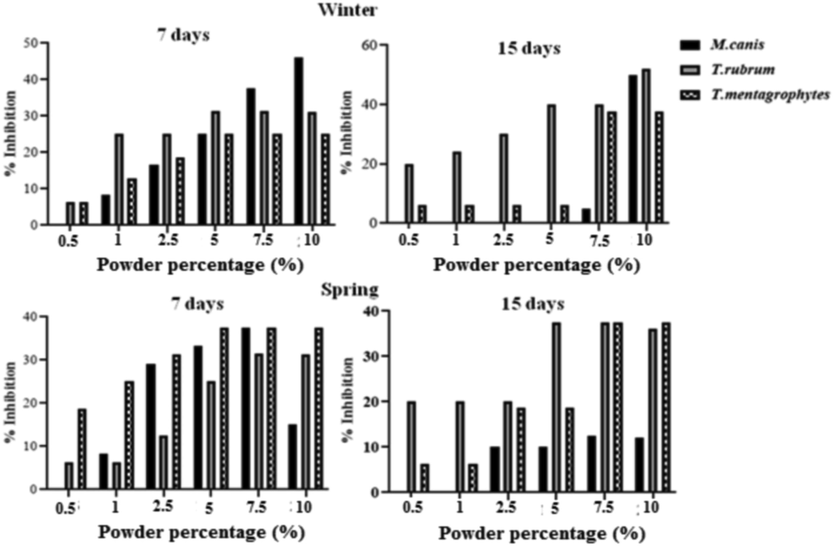
Anti-dermatophytes activitiy of leaf powders of C. althaeoides L., harvested in winter and spring seasons. Signification difference, one-way ANOVA, p < 0.05.
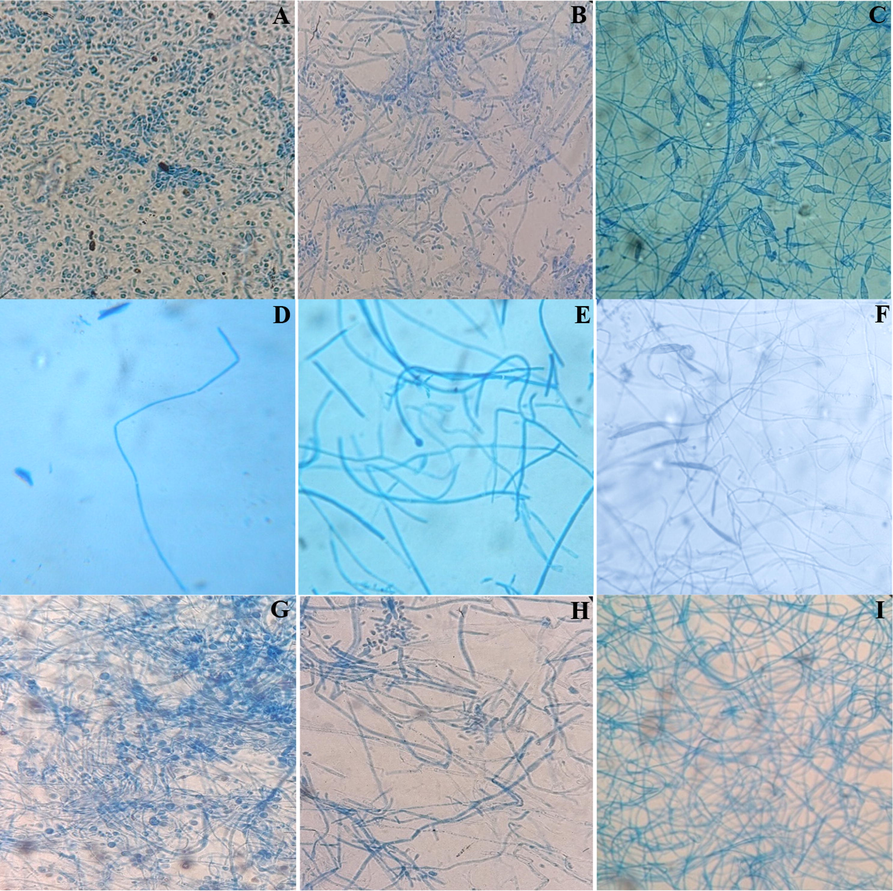
Microscopic observation of the dermatophyte treated with powder and extracts from C. althaeoides L. compared with negative growth control. A; T. rubrum negative control, B; T. mentagrophytes negative control, C; M. canis negative control, D; T. rubrum treated with powder, E; T. mentagrophytes treated with powder, F; M. canis treated with powder, G; T. rubrum treated with ethanol extract, H; T. mentagrophytes treated with ethanol extract, I; M. canis treated with ethanol extract.
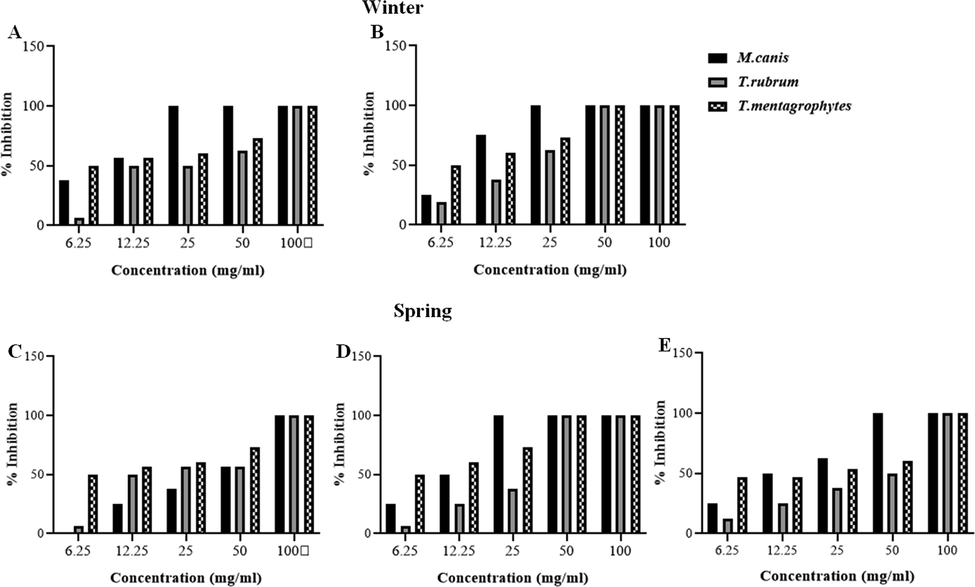
Anti-dermatophyte activity of C. althaeoides L. leaf extracts from winter and spring seasons. A: winter ethyl acetate extract, B: winter ethanol extract, C: spring chloroformic extract, D: spring ethyl acetate extract, E: spring ethanol extract.
3.4.2 Anti-candidal activity
The antifungal activity of C. althaeoides L. extracts against Candida spp. strains was evaluated. The food poisoning method was used for the screening of the inhibitory potential on the C. albicans cultures. Except for the chlorofomic extract who did not demonstrated effect, all other extracts showed a maximum of inhibition at 75% (Table 3). The ethanol and ethyl acetate extracts were the most effective on C. glabrata cultures (75%) followed by the spring chloroformic extract (50%). All extracts demonstrated a moderate potential of inhibition for C. tropicalis, with a maximum of 50%. The microdilution method permitted to estimate the MIC values and deduce MFC values after the re-inoculation of susceptible wells on SDA plates. The ethanol and ethyl acetate extracts showed a maximum inhibition potential with MICs/ MFCs ranging from 0.78 to 3.12 mg mL−1 and 3.12–6.25 mg mL−1 for C. albicans and C. glabrata, respectively (Table 3). In correlation with solid media outcomes, the dichloromethane was highly inhibitory for C. albicans (MICs/ MFCs: 3.12–12.5 mg mL−1) but not for C. glabrata. Chloroformic extract had a moderate inhibition on yeast 12.5–100 mg mL−1. No visible inhibition was detected for C. tropicalis using microdilution method, for all the studied extracts. In a previous study, a close Concolvulacae to C. althaeoide L., C. arvensis L. was tested for antimicrobial capacity and the recovered MICs for butanol extract were 5 and 50 mg mL-1for stem and leaves, respectively (Khan et al., 2015). In a second study the MIC values for the ethanol extracts of Convolvulus pilosellifolius (0.25 mg mL−1) and Convolvulus austroaegyptiacus (0.78 mg mL−1) against the microbiological agent Bacillus subtilis were closer to our results (Bitencourt et al., 2013). As it was reported here for filamentous fungi, major polyphenolic compounds of the most efficient extracts were highlighted in previous studies as anti-candidiasis agents. Gallic acids from Buchenavia tomentosa presented MICs ranging from 2 to 12.5 mg mL−1 for C. albicans, C. glabrata and C. tropicalis (Teodoro et al., 2018). Ferulic acid from ethanol extract of Teucrium arduini L. has been shown to inhibit the C. albicans at MIC 4 mg mL−1 (Kremer et al., 2013). Three phenolic acid compounds (caffeic, p-coumaric and ferulic acids) from the ethanol extract of Limonuim avei were efficient at a MIC of 4 mg mL−1 against C. albicans (Nostro et al., 2012). Quercetin and quercetion derivatives showed antifungal activity against C. albicans and C. tropicalis with a MIC value of 31.2 µg mL−1 (Agüero et al., 2014). C. albicans is a trimorphic yeast from the Ascomycota. Serum induces the transition of C. albicans from single cell yeast (blastospores) to two filamentous growth modes: pseudohyphae and hyphae (germ tubes) (Bastidas and Heitman, 2009). Filamentous forms of C. albicans are incriminated in strains virulence and contribute to the disease aggravation in both humans and animals. Thus, filamentation is receiving the most attention and are promising as a target for new anti-virulence treatments (Vila et al., 2017). The extracts demonstrating the maximum of inhibition on C. albicans were subjected to testing their effect on yeast morphological transitions. Under filamentation conditions, the ethanol and ethyl acetic extracts of winter collect demonstrated maximum of inhibition of 90% on germ tube formation until a concentration of 3.1 mg mL−1, after 3 h and 50% of inhibition after 24 h. The ethanol extract of the spring collect showed 90% of inhibition, with a concentration of 6.2 mg mL−1 after 3 h and 50% of inhibition after 24 h. The ethyl acetic extract of spring collect showed a maximum effect of 50% for both 3 h and 24 h incubation times, and this with a concentration of 3.1 mg mL−1. In a previous study, the effect of polyphenols was investigated whether transcription of the gene HWP1, involved in C. albicans hyphal transition, showing a significant down regulation for curcumin and pyrogallol, and microscopy analysis confirmed that both of these compounds can clearly be observed to impede filamentation and biofilm formation (Shahzad et al., 2014). NI: not inhibitory I%: Inhibition percentage
Strains
Dichloromethane extract
Chloroformic extract
Ethyl acetate extract
Ethanol extract
Winter
Spring
Winter
Spring
Winter
Spring
Winter
Spring
I%
MIC
MFC
I%
MIC
MFC
I%
MIC
MFC
I%
MIC
MFC
I%
MIC
MFC
I%
MIC
MFC
I%
MIC
MFC
I%
MIC
MFC
C. albicans
75
6.25
12.5
75
3.12
6.25
50
100
100
50
12.5
25
75
3.12
3.12
75
0.78
0.78
75
0.78
1.56
75
1.56
3.12
C. glabrata
0
NI
NI
0
NI
NI
50
50
NI
50
12.5
25
75
6.25
12.5
75
3.12
6.25
75
6.25
6.25
75
3.12
3.12
C. tropicalis
50
NI
NI
50
NI
NI
50
NI
NI
50
NI
NI
50
100
NI
50
100
NI
50
100
NI
50
100
NI
4 Conclusions
From this study, we can conclude that the successive use of dichloromethane, chloroform, ethyl acetate and ethanol solvents with increased polarity, succeed to recover secondary metabolites having different degrees of polarity and raised significantly our odds to identify a large panel of polyphenolic and carotenoid compounds. More precisely, dichloromethane extracted the highest yield of pigments and ethanol extract the highest yield of polyphenolic compounds from C. althaeoides L. leaves identified using LC-PDA-ESI/MS and LC-PDA-APCI/MS. This research showed that C. althaeoides L. represents an abundant source of proven bioactive substances, and the recovered compounds differed greatly according to season fluctuations. In fact, the periodicity of collects (winter and spring) has been shown to play a major role on the variability of the fractions/extracts, and consequently likely influence their therapeutic efficiency and bioactive potential. Winter leaves from C. althaeoides L. contained the highest amounts of polyphenolic compounds and spring leaves collect harbored the highest content in pigments. Twenty two polyphenols and twenty seven pigments type have been successfully identified in this Convolvulacae species. The ethyl acetate and ethanol extracts were the most active against fungal strains (Candida spp. and dermatophytes) and yielded the highest free radical scavenging effect due to their richness in polyphenols. These results are promising and C. althaeoides L. leaves are proven to be an interesting source for natural drug candidates, which can improve human health quality. However, toxicological test of these extracts should be performed in the future to ensure that they do not exhibit adverse effects on human health.
Acknowledgement
The authors extend their appreciation to the Tunisian ministry of higher education and scientific research for funding the research and for according the national Scientific scholarship Program ‘‘Bourse d’alternance” April 2019 to the PhD student Soukaina Hrichi, to cover the travel fees from Tunisia to Italy. The author would like to acknowledge the Parasitology-Mycology team of Fattouma Bourguiba teaching hospital for kindly offering the fungal strains.
The authors gratefully acknowledge Shimadzu Corporation and Merck Life Science (Merck KGaA, Darmstadt, Germany) for the continuous support.
Declaration of Competing Interest
The authors declare that they have no known competing financial interests or personal relationships that could have appeared to influence the work reported in this paper.
References
- Ind. Crop Prod.. 2014;57:166-173.
- Vib. Spectrosc.. 2017;89:113-122.
- Evid. Based Complement. Alternat. Med.. 2017;2017:5694305.
- IOSR J. Pharm.. 2016;6:64-75.
- Pharmacologyonline. 2011;3:11.
- J. Pharmacogn. Phytochem.. 2017;6:205-214.
- Antioxidants. 2015;4:170-184.
- Proc. Natl. Acad. Sci. U S A. 2009;106:351-352.
- J. Ethnopharmacol.. 2009;124:409-415.
- BMC Complement. Altern. Med.. 2013;13:229.
- Nat. Prod. Commun.. 2015;10:1965-1968.
- Food Chem.. 2007;103:130-138.
- J. Sci. Food Agric.. 2002;82:790-796.
- Asian J. Crop Sci.. 2012;4:32-40.
- J. Ethnopharmacol.. 2003;89:73-80.
- Secondary Metabolites and Plant Defence. In: Mérillon Jean Michel, Ramawat Kishan Gopal, eds. Plant Defence: Biological Control. Netherlands, Dordrecht: Springer; 2012. p. :109-138.
- [Google Scholar]
- Plant Meth.. 2015;11:5.
- Molecules. 2019;24:4037.
- Nat. Prod. Res.. 2014;28:769-775.
- Int. J. Bot.. 2010;6:334-342.
- Adv. Life Sci.. 2015;2:83-90.
- Food Chem.. 2011;125:55-62.
- Int. J. Mol. Sci.. 2014;15:16351-16380.
- Curr. Drug Targets. 2013;14:1006-1014.
- Producers of Bioactive Compounds. in: New: Elsevier; 2019. p. :205-221.
- LC–MS Method for Screening Unknown Microbial Carotenoids and Isoprenoid Quinones. Journal of Microbiological Methods. 2012;88(1):28-34.
- [CrossRef] [Google Scholar]
- Le Houérou, H.N., 1995. Bioclimatologie et biogéographie des steppes arides du Nord de l’Afrique: diversité biologique, développement durable et désertisation, Options méditerranéennes. Série B. Centre international de hautes études agronomiques méditerranéennes, Institut agronomique méditerranéen de Montpellier ; Agence de coopération culturelle et technique, Montpellier, Paris.
- Comp. Biochem. Phys. B. 1981;68:221-224.
- South Afr. J. Bot.. 2017;109:1-8.
- Phytother. Res.. 2017;31:1039-1045.
- Chem. Biodivers.. 2016;13:1747-1755.
- Food Chem.. 2014;165:475-482.
- PLOS ONE. 2018;13:1-19.
- Food Chem.. 2007;101:1145-1150.
- South Afr. J. Bot.. 2019;124:102-110.
- The identification of chlorophyll and its derivatives in the pigment mixtures: Hplc-chromatography. Advanc. techno.: Visible and mass spectroscopy studies; 2012. p. :9.
- Waste Manag.. 2018;82:93-99.
- Phytochem. Lett.. 2010;3:66-69.
- South Afr. J. Bot.. 2011;77:387-396.
- Nat. Prod. Res.. 2012;26:2132-2136.
- Food Res. Int.. 2013;50:94-101.
- LWT-Food Sci. Technol.. 2011;44:875-882.
- J. Food Comp. Anal.. 2010;23:726-740.
- Food Chem.. 2018;240:90-103.
- San Miguel-Chávez, R., 2017. Phenolic Antioxidant Capacity: A Review of the State of the Art, in: Soto-Hernndez, M., Palma-Tenango, M., Garcia-Mateos, M. del R. (Eds.), Phenolic Compounds - Biological Activity. InTech. https://doi.org/10.5772/66897
- Int. J. Antimicrob. Agents. 2014;44:269-273.
- Química Nova. 2007;30:351-355.
- Food Chem.. 2007;104:1372-1378.
- Front. Microbiol.. 2018;9:647.
- J. Climate. 2018;31:3349-3370.
- Tunisia climate: average weather, temperature, precipitation, best time [WWW Document], n.d. URL https://www.climatestotravel.com/climate/tunisia (accessed 10.31.19).
- Virulence. 2017;8:150-158.
- Xing, H.-Y., Cai, Y.-Q., Wang, X.-F., Wang, L.-L., Li, P., Wang, G.-Y., Chen, J.-H., 2015. The Cytoprotective Effect of Hyperoside against Oxidative Stress Is Mediated by the Nrf2-ARE Signaling Pathway through GSK-3β Inactivation. PLoS One 10.
- Molecules. 2019;24:1123.
- Rapid Commun. Mass Spectrom.. 2005;19:1469-1484.
- Chemosphere. 2013;93:1051-1056.
- Plants (Basel). 2019;8:179-188.
- Torularhodin and Torulene: Bioproduction, Properties and Prospective Applications in Food and Cosmetics - a. Review. Braz. Arch. Biol. Tecnol. 58 2015
- [Google Scholar]
Appendix A
Supplementary data
Supplementary data to this article can be found online at https://doi.org/10.1016/j.arabjc.2020.04.006.
Appendix A
Supplementary data
The following are the Supplementary data to this article:Supplementary data 1
Supplementary data 1


