

Translate this page into:
Effect of sunset yellow dye on morphological, optical, dielectric, thermal and mechanical properties of KDP crystal
⁎Corresponding author. b3kumar69@yahoo.co.in (Binay Kumar)
-
Received: ,
Accepted: ,
This article was originally published by Elsevier and was migrated to Scientific Scholar after the change of Publisher.
Peer review under responsibility of King Saud University.
Abstract
Abstract
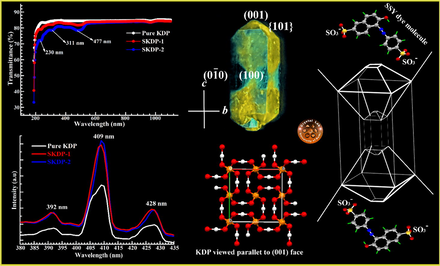
Herein, we describe the growth and morphology of well-defined dyed crystals of KH2PO4 (potassium dihydrogen orthophosphate; KDP) containing organic azo (sunset yellow; SSY) dye in the {1 0 1} & {0 0 1} pyramidal growth sectors. An understanding on selective dye inclusion in various growth sector of host crystal is proposed, which will help in designing novel tailor-made dyed photonic crystals. The structural analysis and the identification of various functional groups present in as grown KDP crystals were carried out using powder XRD, FTIR and Raman studies. Solid state transmittance spectra for dyed KDP crystals displayed three absorption peaks at 230 nm, 311 nm and 477 nm, which were blue shifted for SSY dye in KDP crystal relative to neutral aqueous solution of SSY dye. These blue shifts in the absorption maxima confirm the successful incorporation of sunset yellow dye into the pyramidal growth sectors of dyed KDP crystals. The band around 409 nm in the photoluminescence emission spectrum indicates a violet emission. SSY dye doped KDP crystals showed enhanced dielectric properties and thermal stability as compared to pure KDP crystal. The mechanical strength of the KDP crystals estimated using Vickers microhardness test was found to decrease with the increase in SSY dye doping.
Keywords
Dye inclusion crystals
Solid state absorption spectra
Photoluminescence
Crystal morphology
Sunset yellow dye
KDP crystal

1 Introduction
Nonlinear optical (NLO) materials have found immense applications in the areas of optical communication, laser technology, high speed information processing and optical data storage technology (Kandasamy et al., 2007; Wang et al., 2016). Potassium dihydrogen phosphate (KDP) is an outstanding inorganic NLO active material with high laser damage threshold, attractive electro-optic and piezoelectric properties, and wide optical transparency range. KDP crystals belong to tetragonal crystal system and undergo paraelectric to ferroelectric phase transition well below room temperature (123 K) (Zhou et al., 2019; Kweon et al., 2017). Large size KDP crystals have been easily grown by various methods and are in great demand due to its potential utility in frequency conversion, electro-optical modulators, laser assisted remote sensing, optical disk data storage and many more (Chandran et al., 2017; Kushwaha et al., 2010). Doping KDP crystals with various organic or inorganic additives have resulted in considerable change in the structural, optical, thermal, piezoelectric and mechanical properties of KDP crystals (Wang et al., 2016; Chandran et al., 2017; Kushwaha et al., 2010; Anis et al., 2016, 2019; Dolzhenkova et al., 2017; Kumaresan et al., 2008; Arumugam et al., 2019).
Over the past decades, the development in the research on growth of dye doped single crystals has been focused due their potential applications in solid state dye lasers (SSDLs) and photonics (Benedict et al., 2003; Kahr and Shtukenberg, 2016). As a consequence of reduced scattering, high thermal conductivity and anisotropic behavior of the single crystals, they are capable of overcoming the hurdles faced by traditional liquid and polymer based laser gain media (most importantly photo-degradation of dye, difficulty in handling and low lasing efficiencies) and hence, can be exploited for SSDLs (Yariv et al., 2001).
During our meticulous literature survey, we explored that dyed crystals exhibit enriched key properties over their host un-dyed crystals (Yadav et al., 2015, 2016a; Rajesh et al., 2014;Shkir et al., 2017, 2018; Batra et al., 2019; Goel et al., 2016, 2018a; Sinha et al., 2012;Kanimozhiet al., 2019;Velikhovet al., 2007; Goel et al., 2020; Kumar et al., 2020). For instance, improvement in optical, mechanical and electrical properties of benzophenone crystals was achieved by means of crystal violet (CV) and xylenol orange (XO) dye doping (Yadav et al., 2015, 2016a). Previous reports showed that the inclusion of phenol red and methyl violet dye in zinc (tris) thiourea sulphate (ZTS) crystals could enhance optical, dielectric and mechanical properties.
Sunset yellow (SSY; C16H10N2Na2O7S2) is a petroleum-derived sulfonated azo dye and is extensively used in drugs, cosmetics and food products as color additives. In our former reports, enhancements in optical, piezoelectric, mechanical and thermal properties of ADP and TGS crystals were observed as a result of incorporation of SSY dye (Batra et al., 2019; Goel et al., 2018a). There are few literatures related to the influence of various dyes namely, Xylenol orange, Amaranth, Crystal violet, Alizarin, Congo red and Evans blue on the optical, electrical, mechanical, thermal and piezoelectric properties of KDP crystal (Kweon et al., 2017; Arumugam et al., 2019; Kanimozhi et al., 2019; Velikhovet al., 2007).
Although the distribution of SSY dye in KDP crystals has been previously studied, the effect of sulfonated azo dye Sunset Yellow on various properties of KDP crystal has not yet been explored (Kahr and Gurney, 2001; Hirota et al., 2002). Therefore, we have purposefully induced oriented azo dye (Sunset Yellow) dopants in inorganic host (KDP) matrix, with an aim of improving its optical, mechanical, dielectric and thermal characteristics. We found that the SSY dye stained the two {0 0 1} faces and eight pyramidal {1 0 1} faces, while the four prismatic {1 0 0} faces remained uncolored. Moreover, it is expected that the results presented here would help in developing tailor-made dyed crystals containing molecular guests with superior properties useful for opto-electronics.
2 Experimental details
2.1 Crystal growth
Pure and dye doped KDP single crystals were grown using commercially available potassium dihydrogen orthophosphate (Merck, 98%) and sunset yellow dye (Sigma Aldrich, 99.9%) as raw materials. KDP salt was dissolved in distilled water (150 mL) until saturation, followed by stirring for 4 h to obtain homogeneous solution. The resulting solution was filtered, kept in beaker with perforated aluminum foil lid and was maintained at fixed temperature of 30 °C (±0.1 °C) using constant temperature bath. Transparent crystals of KDP were harvested after a time period of 20 days. For the growth of 0.05 mol% (SKDP-1) and 0.1 mol% (SKDP-2) SSY stained KDP crystals, appropriate amount of dye was added to the starting solution. Good quality dyed crystals were obtained from the prepared solution in around 15–17 days. A similar growth boosting outcome was observed for several other stained crystals (Yadav et al., 2016a; Goel et al., 2018a). The picture of harvested un-dyed and SSY dyed host (KDP) crystals is displayed in Fig. 1.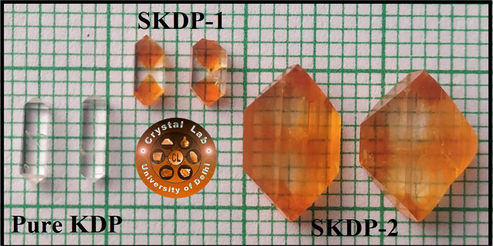
Photograph of pure & SSY doped KDP crystals.
2.2 Morphological studies on KDP crystal
The agreement between the observed habit of grown crystal and the theoretical habit derived from various available models in literature becomes important when it comes to the practical usability of dyed crystals in solid state dye lasers and other optoelectronic devices applications (Goel et al., 2017, 2018b; Yadav et al., 2016b, 2016c). How the external appearance of grown crystal is related to its internal crystal structure, has always been the question of interest both for the academicians as well as for the industrialists (Yadav et al., 2016b). To answer this quest, numerous theories are already available in literature to envisage the morphology of the crystal based on its internal crystal configuration (Yadav et al., 2016b; Docherty et al., 1991; Hartman and Perdok, 1955a,b). Fig. 2 displays the high resolution photograph (clearly depicting the crystal planes of actually grown KDP) and simulated indexed morphological drawing of as grown KDP crystal using WinXMorph program (Kaminsky, 2005). The external appearance of a crystal can be understood in terms of its unit cell dimensions and crystal symmetry (space group) using the combined form of law proposed by Bravais (in 1866), Friedel (in 1907), Donnay and Harker (in 1937) (Docherty et al., 1991), named as BFDH law. According to which, the most energetically favorable (slowest growing) faces are those which have largest interplanar spacing i.e., highest density of the intermediate layers (Docherty et al., 1991).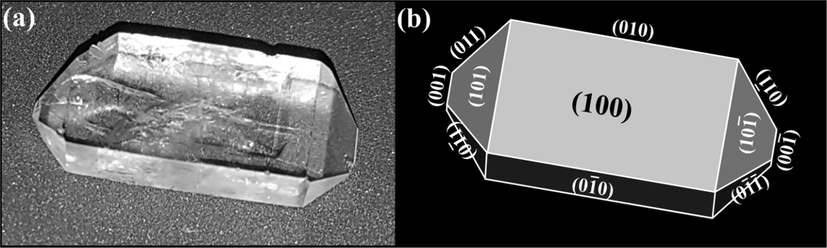
Photograph and morphological drawing (indexed) of un-dyed KDP crystal.
The comparative growths of all the crystallographic facets present in KDP crystal play an inevitable role in the final appearance of the crystal. Based on BFDH theory, Table 1 lists the relative growth rates and morphological importance (M.I.) of facets of KDP crystal. BFDH model predicts the four prismatic (1 0 0), (0 1 0),
&
facets with largest appearance or morphological importance. Therefore, we obtain that the crystal habit of a KDP crystal consists fourteen faces in total and the descending order of MI of various facets in KDP crystal can be arranged as: {1 0 0} > {0 0 1} > {1 0 1}. The indexed external appearance simulated using BFDH theory is depicted in last column of Table 1. On clear observation, one could conclude that the theoretically simulated habit by BFDH theory shown in Table 1 does not exactly match with the harvested habit (see Fig. 2(b)) of KDP crystal. The relative growth rate of KDP along [0 0 1]-crystallographic axis actually appears to be more than the predicted one (by BFDH).
(hkl)Facets
dhkl(Å)
Comparative growth rates
Morphological importance (M.I.)
Morphology predicted using BFDH theory
(0 1 0), (1 0 0),
,
7.46
1.0
1.0
(0 0 1),
6.98
1.07
0.94
(0 1 1),
5.09
1.47
0.68
One should not forget that while considering the BFDH law, the directions of strong and weak bonds present in KDP crystal system were overlooked. Therefore, a proper consideration needs to be given to various intermolecular interactions there among the crystallizing units of KDP crystal. In year 1955, two scientists namely, Hartman and Perdok successfully defined the connection of external crystal shape with the interaction bonds present between crystallizing units, which were called as periodic boundary chain (PBC) vectors (Hartman and Perdok, 1955b; Kaminsky, 2005; Hartman, 1956). KDP crystallizes in the I 2d space group with a = 7.46 Å and c = 6.98 Å. In KDP unit cell, K+ and H2PO4− serves as the basic building units which are arranged in a tetragonal lattice and results in crystallization of KDP bulk crystal. Fig. 5(b) depicts the unit cell packing diagram of KDP crystal view along ab plane (K+ cations have been omitted for the reason of clarity). Each phosphate H2PO4− anion is hydrogen bonded to four other H2PO4− anions which lie approximately perpendicular to the ferroelectric [0 0 1]-axis. These hydrogen bonds are the shortest (strongest) hydrogen bond, while the K+ cations form much weaker ionic interaction with the H2PO4− anions. Presence of the tetragonal prisms on both sides of the tetragonal pyramid with {0 0 1} planes being least visible can be attributed to large number of periodic boundary chain vectors present parallel to [0 0 1] direction.
2.3 SSY dye inclusion in different growth sectors of KDP crystal
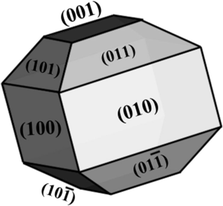
No change in the morphology of pure and SSY stained KDP crystal was observed except the incorporation of dye in selected growth sectors for dyed crystal. Due to anisotropic behavior of KDP crystal, various crystallographic faces have different affinities for SSY dye molecules in the aqueous dye solution (Hartman, 1956; Goel et al., 2018a; Goel et al., 2020). Fig. 3(a) displays the snap of as harvested SSY stained KDP crystal clicked under day light. The distribution of SSY dye into different crystallographic planes of KDP was studied by drawing the morphology of SSY-dyed KDP using ‘WinXMorph’ software. Fig. 3(b) depicts the indexed morphology and selective dye inclusion in KDP crystal. The coloring of KDP crystal was found to be biased and was limited to only to the pyramidal ({1 0 1} & {0 0 1}) growth sectors. The inclusion of SSY dye in ({1 0 1} & {0 0 1}) growth sectors of the KDP crystal was further confirmed by recording the image of SSY dyed crystal under long UV and short UV illumination (Fig. 3(c & d)). Similar dyeing patterns have been observed for KDP crystals doped with other organic azo sulfonated dyes (Chandran et al., 2017; Arumugam et al., 2019; Kanimozhi et al., 2019; Velikhov et al., 2007).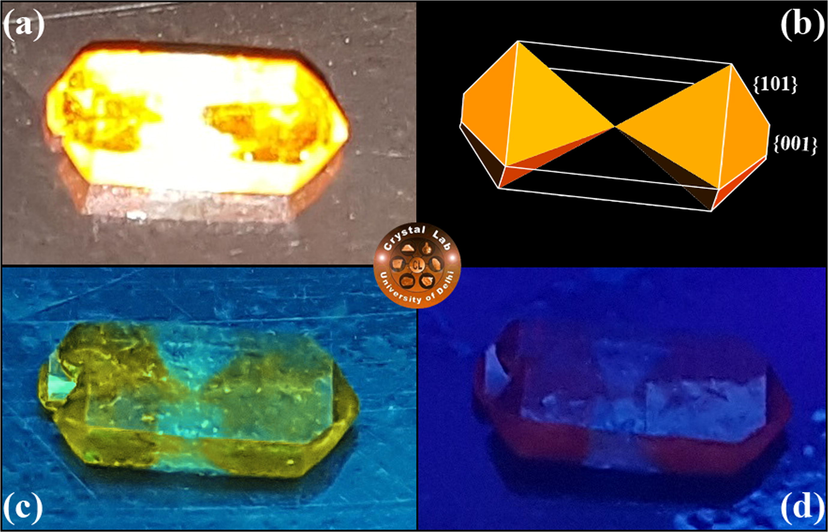
(a) Photograph of SSY stained KDP crystal clicked in day light. (b) Indexed morphological drawing of selective colouring in pyramidal (
& {1 0 1}) sectors of host KDP crystal. Fluorescence from the same SSY doped KDP crystal under (c) long UV, and (d) short UV illumination.
As found in above studies, SSY molecules are introduced selectively into the pyramidal (
& {1 0 1}) growth sectors of the growing KDP crystal. Moreover, the prismatic growth sector did not attract any SSY dye molecules and remained colorless. Therefore, the dye inclusion selectivity of SSY dye in different growth sectors of KDP crystal can be ordered as: ({0 0 1} = {1 0 1}) > ({1 1 0} = 0). This selective nature of SSY dye molecules towards different crystallographic facets of host KDP crystal can be understood on the basis of positive charge at the ten faces {1 0 1} & {0 0 1} and the neutral charge of the four prismatic faces ({1 0 0}). Fig. 4 depicts the ball and stick representation of a single sunset yellow dye (disodium 6-hydroxy-5-[(4-sulfophenyl)azo]-2-napthalenesulfonate) molecule. It can clearly be seen that each dye molecule contains two negatively charged anionic, namely, SO3− functional groups. As a result of which, SSY dye molecule will show a strong tendency to get adsorbed on the positively charged facets of the KDP crystal, which can be ordered as ({0 0 1} = {1 0 1}) > ({1 1 0}), hence explaining the obtained pattern of dye inclusion. The understanding developed on selective SSY dye inclusion is summarized in Fig. 5. However, this model remains interim at this time (though suggestive) and accounts fordetailed analysis in near future. Further, conformity on the presence of SSY dye molecules was obtained by recording the solid state absorption characteristics of SSY-dyed KDP crystal in experimental section (see Section 3.4).![The ball-stick representation of the Sunset Yellow (disodium 6-hydroxy-5-[(4-sulfophenyl)azo]-2-napthalenesulfonate) dye molecule with atomic numbering scheme. Oxygen, sulfur, carbon and nitrogen atoms are represented as yellow, red, dark grey and blue color balls, respectively. The hydrogen atoms are shown by green capped sticks for clear view.](/content/184/2020/13/6/img/10.1016_j.arabjc.2020.04.013-fig5.png)
The ball-stick representation of the Sunset Yellow (disodium 6-hydroxy-5-[(4-sulfophenyl)azo]-2-napthalenesulfonate) dye molecule with atomic numbering scheme. Oxygen, sulfur, carbon and nitrogen atoms are represented as yellow, red, dark grey and blue color balls, respectively. The hydrogen atoms are shown by green capped sticks for clear view.
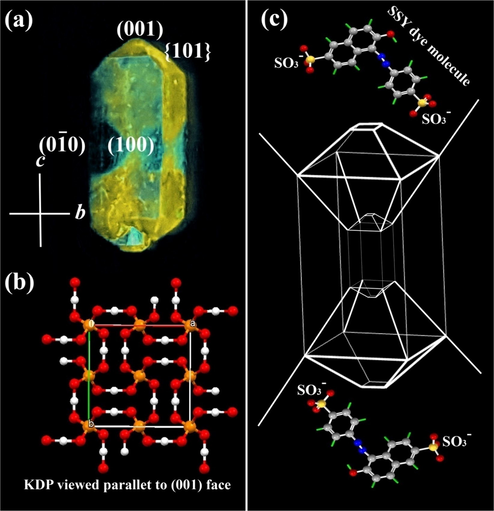
(a) KDP crystal containing luminescent SSY dye in the (
& {1 0 1}) growth sectors.(b) Molecular packing diagram of KDP crystal when viewed along ab plane. (c) The habit of KDP crystal bounded by SSY dye molecule that stains the pyramidal (
& {1 0 1}) growth sectors. Conformations of guest dye molecules in pyramidal sectors using ball- & stick diagrams.
2.4 Characterization techniques
The crystallographic structure of the grown crystals was examined by Rigaku Ultima IV X-ray diffractrometer with CuKα (λ = 1.5405 Å) radiation operated at 40 kV and 40 mA. FTIR spectra of pure and SSY dye doped KDP crystals were recorded by Perkin Elmer Frontier FTIR spectrometer between the wavenumber 4000–400 cm−1 using KBr pellets. Raman spectra of the crystals powder were recorded by Via-Renishaw Laser Raman Spectrometer having laser photon of wavelength 514 nm. The UV–Vis analysis of pure and dye doped KDP crystals was recorded using High Performance Perkin-Elmer Lambda 950 UV–Vis spectrometer. PL emission spectrum of both the crystals was measured with the help of Model QM-8450-11, Quanta master, up conversion and down conversion fluorescence spectrometer. For dielectric characterization, the crystals were polished and the electrodes were prepared using silver paste. The dielectric properties were then investigated for all the samples using Agilent E4980ALCR meter. Thermo gravimetric (TG) and differential thermal (DT) analysis were carried out on a Perkin-Elmer diamond TG/DTA analyzer (in N2 atmosphere; heating rate @ 1 °C/min). Micro hardness number estimation was performed on KDP, SKDP-1 and SKDP-2 samples using Vickers micro-hardness tester (MVH-I) equipped with pyramidal diamond indenter.
3 Results and discussions
3.1 XRD analysis
The XRD patterns of powdered samples of pure and SSY dye doped KDP crystals have been obtained in order to analyze the phase purity and crystallinity of the crystals and are shown in Fig. 6. No peaks other than tetragonal phased KDP were observed, suggesting that high-purity KDP crystals were obtained. However, variation in the intensity of Bragg peaks was observed as an effect of dye doping which may be due to varied electronic density along stained crystallographic planes (Hussain et al., 2020). All the peaks of undoped KDP in the XRD pattern were indexed using standard JCPDS card no. 035-0807. The same tetragonal crystal structure was also observed for the stained crystals. In order to analyze the effect of dye in the crystal structure of KDP, the lattice parameters were calculated by Chekcell software and are tabulated in Table 2. The cell parameters of SKDP-1 and SKDP-2 were slightly increased when compared with the pure KDP crystal due to the strain produced in the crystal lattice as a result of SSY dye inclusion. Therefore, the expansion of the unit cell along with variation in the relative intensity of the Bragg peaks confirmed successful inclusion of SSY dye molecules in the crystal structure of KDP.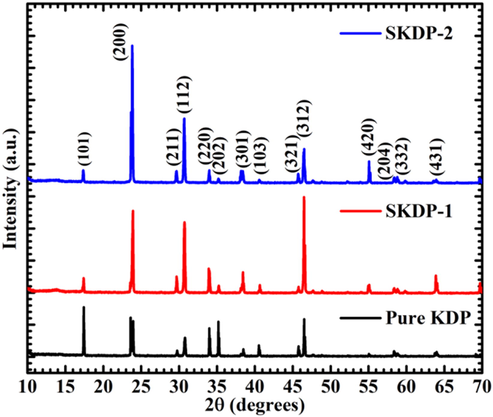
XRD patterns of pure and SSY-dye doped KDP crystals.
Lattice parameters
Pure KDP
SKDP-1
SKDP-2
Crystal structure
Tetragonal
Tetragonal
Tetragonal
Cell length, a = b (Å)
7.4532
7.4563
7.4609
Cell length, c(Å)
6.9811
6.9814
6.9834
Cell angle, α = β = γ(o)
90
90
90
Cell volume, V(Å3)
387.80
388.14
388.73
3.2 Functional group analysis using FTIR spectroscopy
Fourier Transverse Infrared (FTIR) Spectroscopy is probably the fast technique to reveal molecular structure with primary functional groups. Atoms of molecules of any substance vibrate continuously with natural frequency in the range of 1013 to 1014 Hz, which is the frequency range of mid-infrared radiation. In this spectroscopic technique, the frequencies of infrared signal corresponding to vibrational frequencies of functional groups or bonds get absorbed. Fig. 7 shows the recorded FTIR spectra in transmission mode of three different pellets of pure KDP, SKDP-1 and SKDP-2 using KBr pellet method, in the spectral range of 4000–400 cm−1 at a resolution of 4 cm−1. These spectra mainly show the absorbance peaks of stretching and bending vibration of bonds in free (H2PO4)− ions of KDP crystal. Each PO4 group is centered by four adjacent PO4 groups linked with four hydrogen bonds lying almost in same plane in KDP crystal structure (Ettoumi et al., 2013). The SSY dye doped crystals show slight shift in some of the characteristics vibration frequencies and variation in peak intensity. In FTIR spectrum, there is a broad band in the higher frequency region due to O-H stretching vibration of (H2PO4)− ions. The absorption at 3441 cm−1 in both doped crystals SKDP-1 and SKDP-2 may be attributed to hydrogen bonded O-H stretching which is actually at 3447 cm−1 in pure KDP (Zhou et al., 2019). There are some other absorption peaks at 2925, 2856, 2352 and 2344 cm−1 in pure KDP which may due to different frequencies of O-H stretching in H2PO4 ions and these are slightly shifted in SKDP-1 and SKDP-2 due to dye doping. The absorption peaks at 1635 cm−1 are due to O=P-OH stretching in all three crystals (Dizaji and Rousta, 2016; Krishnamurthy et al., 2013). The absorption peaks below 1400 cm−1 are mainly due to different kinds of PO4 vibration. The peaks at 1302, 1106 and 918 cm−1 in pure KDP, peaks at 1301, 1102 and 912 cm−1 in SKDP-1, and peaks at 1301, 1102 and 910 cm−1 in SKDP-2 are due to P=O asymmetrical stretching, P=O symmetrical stretching and P-OH symmetrical stretching, respectively (Zhou et al., 2019; Krishnamurthy et al., 2013). A strong absorption peak at 536 cm−1 in pure KDP represents the HO-P-OH bending which is shifted at 538 cm−1 in both doped crystals (SKDP-1 and SKDP-2) (Zhou et al., 2019; Dizaji and Rousta, 2016; Krishnamurthy et al., 2013). A weak strength of absorption peak at 450 cm−1 in pure KDP is due to HO-P-OH bending vibration, which is shifted at low frequency 445 cm−1 in both doped crystal (SKDP-1 and SKDP-2) (Ettoumi et al., 2013; Dizaji and Rousta, 2016). From comparison of the FTIR spectra of these three crystals, it will be easy to say that both SSY dye doped crystals contain all functional groups occurred in pure KDP crystal with a slight shift in frequency. Peaks in all three crystals and their functional group assignments are listed in Table 3.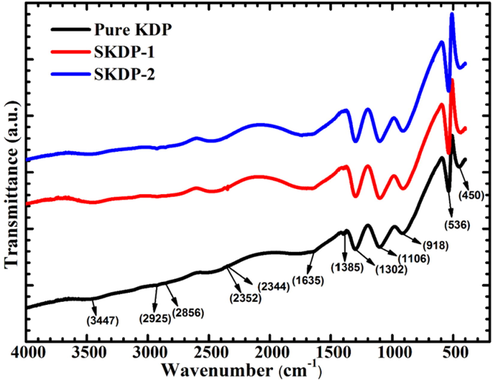
FTIR spectrum of pure KDP, SKDP-1 and SKDP-2 crystals.
Pure KDP (cm−1)
SKDP-1 (cm−1)
SKDP-2 (cm−1)
Vibrational assignments
450
445
445
HO-P-OH bending
536
538
538
HO-P-OH bending
918
912
910
P-OH symmetrical stretching
1106
1102
1102
P=O symmetric stretching
1302
1301
1301
P=O asymmetric stretching
1385
1385
1385
P=O stretching
1635
1636
1636
O=P-OH stretching
2344
2347
2348
O-H stretching
2352
2355
2355
2856
2856
2856
2925
2923
2925
P-O-H stretching
3447
3441
3441
O-H stretching Vibration
3.3 Raman analysis
Raman spectra help in identification of involved vibrational states of the molecules in a substance. This yields by a molecular spectroscopic technique, Raman spectroscopy which works on principle of inelastic scattering of monochromatic light. Raman spectroscopy provides an important tool for molecular fingerprinting and monitors the changes in bond structure, state changes and crystalline form. Fig. 8 shows the recorded Raman spectra of crystal powder of pure KDP, SKDP-1 and SKDP-2 in the spectral range 50–1250 cm−1 using the laser photon (wavelength 514 nm). Raman spectra can be divided into two frequency region viz. low-frequency region (below 300 cm−1) and high-frequency region (300–1200 cm−1). The low-frequency region, attributed to external vibrations, includes the vibration of the crystal lattice consists of K+ and H2PO4− ion whereas the high-frequency region represents the internal vibrations of H2PO4− ion (Som et al., 2001; Subramonyet al., 1999; Srivastava et al., 1974; Babrouj and Malekfar, 2007; Lu and Sun, 2002). External modes of vibrations are effect of translational and vibrational motion of anions and cations of KDP crystal. The translational and vibrational motion of anions is form of stretching and bending of hydrogen bond inside the layers of crystal. These are observed below 300 cm−1 for KDP crystal families (Ettoumi et al., 2013). In Raman spectra (Fig. 8), the peaks observed at 112 and 152 cm−1 in pure KDP, 113 and 153 cm−1 in SKDP-1 and 114 and 154 cm−1 in SKDP-2 may be assigned to K-PO4 translatory vibrations. The peaks at 96 cm−1 in both pure KDP and SKDP-1 and 95 cm−1 in SKDP-2 show the cluster external vibrational band. The band observed at 189 cm−1 from pure KDP, 191 cm−1 from SKDP-1 and 194 cm−1 from SKDP-2 can be attributed to the stretching (O-H···O) bridge vibration (Ettoumi et al., 2013; Som et al., 2001). The in-plane bending of P(OH)2 in pure KDP occurred at 357 cm−1 while it is shifted at 359 cm−1 in both SKDP-1 and SKDP-2. The out-of-plane twisting of P(OH)2 in pure KDP and SKDP-1 occurred at 390 cm−1 while it is shifted at 391 cm−1 in SKDP-2. The peaks at 474 and 530 cm−1 in all three crystals are of PO2 bending vibration (Yin et al., 2016; Liu et al., 2013). The main peak with high intensity at 915 cm−1 in the Raman spectrum of the pure KDP and SKDP-1 crystals is due to the asymmetrical P(OH)2 stretching mode which is the ‘fingerprint' part of spectra for this crystal material (Pritula et al., 2016). It is the main characteristics of the internal vibration mode and the obtained results matched with previous research papers on KDP crystals. In Raman spectra, all peaks that occurred in pure KDP are also present in SKDP-1 and SKDP-2, with a slight shift in frequency and intensity. The intensity of the most important peak at 913 cm−1 in SKDP-2 is nearly one and half times higher than in pure KDP. The intensity of same peak in SKDP-1 is also higher than pure KDP. Peak positions for pure as well as doped crystals and their vibrational assignments are listed in Table 4.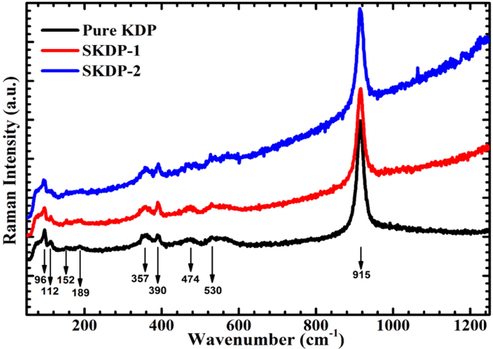
Raman spectra of pure KDP, SKDP-1 and SKDP-2 crystals.
Pure KDP (cm−1)
SKDP-1 (cm−1)
SKDP-2 (cm−1)
Vibrational assignments
96
96
95
Cluster external vibration
112
113
114
K-PO4translatoryvibration
152
153
154
K-PO4translatoryvibration
189
191
194
O-H···O bridge vibration
357
359
359
In-plane bending P(OH)2
390
390
391
Out-of-plane bending P(OH)2
474
474
474
PO2 bending vibration
531
531
531
PO2 bending vibration
915
915
913
Asymmetrical stretching P(OH)2
3.4 UV–Vis-NIR analysis
The UV–Vis-NIR analysis was performed on solution grown pure and SSY doped KDP crystals in the range from 190 to 1100 nm. Fig. 9(a) depicts the transmittance spectrum of the pure and SSY doped KDP single crystals. The materials with lower cut off wavelength from 200 nm to 300 nm with high transmittance are suitable and potential candidate for UV tunable lasers (Shaikh et al., 2015, Vivek and Murugakoothan, 2013; Sinha et al., 2009). The value of lower cut off wavelength for pure KDP and dye doped KDP crystal was observed at ∼199 nm, which indicates KDP is a good material for photo-electronic applications. The transparency of pure KDP single crystal was found to be (see Fig. 9(a)) 85% which is slightly higher (1%) than the SSY doped KDP crystal in the UV–Vis region. The high transmittance of pure KDP shows that it has high degree of optical quality as compared to SSY doped KDP crystal. Moreover, transmittance of KDP crystal further decreased with further increase in dye concentration. The positively charged face of KDP lattice site adsorbed the organic dye molecules and results in decreased transmittance (Velikhov et al., 2007).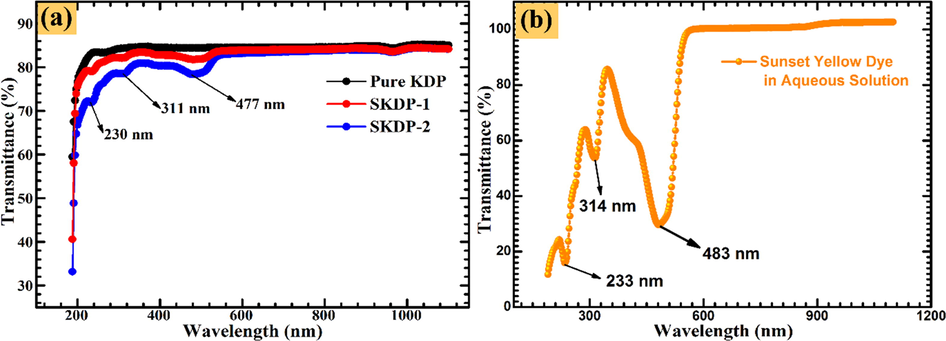
(a) UV–Vis-NIR transmittance spectrum of pure KDP and SSY dyed KDP crystals. (b) SSY dye transmittance spectrum recorded in aqueous solution.
The absorption dips at 230 nm, 311 nm and 477 nm in the transmittance spectrum (Fig. 9(a)) confirmed that the dye molecules are incorporated in the matrix of pure KDP single crystal. A small dip in the wavelength range 255–270 nm was observed for all the samples as a consequence of change in optics of photometer. The transmittance spectrum of SSY dye in aqueous solution shows four characteristic peaks at 233 nm, 316 nm, 403 nm and 483 nm (Fig. 9(b)). Also, these blue shifts in absorption maximas further show the successful inclusion of dye molecules in the lattice of pure KDP crystal. The absorption coefficient was calculated by the relation (Bhukkal et al., 2018):
In the above relation, ‘A’ is a constant, ‘h’ is the Plank’s constant, ‘Eg’ represents the optical energy band gap and ‘n’ determine the optical transition nature. The value of ‘n = 1/2’ for indirect transition and ‘n = 2’ is selected for direct transition (Karuppasamy et al., 2018). For pure and SSY dyed KDP crystal the value of ‘n’ was observed to be ‘2’, which shows that KDP crystal is an optical direct band gap material. Fig. 10 display the Tauc’s plot of pure and SSY dyed KDP single crystal. The Tauc’s plot (Fig. 10) analysis shows that the value of ‘Eg’ was observed to be 6.422 eV, 6.392 eV and 6.354 eV for pure KDP, 0.05 mol% and 0.1 mol% SSY dyed KDP crystal, respectively. The decrease in the value of Eg with dye doping may be accredited to increase in defect concentration, which is apparent from reduced transmittance in SSY dyed crystals (Chandran et al., 2015; Stapper et al., 1999).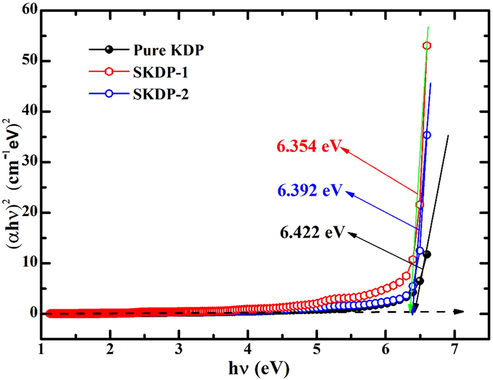
Shows the Tauc's plot for calculation of band gap of pure KDP and SSY dyed KDP.
3.5 Photoluminescence analysis
Photoluminescence spectroscopy is a non-destructive technique and widely used to determine the presence of defects in a material. Fig. 11 depicts the PL spectrum of the pure and SSY dyed KDP single crystal. The spectrum shown in Fig. 11 was recorded for the excitation wavelength 225 nm in the range from 380 nm to 425 nm. The PL spectra of both pure and doped KDP crystal show a maximum emission peak centered at 409 nm with two low intensity peaks centered at 392 nm and 428 nm. These PL peaks are originated due to relaxation of excited electrons from higher to lower energy states of specific color centers present in KDP crystal with a corresponding emission of photons under certain conditions. The low intensity peaks in the PL spectra are due the intrinsic defects present in the forbidden band region of KDP single crystal (Goel et al., 2013). In Fig. 11 (PL spectra) the increase in peak intensity due to doping in KDP crystal is clarified with the help of Rashba effect (Meletov and Shchanov, 1986). Doping of SSY dye in the KDP crystal creates the defect levels in KDP crystal system, these defect levels is the main reason of increase in the PL yield. This makes the SSY dyed KDP more promising material for photonic applications (Karuppasamy et al., 2018).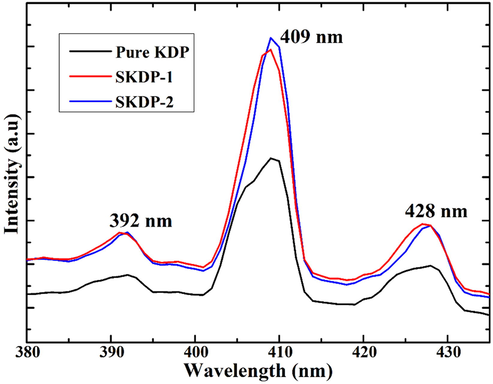
PL spectra of pure and SSY doped KDP crystal.
3.6 Dielectric study
The knowledge about the dielectric behavior of a material is important as it helps in understanding the utility of the material in various applications such as patch antenna, filters, charge storage devices etc. (Yadav et al., 2016a; Hatton et al., 2006; Ramteke et al., 2018). Fig. 12(a) depicts the frequency dispersion in room temperature dielectric constant (ε') values of grown KDP crystals along (1 0 0) plane in the frequency range 20 Hz to 2 MHz. The value of ε' was found to decrease rapidly at low frequencies (upto 1 kHz), slowly in the frequency range 1 kHz to 10 kHz and attained saturation at high frequencies. The higher value of ε' at low frequencies originate from the combined effect of different polarizations (i.e., dipolar, ionic, space charge and electronic). With increasing frequency, the effect of space charge polarization deceases leaving ε' frequency independent in high frequency regime.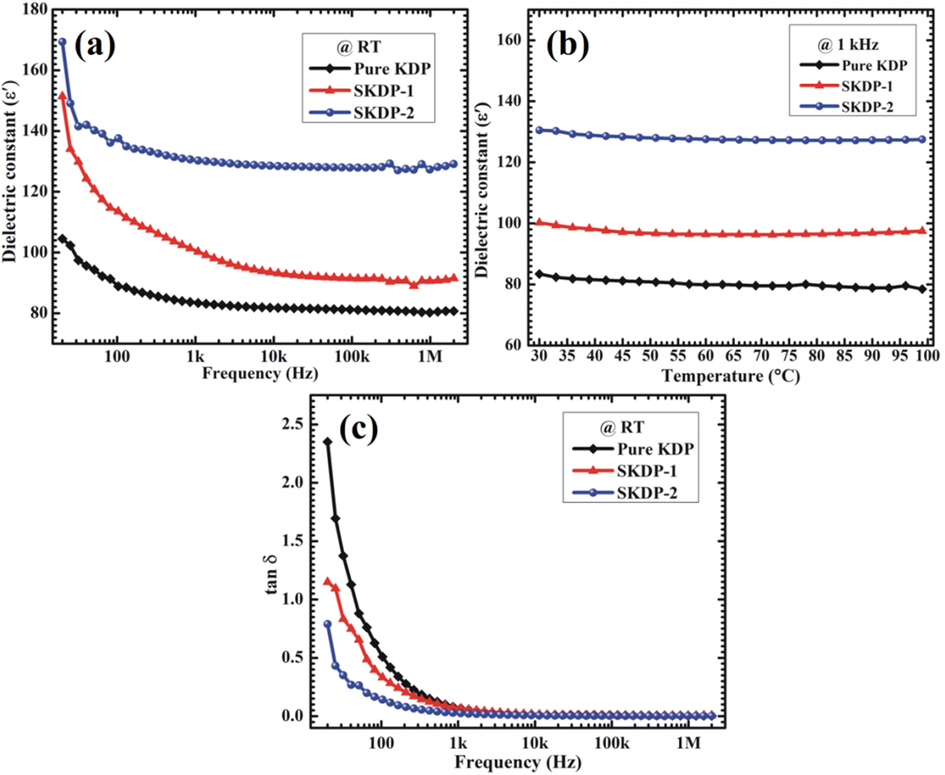
(a) Frequency and (b) temperature dependence of dielectric constant (ɛ́) for KDP, SKDP-1 and SKDP-2 crystals. (c) Plot of tangent dielectric loss (tan δ) vs. frequency for pure and dyed KDP crystals.
Fig. 12(b) shows the temperature dependence of ε' for the grown crystals measured over the temperature range 30 °C–100 °C at 1 kHz. The increment in the value of ε' due to SSY dye inclusion into the host KDP lattice may be attributed to the creation of additional electric dipoles. Also, in the selected temperature range (30 °C−100 °C), no phase transition was observed in any sample. Fig. 12(c) depicts the plot of dielectric loss (tan δ) values, which represents the energy dissipated in a dielectric system, versus frequency. As can be seen, tan δ exhibits similar trend as that of ε' with increasing frequency. The dielectric loss for dyed KDP crystals was observed to be smaller compared to that obtained for pure KDP, suggesting the improved optical quality of dyed crystals with lesser defects (Rajesh et al., 2014). A reasonably low value of tan δ (less than 0.05) was achieved for the frequencies above 5 kHz, suitable for practical applications. Enhanced dielectric constant and reduced dielectric loss observed for SSY dye doped KDP crystals implies that dyed crystals are better candidates for charge storage and non-linear optical devices.
3.7 Thermal analysis
Thermal analysis of the grown crystal has been carried out using thermo gravimetric (TG) and differential thermal analysis (DTA); these are the important tools for getting information about different stage of phase transition as well as decomposition temperature of the grown crystals. Fig. 13 depicts the TG/DTA spectra of un-dyed KDP and SSY stained KDP crystals. It is clear from the plot that no weight loss till the temperature 193 °C, which means un-dyed KDP is thermally stable from room temperature to 193 °C. For SSY stained KDP crystals, no weight decay was recorded up till 200 °C (for SKDP-1) and 207 °C (for SKDP-2). Moreover, the DTA traces display an endothermic dip (decomposition temperature) at 222 °C, 226 °C and 234 °C for un-dyed, SKDP-1 & SKDP-2 crystal, respectively. In comparison to un-dyed KDP, the decomposition temperature got enhanced as a consequence of SSY dyeing. Dye molecules make bonding with ionic structure of KDP crystal. These bonding are a cause of increase in melting point. The thermal stability of a material is sensitive to the melting point of dopant. There are examples of decreased thermal stability (Rao et al., 2014) as well as increased thermal stability (Sinha et al., 2015; Goel et al. 2018a) depending on the relative decomposition temperature of dopant as compared to host material. The increase in the thermal stability of SSY dyed KDP single crystals in the present case is due to the higher decomposition temperature of SSY (>300 °C, Sigma-Aldrich safety data sheet) as compared to host KDP.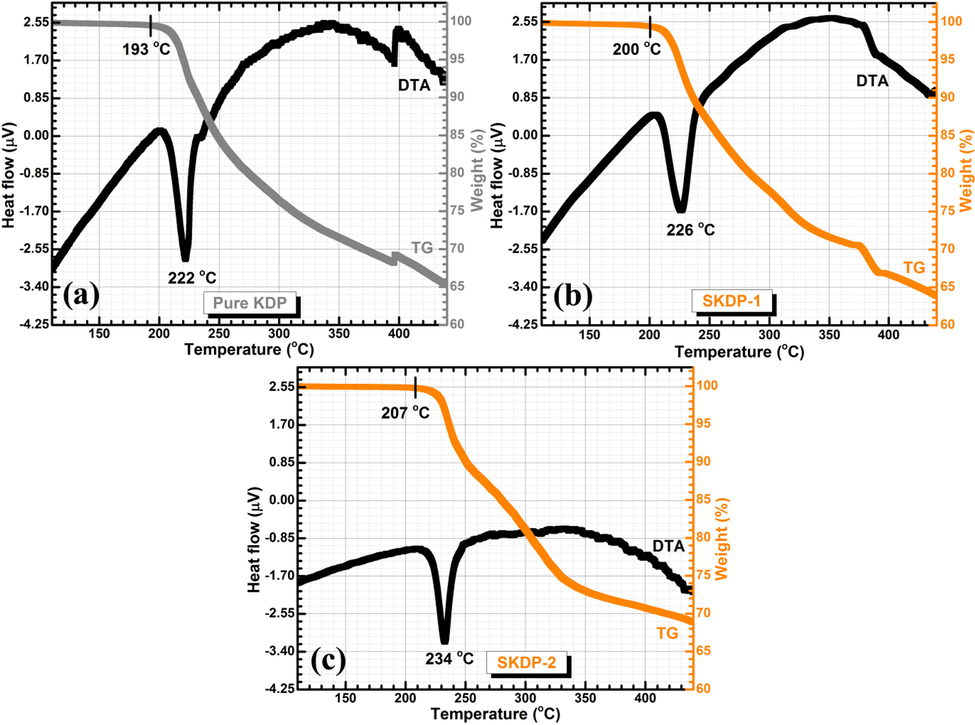
TG/DTA traces for (a) un-dyed KDP crystal, and (b& c) SSY dyed KDP crystals.
3.8 Mechanical properties
Material strength is determined as amount of resistance presented by the crystal to permanent distortion under applied load and it plays an important role in fabrication of devices (Ray et al., 2017; Justin et al., 2019; Joseph et al., 2020). Mechanical strength was estimated by using Vickers micro-hardness tester, which has a pyramid shape diamond indenter and indents were made on both pure and dye doped KDP crystal. Defect free, smooth and flat crystalswere selected for micro-hardness measurement. Impressions were made on pure and dyed KDP crystals for a constant dwell time of 5 s at varying applied load of 5 g, 10, 20, 30, 40, 50 and 100 g. Beyond an applied load of 100 g, multiple cracks were developed at the surface of crystals, which may occur due to release of internal stress.
Fig. 14 shows the impressions on surface of all three KDP crystals at varying applied loads. It is obvious from Fig. 14 that the size of the indentation marks increases with increasing applied indenter loads. The Vickers micro-hardness value (HV) of the material was calculated from the following relation (Goel et al., 2016; Hussain et al., 2020):
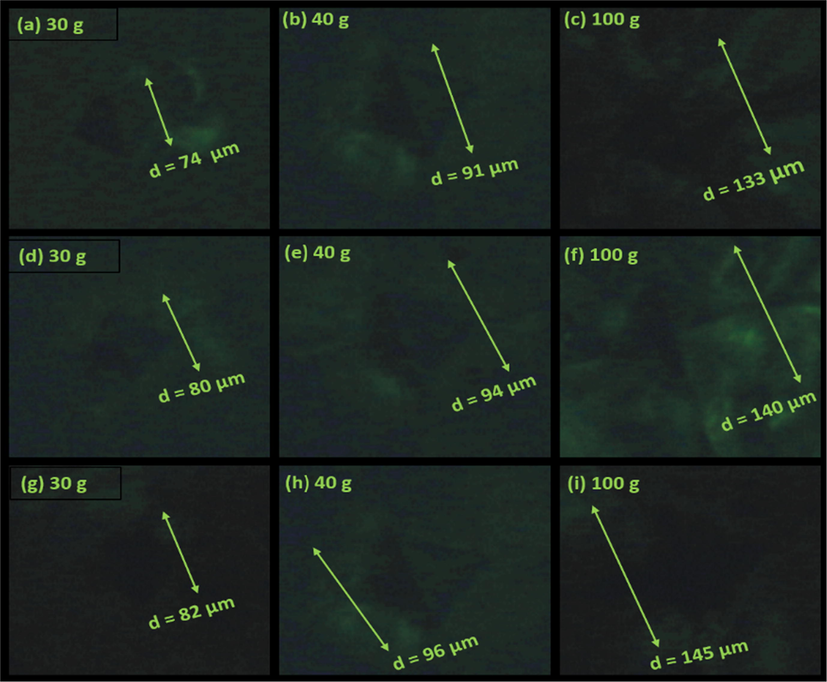
Indentation marks on surface of (a-c) pure KDP, (d-f) SKDP-1, (g-i) SKDP-2 crystals at various applied indenter loads.
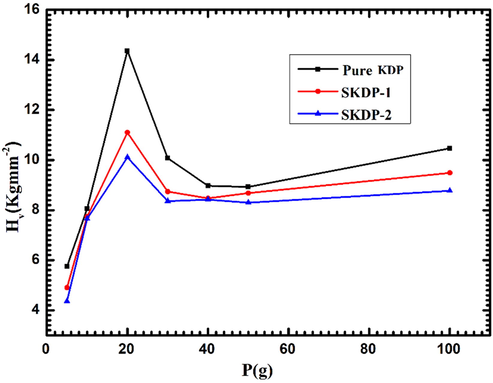
Vickers hardness number vs. applied load for pure KDP, SKDP-1 & SKDP-2 crystals.
Elastic stiffness constant (C11) provides information about bond strength of molecules and rigidity of as grown crystals. Value of stiffness constant (C11) is evaluated at different loads for all the three samples using Wooster relation (Batra et al., 2019): C11 = HV7/4. The values of stiffness constant for pure, SKDP-1 and SKDP-2 crystals at various applied loads are shown in Table 5. It is clear from the table that stiffness constant decrease with increasing concentration of SSY dye.
Applied load (in g)
Pure KDP
SKDP-1
SKDP-2
5
21.27
16.13
13.15
10
38.56
35.91
35.19
20
106.06
67.50
57.32
30
57.02
44.42
41.10
40
46.50
42.05
41.62
50
46.13
43.89
40.59
100
60.94
51.31
44.69
A material can be classified as hard or soft using the Meyer's relation which relates indentation diagonal size (d) and load (P) as (Anbukumar et al., 1986): P = kdn, which can be rewritten as:
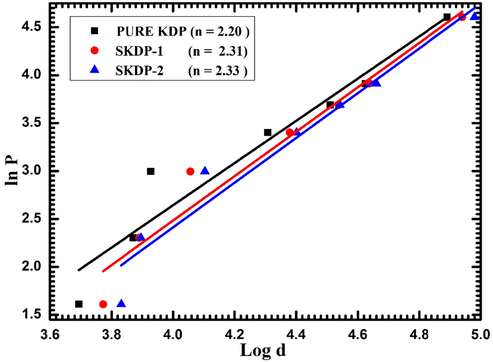
Plot of ln Pvs ln d for undoped and SSY dyed KDP crystals.
Fig. 17 shows graph between average diagonal indentation length (d, in μm) and average indentation depth (h, in μm) versus applied indenter load for KDP, SKDP-1 and SKDP-2 crystals. Average diagonal indentation length was nonlinearly increasing with applied load. Average indentation depth (h) depends on indentation length (d) for a diamond pyramid indenter of angle 136 ͦ between faces follow the relation: h=
(Goel et al., 2016; Joseph et al., 2020). Indentation depth ‘h’ follows the same nonlinear increasing tendency as of d. This kind of nonlinear nature can be understood on the basis of applied indenter load as: when applied indenter load value is low, only tiny layer of crystal surface were pierced by indenter load thus impressing was easy by load. However, as increasing indenter load indentation depth got increased, then inner layer of crystals played significant role, hence penetration on crystal surfaces were slightly difficult. Similar results were observed by several other authors as a result of dye inclusion in various host substance (Batra et al., 2019; Goel et al., 2016).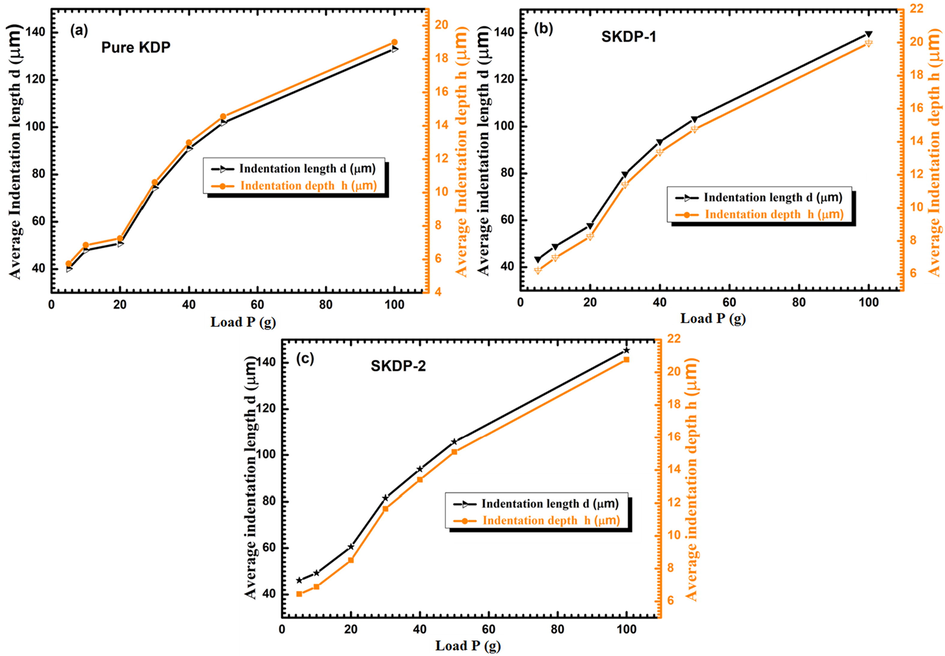
Graph of average diagonal indentation length (d, in µm) and average indentation depth (h, in µm) versus applied indenter load for (a) KDP, (b) 0.05 mol% SSY doped KDP and (c) 0.1 mol% SSY doped KDP.
4 Conclusions
In summary, pure and sunset yellow dye-doped KDP single crystals were successfully grown by slow evaporation solution technique. Theoretical morphology was calculated by employing BFDH law for grown crystal. SSY dye doping in KDP crystal does not alter the morphology except inclusion of dye in various growth sectors. Powder XRD analysis confirmed tetragonal crystal system for pure and SSY dye doped KDP crystals with space group I . From FTIR spectra, it was observed that SSY dye doped and pure KDP crystals have nearly same vibrational bands with slight difference in IR intensity. The dye doped KDP crystals have higher intensity of Raman bands compared to pure KDP crystal. From UV–Vis-NIR spectroscopy the lower cutoff wavelength value was found to be ∼199 nm with energy band gap of ∼6.4 eV for pure and SSY dyed KDP crystals, which makes it desirable material for photo-electronic applications. A peak at 409 nm in the photoluminescence emission spectrum shows a violet emission, which indicates the use of KDP crystal for violet lasers. In the dielectric study, enhancement in the value of dielectric constant and reduction in the value of dielectric loss (tan δ) was observed as a result of SSY dye doping. TG-DTA analysis showed that SSY dyeing resulted in an enhancement in the decomposition temperature from 222 °C for pure KDP to 226 °C for SKDP-1 and to 234 °C for SKDP-2. The mechanical strength and stiffness constant of the KDP crystal was decreased due to SSY dye inclusion in KDP lattice. Thus, SSY dye doping in KDP crystals resulted in improved optical, dielectric and thermal properties.
Acknowledgements
The authors are thankful to the Department of Science and Technology, India (Sanction No.: EMR/2015/000385) for financial support. Dr. Nidhi Sinha is grateful to the Principal, SGTB Khalsa College, for support and encouragement for research work. Kriti Batra, Sandeep Kumar and Sahil Goel are thankful to Council of Scientific and Industrial Research (CSIR), while Sumit Bhukkal and Ranjan Kumar express their gratitude to University Grants Commission (UGC) for research fellowship.
Declaration of Competing Interest
The authors declare that they have no known competing financial interests or personal relationships that could have appeared to influence the work reported in this paper.
References
- Utilization of waste glass powder in the production of cement and concrete. Constr. Build. Mater.. 2016;124:866-877.
- [CrossRef] [Google Scholar]
- Microhardness studies of ADP type crystals. J. Mater. Sci. Lett.. 1986;5:223-224.
- [CrossRef] [Google Scholar]
- Optical and dielectric studies of KH2PO4 crystal influenced by organic ligand of citric acid and l -valine: A single crystal growth and comparative study. Res. Phys.. 2016;6:645-650.
- [CrossRef] [Google Scholar]
- Doping effect of Ni2+ on structural, UV-visible, SHG efficiency, dielectric and microhardness traits of KH2PO4 (KDP) crystal. Optik (Stuttg).. 2019;178:752-757.
- [CrossRef] [Google Scholar]
- Investigation on the impact of xylenol orange dye on the growth and properties of unidirectional grown KDP crystals for photonic applications. J. Cryst. Growth. 2019;523 125154
- [CrossRef] [Google Scholar]
- Sunset yellow dye doped ammonium dihydrogen phosphate single crystals with enhanced optical, mechanical and piezoelectric properties. J. Mater. Sci. Mater. Electron.. 2019;30:14902-14912.
- [CrossRef] [Google Scholar]
- The pH effects on the growth rate of KDP (KH2PO4) crystal by investigating Raman active lattice modes. J. Raman Spectrosc.. 2007;38:1089-1096.
- [CrossRef] [Google Scholar]
- Up-conversion luminescence in dye-doped crystals of potassium hydrogen phthalate. Adv. Mater.. 2003;15:1068-1070.
- [CrossRef] [Google Scholar]
- Glycine glutaric acid cocrystals: Morphological, optical, dielectric and mechanical properties via nanoindentation. Vacuum. 2018;154:90-100.
- [CrossRef] [Google Scholar]
- Influence of amaranth dye on the growth and properties of KDP single crystal. Mater. Res. Bull.. 2015;68:210-215.
- [CrossRef] [Google Scholar]
- Effect of amaranth on dielectric, thermal and optical properties of KDP single crystal. Mater. Chem. Phys.. 2017;186:365-371.
- [CrossRef] [Google Scholar]
- Directional growth of KCl added KDP crystal from aqueous solution by S-R method and investigation on its physical properties. Optik (Stuttg).. 2016;127:11336-11341.
- [CrossRef] [Google Scholar]
- Application of Bravais-Friedel-Donnay-Harker, attachment energy and Ising models to predicting and understanding the morphology of molecular crystals. J. Phys. D. Appl. Phys.. 1991;24:89-99.
- [CrossRef] [Google Scholar]
- Effect of doping of KDP crystal with amino acid l-arginine on the strength properties and character of laser damage. J. Cryst. Growth. 2017;478:111-116.
- [CrossRef] [Google Scholar]
- Thermal analysis, Raman spectroscopy and complex impedance analysis of Cu2+-doped KDP. Ionics (Kiel).. 2013;19:1067-1075.
- [CrossRef] [Google Scholar]
- Enhanced optical, NLO, dielectric and thermal properties of novel sodium hydrogen phthalate single crystals doped with zinc. Opt. Mater. (Amst). 2013;35:479-486.
- [CrossRef] [Google Scholar]
- Effect of crystal violet dye on the structural, optical, mechanical and piezoelectric properties of ADP single crystal. Mater. Res. Bull.. 2016;83:77-87.
- [CrossRef] [Google Scholar]
- Sunset yellow dyed triglycine sulfate single crystals: enhanced thermal, mechanical, optical and di-/piezo-/ferro-/pyro-electric properties. J. Mater. Sci. Mater. Electron.. 2018;29:13449-13463.
- [CrossRef] [Google Scholar]
- An insight into the synthesis, crystal structure, geometrical modelling of crystal morphology, Hirshfeld surface analysis and characterization of N -(4-methylbenzyl)benzamide single crystals. J. Appl. Crystallogr.. 2017;50:1498-1511.
- [CrossRef] [Google Scholar]
- Optical, piezoelectric and mechanical properties of xylenol orange doped ADP single crystals for NLO applications. Arab. J. Chem.. 2020;13:146-159.
- [CrossRef] [Google Scholar]
- X-ray, dielectric, piezoelectric and optical analyses of a new nonlinear optical 8-hydroxyquinolinium hydrogen squarate crystal. Acta Crystallogr. Sect. B Struct. Sci. Cryst. Eng. Mater.. 2018;74:12-23.
- [CrossRef] [Google Scholar]
- On the relations between structure and morphology of crystals. I. Acta Crystallogr.. 1955;8:49-52.
- [CrossRef] [Google Scholar]
- On the relations between structure and morphology of crystals. III. Acta Crystallogr.. 1955;8:525-529.
- [CrossRef] [Google Scholar]
- The morphology of zircon and potassium dihydrogen phosphate in relation to the crystal structure. Acta Crystallogr.. 1956;9:721-727.
- [CrossRef] [Google Scholar]
- Coloring and habit modification of dyed KDP crystals as functions of supersaturation and dye concentration. J. Cryst. Growth. 2002;235:541-546.
- [CrossRef] [Google Scholar]
- Mechanical investigations on piezo-/ferrolectric maleic acid-doped triglycine sulphate single crystal using nanoindentation technique. Arab. J. Chem.. 2020;13:1874-1889.
- [CrossRef] [Google Scholar]
- Experimental and theoretical perspectives on ltryptophan: an amino acid single crystal for nonlinear optical applications. Rasayan J. Chem.. 2019;12:1219-1228.
- [CrossRef] [Google Scholar]
- True-remanent, resistive-leakage and mechanical studies of flux grown 0.64PMN-0.36PT single crystals. Arab. J. Chem.. 2020;13:2596-2610.
- [CrossRef] [Google Scholar]
- Enhanced piezoelectric, optical, mechanical, and laser damage threshold studies on creatinine doped glycine single crystals. J. Mater. Sci. Mater. Electron.. 2019;30:9735-9741.
- [CrossRef] [Google Scholar]
- WinXMorph: A computer program to draw crystal morphology, growth sectors and cross sections with export files in VRML V2.0 utf8-virtual reality format. J. Appl. Crystallogr.. 2005;38:566-567.
- [CrossRef] [Google Scholar]
- Synthesis, growth, and characterization of L-proline cadmium chloride monohydrate (L-PCCM) crystals: a new nonlinear optical material. Cryst. Growth Des.. 2007;7:183-186.
- [CrossRef] [Google Scholar]
- Effects of dyes in the growth, optical, mechanical and dielectric properties of KDP crystals. J. Mater. Sci. Mater. Electron.. 2019;30:10244-10255.
- [CrossRef] [Google Scholar]
- Growth and characterization of semi-organic nonlinear optical (NLO) guanidinium trichloroacetate (GTCA) single crystal. Optik (Stuttg).. 2018;156:707-719.
- [CrossRef] [Google Scholar]
- Growth and characterization of KDP crystals doped with l-aspartic acid. Spectrochim. Acta Part A Mol. Biomol. Spectrosc.. 2013;104:310-314.
- [CrossRef] [Google Scholar]
- Effect of xylenol orange dye on morphological, optical, piezo-/di-electric and mechanical properties of potassium hydrogen phthalate single crystals. Vacuum. 2020;175:109240.
- [CrossRef] [Google Scholar]
- Thermal, dielectric studies on pure and amino acid (l-glutamic acid, l-histidine, l-valine) doped KDP single crystals. Opt. Mater. (Amst). 2008;30:1361-1368.
- [CrossRef] [Google Scholar]
- Remarkable enhancement in crystalline perfection, second harmonic generation efficiency, optical transparency, and laser damage threshold in potassium dihydrogen phosphate crystals by L-threonine doping. J. Appl. Phys.. 2010;108 033506
- [CrossRef] [Google Scholar]
- Magic angle spinning NMR study of the ferroelectric transition of KH2PO4: definitive evidence of a displacive component. J. Phys. Condens. Matter. 2017;29:16LT01.
- [CrossRef] [Google Scholar]
- Raman spectra of deuterated potassium dihydrogen phosphate crystals with different degrees of deuteration. Chin. Phys. Lett.. 2013;30 067804
- [CrossRef] [Google Scholar]
- Raman study of lattice vibration modes and growth mechanism of KDP single crystals. Cryst. Res. Technol.. 2002;37:93-99.
- [CrossRef] [Google Scholar]
- Meletov, K.P., Shchanov, M.F., 1986. Rashba effect in a hydrostatically compressed crystal of deuteronaphthalene, 62, 1230–1235.
- KDP crystal doped with L-arginine amino acid: growth, structure perfection, optical and strength characteristics. Opt. Mater. (Amst). 2016;57:217-224.
- [CrossRef] [Google Scholar]
- Effect of crystal violet dye on the optical, dielectric, thermal and mechanical properties of <001> directed KDP single crystal. Mater. Res. Bull.. 2014;49:640-644.
- [CrossRef] [Google Scholar]
- Influence of Cu2+ ion on structural, luminescence and dielectric properties of zinc thiourea chloride metal-organic complex crystal. Optik (Stuttg).. 2018;154:275-279.
- [CrossRef] [Google Scholar]
- A study on the growth, optical, thermal, mechanical, dielectric and piezoelectric properties of dye doped KAP single crystals. Mater. Res. Bull.. 2014;60:709-713.
- [CrossRef] [Google Scholar]
- Enhanced dielectric piezo-/ferro-/electric properties of dye doped sodium acid phthalate crystal. Curr. Appl. Phys.. 2017;17:813-819.
- [CrossRef] [Google Scholar]
- Microhardness studies in gel-grown ADP and KDP single crystals. Bull. Mater. Sci.. 1992;15:333-338.
- [CrossRef] [Google Scholar]
- Study on optical properties of l-valine doped ADP crystal. Spectrochim. Acta Part A Mol. Biomol. Spectrosc.. 2015;136:1243-1248.
- [CrossRef] [Google Scholar]
- Effect of phenol red dye on monocrystal growth, crystalline perfection, and optical and dielectric properties of zinc (tris) thiourea sulfate. J. Appl. Crystallogr.. 2017;50:1716-1724.
- [CrossRef] [Google Scholar]
- Effects of methyl violet dye on the growth and properties of zinc (tris) thiourea sulfate single crystals. J. Phys. Chem. Solids. 2018;123:336-343.
- [CrossRef] [Google Scholar]
- Enhancement in ferroelectric, pyroelectric and photoluminescence properties in dye doped TGS crystals. J. Solid State Chem.. 2012;190:180-185.
- [CrossRef] [Google Scholar]
- Performance of crystal violet doped triglycine sulfate single crystals for optical and communication applications. CrystEngComm. 2015;17:5757-5767.
- [CrossRef] [Google Scholar]
- Solution growth and comparative characterization of L-HFB single crystals. Cryst. Res. Technol.. 2009;44:167-172.
- [CrossRef] [Google Scholar]
- Physico-chemical changes in ion-irradiated KDP. Nucl. Instrum. Methods Phys. Res. Sect. B Beam Interact. Mater. Atoms. 2001;179:551-556.
- [CrossRef] [Google Scholar]
- Temperature dependent raman study of KDP in the paraelectric phase. Chem. Phys. Lett.. 1974;26:157-162.
- [CrossRef] [Google Scholar]
- Ab initio study of structural and electronic properties of yttria-stabilized cubic zirconia. Phys. Rev. B. 1999;59:797-810.
- [CrossRef] [Google Scholar]
- Reevaluation of Raman spectra for KH2PO4 high-temperature phases. Chem. Mater.. 1999;11:1312-1316.
- [CrossRef] [Google Scholar]
- Growth and properties of dyed KDP crystals. Cryst. Res. Technol.. 2007;42:27-33.
- [CrossRef] [Google Scholar]
- Growth and anisotropic studies on potential nonlinear optical crystal imidazole–imidazolium picrate monohydrate (IIP) in different orientations for NLO device fabrications. Opt. Laser Technol.. 2013;49:288-295.
- [CrossRef] [Google Scholar]
- Effect of Fe 3+ on third-order optical nonlinearity of KDP single crystals. CrystEngComm. 2016;18:9292-9298.
- [CrossRef] [Google Scholar]
- Modified low temperature Czochralski growth of xylenol orange doped benzopheone single crystal for fabricating dual band patch antenna. J. Cryst. Growth. 2016;450:74-80.
- [CrossRef] [Google Scholar]
- New geometrical modeling to study crystal morphology. Cryst. Growth Des.. 2016;16:4559-4566.
- [CrossRef] [Google Scholar]
- Growth and structural and physical properties of diisopropylammonium bromide molecular single crystals. J. Appl. Crystallogr.. 2016;49:2053-2062.
- [CrossRef] [Google Scholar]
- Enhancement of optical, piezoelectric, and mechanical properties in crystal violet dye-doped benzophenone crystals grown by czochralski technique. Cryst. Growth Des.. 2015;15:4908-4917.
- [CrossRef] [Google Scholar]
- Efficiency and photostability of dye-doped solid-state lasers in different hosts. Opt. Mater. (Amst). 2001;16:29-38.
- [CrossRef] [Google Scholar]
- KDP single crystal growth via three-dimensional motion growth method. Cryst. Res. Technol.. 2016;51:491-497.
- [CrossRef] [Google Scholar]
- Growth and characterization of L-phenylalanine doped KDP crystals. Mater. Res. Bull.. 2019;113:146-151.
- [CrossRef] [Google Scholar]


