

Translate this page into:
Effect of zinc acetate addition on crystal growth, structural, optical, thermal properties of glycine single crystals
⁎Corresponding author. Tel.: +91 9842445995; fax: +91 422 2455230. anbuselvaraj@rocketmail.com (S. Anbu Chudar Azhagan) anbuchudargct@rediffmail.com (S. Anbu Chudar Azhagan)
-
Received: ,
Accepted: ,
This article was originally published by Elsevier and was migrated to Scientific Scholar after the change of Publisher.
Peer review under responsibility of King Saud University.

Abstract
In the present study, γ-glycine has been crystallized by using zinc acetate dihydrate as an additive for the first time by slow solvent evaporation method. The second harmonic conversion efficiency of γ-glycine crystal was determined using Kurtz and Perry powder technique and was found to be 3.66 times greater than that of standard inorganic material potassium dihydrogen phosphate (KDP). The analytical grade chemicals of glycine and zinc acetate dihydrate were taken in six different molar ratios: 1:0.2, 1:0.4, 1:0.6, 1:0.7, 1:0.8, and 1:0.9 respectively to find out the γ-polymorph of glycine. The lower molar concentration of zinc acetate yield only α-polymorph where as the higher molar concentration of zinc acetate inhibits the γ-polymorph of glycine which was confirmed by single crystal XRD and powder XRD studies. Inductively coupled plasma optical emission spectrometry (ICP-OES) was carried out to quantify the concentration of zinc element in the grown glycine single crystals. The concentration of zinc element in the presence of grown γ-glycine single crystal is found to be 0.73 ppm. UV–Visible–NIR transmittance spectra were recorded for the samples to analyse the transparency in visible and near infrared region (NIR). The optical band gap Eg was estimated for γ-glycine single crystal using UV–Visible–NIR study. Functional groups present in the samples were identified by FTIR spectroscopic analysis. Differential scanning calorimetry technique was employed to determine the phase transition, thermal stability and melting point of the grown crystal.
Keywords
Crystal growth
X-ray diffraction
Optical studies
Thermal analysis
Spectral studies
Nonlinear optical crystals

1 Introduction
Nonlinear optical (NLO) crystals with high second harmonic generation efficiencies and transparent in the visible and ultraviolet ranges are required for various devices in the field of optoelectronics and photonics (Calark, 1988). Amino acid crystals have been grown and studied by several researchers for their excellent nonlinear optical properties in the last two decades (Vijayan et al., 2009). The area of active research for many decades is understanding and controlling solution crystallization and polymorphism (He et al., 2006). In the recent past, growth and characterization of γ-glycine crystals have been reported by several researchers and it was observed that γ-glycine single crystals have been grown using additives such as sodium nitrate (Narayan Bhat and Dharmaprakash, 2002), potassium chloride (Sekar and Parimaladevi, 2009), potassium fluoride (Dillip et al., 2011), lithium nitrate (Esthaku Peter and Ramasamy, 2010), lithium bromide (Balakrishnan et al., 2008), lithium acetate (Dhanraj and Rajesh, 2009), potassium bromide (Zulifiqar Ali Ahamed et al., 2013), ammonium nitrate (Narayana Moolya et al., 2005), ammonium sulphate (Anbuchudar Azhagan and Ganesan, 2013), ammonium acetate (Anbuchudar Azhagan and Ganesan, 2012), ammonium carbonate (Anbuchudar Azhagan and Ganesan, 2013), magnesium chloride (Dillip et al., 2012), phosphoric acid (Parimaladevi and Sekar, 2010), and strontium chloride (Anbuchezhiyan et al., 2010). In this paper we report the crystal growth and characterization studies of γ-glycine crystals grown from aqueous solution of glycine in the presence of zinc acetate for the first time. The second harmonic generation efficiency of γ-glycine grown from zinc acetate additive is 3.66 times that of inorganic material potassium dihydrogen phosphate (KDP), where as the second harmonic generation efficiency of γ-glycine grown from lithium bromide additive is 3 times that of potassium dihydrogen phosphate (Balakrishnan et al., 2008). The highlight of the present work is the second harmonic efficiency of the grown crystal is slightly higher than the work reported earlier (Balakrishnan et al., 2008).
2 Experimental
2.1 Chemicals used
Glycine (C2H5No2 aminoaceticacid) SD-fine AR (99.5%) M.wt: 75.07 g/mol, zinc acetate dihydrate (C4H6O4Zn·2H2O) SD-fine AR (99.5%) M.wt: 219.50 g/mol and double distilled water were used for the crystal growth experiment.
2.2 Crystal growth
In series the analytical reagent chemicals of glycine and zinc acetate dihydrate were mixed in different molar ratios such as 1:0.2,1: 0.4, 1:0.6, 1:0.7, 1:0.8, and 1:0.9, respectively in 100 ml double distilled water to identify and confirm the presence of γ-polymorph in the aqueous solution. The prepared solutions were placed in a separate 100 ml beaker and the mixtures were stirred well continuously up to 6 h to get the homogenous saturated solutions. The saturated solutions were filtered with whatman 41 filter paper. The filtered saturated solutions were closed with a perforated cover and kept in a dust free environment and allowed to crystallize by slow evaporation at ambient temperature. After a nucleation period of 5–7 days of solvent evaporation, the solution becomes supersaturated and tiny crystals were found in the beakers containing molar ratios such as 1:0.9, 1:0.8, 1:0.7, and 1:0.6, respectively. The nucleation period τ for the grown crystals is presented in Table 1. From the growth experiment, it is clear that higher molar concentration of zinc acetate dihydrate (0.6–0.9) induces quick nucleation sites than that of lower molar concentration of zinc acetate (0.2, 0.4).
Molar ratio of Glycine and zinc acetate
Nucleation period τ in days
1:0.2
14
1:0.4
11
1:0.6
7
1:0.7
6
1:0.8
5
1:0.9
5
2.3 Crystal morphology
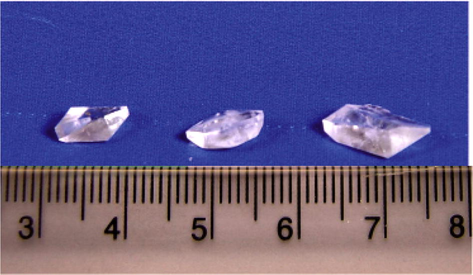
The morphology of the grown crystal changes from α to γ-polymorph when the concentration of zinc acetate exceeds 0.4 M. The α- and γ-polymorphs of glycine were confirmed by Single crystal XRD, Powder XRD and FTIR studies. The grown crystals were harvested after a period of 18 days. The harvested seed crystal of α-glycine and its bulk size are shown in Figs. 1 and 2. The morphology of the crystal resulted from lower molar concentrations of zinc acetate is shown in Figs. 3 and 4. Higher molar concentrations of zinc acetate lead to γ-polymorphs which are presented in Figs. 5–8.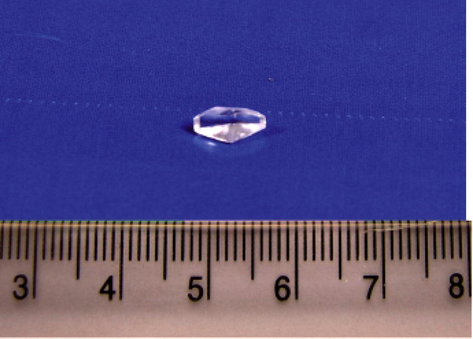
Harvested seed crystal of α-Glycine.
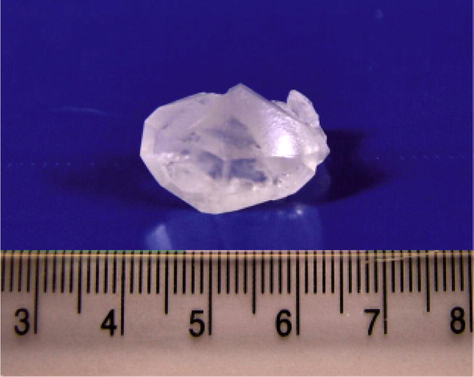
Bulk size of α-Glycine crystal.
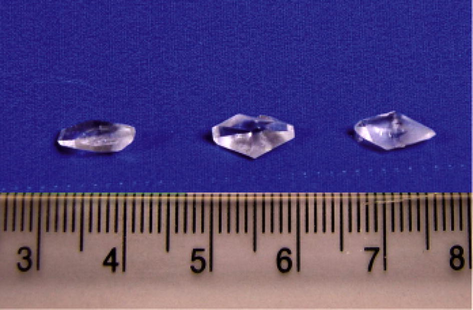
α-Glycine crystal (1:0.2).
α-Glycine crystal (1:0.4).
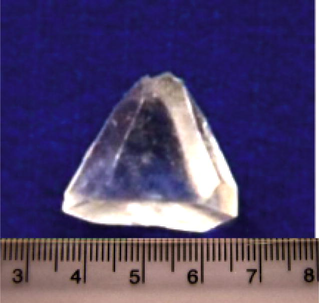
γ-Glycine crystal (1:0.6).
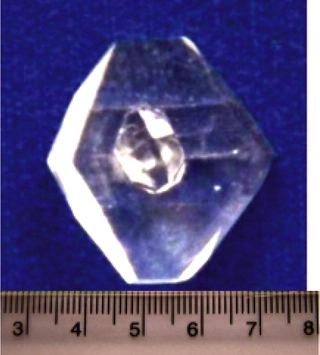
γ-Glycine crystal (1:0.7).
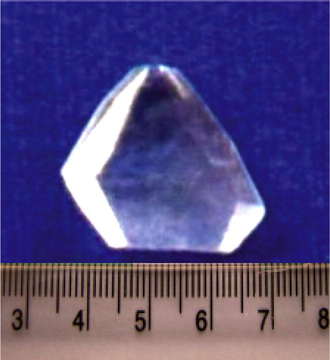
γ-Glycine crystal (1:0.8).
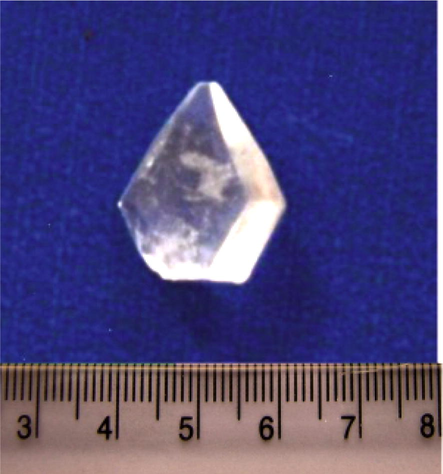
γ-Glycine crystal (1:0.9).
3 Results and discussion
3.1 Single crystal XRD and ICP-OES studies
Single crystal X-ray diffraction data were recorded using ENRAF NONIUS CAD4-MV31 X-ray diffractometer with MoKα radiation (λ = 0.71073 Ǻ) to reveal the crystal structure and unit cell dimensions of the grown crystal. The unit cell dimensions were obtained for the grown single crystals from single crystal XRD analysis and are presented in Table 2. This study confirms the α- and γ-polymorphs of glycine. The cell values closely agreed with the reported values (Sekar and Parimaladevi, 2009). To determine the concentration of zinc element present in the grown crystals, the inductively coupled plasma optical emission spectrometry (ICP-OES) analysis using Perkin Elmer Optima 5300 DV ICP-OES spectrometry was carried out. The presence of zinc element in the grown crystals is listed in Table 3. Emission spectrometry is based on the principle that atoms or ions in an excited state tend, to revert back to the ground state and in doing so emit characteristic wavelength and the intensity of that light is proportional to the concentration of that particular element in the sample solution. This technique is used for qualitative and quantitative determination of zinc present in the γ-glycine. For this analysis, the grown crystals were crushed into pieces and finely grounded in an agate mortar. These powdered samples were transferred into a 25 ml volumetric flask with the help of a funnel and were diluted to volume with deionized water. This diluted sample was analysed by ICP-OES system. The amount of zinc element present in the γ-glycine sample prepared from 0.9 M concentration of zinc acetate was found to be 0.73 ppm and its characteristic wavelength is 213.89 nm. It is determined that the concentration of zinc is so low as to form a complex and hence it can be concluded that the zinc can be incorporated in the void space within the crystal lattice of γ-glycine (Dillip et al., 2012; Anbuchezhiyan et al., 2010).
Molar ratio of Glycine and zinc acetate
Lattice parameters
Crystal System
Polymorph
JCPDS CARD NO.
a [Å]
b [Å]
c [Å]
α (degree)
β (degree)
γ (degree)
Cell volume [Ǻ3]
1:0.2
5.10
11.93
5.45
90
111.90
90
308
Monoclinic
Alpha
32-1702
1:0.4
5.11
11.97
5.48
90
111.97
90
310
Monoclinic
Alpha
32-1702
1:0.6
7.02
7.02
5.41
90
90
120
233
Hexagonal
Gamma
06-230
1:0.7
7.05
7.05
5.44
90
90
120
235
Hexagonal
Gamma
06-230
1:0.8
7.08
7.08
5.46
90
90
120
237
Hexagonal
Gamma
06-230
1:0.9
7.09
7.09
5.48
90
90
120
238
Hexagonal
Gamma
06-230
Molar ratio of Glycine and zinc acetate
Crystal System confirmed from SXRD cell values
Polymorph
Presence of Zinc element in ppm or milligram per litre
Characteristic wavelength of Zinc element (nm)
1:0.2
Monoclinic
Alpha
0.25
213.81
1:0.4
Monoclinic
Alpha
0.36
213.81
1:0.6
Hexagonal
Gamma
0.45
213.82
1:0.7
Hexagonal
Gamma
0.54
213.84
1:0.8
Hexagonal
Gamma
0.63
213.86
1:0.9
Hexagonal
Gamma
0.73
213.89
3.2 Powder X-ray diffraction analysis
Powder X-ray diffraction studies were carried out using a Bruker D8 advance diffractometer with CuKα (λ = 1.5406 Ǻ) radiation. The powdered α- and γ-glycine sample from 0.4 to 0.9 M concentration of zinc acetate respectively was scanned over a range 5–70° at the scan rate of 1° min. The reflection peaks corresponding to different crystal h k l planes in the recorded XRD profile were indexed. The indexed powder X-ray diffraction pattern for α- and γ-glycine crystal is shown in Figs. 9 and 10 for comparison. The observed powder X-ray diffraction pattern and position of the peaks of α- and γ-glycine crystal were found to be in good agreement with the reported pattern (Index to the Powder Diffraction File, 2002). The data obtained from the XRD spectrum such as Angle 2θ, d-value, h k l, peak intensity, intensity (%) and full width half maximum value (FWHM) of every prominent peak in the spectrum of α- and γ-glycine are tabulated in Tables 4 and 5. The sharp and strong peaks in the XRD pattern confirm good crystallinity of the grown crystal. From the XRD data, the lattice parameters of the grown α- and γ-glycine crystal were calculated using UNIT CELL software and are tabulated in Table 6.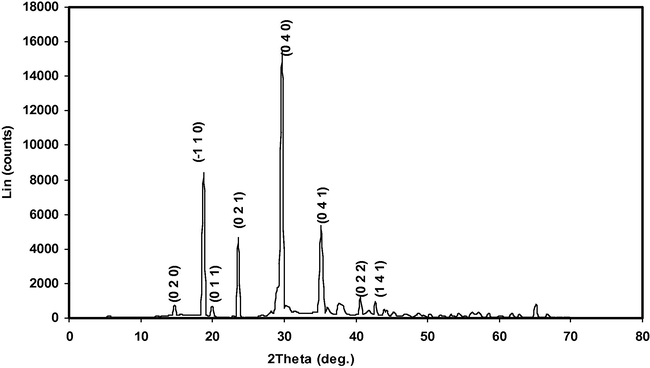
Indexed powder XRD profile of α-Glycine.
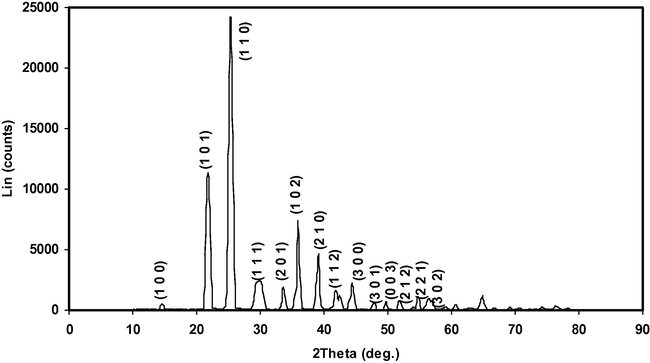
Indexed powder XRD profile of γ-Glycine.
h
k
l
Angle 2-theta (°)
d value (Ǻ)
FWHM (degree)
Peak intensity (Counts)
Intensity (%)
0
2
0
14.654
6.040
0.139
80.319
8.032
−1
1
0
18.726
4.735
0.139
742.529
74.253
0
1
1
19.918
4.454
0.139
81.682
8.168
0
2
1
23.633
3.762
0.238
286.201
28.62
0
4
0
29.671
3.008
0.199
1000
100
0
4
4
35.174
2.549
0.159
315.246
31.525
0
4
4
40.597
2.220
0.139
116.389
11.639
1
4
4
42.762
2.113
∗∗∗∗∗∗∗
70.462
7.046
h
k
l
Angle 2-theta (°)
d value (Ǻ)
FWHM (degree)
Peak intensity (Counts)
Intensity (%)
1
0
0
14.581
6.0800
1.660
21.28
2.128
1
0
1
21.827
4.0700
2.233
483.141
48.314
1
1
0
25.301
3.5100
2.046
1000
100
1
1
1
30.192
2.9500
2.617
97.263
9.726
2
0
1
33.644
2.6600
1.692
79.409
7.941
1
0
2
35.956
2.5000
1.574
314.084
31.408
2
1
0
39.084
2.3000
2.048
194.06
19.406
1
1
2
41.866
2.1600
1.666
68.706
6.871
3
0
0
44.471
2.0300
1.649
96.586
9.659
3
0
1
47.812
1.9000
1.642
27.076
2.708
0
0
3
49.726
1.8200
1.307
29.868
2.987
2
1
2
51.870
1.7600
1.923
31.349
3.135
2
2
1
54.833
1.6900
1.681
46.495
4.649
3
0
2
56.388
1.6700
1.567
41.672
4.167
Polymorph
Lattice parameters
a [Å]
b [Å]
c [Å]
α (degree)
β (degree)
γ (degree)
Cell volume [Å3]
α-Glycine
5.62276
12.0726
5.22291
90
113.7109
90
324.6122
γ-Glycine
7.03507
7.03507
5.48962
90
90
120
235.2938
3.3 FTIR spectral analysis
The infrared spectroscopy is effectively used to identify the functional groups of the samples. FTIR spectra of α- and γ-glycine sample from 0.4 to 0.9 M concentration of zinc acetate respectively are shown in Figs. 11 and 12 for comparison. In the FTIR spectrum of α-glycine, the peaks observed at 502, 606 and 695 cm−1 are attributed to the carboxylic groups while the peak observed at 1513 cm−1 corresponds to the
group. The peaks at 1030 and 898 cm−1 are attributed to C–C–N asymmetric and C–C–N symmetric stretching modes of vibration. The absorption peak observed at 1328 cm−1 is attributed to CH2 twisting mode. The peak observed at 1109 cm−1 corresponds to
rocking. The strong asymmetric CO2 stretching vibration occurs at 1609 cm−1. The combination bond occurs at 2121 cm−1. The peaks at 2614 and 3169 cm−1 are due to
stretching vibration.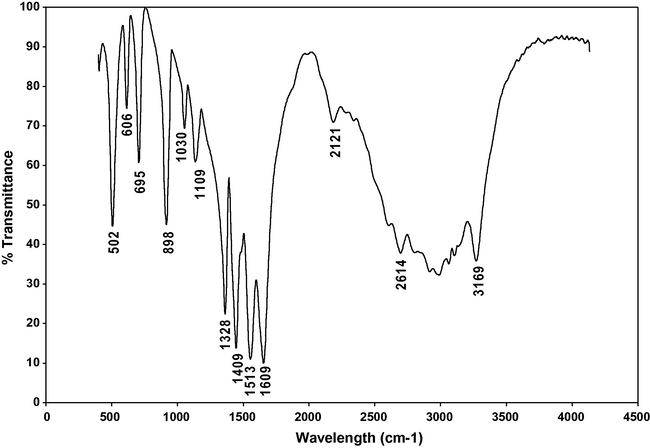
FTIR spectrum of α-Glycine.
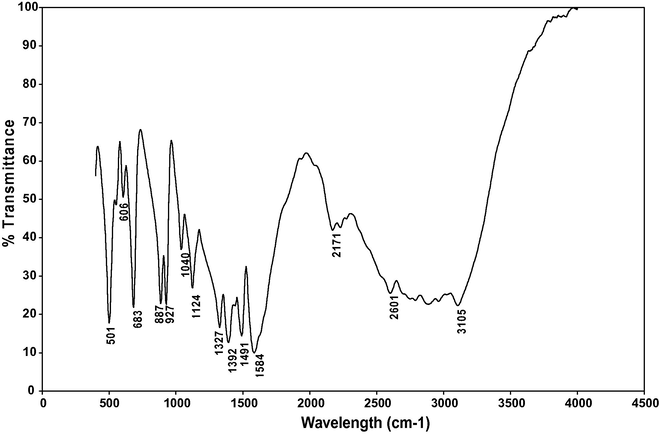
FTIR spectrum of γ-Glycine.
The spectrum of γ-glycine displays the peaks at 501, 606 and 683 cm−1 that are attributed to the carboxylic groups while the peak observed at 1491 cm−1 corresponds to the
group. Frequencies observed at 1040 and 887 cm−1 are attributed to C–C–N asymmetric and C–C–N symmetric stretching vibration. The absorption peaks observed at 927 and 1327 cm−1 are attributed to CH2 rocking and CH2 twisting mode. The peak observed at 1124 cm−1 corresponds to
rocking. The prominent band near 2171 cm−1 may be assigned to combination bond. The other peaks around 2601 and 3105 cm−1 have been attributed to the
stretching group. The FTIR data comparisons of α- and γ-glycine single crystals are presented in Table 7. The observed functional groups of the grown α- and γ-glycine single crystals are in good agreement with the literature values (Sekar and Parimaladevi, 2009; Dhanraj and Rajesh, 2009; Dillip et al., 2012).
α-Glycine
γ-Glycine
Tentative assignments
502
501
COO− rocking
606
606
COO− wagging
695
683
COO− bending
898
887
CCN Symmetric stretching vibration
–
927
CH2 rocking
1030
1040
CCN Asymmetric stretching vibration
1109
1124
rocking
1328
1327
CH2 twisting
1409
1392
COO− symmetric stretching
1513
1491
1609
1584
Strong asymmetric CO2 stretching
2121
2171
Combinational bond
2614
2601
stretching vibration
3169
3105
stretching vibration
3.4 Differential scanning calorimetry analysis
DSC studies of powdered sample of α- and γ-glycine sample from 0.4 to 0.9 M concentration of zinc acetate respectively were recorded by employing NETZSCH DSC 200F3 instrument between 30 and 500 °C. The recorded DSC thermograms of α- and γ-glycine sample are shown in Figs. 13 and 14. The α-glycine DSC thermogram shows a peak at 253.9 °C which corresponds to the decomposition of glycine. Whereas in γ-glycine DSC thermogram a minor peak occurs at 187.3 °C, a phase transformation peak from γ to α-polymorph. The sharpness of the exothermic peak shows a good degree of crystallinity. From the DSC curve of γ-glycine, it is observed that an exothermic event begins at 243.5 °C and then a sharp peak appears at 256.9 °C which corresponds to decomposition point of the sample. The phase transition temperatures are reported by several researchers such as 172, 189, and 182 °C (Narayan Bhat and Dharmaprakash, 2002; Balakrishnan et al., 2008; Dhanraj and Rajesh, 2009). It is concluded from their studies that the transition temperature between α and γ-polymorphs can range between 165 and 201 °C (Perlovich et al., 2001). Thus, in the present work, the phase transition temperature appears at 187.3 °C.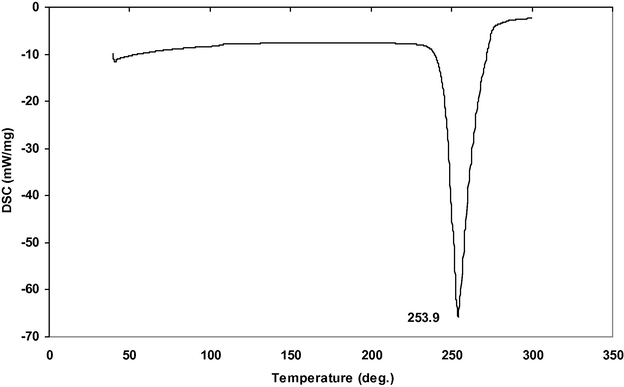
DSC thermogram of α-Glycine.
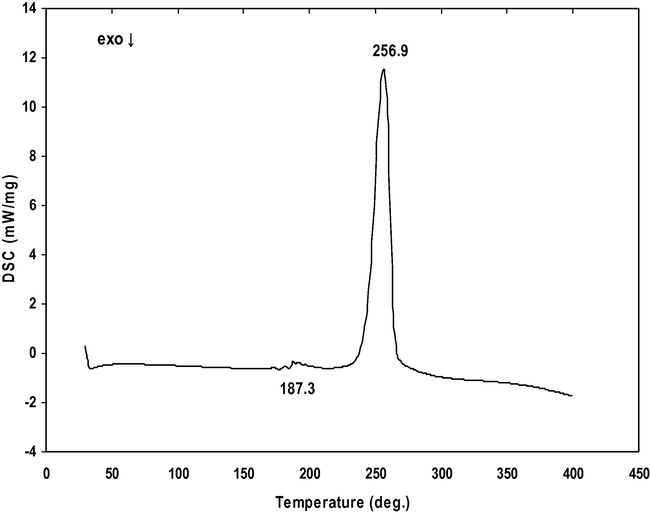
DSC thermogram of γ-Glycine.
3.5 Optical transmittance studies
Good optical transmittance and lower cut-off wavelength are essential properties for NLO crystals. The UV transmission spectra of α-glycine and γ-glycine grown in the presence of 0.4 and 0.9 M concentrations of zinc acetate respectively are shown in Figs. 15 and 16 for comparison. The lower cut-off wavelength of γ-glycine was at 212 nm and it was determined by chromophores such as the aminoacid and carboxyl group, which show no absorption and are transparent in the UV region. The bandgap of γ-glycine is calculated using the formula Eg = 1240/λ (nm). It is found to be 5.84 eV. The percentage of transmittance of γ-glycine is 94%. The observed spectrum and band gap value are in good agreement with the literature values (Narayan Bhat and Dharmaprakash, 2002; Sekar and Parimaladevi, 2009; Dillip et al., 2011; Esthaku Peter and Ramasamy, 2010; Balakrishnan et al., 2008; Dhanraj and Rajesh, 2009).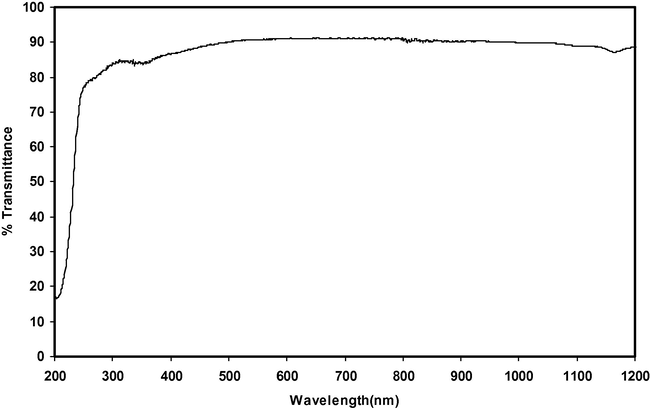
UV spectrum of α-Glycine.
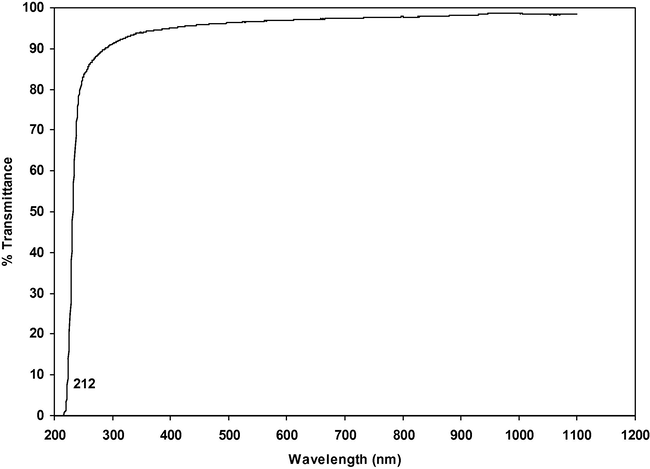
UV spectrum of γ-Glycine.
3.6 SHG efficiency measurement
The second harmonic generation efficiency of the grown γ-glycine crystal was checked using the technique developed by Kurtz and Perry technique (Kurtz and Perry, 1968). The crystal was ground into powder and densely packed in a micro capillary tube. A Q-switched Nd: YAG laser beam of wavelength 1064 nm was made to fall normally on the sample cell. The emission of green light confirmed the SHG of γ-glycine crystal. Thus, the efficiency of γ-glycine crystal is 3.66 times higher than that of potassium dihydrogen phosphate (KDP). The SHG signal of γ-glycine crystal is 165 mV, while the standard inorganic material potassium dihydrogen phosphate (KDP) gave a signal of 45 mV for the same input energy.
4 Conclusion
Optically good quality transparent α- and γ-glycine single crystals have been grown by the slow evaporation method at ambient temperature. The cell parameters have been determined by Single crystal XRD and powder XRD analysis and they agree well with the reported values. From the ICP analysis, it is found that the amount of zinc element is 0.73 ppm in the trace level of γ-glycine crystals prepared from 0.9 M concentration of zinc acetate. The FTIR spectra reveal the various functional groups present in the grown crystals. The UV–Visible–NIR transmission spectrum of γ-glycine shows a wide transparency window between 358 and 1098 nm with an energy gap of 5.84 eV, making it a potential candidate for NLO applications. DSC thermogram of γ-glycine shows a phase transition from γ- to α-glycine at around 187.3 °C. The SHG efficiency of the grown γ-glycine crystals is 3.66 times that of potassium dihydrogen phosphate (KDP) sample, which indicates the suitability of γ-glycine crystals for applications in nonlinear optical devices and optoelectronic devices.
Acknowledgements
The supports extended in the research by the Sophisticated Analytical instrumental Facility (STIC), Cochin, St. Joseph’s College, Trichy and IISC, Bangalore for SHG studies are gratefully acknowledged.
References
- Effect of strontium chloride on the optical and mechanical properties of γ-glycine crystals. Crystal Research and Technology. 2010;45:497-502.
- [Google Scholar]
- Effect of ammonium acetate addition on crystal growth, spectral, thermal and optical properties of glycine single crystals. Optik. 2012;123:993-995.
- [Google Scholar]
- Structural, mechanical, optical and second harmonic generation (SHG) studies of gamma glycine single crystal. International Journal of Physical Sciences. 2013;8:6-11.
- [Google Scholar]
- Linear and nonlinear optical studies of γ-glycine single crystals from ammonium carbonate for optoelectronic applications. Optik. 2013;124:526-528.
- [Google Scholar]
- Growth, structural, optical and thermal properties of γ-glycine crystal. Spectrochimica Acta Part A. 2008;69:1114-1118.
- [Google Scholar]
- Growth and characterization of nonlinear optical γ-glycine single crystal from lithium acetate as solvent. Materials Chemistry and Physics. 2009;115:413-417.
- [Google Scholar]
- Crystal growth and characterization of γ-glycine grown from potassium fluoride for photonic applications. Spectrochimica Acta Part A. 2011;79:1123-1127.
- [Google Scholar]
- Effect of magnesium chloride on growth, crystalline perfection, structural, optical, thermal and NLO behavior of γ-glycine crystals. Materials Chemistry and Physics. 2012;134:371-376.
- [Google Scholar]
- Growth of gamma glycine crystal and its characterization. Spectrochimica Acta Part A. 2010;75:1417-1421.
- [Google Scholar]
- Direct growth of γ-glycine from neutral aqueous solutions by slow evaporation-driven crystallization. Crystal Growth & Design. 2006;6:1746-1749.
- [Google Scholar]
- A powder technique for the evaluation of nonlinear optical materials. Journal of Applied Physics. 1968;39:3798-3813.
- [Google Scholar]
- Effect of solvents on the growth morphology and physical characteristics of nonlinear optical γ-glycine crystals. Journal of Crystal Growth. 2002;242:245-252.
- [Google Scholar]
- Hydrogen bonded nonlinear optical γ-glycine crystal growth and characterization. Journal of Crystal Growth. 2005;280:581-586.
- [Google Scholar]
- Organic Index to the Powder Diffraction File, 2002. Joint Committee of Powder Diffraction Standards.
- Crystal growth and spectral studies of nonlinear optical γ-glycine single crystal grown from phosphoric acid. Spectrochimica Acta Part A. 2010;76:490-495.
- [Google Scholar]
- The polymorphism of Glycine. Thermochemical and structural aspects. Journal of Thermal Analysis and Calorimetry. 2001;66:699-715.
- [Google Scholar]
- Effect of KCl addition on crystal growth and spectral properties of glycine single crystals. Spectrochimica Acta Part A. 2009;74:1160-1164.
- [Google Scholar]
- Synthesis, growth and structural perfection of nonlinear optical material of glycine hydrofluoride. Journal of Materials Science. 2009;44:3457-3461.
- [Google Scholar]
- Spectroscopic and thermal studies of γ-glycine crystal grown from potassium bromide for optoelectronic applications. Arabian Journal of Chemistry. 2013;6(4):429-433.
- [Google Scholar]


