

Translate this page into:
Effective quantification of ravidasvir (an NS5A inhibitor) and sofosbuvir in rat plasma by validated LC-MS/MS method and its application to pharmacokinetic study
⁎Corresponding author at: Department of Pharmaceutical Chemistry, College of Pharmacy, King Saud University, P.O. Box 2457, Riyadh 11451, Saudi Arabia. mhefnawy@ksu.edu.sa (Mohamed Hefnawy)
-
Received: ,
Accepted: ,
This article was originally published by Elsevier and was migrated to Scientific Scholar after the change of Publisher.
Peer review under responsibility of King Saud University.
Abstract
HCV-genotype-4 (HCV-GT4) is the cause of approximately 20% of the 170 million cases of chronic hepatitis C virus (HCV) in the world. Around 95% of patients with chronic HCV infection can be cure by utilizing direct-acting antiviral treatment. Two anti-HCV genotype 4 co-administered ravidasvir (RAV) and sofosbuvir (SOF) were simultaneously quantified in rat plasma by a validated and sensitive LC-MS/MS method using aciclovir as an internal standard. Chromatographic resolution for all analytes was performed with an Eclipse plus C18 column (50 mm × 2.1 mm, 1.8 µm) with isocratic mobile phase consisted of 10 mM ammonium formate: acetonitrile (61:39, v/v, pH 4.0) at a flow rate of 0.25 mL/min. Sample pre-treatment involved protein precipitation in plasma and stable internal standard resulted in a sensitive and robust method. Positive multiple reaction monitoring (MRM) mode was chosen to identify RAV, SOF, and IS. The developed assay was validated for accuracy, precision, linearity, selectivity, extraction recovery, matrix effect, carry-over, dilution integrity, and stability in accordance with US-FDA bioanalytical method validation guidelines. The method was linear over the ranges of 0.5–600 and 1–3000 ng/mL of RAV and SOF, respectively (r2 ≥ 0.997). After injection of the HLOQ sample, carry-over in the blank sample was less than 20% of the LLOQ of RAV, SOF and less than 5% of the IS. The mean relative standard deviation (RSD) of the results of accuracy and precision were ≤9.74%, and the overall recoveries of RAV and SOF from rat plasma were in the range 92.53–107.25%. The current methodology is the first LC-MS/MS for the quantification of RAV and SOF in rat plasma and to applied the pharmacokinetics of these agents in rats.
Keywords
LC-MS/MS
Ravidasvir
Sofosbuvir
Rat plasma
Pharmacokinetics

1 Introduction
Hepatitis C virus (HCV) is a worldwide medical issue influencing 170 million individuals around the world (WHO prevalence HCV, 2019). HCV-genotype-4 (HCV-GT4) is the most widely recognized variation of HCV in Southern Europe, North Africa and the Middle East and represents over 80% of these viral cases (Treatment of HCV Genotype 4, 2020). In Egypt, around 15% of the population have HCV disease and HCV-GT4 contamination represents over 90% of the HCV infections. HCV-GT4 is considered as a significant reason of hepatocellular carcinoma, liver cirrhosis, and liver transplantation (Asselah et al., 2016; Ferreira et al., 2020). The new combination of the antiviral agents, methyl N-[1-[2-[5-[6-[2-[1-[2-(methoxycarbonylamino)-3-methylbutanoyl]pyrrolidin-2-yl]-3H-benzimidazol-5-yl]naphthalen-2-yl]-1H-imidazol-2-yl]pyrrolidin-1-yl]-3-methyl-1-oxobutan-2-yl]carbamate dihydrochloride (ravidasvir, [RAV]) and 1,1,1,3,3,3-hexadeuteriopropan-2-yl (2S)-2-[[[(2R,3R,4R,5R)-5-(2,4-dioxopyrimidin-1-yl)-4-fluoro-3-hydroxy-4-methyloxolan-2-yl]methoxy-phenoxyphosphoryl]amino]propanoate (sofosbuvir [SOF]) is one of the safest and effective treatments used to manage and completely cure patients with chronic HCV-GT4 (Esmat et al., 2018).
RAV (Mwt 762, Fig. 1) is a new NS5A inhibitor that is currently undergoing clinical trials for chronic HCV-GT4. NS5A inhibition has been associated with significant reduction in HCV RNA levels in cell culture-based models, placing this therapy among the most potent antiviral molecules developed to date (Esmat et al., 2018). The WHO has added RAV as a future pan-genotypic direct-acting antiviral agent to the list of suggested treatments in their guidelines for the care and treatment of persons diagnosed with chronic HCV (WHO guidelines for HCV infection, 2020). SOF (Mwt 529, Fig. 1) is a potent uridine monophosphate analog inhibitor of HCV polymerase NS5B used as an antiviral agent to treat chronic hepatitis (Stedman, 2014). SOF is a prodrug nucleotide analog; experiences intracellular activation by discharging its pharmacologically active metabolite GS-461203 (Kirby et al., 2015). SOF should be utilized with other medicinal products when monotherapy is not recommended (Rose et al., 2014).
The chemical structures for (A) Ravidasvir (B) Sofosbuvir (C) Aciclovir.
Treatment with RAV plus SOF, was well accepted and was accomplished very high sustained virologic response (SVR) rate in patients infected with HCV-GT4. Treatment of HCV and HCV-GT4 with this combination has therefore become very effective, as it has cured 95 to 100% of patients with HCV-GT4 (Esmat et al., 2018).
The concomitant administration of RAV and SOF has been shown to have a pronounced pan-genotypic anti-HCV NS5A/NS5B (RNA-polymerases and co-polymerases) inhibitory activities. This combination possesses a desirable pharmacokinetic profile, rapid plasma concentrations, and high 24-h trough concentrations, allowing for continuous HCV inhibitory drug concentrations with once daily oral dosing. RAV achieves steady-state with the first dose, and from the second day of administration and onward, peak and trough levels remain constant without evidence for either subsequent drug accumulation or drug induced clearance. There is no evidence for any drug-drug interaction between RAV and SOF but a synergistic pangenotypic combination with more than 95% cure rate (Esmat et al., 2018).
It is worthy to mention that RAV was tested as a monotherapy and has been proven to be well-tolerated, in combination with deleobuvir (non-nucleoside NS5B polymerase inhibitor) and faldaprevir (NS3-NS4 protease inhibitor) to treat HCV-GT1 patients with absence of any appreciable treatment-related adverse effects or drug-drug interactions. These latter combinations elicited 92% SVR (sustained virologic response) of patients, yet the best combination was that with SOF. In brief, RAV is mainly eliminated unchanged through biliary excretion, and the renal excretion is negligible (Esmat et al., 2018).
SOF/RAV combo-therapy has been shown to have a notable efficacy and safety in genotype 4 HCV-infected adults in Egypt and in other tested genotypes. These studies have been conducted with and without Ribavirin in patients with and without liver cirrhosis (Esmat et al., 2018).
Several HPLC methods have been reported for the quantification of SOF in pure and dosage forms, either solely (Contreras et al., 2017; Rejendla et al., 2016; Abdel-Gawad, 2016; Vikas et al., 2016) or with direct-acting antiviral (DAA) agents (Mamatha and Devanna, 2018; Eldin et al., 2017; Wadie et al., 2017; Zaman et al., 2016). Up to now, as far as we know, there is only one HPLC-UV assay described for simultaneous determination of SOF with ribavirin and daclatasvir in human plasma at microgram level (Youssef et al., 2019). Furthermore, there are numbers of LC-MS/MS method has been described for quantification of SOF alone or with its metabolites or with other DAAs in biological fluids (Van Seyen et al., 2019; Ferrari et al., 2019; Notari et al., 2018; Elkady and Aboelwafa, 2018; Rezk et al., 2018; Abdallah et al., 2018; Abdallah et al., 2017; Pan et al., 2016; Ariaudo et al., 2016; Rezk et al., 2016; Shi et al., 2015; Rezk et al., 2015). Extensive literature review revealed that article describing an analytical method for detection and quantification of RAV plus SOF in rat plasma does not report. The aims of the present study were: (i) to develop a validate, sensitive and selective bioanalytical method by LC-MS/MS for the simultaneous quantification of this recent anti-HCV-GT4 combination of RAV and SOF in rat plasma; (ii) to evaluate the application of the developed assay to pharmacokinetics studies in rats.
2 Experimental
2.1 Chemicals and reagents
RAV (purity > 99%,) was obtained from Pharco Pharmaceuticals Co. (Amriya, Alexandria, Egypt). SOF was kindly purchased from Sigma Chemical Co. (St. Louis, MO, USA). Aciclovir (IS, purity > 99%), was obtained from Toronto Research Chemicals (Toronto, Canada). UPLC/MS quality acetonitrile, methanol LiChrosolv® and Dimethyl sulfoxide SeccoSolv® were obtained from Merck (Darmstadt, Germany). Ammonium formate (10 mM) was prepared by weighing 157.6 mg ammonium formate (Sigma-Aldrich. Zwijndrecht, The Netherlands) into a 250-mL volumetric flask, diluting it to the mark with ultrapure water (Millipore, Bedford, MA, USA), and then adjusting the solution to pH 4.0 with formic acid (Tedia, Fairfield, OH, USA). Ultrapure water was prepared using a Milli-Q plus purification system, Millipore, Waters (Millipore, Bedford, MA, USA). Drug-free rat plasma was obtained from the Animal Care Centre, (College of Pharmacy, King Saud University, Saudi Arabia). The use of rat plasma in this study instead of human plasma, due to there was a significant correlation between the lipoprotein lipid and protein profiles in human and rat plasmas (Ramaswamy et al., 1999).
2.2 Instrumentation and chromatographic conditions
The LC-MS/MS system was Agilent 6410 QqQ (Agilent Technologies, Germany) equipped with ESI ion source. The HPLC system was Agilent 1200 series equipped with a binary pump (G1311A), autosampler (G1367B), degasser (G1322A), thermostated column compartment (G1316). Data acquisition and instrument control were achieved by Mass Hunter Workstation software (version B.03.01, Build 3.1.346.0). A vortex mixer and ultrasonic processor were used throughout this process.
The chromatographies resolution of RAV, SOF, and IS was performed using an Eclipse plus C18 column (50 mm × 2.1 mm, 1.8 μm) (Agilent Technologies, Palo Alto, CA, USA) maintained at 35 ± 2 °C. An isocratic mobile phase consisted of acetonitrile and 10 mM ammonium formate aqueous solution containing 0.1% formic acid (39:61, v/v, pH 4.0), which run at a flow rate of 250 µL/min throughout the study. The solvents were filtered through membrane filters (0.22 μm) obtained from Chrom Tech (Kent, UK). The sample injection volume was 5.0 μL and total elution time was 4 min. The needle washing after each injection with a mixture of methanol and water (80:20).
2.3 Mass spectrometric conditions
Quantification of the samples was performed using the QqQ mass (MS/MS) detector, and operated in the ESI positive ionization mode using multiple-reaction monitoring (MRM). Fig. 2 shows multiple reaction monitoring (MRM) mass spectra of RAV, SOF, and IS and proposed m/z fragments. The following optimized settings of the mass spectrometer were used; source temperature and capillary voltage were set at 350 °C and 4000 V, respectively. Desolation gas flow, 11 L/min (nitrogen gas) at a pressure of 50 psi. Optimized the collision energy and cone voltage are presented in Table 1. SOF, sofosbuvir; RAV, ravidasvir; IS, internal standard; m/z, mass-to-charge ratio.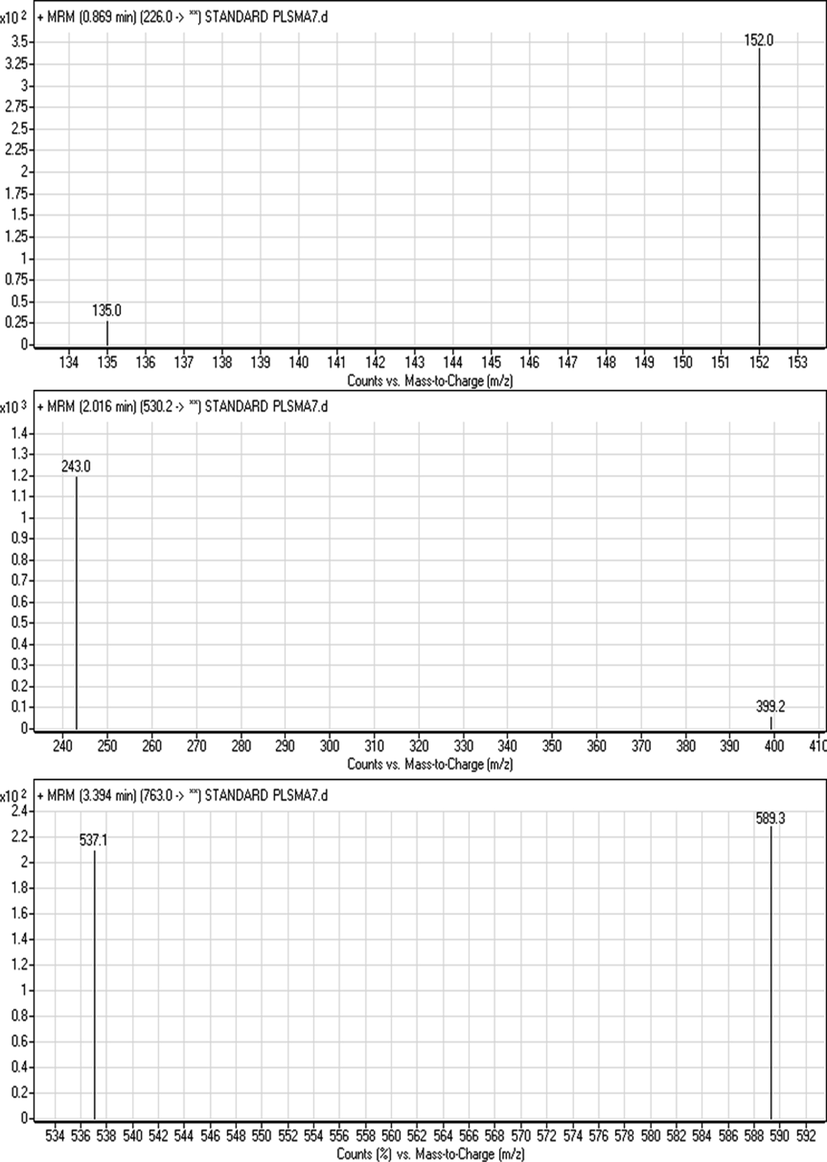
Multiple reaction monitoring (MRM) mass spectra of RAV, SOF and IS.
Molecules
Retention time (min)
Ion mode
Precursor (m/z)
Quantification trace (m/z)
Qualification trace (m/z)
Collision energy (CE, eV)
Cone Voltage (V)
SOF
2.03
+ve
530.0
243.0
399.2
12
145
RAV
3.32
+ve
763.0
589.3
537.1
35
145
IS
0.84
+ve
226.0
152.0
135.0
18
140
2.4 Standard solutions and calibration curves
Separate stock solutions of RAV and SOF and the IS were prepared in 1 mg/mL in dimethyl sulfoxide (DMSO) and stored at −20 °C. Working solutions of RAV and SOF were prepared from the stock solutions in concentrations of 0.1, 1, and 10 µg/mL in methanol (intermediate solutions). The aciclovir (IS) working solution was prepared in methanol at the concentration of 10.0 μg/mL. Calibrators at concentrations of 1,10, 50, 250, 500, 1500, 2000 and 3000 ng/mL for SOF and at 0.5, 5, 50, 100, 250, 400 and 600 ng/mL for RAV were prepared in methanol from the intermediate solutions. Three levels; low (QCL), medium (QCM) and high (QCH), for each analyte quality control sample with concentrations of 3, 500, and 2500 ng/mL for SOF and 1.5, 200, 550 ng/mL for RAV were prepared by spiking appropriate volume of the intermediate solutions with blank rat plasma.
2.5 Sample preparation
The plasma samples were thawed at room temperature before analysis. A volume of 20 µL of of working IS solution (10.0 μg/mL) was added to the 50 μL plasma in 2.0 mL disposable polypropylene microcentrifuge tubes. Each tube was diluted to 750 μL with deionized water and vortex for 30 s. A volume of 500 μL of acetonitrile was added to the spiked plasma samples and mixed for 60 s. The tubes were subsequently vortexes for 60 s and centrifuged at 10,000 rpm at 5 °C for 12 min. The supernatants were carefully transferred to clean Eppendorf tubes and evaporated to dryness (at 40 °C) under a gentle stream of nitrogen. The dry extracts were reconstructed in 100 µL of the mobile phase and stacked into the autosampler tray. A volume of 5.0 μL of the supernatant was injected into the LC-MS/MS system.
2.6 Validation procedures
2.6.1 Selectivity and carry-over
Blank rat plasma from six different batches were investigated to evaluate interference from endogenous components at the retention time of RAV, SOF and IS. The response less than 20% of the LLOQ for RAV, SOF and <5% of the IS were accepted. Carry-over was checked by injecting a blank sample without IS after injection of the HLOQ containing the two drugs and IS. This step was repeated six times. The detected response should be less than 20% of the LLOQ of each drug and less than 5% of the IS (US-FDA Guidelines, 2018).
2.6.2 Accuracy and precision
Intra-day and inter-day accuracy and precision were estimated by analyzing a calibration curve (in triplicate) and spiked plasma samples at the lower limit (LLOQ) in addition to three different QC levels (L-M-H) in sixfold on three different days. The tested levels were 0.5 ng/mL (LLOQ), 1.5 ng/mL (LQC), 200.0 ng/mL (MQC) and 550.0 ng/mL (HQC) for RAV and 1.0 ng/mL (LLOQ), 3.0 ng/mL (LQC), 1000.0 ng/mL (MQC) and 2500.0 ng/mL (HQC) for SOF. For the LLOQ, the criteria for acceptability of the relative standard deviation (RSD) should be less than 20%. For all other concentrations the RSD has to be less than 15% (US-FDA Guidelines, 2018).
2.6.3 Recovery
Recovery was determined for RAV and SOF by comparing responses of extracted plasma samples at three levels (QCL, QCM, QCH) with those attained by direct injection of the same amount of the two analytes in the mobile phase in triplicate. The recovery has to be reproducible and consistent over the concentration range.
2.6.4 Dilution integrity
Plasma samples spiked with the HLOQ for RAV (900 ng/mL) and SOF (4500 ng/mL) were diluted two and four times with blank plasma. The obtained concentrations were compared with the nominal concentration to check if the dilution affects accuracy and precision or not. Accuracy and precision and should be within 15%.
2.6.5 Matrix effect
The matrix effect was quantified for RAV and SOF and the IS in six different blank plasma batches. After precipitation with acetonitrile, samples were spiked with the IS and the two analytes at two concentrations; QCL and QCH. The matrix factor (MF) was intended by the ratio of the peak area in the presence (blank spiked with analytes after extraction) and absence of matrix (pure analytes solution). IS normalized MF is the ratio of the MF of the analytes to the MF of IS had to be within 15% of RSD.
2.6.6 Stability
The stability of SOF and RAV were assessed after exposing the QC samples at QCL, QCM, QCH to different storage conditions (temperature and time). The applied conditions include short term stability at room temperature for 24 h, in an autosampler for 24 h at 10 °C. Long-term stability was assessed after storing QCs for 30 days at −80 °C. Freeze and thaw stability were evaluated after three freezing and thawing cycles, by comparison with freshly prepared QCs.
2.7 Pharmacokinetic study
Four Wistar healthy male rats (180–220 g) were purchased from the Animal Care Center of King Saud University (Saudia Arabia). All experimental procedures were reviewed in accordance with the guidelines of King Saud University Institutional Research Ethics Committee (REC) with ethical approval numbers (KSU-SE-18–19). Rats were acclimatized for 7 days to laboratory environments before the experiment was directed. Diet was prohibited for 12 h before the experiment, but the water was freely available. Blood samples (300 μL) were collected into heparinized 1.5 mL polythene tubes before drug administration, and at 0.15, 0.5, 1, 1.5, 2, 3, 4, 6, 8, 12, 18, and 24 h after oral administration of RAV (35 mg/kg) and SOF (70 mg/kg). The concentrations and ratio were comparable to those used in the clinical trial of these drug combinations (Esmat et al., 2018). In the current study, both analytes were dissolved in 1% DMSO/saline. The samples were directly centrifuged at 3500 rpm for 10 min at 4 °C. The plasma obtained (100 μL) was stored at −80 °C until analysis. Pharmacokinetic parameters were assessed using PKSolver 2.0 An Add-In and Excel 2010 software (Zhang et al., 2010).
3 Results and discussion
3.1 Method development and optimization
The strategy for drug analysis at a very low concentration is reflected a chief challenge in bio-analytical studies as mandatory by new WHO guidelines (WHO Prequalification Team-Medicines, 2020). The method chromatographies parameters were adjusted to confirm the resolution of symmetric peaks for RAV, SOF, and IS with high sensitivity and within reasonable run time. Several mobile phase compositions of 0.1% formic acid in water, ammonium acetate buffer, ammonium formate buffer with either acetonitrile or methanol were tested in an isocratic mode. Different ratios of aqueous and organic phases were tried. Asymmetric RAV and SOF peaks were attained upon using methanol as an organic modifier. The aqueous mobile phase containing only 0.1% formic acid increased RAV and SOF peak tailing factor >2. Using ammonium formate with formic acid (pH = 4.0) resulted in good symmetrical peak with tailing factor >1.2. Based on these investigations, 10 mM ammonium formate aqueous solution containing 0.1% formic acid and acetonitrile (61:39, v/v, pH 4.0) was the most effective mobile phase. Also, several trials were tested using a reversed phase an Eclipse XDB C8 column (3.9 × 50 mm, 5 μm) and an Eclipse plus C18 column (50 mm × 2.1 mm, 1.8 µm) (Agilent Technologies, USA) as a stationary phase. The first column, eluted RAV after more than 6 min with tailing factor >2. The Second column was the most appropriate one where symmetrical peaks of RAV, SOF, and IS were resolved within 4 min. Adequate chromatographies resolution with well-defined peaks for RAV, SOF, and IS was achieved with retention times 3.32, 2.03, and 0.84 min for RAV, SOF, and IS; respectively, as shown in Fig. 3.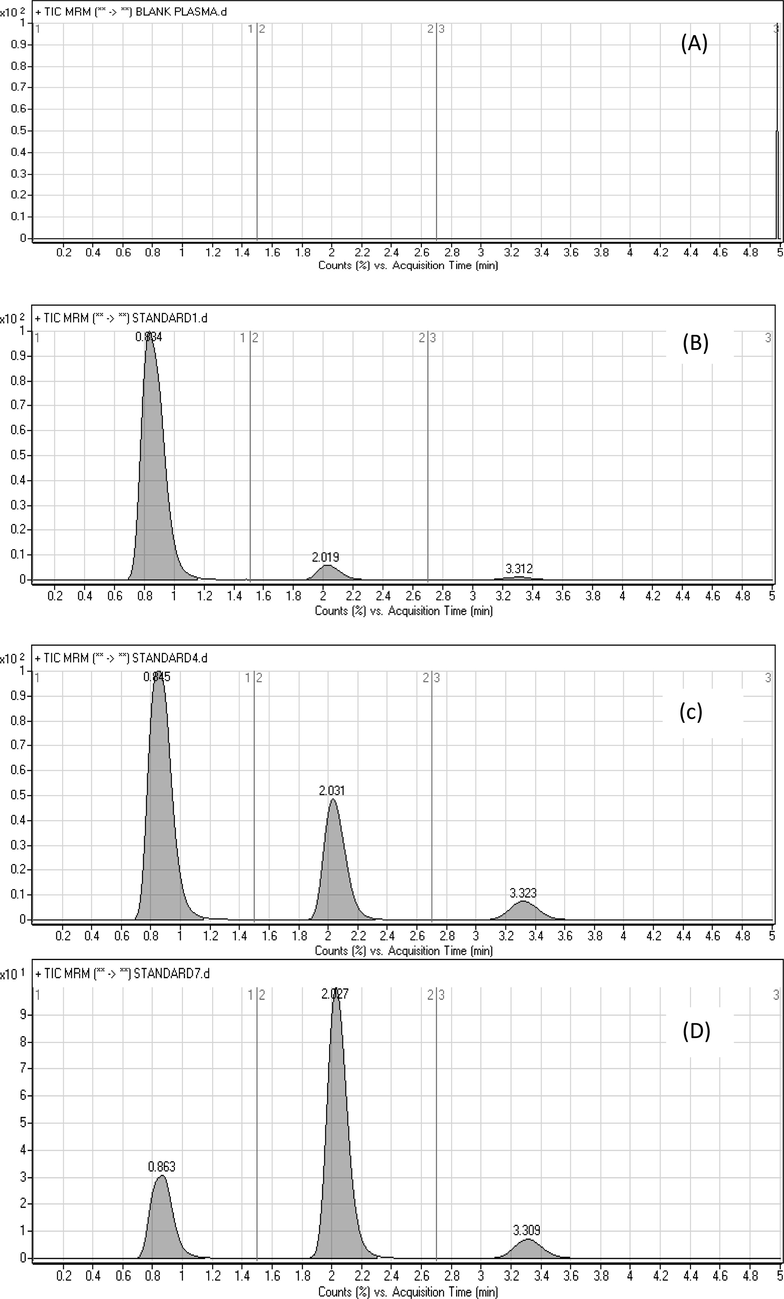
Representative total ion chromatograms for the LC-MS/MS analysis of blank plasma (A) and plasma spiked with LLOQ (B), QCM (C), and QCH (D); IS (0.86 min), SOF (2.03 min) and RAV (3.31 min).
For samples’ extraction, different extraction techniques including liquid–liquid, solid phase extraction and direct precipitation using organic solvents were investigated. Protein precipitation technique yielded better sensitivity, high extraction recovery, minimum matrix effects and optimum peaks’ shapes than the other two techniques. Therefore, we selected protein precipitation as it was the method with more reproducible results, the simplest and fastest. Protein precipitation using methanol, ethanol, acetonitrile, and trifluoroacetic acid was applied, acetonitrile was found to be the most reproducible solvent with the minimal matrix effect and high recovery. Phospholipids are least extracted from biological fluids by acetonitrile, therefore, acetonitrile is better than other organic solvents for protein precipitation (Ghosh et al., 2011). In this study, aciclovir has been utilized as internal standard where it was given high recovery and good separate peak from the studied drugs.
3.1.1 MS parameters
The development of the MS/MS parameters was conducted to improve the method sensitivity and reliability. Collision energy and other parameters were investigated and adjusted to achieve the highest possible MS response as shown in Table 1. The product ion m/z values were estimated using product ion scans in the expected m/z ranges, and MRM mode used to quantify the analyte with the following transitions (precursor ion m/z → product ion m/z): 763 → 589.30, 537.1 m/z for RAV; 530.2 → 399.2, 243 m/z for SOF and 226 → 152.0, 135.0 m/z for the IS as shown in scheme 1 and Table 1. Representative ESI mass spectra for the precursor and product ions of ravidasvir, sofosbuvir and IS are shown in Fig. 2.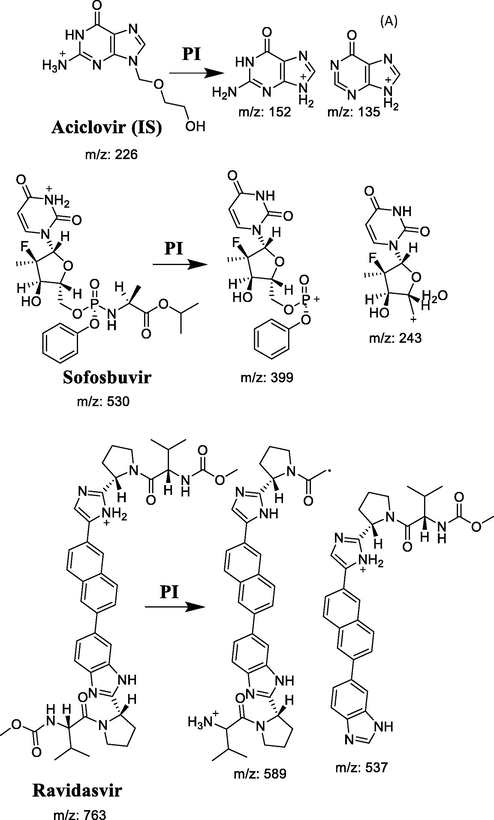
The fragmentation pattern of RAV, SOF and IS.
3.2 Method validation
3.2.1 Selectivity and carry over
Representative total ion chromatograms are illustrated in Fig. 3 indicated that, analysis of blank plasma samples and plasma spiked with LLOQ, QCM, and QCH showed that there were no interferences at the retention times of RAV, SOF and IS, confirming the selectivity of the method. The carry-over in the blank sample was less than 20% of LLOQ for RAV, SOF and less than 5% of response for IS after injection of the HLOQ sample.
3.2.2 Calibration curve and sensitivity
The calibration curves were linear over a wide concentration range of 0.5–600 and 1.0–3000 ng/mL for RAV and SOF, respectively. The statistical parameters of calibration curves for RAV and SOF attained during the method validation are listed in Table 2. The regression equations obtained by least squared regression for RAV and SOF were; y = 0.0006x + 0.0082, r2 = 0.998; and y = 0.0021x + 0.0109, r2 = 0.997, for RAv and SOF, respectively, where y is the peak area ratio of D/IS and x is the concentration (ng/mL). The sensitivity of the method was assessed by estimating the LLOD and LLOQ. The LLOD and LLOQ were 0.2 and 0.5 ng/mL; 0.3 and 1.0 ng/mL for RAv and SOF, respectively. The low value of LLOQ attained for both analytes confirms the applicability of the developed assay for the quantification of trace concentrations of RAv and SOF in rat plasma.
Parameters
SOF
RAV
Concentration range (ng/mL)
1–3000
0.5–600
Intercept (a)
1.09 × 10⁻²
8.23 × 10⁻³
Slope (b)
2.18 × 10⁻³
6.54 × 10⁻⁴
Coefficient of determination (R2)
1
1
SY/Na
1.01 × 10⁻³
2.38 × 10⁻³
Sab
5.63 × 10⁻³
3.43 × 10⁻⁴
Sbc
3.12 × 10⁻³
1.43 × 10⁻³
LLOQ (ng/mL)
1
0.5
LLOD (ng/mL)
0.3
0.2
3.2.3 Accuracy and precision
The accuracy and precision results of RAV and SOF determination are presented in Table 3. The within- and between-day precision over the calibration range (LLOQ, QCL, QCM, QCH) met the acceptance criteria of the guidelines (LLOQ within 20% and the other QCs within 15%). At LLOQ the RSD for both within- and between-run precision was not nore than 6.54% and 8.74% for RAV and SOF; respectively. The accuracy of the assay, which expressed as percentage recovery was 107.25%, 103.16% (within-day accuracy) and 103.45%, 99.26% (between-day accuracy) for RAV and SOF. *Accuracy was expressed as the Recovery % with an acceptance criteria ± 15% from the nominal values. Precision was expressed as a percentage of the relative standard deviation (%RSD) required to be not more than 15%.
Analyte
Concentration ng/mL
Within-run
Between-run
Recovery (%)
RSD (%)
Recovery (%)
RSD (%)
Ravidasvir
LLOQ
0.5
107.25
6.54
103.45
6.34
QCL
1.5
101,63
9.74
96.54
7.54
QCM
200
98.36
3.87
100.64
8.43
QCH
550
100.52
7.63
98.23
5.86
Sofosbuvir
LLOQ
1
94.73
5.71
93.73
8.74
QCL
3
98.50
2.67
99.26
4.70
QCM
1000
101.54
8.64
92.53
5.65
QCH
2500
103.16
4.63
99.23
4.12
n
6
18
3.2.4 Recovery
The mean percent recoveries of RAV and SOF were investigated at three QC levels (QCL, QCM, QCH) in six replicates. The percentage recovery ranged from 92.28 to 97.76% for RAV and 87.59 to 97.74% for SOF. Moreover, the percent recovery of IS was not less than 97.86 ± 1.92 for all tested samples
3.2.5 Matrix effect
For the RAV, SOF and IS, the matrix factor (MF) was calculated as low and high QC samples (QCL and QCH) by dividing the peak area in the presence of matrix components, to the peak area in the neat standard solution of the analyte. The IS normalized MF is calculated by dividing the MF of the analyte by the MF of the IS. The RSD of IS-normalized MF of the six batches of the matrix was less than 15%. For RAV, it was 10.27 and 1.75 for QCL and QCH, respectively. For SOF, it was 9.45 and 2.13 for QCL and QCH, respectively, indicating that ion suppression or any enrichment from the plasma was insignificant.
3.2.6 Dilution integrity
After two and four fold dilution of six samples containing 900 ng/mL for RAV and 4500 ng/mL for SOF, the accuracy was 97.55% for RAV, 98.21% for SOF and the RSD value was less than 4.35% (n = 6). Therefore, the developed method revealed good accuracy and precision for both dilution factors for the RAV and SOF.
3.2.7 Stability
An important process of bioanalytical method validation is stability assessment. Stability of RAV and SOFwas studied through analysis of QCL, QCM and QCH of each drug after the application of the different storage conditions. The different parameters investigated include short term stability at room temperature for 24 h, long term stability at −80 °C for 30 days, autosampler stability at 10 °C for 24 h and three freeze and thaw cycles after storing at −80 °C. As presented in Table 4, the calculated accuracies were within the range of 93.65–106.71% for RAV and the range of 95.57–107.47% for SOF of the nominal concentrations which lies within the acceptable range. *Stability sample results should be within 15% of nominal concentrations.
Analyte
Concentration ng/mL
Short term stability at room temperature (24 h)
Freeze and thaw stability at −80 °C (3 cycles)
Long term stability at −80 °C (30 days)
Autosampler stability at 10 °C (24 h)
Recovery (%)
RSD (%)
Recovery (%)
RSD (%)
Recovery (%)
RSD (%)
Recovery (%)
RSD (%)
Ravidasvir
QCL
1.5
98.32
6.39
106.55
3.54
97.94
8.57
98.17
7.29
QCM
200
101.92
3.63
96.34
6.33
99.69
7.71
102.39
4.11
QCH
550
104.46
2.82
93.65
6.20
106.71
4.58
103.14
5.72
Sofosbuvir
QCL
3
97.86
4.78
95.57
3.35
96.11
3.96
98.15
3.65
QCM
1000
104.83
5.94
99.48
7.86
101.32
9.26
96.68
7.15
QCH
2500
107.47
3.86
105.19
4.82
104.94
5.86
103.48
4.58
n
3
3
3
3
3.3 Application to pharmacokinetic study
The validated assay was effectively applied to evaluate RAv and SOF in rat plasma for pharmacokinetic study after oral administration of 35 mg/kg RAV and 70 mg/kg SOF in a fasting condition. As far as we could possibly know, this investigation is the first time to utilize LC-MS/MS technique to quantify the concentrations of RAV and SOF in rat plasma and its application to a pharmacokinetic study. The typical MRM chromatograms of rat plasma at 1.5 h after oral administration are shown in Fig. 4, it has been indicated that the developed assay was found sufficient for a good resolution for RAV, SOF and IS. The mean plasma concentration–time profiles of RAV and SOF were presented in Fig. 5 and the pharmacokinetic parameters from non-compartment model analysis were summarized in Table 5. The maximum plasma concentration (Cmax) for RAV and SOF was 132.35 ± 26.41 and 1100.00 ± 220.31 ng/mL achieved at 1.50 ± 0.15 and 4.00 ± 0.80 h; respectively. The AUC0-∞ for RAV and SOF was found to be 525.90 ± 105.18 and 2296.88 ± 455.42 ng/mL.h; respectively. These values obtained in the current assay for SOF are in close concurrence with the outcomes from different articles (Shi et al., 2015; Pan et al., 2016). For the AUC0-t parameter, data from recently cited papers demonstrated that values ranging from 1746 to 2174 ng/mL.h for SOF, are near to that represented in this assay (Shi et al., 2015; Pan et al., 2016). For T1/2 parameter, it has been seen that the values acquired in the current investigation for SOF were not a long way from different articles (Shi et al., 2015; Pan et al., 2016). These variances in pharmacokinetics results might be ascribed to the distinction in sampling schedule and study conditions (fasting rats).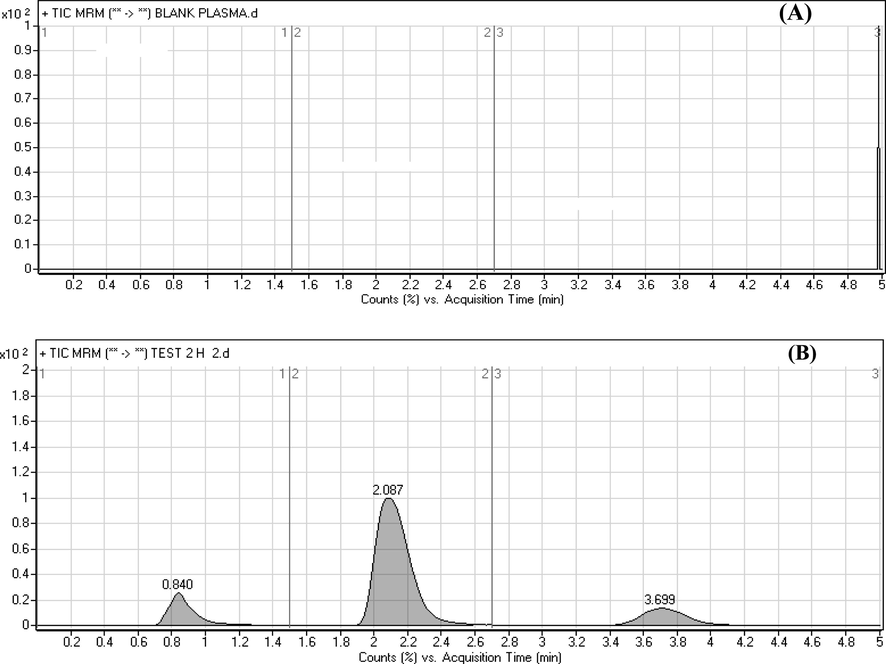
Typical multiple reaction monitoring (MRM) chromatograms for (A) blank rat plasma and (B) in vivo rat plasma sample 1.5 h after after oral administration of 70 mg/kg sofosbuvir (2.08 min) and 35 mg/kg ravidasvir (3.69 min) with the internal standard (0.84).
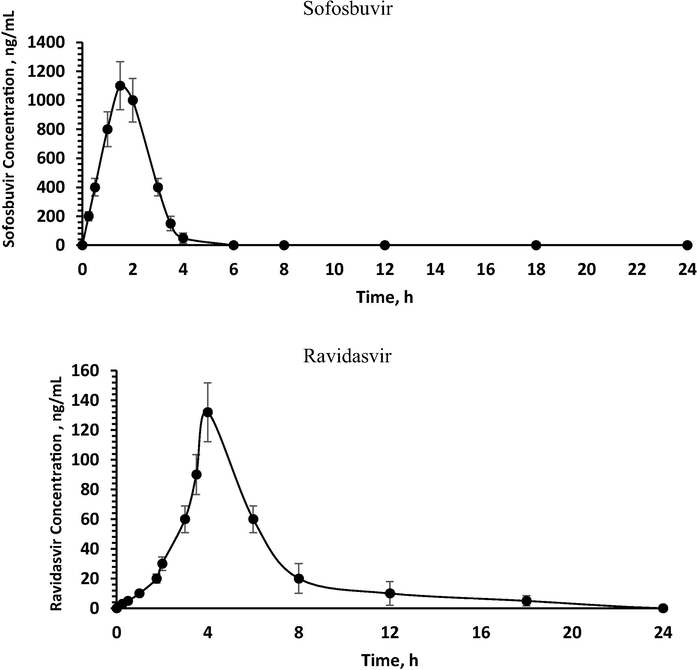
Mean plasma concentration–time profile of sofosbuvir and ravidasvir in rats after a single oral dose of 70 mg/kg sofosbuvir and 35 mg/kg ravidasvir (n = 6, mean ± SD).
Parameter
Unit
Sofosbuvir*
Ravidasvir*
AUC0-t a
ng/mL·h
2277.00 ± 459.37
495.125 ± 99.02
AUC0-∞ b
ng/mL·h
2296.88 ± 455.42
525.90 ± 105.18
Cmax c
ng/mL
1100.00 ± 220.31
132.35 ± 26.41
Tmax d
h
1.50 ± 0.15
4.00 ± 0.80
Cl/Fe
ng/mL.h
0.0304
0.0665
t1/2 f
h
1.24 ± 0.42
2.13 ± 0.43
MRT0-∞ g
h
2.02 ± 0.40
5.56 ± 1.11
4 Conclusions
A validated and sensitive LC-MS/MS assay was developed for the simultaneous quantification of RAV and SOF in rat plasma. The present method had LLOQ of 0.5 and 1.0 ng/ml for RAV and SOF, respectively, it was found to be accurate and precise over a concentration range that covers the Cmax of the RAV and SOF. The two drugs were adequately stable under different storage conditions. The present approach is distinguished by competitive LLOQs, calibration range, its sensitivity, and no significant carry-over effect rendered the developed assay could be effectively applied for routine assays in pharmacokinetic studies that would be helpful in therapeutic drug monitoring.
Acknowledgments
The authors extend their appreciation to the Deputyship for Research & Innovation, “Ministry of Education” in Saudia Arabia for funding this research work through the project number IFKSURG-037.
Declaration of Competing Interest
The authors declare that they have no known competing financial interests or personal relationships that could have appeared to influence the work reported in this paper.
References
- Development a validated highly sensitive LC-MS/MS method for simultaneous quantification of ledipasvir, sofosbuvir and its major metabolite GS-331007 in human plasma: application to a human pharmacokinetic study. J. Pharm. Biomed. Anal. 2017;143:305-310.
- [Google Scholar]
- Development a validated highly sensitive LC-MS/MS method for simultaneous quantification of sofosbuvir and daclatasvir in human plasma: application to a human pharmacokinetic study. Biomed. Chromatogr.. 2018;32:e4186
- [Google Scholar]
- Simple chromatographic and spectrophotometric determination of sofosbuvir in pure and tablet forms. Eur. J. Chem.. 2016;7:375-379.
- [Google Scholar]
- A UHPLC-MS/MS method for the quantification of direct antiviral agents simeprevir, daclatasvir, ledipasvir, sofosbuvir/GS-331007, dasabuvir, ombitasvir and paritaprevir, together with ritonavir, in human plasma. J. Pharm. Biomed. Anal.. 2016;125:369-375.
- [Google Scholar]
- Simple, predictive model for identifying patients with chronic hepatitis C and hepatitis C virus genotype 4 infection with a high probability of sustained virologic response with peginterferon alfa-2a/ribavirin: pooled analysis of data from two large. Int. Cohort Stud. Adv. Ther.. 2016;33:1797-11713.
- [Google Scholar]
- Potential of RP-UHPLC-DAD for the qualitative and quantitative analysis of sofosbuvir in film coated tablets and profiling degradants. J. Pharm. Anal.. 2017;7:208-213.
- [Google Scholar]
- The development of a new validated HPLC and spectrophotometric methods for the simultaneous determination of daclatasvir and sofosbuvir: antiviral drugs. J. Pharm. Pharmacol. Res.. 2017;1:28-42.
- [Google Scholar]
- Rapid bioanalytical LC-MS/MS method for the simultaneous determination of sofosbuvir and velpatasvir in human plasma-application to a pharmacokinetic study in Egyptian volunteers. J. Chromatogr. B Analyt. Technol. Biomed. Life. Sci.. 2018;1102:116-124.
- [Google Scholar]
- Effectiveness of ravidasvir plus sofosbuvir in interferon-naïve and treated patients with chronic hepatitis C genotype-4. J. Hepatol.. 2018;68:53-62.
- [Google Scholar]
- A Liquid chromatography-tandem mass spectrometry method for simultaneous determination of simeprevir, daclatasvir, sofosbuvir, and GS-331007 applied to a retrospective clinical pharmacological study. J. Chromatogr. B Analyt. Technol. Biomed. Life. Sci.. 2019;1120:1-7.
- [Google Scholar]
- Hepatitis C virus: evading the intracellular innate immunity. J. Clin. Med.. 2020;9:790-794.
- [Google Scholar]
- A Systematic approach to overcome the matrix effect during LC-ESI-MS/ MS analysis by different sample extraction techniques. J. Bioequiv. Availab.. 2011;3:122-127.
- [Google Scholar]
- Pharmacokinetic, pharmacodynamic, and drug-interaction profile of the hepatitis C virus NS5B polymerase inhibitor sofosbuvir. Clin. Pharmacokinet.. 2015;54:677-690.
- [Google Scholar]
- Simultaneous RP-HPLC method development and its validation for estimation of sofosbuvir and velpatasvir in their combined dosage form. Rasayan J. Chem.. 2018;11:392-400.
- [Google Scholar]
- UPLC-MS/MS method for the simultaneous quantification of sofosbuvir, sofosbuvir metabolite (GS-331007) and daclatasvir in plasma of HIV/HCV co-infected patients. J. Chromatogr. B Analyt. Technol. Biomed. Life. Sci.. 2018;1073:183-190.
- [Google Scholar]
- Simultaneous determination of ledipasvir, sofosbuvir and its metabolite in rat plasma by UPLC- MS/MS and its application to a pharmacokinetic study. J. Chromatogr. B Analyt. Technol. Biomed. Life. Sci.. 2016;1008:255-259.
- [Google Scholar]
- Species differences in the proportion of plasma lipoprotein lipid carried by high-density lipoproteins influence the distribution of free and liposomal nystatin in human, dog, and rat plasma. Antimicrob. Agents. Chemother.. 1999;43:1424-1428.
- [Google Scholar]
- Estimation and validation of sofosbuvir in bulk and tablet dosage form by RP-HPLC. Int. J. Pharm.. 2016;6:121-127.
- [Google Scholar]
- Novel and sensitive UPLC–MS/MS method for quantification of sofosbuvir in human plasma: application to a bioequivalence study. Biomed. Chromatogr.. 2016;30:1354-1362.
- [Google Scholar]
- Novel determination of sofosbuvir and velpatasvir in human plasma by UPLC-MS/MS method: application to a bioequivalence study. Biomed. Chromatogr.. 2018;32:e4347
- [Google Scholar]
- Development of a sensitive UPLC-ESI-MS/MS method for quantification of sofosbuvir and its metabolite, GS-331007, in human plasma: application to a bioequivalence study. J. Pharm. Biomed. Anal.. 2015;114:97-104.
- [Google Scholar]
- Sofosbuvir: a nucleotide NS5B inhibitor for the treatment of chronic hepatitis C infection. Ann. Pharmacother.. 2014;48:1019-1029.
- [Google Scholar]
- Evaluation of a rapid method for the simultaneous quantification of ribavirin, sofosbuvir and its metabolite in rat plasma by UPLC-MS/MS. J. Chromatogr. B Analyt. Technol. Biomed. Life. Sci.. 2015;1002:353-357.
- [Google Scholar]
- Sofosbuvir, a NS5B polymerase inhibitor in the treatment of hepatitis C: a review of its clinical potential. Therap. Adv. Gastroenterol.. 2014;7:131-140.
- [Google Scholar]
- Treatment of HCV Genotype 4. https://www.hepatitisC.uw.edu/go/treatment-infection/treatment-genotype-4/core-concept/all. Retrieved March, 12, 2020.
- U. S. Food and Drug Administration Bioanalytical Method Validation, 2018. Guidance for industry.
- Quantification of second generation direct-acting antivirals daclatasvir, elbasvir, grazoprevir, ledipasvir, simeprevir, sofosbuvir and velpatasvir in human plasma by UPLC-MS/MS. J. Chromatogr. B Analyt. Technol. Biomed. Life. Sci.. 2019;1110–1111:15-24.
- [Google Scholar]
- Development and validation of new RP-HPLC method for the determination of sofosbuvir in pure form. World. J. Pharmacol. Pharm. Sci.. 2016;5:775-7781.
- [Google Scholar]
- Development and validation of a new, simple-HPLC method for simultaneous determination of sofosbuvir, daclatasvir and ribavirin in tablet dosage form. J. Pharm. Bio. Sci.. 2017;12:60-68.
- [Google Scholar]
- WHO guidelines for HCV infection. https://www.healio.com/news/hepatology/20180809/who-adds-ravidasvir-to-hcv-recommendation-guidelines. Retrieved July, 15, 2020.
- WHO Prequalification Team-Medicines. Guidance Document. Notes on the design of bioequivalence study: http://apps.who.int/prequal/info applicants/BE/2015/Sofosbuvir. Retrieved July, 15, 2020.
- WHO prevalence HCV. https://www.who.int/en/news-room/fact-sheets/detail/hepatitis-c. Retrieved July, 09, 2019.
- Validated RP-HPLC method for simultaneous determination of ribavirin, sofosbuvir and daclatasvir in human plasma: a treatment protocol administered to HCV patients in Egypt. J. Chromatogr. Sci.. 2019;57:636-643.
- [Google Scholar]
- RP-HPLC method for simultaneous determination of sofosbuvir and ledipasvir in tablet dosage form and its application to in vitro dissolution studies. Chromatographia. 2016;79:1605-1613.
- [Google Scholar]
- PKSolver: an add-in program for pharmacokinetic and pharmacodynamic data analysis in microsoft excel. Comput. Methods Programs. Biomed.. 2010;99:306-314.
- [Google Scholar]


