Translate this page into:
Effects of adding whole barley flour to bread and its impact on anti-obesity action of female rats fed a high-fat diet
⁎Corresponding author at: Home Economics Department, Faculty of Specific Education, Benha University, Egypt. ahmed.abdelfatah@fsed.bu.edu.eg (Ahmed A. Aly)
-
Received: ,
Accepted: ,
This article was originally published by Elsevier and was migrated to Scientific Scholar after the change of Publisher.
Peer review under responsibility of King Saud University.
Abstract
The present investigation was focused on the effect of whole barley on balady bread properties and its nutritional and biological evaluation through different sets of rats. Chemical, sensorial and microbial properties were determined. The anti- obesity action of high levels of whole barley 60, 80% supplemented bread through 30 female rats evaluated. The increasing level of whole barley flour (WBF) incorporated into bread significantly increased crude fiber and ash contents High levels from WBF led to decrease the microbial load in the bread. Concerning biological evaluation, body weight gain of groups treated with barley had a significant decrease. Nearly all fatty cells from group 5 treated with bread (80% WBF) are small like negative group as demonstrated by histopathology of fatty tissue. Barley bread stabilized blood glucose levels, ameliorated lipid profile, liver enzymes and urea level but creatinine level was in similar level and improved the histological structure of liver tissues. In conclusion, this study demonstrates that incorporating high levels of whole barley into balady bread not only enhances its nutritional and microbial properties but also exerts anti-obesity effects and promotes overall metabolic health in rats. These findings highlight the potential of barley-supplemented bread as a functional food product with various health benefits. These findings highlight the potential of barley-supplemented bread as a functional food product with various health benefits.
Keywords
Whole barley flour
Balady bread
Microbial
Obesity
Biological
Histopathological examination
1 Introduction
In recent years, obesity has become a common epidemic in developing countries and the most prevalent metabolic disease. It is correlated with several of chronic diseases, including diabetes, hyperlipidemia, certain cancers and hypertension coronary artery disease (Flegal et al., 2010). The problem of obesity has been close to an epidemic level in Egypt. About 48 % of men and 70 % of adult Egyptian women are obese or overweight according to 1998 statistics. Several studies in Egypt referred to the main reason of this problem may be attributed to economic prosperity, bad eating habits and absence of the health- conscious culture (Khan et al., 1996 & Galal et al., 2002). The over ingestion of fat is closely correlated with the development of obesity. The long-term feeding of rats on high fat diet can cause obesity with hyperglycemia, hyperphagia, insulin resistance and hyperlipidemia. Furthermore, it has been revealed that high –fat diet may cause a raise in brown and white adipocytes growth (Viuda et al., 2010). With the increasing of obesity prevalence, the need for therapeutic and preventive strategies became urgent (Mubarak et al., 2013).
Increasing research on barley in human diet is attributed to the several health benefits related with its dietary fiber, which lowers plasma cholesterol (Cavallero et al., 2002 & Hanhineva et al., 2010). Barley has not only a high content of dietary fiber, but also contains other beneficial compounds for instance, phenolic compounds which is mostly referred to as antioxidants (Holtekjølen et al., 2006).
There are many cultivars of hull-less barley contain low or high (beta-glucan), variation degree of extract viscosity, and normal or waxy starch are found. β-glucan is a main constituent of soluble fiber which can reduce the risk of hypoglycemia, hypercholesterolemia and lower of cancer colon in experimental animals (Bhatty, 1999). Barley and oats possessed the highest contents of β-glucan (2 %-16 %) relative to other grains (Wood et al., 1984). Through the fermentation of these soluble fiber in the large intestine, the short chain fatty acids is produced which play an important role in lowering low density lipoprotein (LDL) or bad cholesterol in the serum, control blood glucose levels and raise the production of immune cells ( Behall et al., 2004 & Keenan et al., 2007). FDA indicated that the regular consumption of three grams of barley beta-glucan per day can reduce serum cholesterol and low-density lipoprotein and thus decrease the risk of heart disease and atherosclerosis (FDA, 2005, 2006). Wholegrain barley foods are also related to weight loss and lowering the appetite (Baik et al., 2008). However, the clear correlation between weight loss and soluble fibers effects on subjective measures of satiation are not apparent. Pectin, β-glucan, guar gum and psyllium are more widely related to decrease appetite and satiation perceptions than no / low fiber food (Dikeman et al., 2006). Diets included fiber have many health benefits as slowing gastrointestinal transit time, adding bulk, prolonging nutrient absorption and promoting satiation as well (Delgado et al., 2004). Epidemiological studies reveal that consuming of foods contained whole grain are inversely associated with weight gain in adulthood (Koh-Banerjee et al., 2004& Bazzano et al., 2005) and body mass index (BMI) (Jacobs et al., 1998, McKeown et al., 2002, Newby et al., 2003). Kaul et al., (1993) performed experiments on obese patients (20 % or more high than the ideal body weight). These patients consumed a meal exchange for eight months. This meal exchange contained a high-fiber level (14.68 g) from whole grains, nonfat milk, lactase and nuts. The resultant data showed that the ingestion of fiber resulted in controlling blood cholesterol levels and weight loss. Many studies refer to the incorporation of barley flour or beta-glucan in wheat flour cause a reduction in the quality of breads, especially loaf volume. As a consequence of these quality deficits, it could be a stumbling block in the production of a viable white bread containing barley. However, if these quality parameters can be conquered, there would appear to be a good potentiality for production nutritious bread product containing barley (Sullivan et al., 2013). Balady bread represents the product as major edible ingredient for poor and rich Egyptian consumers. But, there is a substantial cavity between wheat grain consumption and its production, where the total production of wheat grains covers only approximately 55 % of the daily needs (Yaseen et al., 2010). Thereby, several studies investigated the potentiality of substituting wheat flour with other cheaper replacements (Khalil et al., 2000, McWatters et al., 2004, Edema et al., 2005, Olaoye et al., 2006).Consequently, this work was undertaken to incorporate whole barley flour into balady bread to add nutritional value. Also, through different sets of experimental rats, the effect of whole barley bread on serum parameters and the potentiality of using whole barley as anti-obesity agent were assessed.
2 Martials & methods
2.1 Materials
2.1.1 Hull-less barley grains
(Hordeum vulgare) were obtained from Crops research department, field research institute, A.R.C., Giza, Egypt. Wheat flour 72 % extraction rate was pursued from the local market in Cairo, Egypt.
2.1.2 Chemicals
Chemicals used in this study obtained from Elgomhoria Company, Cairo, Egypt.
2.1.3 Sheep fat
Sheep fat used was obtained from the local market in Cairo, Egypt.
2.1.4 Female albino rats
(30, weighed 180 ± 10 g) were about in the same age and provided from Experimental Animal House of Food Technology Institute, Agric. Research. Center, Giza, Egypt.
2.2 Methods
2.2.1 Technological methods
2.2.1.1 Milling process
Hull-less barley grains were moistened to14% moisture for 24 h. and then ground by hammer mill to whole meal barley flour as shown in Fig. 1.
Hull-less barley processing and milling.
2.2.1.2 Preparation of balady bread
Balady bread was prepared according to the method mentioned by Hussein et al., (2013) from wheat flour (72 %) after mixing with different levels of barley flour (60 and 80 %). Table 1 is indicating a different mixture blended as a formula. The dough was hand-kneaded approximately 6 min till homogeneity and it was fermented for about (1 h. /30 °C and then divided to pieces (125 g), a fine layer of bran was sprinkled on a wooden board and the pieces were arranged on it to ferment again up to 45 min in warm place. The fermented pieces were formed to produce a loaf approximately 20 cm in rounds. The formed loaves were left at 30–35 ͦ C for 15 min then the loaves were baked at 400–500 °C for about 1–2 min., they were left to cool for approximately1hour before different analysis as shown in Fig. 2.
Ingredients
Samples
Control
Barley bread 60 %
Barley bread 80 %
Refined Flour
100 g
40 g
20 g
Whole barley flour
Zero
60 g
80 g
Yeast
0.5 g
0.5 g
0.5 g
Salt
1.5 g
1.5 g
1.5 g
Water
75–80 mL tap water
75–80 mL tap water
75–80 mL tap water

Balady bread prepared by using Whole barley flour as a partial substitute of wheat flour.
2.2.2 Analytical method
Determination of Moisture, protein, crude lipids, crude fiber and ash as the method described by AOAC (2000) % Carbohydrates = 100 - (%Protein + %Moisture + %Ash + %Lipids + %Fiber).
2.2.3 Sensory evaluation of balady bread
Sensory properties of prepared bread were quantified by ten panelists from our laboratory and the scoring card of sensory attributes included the following parameters: appearance, odor, texture, color and taste on ten points for each parameter according to the method mentioned by Aly (2019) and Patel et al., (2019).
2.2.4 Microbiological methods
Total bacterial load & Mold and yeast were determined according to the method descried by Marshall (1992).
2.2.5 Biological evaluation
2.2.5.1 Experimental diet
Experimental diets (g/100gm) were blended and prepared as mentioned by AIN (1993) and indicated in Table 2.
Ingredients
g/100 diet
Corn starch
67.6
Casein
11.6
Corn oil
10
Vitamin mixtures
1
Salt mixture
4
Cellulose
5
D.L methionine
0.3
Choline chloride
0.2
2.2.5.2 Experiment design
Female rats were housed in polycarbonate cages measuring 40 × 24 × 20 Cm (each cage contained 6 rats), kept in a room at 25 ͦ C ± 2 ͦ C and maintained under normal healthy conditions. After feeding on Basel diet for ten days, they were dispensed to two essential groups: The first group (6 rats) continued consuming Basel diet as a negative control group (healthy rats). The second group (24 rats) fed on high fat diet (20 % fat sheep + 0.2 % bile salt) for 1 month. After induction of obesity, the rats divided into five groups and fed different diets for 12 weeks. Group1: Rats continued feeding with Basel diet as a negative control (healthy rats). Group2: Rats treated with high fat diet (20 % sheep fat + 0.2 % bile salt) as a positive control (obese rats). Group3: Rats treated with high fat diet + control balady bread which added in a ratio of 50 %. Group4: Rats treated with high fat diet + balady bread contained 60 % WBF in a ratio of 50 %. Group5: Rats treated with high fat diet + balady bread contained 80 % WBF in a ratio of 50 %.
2.2.5.3 Determination of food intake and body weight
Body weight for each rat recorded every week and food intake were measured every two days during the 12 weeks of the experimental period. Food intake was determined by calculating the rested amount in the feed bin subtracted from weight of food content placed one day before according to Ennouri et al., (2006).
2.2.5.4 Organs weight
Rats abdomen were carefully opened (Fig. 3) to remove the organs including liver, kidney and heart from each rat and then washed with saline solution, dehydrated by filter paper and weighted. The organs kept at −20 ͦ C for further analysis (Chapman et al., 1959). The relative organ’s weight was recorded according to the following formula:
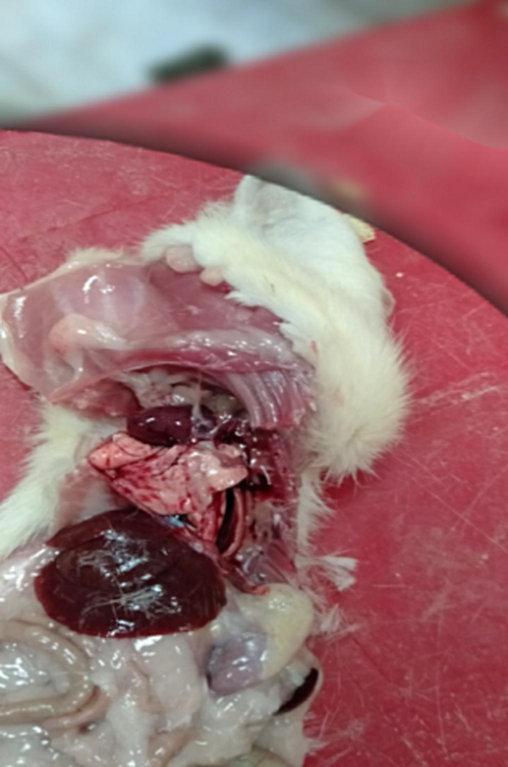
Rats abdomen were carefully opened to remove the organs.
2.2.5.5 Biological test
At the start of the trial before treatment (after induction of obesity) and then at the end of the experimental period (12 weeks) rats were fasted for 12 h., blood was drawn from orbital venous after anesthetizing rats with diethyl ether as shown in Fig. 4. Thereafter the blood samples were taken in a clean dry centrifuge vial to get and separate the serum. Blood samples without anticoagulant were centrifuging at 3500 R.P.M. for 10 min (Schermer, 1967). The serum preserved at frozen at − 20 °C for further analysis. All following parameters were determined: “ S Glucose according to Trinder (1969), lipid profile tests “ Total Cholesterol as described by Allain et al., (1974), Triglycerides according to Fassati et al.,(1982), Low density Lipoprotein (LDL-C) according to Friedwald et al., (1972) and High density lipoprotein (HDL-C) according to Lopes-Virella et al., (1977),” liver enzymes “glutamic pyruvic transaminase (GPT) and glutamic oxaloacetic transaminase (GOT)” as described by Bergmeyer et al.,(1986) and kidney function parameters “creatinine as described by Bartels et al., (1971) and urea as described by Tabacco et al., (1979).
Blood drawing from orbital venous.
2.2.5.6 Histopathological investigation
Tissue samples of the livers were taken. Specimens were immersed in 10 % neutral buffered formalin solution and left for about 24 h, then washed in water for the histopathological investigation according to the method described by Banchroft et al., (1996).
2.2.5.7 Peritoneal fat pad
After induction of obesity before treatment in the first of trial and then in the end of the trial, peritoneal perinephric fat pad was collected from the rats after dissection, then kept at −20 ͦ C for histopathology examination of fatty tissues as mentioned by Azain et al., (2000).
2.2.6 Statistical analysis
The statistical data was expressed as arithmetic mean ± stander deviation (SD). The analysis of variance performed by Excel (ANOVA) method and the level of statistical significance was P ≤ 0.05 as mentioned by Aly et al., (2020).
3 Results and dissection
3.1 Results
3.1.1 Chemical composition of bread
Table 3 shows the chemical composition of balady bread samples which were prepared by blending 60 % and 80 % WBF with WF. The resultant data illustrated that the higher level of WBF incorporated in bread recorded the highest content of moisture (38.6 %) as compared with the lower level (36.4 %) and control bread (31.3 %). Supplementation caused a significant increase in protein contents which ranged from (9.1 to 11.1 %) in samples. The higher level of WBF incorporated into bread had the highest ash and crude fiber contents (2.9 and 3.8 %) while the control bread showed the least for these values (1.2 and 0.9 %). WBF: Whole barley flour WF: wheat flour. Different letters (a, b) within column show significant differences between values (p < 0.05). Data are indicated as: average for three replicates ± standard deviation (SD); % on dry weight basis.
Breads
Moisture
Protein
Fat
Ash
Crude fiber
Carbohydrates
Control
31.3 ± 1.1c
9.1 ± 0.3b
1.59 ± 0.22b
1.2 ± 0.3c
0.9 ± 0.1c
56.2 ± 1.9a
40 %WF + 60 %WBF
36.4 ± 0.7b
10.5 ± 0.5 a
2.27 ± 0.38a
2.2 ± 0.3b
2.7 ± 0.1b
46 ± 0.6b
20 %WF + 80 %WBF
38.6 ± 1.2a
11.1 ± 0.2 a
2.46 ± 0.42a
2.9 ± 0.2a
3.8 ± 0.07a
40.9 ± 0.9c
LSD*0.05
2
0.7
0.69
0.52
0.2
2.9
3.1.2 Sensory attributes of balady bread
The results in Table 4 illustrate the sensory scores of prepared balady bread supplemented with 60 % and 80 % whole barley flour (WBF). It could be noticed that bread prepared from 20 %WF + 80 %WBF had the highest score for taste and odor followed by bread prepared from 40 %WF + 60 %WBF compared to control bread and this preference due to barley flour’s gummy taste. Control sample had the highest score for appearance, color and texture. A significant decrease in appearance, crust color and texture were recorded in all supplemented breads. These data are consistent with Ereifej et al., (2006) who showed that when barley flour level increase over 45 % in balady bread, lead to darker in color, harder and non-uniformly-shaped, as the fiber gives its own brownish color to bread and it can be attributed to the lack of gluten. WBF: Whole barley flour WF: wheat flour. Different letters (a, b) within column show significant differences between values (p < 0.05). Data are indicated as: average (for ten scores) ± standard deviation (SD).
Samples Characteristics
Control
40 %WF + 60 %WBF
20 %WF + 80 %WBF
LSD*0.05
Appearance (10)
9.5 ± 0.4 a
8.00 ± 0.8b
7.4 ± 0.5c
0.6
Color (10)
9.55 ± 0.44a
7.7 ± 0.42b
7.5 ± 0.47b
0.4
Texture (10)
9.4 ± 0.46a
7.7 ± 0.5b
7.4 ± 0.47b
0.4
Taste 10
8.9 ± 0.3c
9.2 ± 0.3 a
9.6 ± 0.4 a
0.3
Odor (10)
8.9 ± 0.52c
9.25 ± 0.26b
9.55 ± 0.16a
0.3
Overall acceptability (10)
9.54 ± 0.37a
8.15 ± 0.47b
8.15 ± 0.47b
0.5
3.1.3 Microbial evaluation (total count bacterial &mold and yeast) of produced balady breads during storage period (8 days) at room temperature (18 °C ± 2)
Total bacteria count is used for indicating of bacteria load in a sample. The loaves of bread were stored for 8 days at (18 ± 2 ͦ C). The data in Table 5 shows that balady bread samples have no detected of growth bacteria or growth mold and yeast at zero time these data are in agreement with Ravimannan et al., (2016) who revealed that all the fresh bread samples (control and experimental) had no detected total count bacteria before storage. Control balady bread recorded the highest count during the storage period as compared with WBF-wheat bread. It was obviously visible to the naked eye that control bread was spoiled and rejected on the 6th day. It reached to the maximum count in the fourth day (7.5 × 10³ cfu/gm) while balady bread prepared with 60,80 % WBF were rejected on 8th day and reached to the maximum count in the sixth day (7.2 × 10³cfu/gm, 5.9 × 10³ cfu/gm), respectively. Mold and yeast are one of the major causes of food spoilage besides bacteria load. Balady bread control contained higher counts of mold and yeast count (9.3 × 10², 41.3 × 10² cfu/gm) after 2 and 4 days of storage period, respectively than balady bread supplemented with 60 % WBF which were 4.3 × 102,30 × 102,41.7 × 102 cfu/gm after 2,4,6 days of storage, and balady bread supplemented with 80 % WBF had 3 × 102,26.3 × 102,38.3 × 102 cfu/gm after 2, 4and 6 days of storage. Cfu.: colony forming units; WBF: Whole barley flour; WF: wheat flour; NC: No colonies were noticed; R: Rejected; NS: non-significant. Different letters (a, b) within column show significant differences between values (p < 0.05).
Microbial parameter (cfu/gm)
Storage Period
Microbial counts of balady bread supplemented with WBF
Control
40WF + 60 %WBF bread
20WF + 80 %WBF bread
Total count Bacteria
Zero Time
NC
NC
NC
2 days LSD*0.05 0.8
(4.2 × 10³ ± 2.6)a
(2.8 × 10³ ± 4.2)b
(2.9 × 10³ ± 5.00)b
4 days LSD*0.05 0.8
(7.5 × 10³ ± 4.5)a
(5.2 × 10³ ± 4.9)b
(4.3 × 10³ ± 2.1)c
6 days LSD*0.050.9
R
(7.2 × 10³ ± 2.0)a
(5.9 × 10³ ± 5.6)b
8 days
R
R
R
Mold & yeast
Zero Time
NC
NC
NC
2 days LSD*0.05 3.9
(9.3 × 10² ± 2.5)a
(4.3 × 10² ± 2.1)b
(3 × 10² ± 1.0)b
4 days LSD*0.05 6.2
(41.3 × 10² ± 3.2)a
(30 × 102 ± 2.6)b
(26.3 × 10² ± 3.5)b
6 days LSD*0.05 16.4
R
(41.7 × 10² ± 7.02)NS
(38.3 × 10² ± 7.5)NS
8 days
R
R
R
3.1.4 Biological evaluation
3.1.4.1 Effect of balady bread supplemented with different levels of whole barley flour on body weight gain (BWG) of obese rats
Data in Table 6 shows the changes in body weight gain of normal rats and obese rats. Obese groups indicated a significant increase in body weight gain as compared with the normal rats at the end of experiment period. All treated groups with whole barley bread decreased the mean value of BWG as compared to group treated with control bread and the positive control group. It can be attributed to decrements in the consumption of total calories and carbohydrates other than those in the experimental diets. In this respect, Burton et al., (2000) mentioned that all of mechanisms explained the satiating properties of soluble dietary fibers are associated with appetite regulation including absorption taste, a fermentable substrate and gastric emptying. There are not significant variances between whole barley bread treatments (G4, G5). These results are in agreement with Kalra et al., (2000) who demonstrated the effects of three barley cultivars containing 6·23, 4·60, 2·18 % b-glucan and showed that final body weight and weight gain for the control treatment were the highest after 40 days of feeding in comparison to test groups. In addition, Aoe et al., (2017) studied the effects of high b-glucan barley cultivar on obesity and the barley was incorporated into rice as a replacement for the ordinary pearled rice. During the experiment, body weight and BMI significantly lowered in the experimental groups. From the resultant data, it could be concluded that the long term consumption of diet containing whole barley flour can help in weight control. WBF: Whole barley flour; WF: wheat flour; B.W.G: Body weight gain. Different letters (a, b) within column show significant differences between values (p < 0.05). Data are indicated as: average ± standard deviation (SD).
Parameters Groups
Initial Weight(g)
Final Weight (g)
B.W.G
% B.W.G
Food Intake (g/day/rat)
Control negative(G1)
187.75 ± 6.5b
220.3 ± 11.0c
32.5 ± 8.9b
15.4 ± 4.7b
17.58 ± 1.03b
Control positive(G2)
225.75 ± 12.42a
276 ± 4.2a
50.3 ± 11.3a
22.5 ± 6.4 a
18.12 ± 0.66a
Control bread(G3)
209.75 ± 8.04a
255 ± 6.8b
46.0 ± 2.1a
22.1 ± 1.7a,b
16.95 ± 0.73c
40WF + 60 %WBF(G4) bread
216.75 ± 12.01a
250.7 ± 16.2b
29.5 ± 4.4b
13.6 ± 2.1b
15.09 ± 1.11d
20WF + 80 %WBF (G5) bread
213 ± 9.1a
241.3 ± 10.7b
28.3 ± 5.3b
13.3 ± 2.5b
14.92 ± 0.94 d
LSD*0.05
14.9
15.1
10.7
5.9
0.5
3.1.4.2 Food intake(FI)
As indicated in Table 6, results of FI recorded a significant increase in positive control group as compared with negative rats (18.12 ± 0.66 and 17.58 ± 1.03 g/day, respectively). All obese groups treated with barley bread recorded a significant decrease in FI (15.09 ± 1.11 and 14.92 ± 0.94 g/day) as compared with both control negative and control positive group. These results are in agreement with those obtained by Darwiche et al., (2003) who mentioned that dietary fibers including soluble fibers, an ingredient of whole grains, can act as a satiating agent. Some cereal such as barley and oats contain viscous dietary fibers causing delay stomach emptying and gastric distention as well as form viscous gel. It is worth mentioning that, diet contained antioxidants could play a prophylactic role against the side and toxic effects of high fat diet in rats (Shehata et al., 2012).
3.1.4.3 Effect of experimental diets on relative organ weights of liver, kidney and heart in obese rats
The differences in organs weight listed in Table 7. It is clearly to seen that the weights of liver, kidney and heart in obese rats increased significantly in comparison to healthy negative group and these data are consistent with Athesh et al., (2012) who mentioned that the liver, spleen and kidney absolute weights of high fat diet groups had a significantly higher values than animals group fed on negative diet. The mean value of liver and heart relative weight were reduced in response to the 60 % and 80 % WBF breads in comparison with other obese groups and recorded the best results. The absolute weights of heart inclined to be lower in rats‐fed on WBF 80 % than 60 % WBF group, but these differences were not statistical significance. Biological analyses. WBF: Whole barley flour; WF: wheat flour. Different letters (a, b) within column show significant differences between values (p < 0.05). Data are indicated as: average ± SD; NS means non-significant.
Rat Groups
Liver
Kidney
Heart
Weight (g)
Relative Organ weight
Weight (g)
Relative Organ weight
Weight (g)
Relative Organ weight
Control negative
9.1 ± 0.14 d
4.1 ± 0.14c
2.1 ± 0.3b
0.96 ± 0.1NS
0.8 ± 0.04 d
0.4 ± 0.03c
Control positive
11.9 ± 0.1a
4.3 ± 0.1 a
2.7 ± 0.2a
0.99 ± 0.1 NS
1.6 ± 0.1a
0.6 ± 0.1a
Control bread
11.0 ± 0.2b
4.3 ± 0.1 a
2.6 ± 0.1 a
1 ± 0.01NS
1.36 ± 0.21b
0.5 ± 0.1b
40WF + 60 %WBF bread
10.1 ± 0.5c
4.02 ± 0.1d
2.4 ± 0.2 a
0.99 ± 0.1NS
1.1 ± 0.1c
0.4 ± 0.03c
20WF + 80 %WBF bread
9.9 ± 0.4c
4.2 ± 0.1b
2.4 ± 0.3a
0.99 ± 0.1NS
0.97 ± 0.1c
0.4 ± 0.04c
LSD*0.05
0.47
0.1
0.32
0.13
0.21
0.1
3.1.4.4 Effect of balady bread supplemented with different levels of whole barley flour on serum glucose of obese rats
The serum glucose values of rats fed on different diets under investigation during feeding period presented in Table 8. Concerning positive control group, the resultant data shows that the mean value of serum glucose in positive control group had a significant increase compared to control negative group (145.9 ± 5.8, 118.4 ± 1.1 mg/dl). All treated groups with barley bread causing a significant decrease in serum glucose compared with positive control group (G2) and control bread (G3). The mean values of serum glucose in rats fed on lower level of barley in G4 caused slight increase at the end of feeding period. There were non– significant variances between the two groups G4, G5 treated with barley bread 131.9 ± 4.2, 131.3 ± 1.8 mg/dl, respectively. WBF: Whole barley flour; WF: wheat flour; %Var.: Variation Different letters (a, b) within column show significant differences between values (p < 0.05). Data is indicated as average (or three replicates ± standard deviation (SD).
Groups of rats
Glucose mg/dl
Zero time
Week 12
% Var.
Control negative
115.4 ± 3.5b
118.4 ± 1.1c
2.6 ↑
Control positive
126.9 ± 1.8a
145.9 ± 5.8 a
15↑
Control bread
132.1 ± 1.8a
142.6 ± 2.9a
7.9↑
40WF + 60 %WBF bread
130.7 ± 4.1 a
131.9 ± 4.2b
0.9↑
20WF + 80 %WBF bread
132.03 ± 1.00a
131.3 ± 1.8b
0.6 ↓
LSD*0.05
5.7
6.8
3.1.4.5 Effect of balady bread supplemented with different levels of whole barley flour on lipid profile of obese rats
The effects of treatment with barley balady bread on lipid profile of obese rats during feeding period presented in Table 9. High fat diet had significantly increased serum total cholesterol, low density lipoproteins and triglycerides, and decreased serum high density lipoproteins. All groups treated with barley showed a significant reduction in serum cholesterol compared with positive control group (G2) and bread control group (G3). In G3, cholesterol level was raised from 109.7 ± 11.5 to 123.77 ± 8.46 by 12.8 % in the end of experiment. The higher level of barley in G5 (80 %) ameliorated S. cholesterol more than the lower one in G4 (60 %). In G5, cholesterol level was reduced from 112.2 ± 13.5 at zero time to 95.93 ± 4.38 by 14.5 % at week 12. Likewise, Rats fed on diet formulated with 80 % WBF bread (G5) had the lowest level of triglycerides 161.95 mg/dl followed by (G4) which fed on 60 % WBF bread 181.20 ± 7.02 mg/dl compared with control positive and the group treated with control bread 208.97 mg/dl. G: Group; S, serum; %Var.: Variation; Different letters (a, b) within column show significant differences between values (p < 0.05). Data are indicated as: average for three replicates ± standard deviation (SD).
Groups of rats
S. Cholesterol mg/dl
Triglycerides mg/dl
Zero time
Week 12
% Var.
Zero time
Week 12
% Var.
Control negative
84.67 ± 4.51b
89.3 ± 2.08c
5.5↑
115.7 ± 5.9c
124.83 ± 7.18d
7.9↑
Control positive
115.3 ± 9.1a
133.87 ± 5.00a
16.1↑
169.53 ± 9.04b
220.9 ± 11.7a
30.3↑
G3
109.7 ± 11.5a
123.77 ± 8.46a
12.8↑
180 ± 3.00a
208.97 ± 9.49a
16.1↑
G4
107.9 ± 9.97a
104.8 ± 5.57b
2.9↓
188.63 ± 4.40a
181.20 ± 7.02b
3.9↓
G5
112.2 ± 13.5a
95.93 ± 4.38b,c
14.5↓
171.27 ± 5.61b
161.95 ± 5.67c
5.4↓
LSD *0.05
18.5
10.5
10.79
16.51
Data indicated in Table 10 shows that barley bread in G4 which treaded with (60 %WBF bread) caused a slight decrease in HDL level at the end of experimental period. While in G3 which treated with control bread, these value decreased by 21.5 %. The higher level of whole barley flour had a more effect for the mean value of HDL-c. and recorded the highest 35.4 ± 1.48 mg/dl, followed by the lower level in G4 30.8 ± 1.25 mg/dl as compared to positive control group(G2) 24 ± 3 mg/dl or the control bread group (G3) 25.2 ± 0.47. These data are confirmed by Shaban et al., (2006) who showed that the least value for HDL-c was recorded for bread control group. While the maximum value was recorded for the bread contained a high level of barley flour. The obese rats treated with balady bread supplemented with barley (G4 and G5) decreased the mean value of LDL as compared to control bread. Concerning G4, the mean value of serum LDL was 37.1 ± 6.5 mg/dl at the end of the experimental period. While G5, serum LDL was reduced from 44.6 ± 12.4 mg/dl to 27.8 ± 4.2 mg/dl by 37.7 %. G: Group; C: Cholesterol; HDL: High density lipoprotein; LDL: Low density lipoprotein; %Var.: Variation Different letters (a, b) within column show significant differences between values (p < 0.05). Data are indicated as: average for three replicates ± standard deviation (SD).
Groups of rats
HDL-C mg/dl
LDL-C mg/dl
Zero time
Week 12
% Var.
Zero time
Week 12
% Var.
Control Negative
43.3 ± 1.53a
45.7 ± 4.2a
5.5↑
18.2 ± 4.2b
18.7 ± 7.4c
2.7↑
Control Positive
33.7 ± 1.2b
24 ± 3d
28.8↓
47.7 ± 7.2a
65.7 ± 3.8a
37.7↑
G3
32.1 ± 1.00b
25.2 ± 0.47d
21.5↓
41.6 ± 12.7a
56.8 ± 8.4a
36.5↑
G4
33 ± 2.46b
30.8 ± 1.25c
6.7↓
37.2 ± 13.5a
37.1 ± 6.5b
0.3↓
G5
33.3 ± 1.5b
35.4 ± 1.48b
6.3↑
44.6 ± 12.4a
27.8 ± 4.2b,c
37.7↓
3.1.4.6 Effects of balady bread supplemented with different levels of whole barley flour on liver functions of obese rats
The effects of treatment with barley balady bread on the level of glutamic pyruvic transaminase (GPT) and glutamic oxaloacetic transaminase (GOT) enzymes of obese rats during feeding period (12 weeks) presented in Table 11. Feeding obese rats as positive group on high fat diet led to a significant increase in serum (GPT) enzyme as compared to negative group at the end of experiment. Barley bread groups (G4, G5) resulting a slight increase in the activity of GPT enzyme at the end of experiment. Groups treated with barley bread recorded a significant decrease in serum GPT and GOT enzymes compared with positive control and control bread groups. On the other hand, the higher level of whole barley incorporated into bread in G5 reduced the activity of S.GOT enzyme by 10.5 % more than the lower one in G4 5.9 %. G: Group; GPT: Glutamic pyruvic transaminase and GOT: Glutamic oxaloacetic transaminase. %Var.: Variation; Different letters (a, b) within column show significant differences between values (p < 0.05). Data are indicated as: average for three replicates ± standard deviation (SD).
Groups of rats
GPT (U/L)
GOT(U/L)
Zero time
Week 12
% Var.
Zero Time
Week 12
% Var.
Control negative
21.73 ± 1.92b
23.91 ± 1.47c
10.03↑
28.67 ± 4.73b
27.03 ± 3.00c
5.7↓
Control positive
31.77 ± 2.84a
36.7 ± 2.1a
15.5↑
37.67 ± 4.38a
46.33 ± 2.78a
22.9↑
G3
31.33 ± 1.29a
36.22 ± 1.19a
15.6↑
38.07 ± 2.25a
41.95 ± 2.74a
10.2↑
G4
30.37 ± 0.87a
31.44 ± 2.08b
3.5↑
39.57 ± 1.10a
37.22 ± 0.84b
5.9↓
G5
32.11 ± 2.22a
32.04 ± 2.2b
0.22↑
37.76 ± 0.96a
33.81 ± 2.73b
10.5↓
LSD *0.05
3.6
3.3
5.68
4.6
3.1.4.7 Effect of balady bread supplemented with different levels of WBF on kidney function of obese rats
The obtained data presented in Table 12 illustrates that feeding obese rats as positive group on high fat diet led to a significant elevation in serum urea compared with negative group 36.57 ± 2.71 vs. 24.3 ± 1.5 mg/dl, respectively. Treating obese rats with diet containing barley either G4 or G5 caused a slight increase in urea level at the end of experiment. The mean values of urea in G4 or G5 were significantly lower 32.33 ± 1.53, 30.13 ± 1.72, as compared to positive group 36.57 ± 2.71 and control bread group 35.97 ± 1.10 mg/dl. The results of El Rabey et al., (2013) support our findings, when they reported that the mean values of urea in oat bran and barley bran groups were lower than the positive control in hypercholesterolemia rats. Regarding creatinine level, the level of creatinine in positive control group was not significantly higher than that in the negative control group 0.72 ± 0.1 and 0.68 ± 0.04 mg/dl. The treatment with WBF bread in G4 and G5 had non– significant difference on serum creatinine level. G: Group; %Var.: Variation; Different letters (a, b) within column show significant differences between values (p < 0.05). Data are indicated as: average for three replicates ± standard deviation (SD).
Groups of rats
Urea nitrogen Mg/dl
Creatinine Mg/dl
Zero Time
Week 12
% Var.
Zero Time
Week 12
% Var.
Control negative
22.8 ± 1.1b
24.3 ± 1.53c
6.6↑
0.62 ± 0.15NS
0.68 ± 0.04NS
9.8↑
Control positive
30.4 ± 1.4a
36.57 ± 2.71a
20.3↑
0.63 ± 0.04NS
0.72 ± 0.1 NS
14.3↑
G3
31.5 ± 3.40a
35.97 ± 1.10a
14.2↑
0.65 ± 0.15NS
0.74 ± 0.04NS
13.8↑
G4
30.7 ± 2.49a
32.33 ± 1.53b
5.3↑
0.60 ± 0.1NS
0.65 ± 0.1NS
8.3↑
G5
30.4 ± 2.08a
30.13 ± 1.72b
0.89↑
0.66 ± 0.19NS
0.75 ± 0.09NS
13.6↑
LSD*0.05
4.3
3.27
0.26
0.13
3.1.5 Histopathological examination of liver
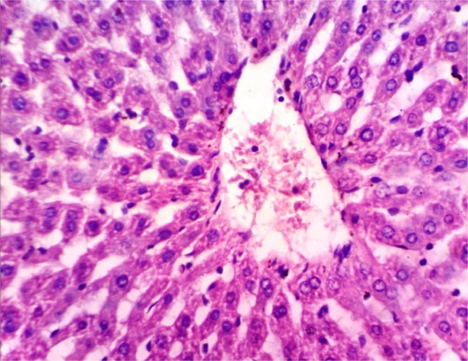
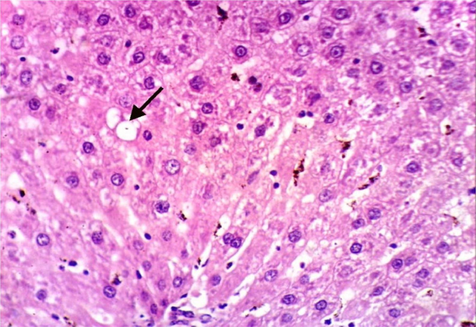
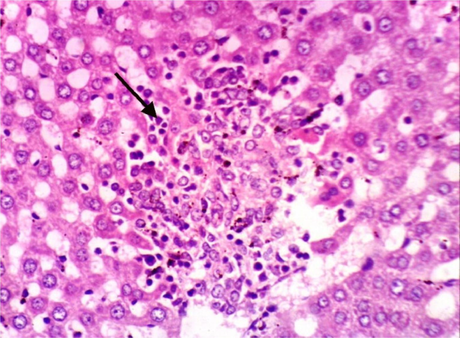
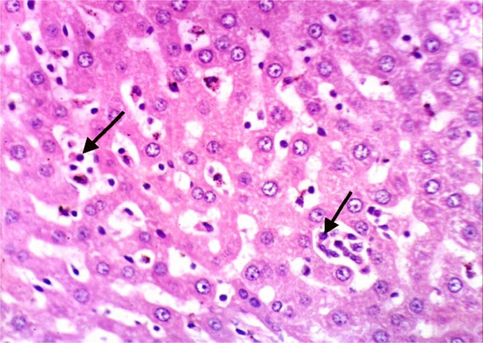
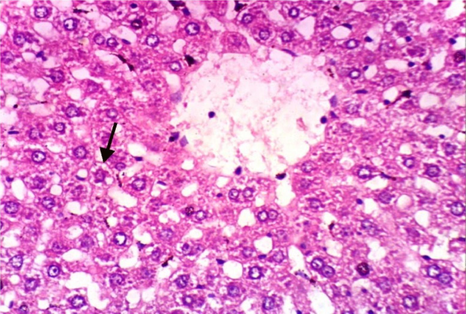
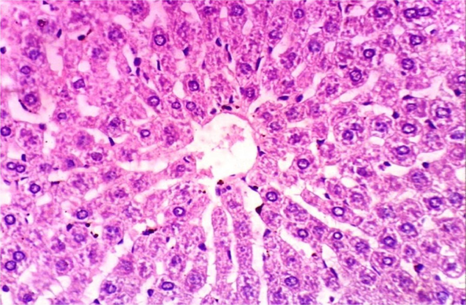
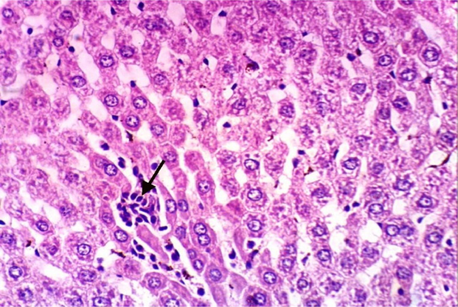
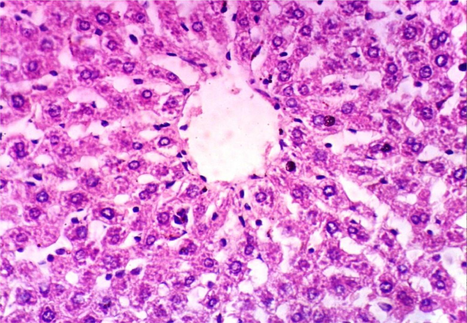
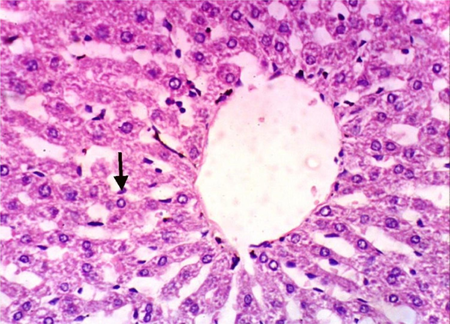
As shown in Fig. 5, microscopically liver of rats from group 1 showed the normal histological structure of hepatic lobule from central vein and hepatocytes (Fig. 5.1. & Fig. 5.2.). On contrary, liver of rats from group 2 showed severe histopathological changes as hepatocellular vacuolar degeneration (Fig. 5.3.), focal hepatocellular necrosis associated with inflammatory cells infiltration (Fig. 5.4.) and sinusoidal leukocytosis (Fig. 5.5.). Meanwhile, liver of rats from group 3 revealed no histopathological alterations (Fig. 5.6.) except hepatocellular vacuolar degeneration of some hepatocytes (Fig. 5.7.) Moreover, liver of rats from group 4 showed improved picture, most examined sections revealed no histopathological alterations (Fig. 5.8.) and some sections showed small focal hepatocellular necrosis associated with inflammatory cells infiltration (Fig. 5.9.). Also, some sections from group 5 showed no histopathological alterations and approximately restored normal histological structure (Fig. 5.10.) another sections cleared slight kupffer cells activation (Fig. 5.11.).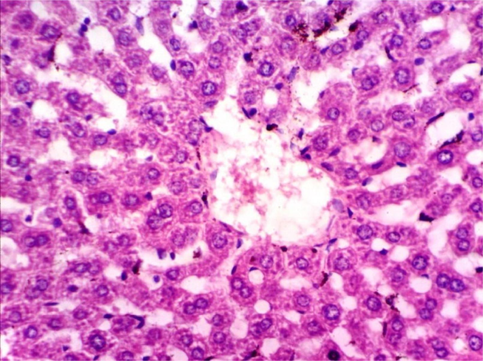
Histopathological examination of liver tissue of different groups treated with breads supplemented with different levels of whole barley. (Fig. 5.1.) Liver of rat from group 1 showing the normal histological structure of hepatic lobule. Normal central vein and hepatocytes (H & E X 400). (Fig. 5.2.) Liver of rat from group 1 showing the normal histological structure of hepatic lobule. Normal central vein and hepatocytes (H & E X 400). (Fig. 5.3.) Liver of rat from group 2 showing hepatocellular vacuolar degeneration (H & E X 400). (Fig. 5.4.) Liver of rat from group 2 showing focal hepatocellular necrosis associated with inflammatory cells infiltration (H & E X 400). (Fig. 5.5.) Liver of rat from group 2 showing sinusoidal leukocytosis (H & E X 400). (Fig. 5.6.) Liver of rat from group 3 showing no histopathological alterations (H & E X 400). (Fig. 5.7.) Liver of rat from group 3 showing hepatocellular vacuolar degeneration of some hepatocytes (H & E X 400). (Fig. 5.8.) Liver of rat from group 4 showing no histopathological alterations (H & E X 400). (Fig. 5.9.) Liver of rat from group 4 showing small focal hepatocellular necrosis associated with inflammatory cells infiltration (H & E X 400). (Fig. 5.10.) Liver of rat from group 5 showing no histopathological alterations (H & E X 400). (Fig. 5.11.) Liver of rat from group 5 showing slight Kupffer cells activation (H & E X 400).
Histopathological examination of liver tissue of different groups treated with breads supplemented with different levels of whole barley. (Fig. 5.1.) Liver of rat from group 1 showing the normal histological structure of hepatic lobule. Normal central vein and hepatocytes (H & E X 400). (Fig. 5.2.) Liver of rat from group 1 showing the normal histological structure of hepatic lobule. Normal central vein and hepatocytes (H & E X 400). (Fig. 5.3.) Liver of rat from group 2 showing hepatocellular vacuolar degeneration (H & E X 400). (Fig. 5.4.) Liver of rat from group 2 showing focal hepatocellular necrosis associated with inflammatory cells infiltration (H & E X 400). (Fig. 5.5.) Liver of rat from group 2 showing sinusoidal leukocytosis (H & E X 400). (Fig. 5.6.) Liver of rat from group 3 showing no histopathological alterations (H & E X 400). (Fig. 5.7.) Liver of rat from group 3 showing hepatocellular vacuolar degeneration of some hepatocytes (H & E X 400). (Fig. 5.8.) Liver of rat from group 4 showing no histopathological alterations (H & E X 400). (Fig. 5.9.) Liver of rat from group 4 showing small focal hepatocellular necrosis associated with inflammatory cells infiltration (H & E X 400). (Fig. 5.10.) Liver of rat from group 5 showing no histopathological alterations (H & E X 400). (Fig. 5.11.) Liver of rat from group 5 showing slight Kupffer cells activation (H & E X 400).
Histopathological examination of liver tissue of different groups treated with breads supplemented with different levels of whole barley. (Fig. 5.1.) Liver of rat from group 1 showing the normal histological structure of hepatic lobule. Normal central vein and hepatocytes (H & E X 400). (Fig. 5.2.) Liver of rat from group 1 showing the normal histological structure of hepatic lobule. Normal central vein and hepatocytes (H & E X 400). (Fig. 5.3.) Liver of rat from group 2 showing hepatocellular vacuolar degeneration (H & E X 400). (Fig. 5.4.) Liver of rat from group 2 showing focal hepatocellular necrosis associated with inflammatory cells infiltration (H & E X 400). (Fig. 5.5.) Liver of rat from group 2 showing sinusoidal leukocytosis (H & E X 400). (Fig. 5.6.) Liver of rat from group 3 showing no histopathological alterations (H & E X 400). (Fig. 5.7.) Liver of rat from group 3 showing hepatocellular vacuolar degeneration of some hepatocytes (H & E X 400). (Fig. 5.8.) Liver of rat from group 4 showing no histopathological alterations (H & E X 400). (Fig. 5.9.) Liver of rat from group 4 showing small focal hepatocellular necrosis associated with inflammatory cells infiltration (H & E X 400). (Fig. 5.10.) Liver of rat from group 5 showing no histopathological alterations (H & E X 400). (Fig. 5.11.) Liver of rat from group 5 showing slight Kupffer cells activation (H & E X 400).
Histopathological examination of liver tissue of different groups treated with breads supplemented with different levels of whole barley. (Fig. 5.1.) Liver of rat from group 1 showing the normal histological structure of hepatic lobule. Normal central vein and hepatocytes (H & E X 400). (Fig. 5.2.) Liver of rat from group 1 showing the normal histological structure of hepatic lobule. Normal central vein and hepatocytes (H & E X 400). (Fig. 5.3.) Liver of rat from group 2 showing hepatocellular vacuolar degeneration (H & E X 400). (Fig. 5.4.) Liver of rat from group 2 showing focal hepatocellular necrosis associated with inflammatory cells infiltration (H & E X 400). (Fig. 5.5.) Liver of rat from group 2 showing sinusoidal leukocytosis (H & E X 400). (Fig. 5.6.) Liver of rat from group 3 showing no histopathological alterations (H & E X 400). (Fig. 5.7.) Liver of rat from group 3 showing hepatocellular vacuolar degeneration of some hepatocytes (H & E X 400). (Fig. 5.8.) Liver of rat from group 4 showing no histopathological alterations (H & E X 400). (Fig. 5.9.) Liver of rat from group 4 showing small focal hepatocellular necrosis associated with inflammatory cells infiltration (H & E X 400). (Fig. 5.10.) Liver of rat from group 5 showing no histopathological alterations (H & E X 400). (Fig. 5.11.) Liver of rat from group 5 showing slight Kupffer cells activation (H & E X 400).
Histopathological examination of liver tissue of different groups treated with breads supplemented with different levels of whole barley. (Fig. 5.1.) Liver of rat from group 1 showing the normal histological structure of hepatic lobule. Normal central vein and hepatocytes (H & E X 400). (Fig. 5.2.) Liver of rat from group 1 showing the normal histological structure of hepatic lobule. Normal central vein and hepatocytes (H & E X 400). (Fig. 5.3.) Liver of rat from group 2 showing hepatocellular vacuolar degeneration (H & E X 400). (Fig. 5.4.) Liver of rat from group 2 showing focal hepatocellular necrosis associated with inflammatory cells infiltration (H & E X 400). (Fig. 5.5.) Liver of rat from group 2 showing sinusoidal leukocytosis (H & E X 400). (Fig. 5.6.) Liver of rat from group 3 showing no histopathological alterations (H & E X 400). (Fig. 5.7.) Liver of rat from group 3 showing hepatocellular vacuolar degeneration of some hepatocytes (H & E X 400). (Fig. 5.8.) Liver of rat from group 4 showing no histopathological alterations (H & E X 400). (Fig. 5.9.) Liver of rat from group 4 showing small focal hepatocellular necrosis associated with inflammatory cells infiltration (H & E X 400). (Fig. 5.10.) Liver of rat from group 5 showing no histopathological alterations (H & E X 400). (Fig. 5.11.) Liver of rat from group 5 showing slight Kupffer cells activation (H & E X 400).
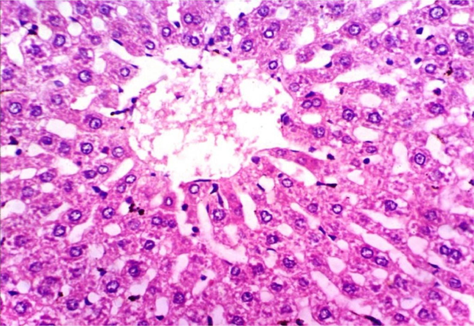
Histopathological examination of liver tissue of different groups treated with breads supplemented with different levels of whole barley. (Fig. 5.1.) Liver of rat from group 1 showing the normal histological structure of hepatic lobule. Normal central vein and hepatocytes (H & E X 400). (Fig. 5.2.) Liver of rat from group 1 showing the normal histological structure of hepatic lobule. Normal central vein and hepatocytes (H & E X 400). (Fig. 5.3.) Liver of rat from group 2 showing hepatocellular vacuolar degeneration (H & E X 400). (Fig. 5.4.) Liver of rat from group 2 showing focal hepatocellular necrosis associated with inflammatory cells infiltration (H & E X 400). (Fig. 5.5.) Liver of rat from group 2 showing sinusoidal leukocytosis (H & E X 400). (Fig. 5.6.) Liver of rat from group 3 showing no histopathological alterations (H & E X 400). (Fig. 5.7.) Liver of rat from group 3 showing hepatocellular vacuolar degeneration of some hepatocytes (H & E X 400). (Fig. 5.8.) Liver of rat from group 4 showing no histopathological alterations (H & E X 400). (Fig. 5.9.) Liver of rat from group 4 showing small focal hepatocellular necrosis associated with inflammatory cells infiltration (H & E X 400). (Fig. 5.10.) Liver of rat from group 5 showing no histopathological alterations (H & E X 400). (Fig. 5.11.) Liver of rat from group 5 showing slight Kupffer cells activation (H & E X 400).
Histopathological examination of liver tissue of different groups treated with breads supplemented with different levels of whole barley. (Fig. 5.1.) Liver of rat from group 1 showing the normal histological structure of hepatic lobule. Normal central vein and hepatocytes (H & E X 400). (Fig. 5.2.) Liver of rat from group 1 showing the normal histological structure of hepatic lobule. Normal central vein and hepatocytes (H & E X 400). (Fig. 5.3.) Liver of rat from group 2 showing hepatocellular vacuolar degeneration (H & E X 400). (Fig. 5.4.) Liver of rat from group 2 showing focal hepatocellular necrosis associated with inflammatory cells infiltration (H & E X 400). (Fig. 5.5.) Liver of rat from group 2 showing sinusoidal leukocytosis (H & E X 400). (Fig. 5.6.) Liver of rat from group 3 showing no histopathological alterations (H & E X 400). (Fig. 5.7.) Liver of rat from group 3 showing hepatocellular vacuolar degeneration of some hepatocytes (H & E X 400). (Fig. 5.8.) Liver of rat from group 4 showing no histopathological alterations (H & E X 400). (Fig. 5.9.) Liver of rat from group 4 showing small focal hepatocellular necrosis associated with inflammatory cells infiltration (H & E X 400). (Fig. 5.10.) Liver of rat from group 5 showing no histopathological alterations (H & E X 400). (Fig. 5.11.) Liver of rat from group 5 showing slight Kupffer cells activation (H & E X 400).
Histopathological examination of liver tissue of different groups treated with breads supplemented with different levels of whole barley. (Fig. 5.1.) Liver of rat from group 1 showing the normal histological structure of hepatic lobule. Normal central vein and hepatocytes (H & E X 400). (Fig. 5.2.) Liver of rat from group 1 showing the normal histological structure of hepatic lobule. Normal central vein and hepatocytes (H & E X 400). (Fig. 5.3.) Liver of rat from group 2 showing hepatocellular vacuolar degeneration (H & E X 400). (Fig. 5.4.) Liver of rat from group 2 showing focal hepatocellular necrosis associated with inflammatory cells infiltration (H & E X 400). (Fig. 5.5.) Liver of rat from group 2 showing sinusoidal leukocytosis (H & E X 400). (Fig. 5.6.) Liver of rat from group 3 showing no histopathological alterations (H & E X 400). (Fig. 5.7.) Liver of rat from group 3 showing hepatocellular vacuolar degeneration of some hepatocytes (H & E X 400). (Fig. 5.8.) Liver of rat from group 4 showing no histopathological alterations (H & E X 400). (Fig. 5.9.) Liver of rat from group 4 showing small focal hepatocellular necrosis associated with inflammatory cells infiltration (H & E X 400). (Fig. 5.10.) Liver of rat from group 5 showing no histopathological alterations (H & E X 400). (Fig. 5.11.) Liver of rat from group 5 showing slight Kupffer cells activation (H & E X 400).
Histopathological examination of liver tissue of different groups treated with breads supplemented with different levels of whole barley. (Fig. 5.1.) Liver of rat from group 1 showing the normal histological structure of hepatic lobule. Normal central vein and hepatocytes (H & E X 400). (Fig. 5.2.) Liver of rat from group 1 showing the normal histological structure of hepatic lobule. Normal central vein and hepatocytes (H & E X 400). (Fig. 5.3.) Liver of rat from group 2 showing hepatocellular vacuolar degeneration (H & E X 400). (Fig. 5.4.) Liver of rat from group 2 showing focal hepatocellular necrosis associated with inflammatory cells infiltration (H & E X 400). (Fig. 5.5.) Liver of rat from group 2 showing sinusoidal leukocytosis (H & E X 400). (Fig. 5.6.) Liver of rat from group 3 showing no histopathological alterations (H & E X 400). (Fig. 5.7.) Liver of rat from group 3 showing hepatocellular vacuolar degeneration of some hepatocytes (H & E X 400). (Fig. 5.8.) Liver of rat from group 4 showing no histopathological alterations (H & E X 400). (Fig. 5.9.) Liver of rat from group 4 showing small focal hepatocellular necrosis associated with inflammatory cells infiltration (H & E X 400). (Fig. 5.10.) Liver of rat from group 5 showing no histopathological alterations (H & E X 400). (Fig. 5.11.) Liver of rat from group 5 showing slight Kupffer cells activation (H & E X 400).
Histopathological examination of liver tissue of different groups treated with breads supplemented with different levels of whole barley. (Fig. 5.1.) Liver of rat from group 1 showing the normal histological structure of hepatic lobule. Normal central vein and hepatocytes (H & E X 400). (Fig. 5.2.) Liver of rat from group 1 showing the normal histological structure of hepatic lobule. Normal central vein and hepatocytes (H & E X 400). (Fig. 5.3.) Liver of rat from group 2 showing hepatocellular vacuolar degeneration (H & E X 400). (Fig. 5.4.) Liver of rat from group 2 showing focal hepatocellular necrosis associated with inflammatory cells infiltration (H & E X 400). (Fig. 5.5.) Liver of rat from group 2 showing sinusoidal leukocytosis (H & E X 400). (Fig. 5.6.) Liver of rat from group 3 showing no histopathological alterations (H & E X 400). (Fig. 5.7.) Liver of rat from group 3 showing hepatocellular vacuolar degeneration of some hepatocytes (H & E X 400). (Fig. 5.8.) Liver of rat from group 4 showing no histopathological alterations (H & E X 400). (Fig. 5.9.) Liver of rat from group 4 showing small focal hepatocellular necrosis associated with inflammatory cells infiltration (H & E X 400). (Fig. 5.10.) Liver of rat from group 5 showing no histopathological alterations (H & E X 400). (Fig. 5.11.) Liver of rat from group 5 showing slight Kupffer cells activation (H & E X 400).
Histopathological examination of liver tissue of different groups treated with breads supplemented with different levels of whole barley. (Fig. 5.1.) Liver of rat from group 1 showing the normal histological structure of hepatic lobule. Normal central vein and hepatocytes (H & E X 400). (Fig. 5.2.) Liver of rat from group 1 showing the normal histological structure of hepatic lobule. Normal central vein and hepatocytes (H & E X 400). (Fig. 5.3.) Liver of rat from group 2 showing hepatocellular vacuolar degeneration (H & E X 400). (Fig. 5.4.) Liver of rat from group 2 showing focal hepatocellular necrosis associated with inflammatory cells infiltration (H & E X 400). (Fig. 5.5.) Liver of rat from group 2 showing sinusoidal leukocytosis (H & E X 400). (Fig. 5.6.) Liver of rat from group 3 showing no histopathological alterations (H & E X 400). (Fig. 5.7.) Liver of rat from group 3 showing hepatocellular vacuolar degeneration of some hepatocytes (H & E X 400). (Fig. 5.8.) Liver of rat from group 4 showing no histopathological alterations (H & E X 400). (Fig. 5.9.) Liver of rat from group 4 showing small focal hepatocellular necrosis associated with inflammatory cells infiltration (H & E X 400). (Fig. 5.10.) Liver of rat from group 5 showing no histopathological alterations (H & E X 400). (Fig. 5.11.) Liver of rat from group 5 showing slight Kupffer cells activation (H & E X 400).
3.1.6 Histopathology of fatty tissue
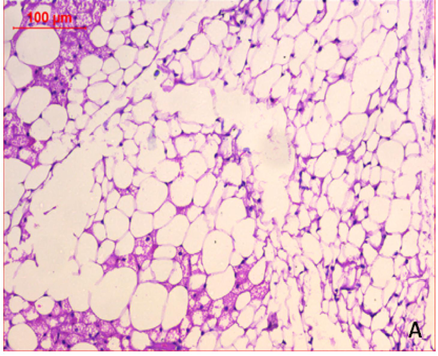
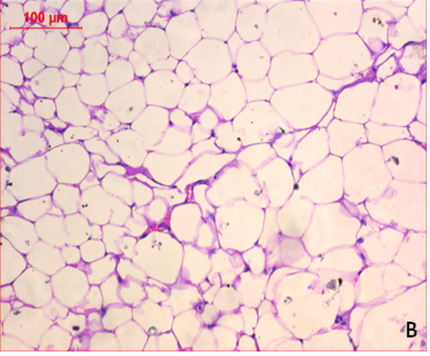
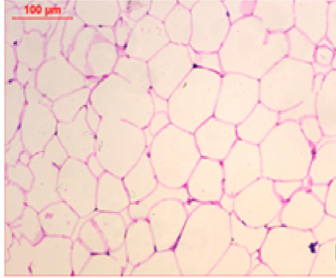
At the first of the trial (after the induction of obesity), Photomicrography of perinephric fat was evaluated and the resultant data illustrated that as shown in Fig. 6., feeding on high fat diet caused an observed expansion of perinephric fatty cells size in positive control group. More accumulation of adipocytes resulted in marked enlargement of fatty cells size (Fig. 6.1.) as compared with those in negative control group which were small (Fig. 6.2.). At the end of trial period, Photomicrography of perinephric fat was also determined (Fig. 7.) and the obtained data revealed that a difference in adipocytes size between groups. Negative group showed small sized fatty cells (Fig. 7.1.). On contrary, positive group showed an enlargement in fatty cells (Fig. 7.2.). Rats from group 3 which treated with control bread had variable sized fat cells most of them are large (Fig. 7.3.). While obese rats which treated with bread (60 % WBF) showed variable sized fat cells most of them are small (Fig. 7.4.) and nearly all fatty cells from group 5 treated with bread (80 % WBF) are small like negative group (Fig. 7.5.).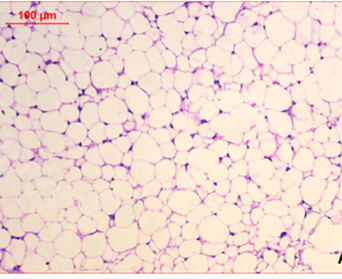
Photomicrography of perinephric fat showing difference in fat cell size between different groups treated with breads supplemented with different levels of whole barley at the end of exprimental period (H&E, x200). (Fig. 7.1.) Small sized fat cells in negative group. (Fig. 7.2.) Large sized fat cells in Positive group. (Fig. 7.3.) Variable sized fat cells , most of them is large figure in group 3. (Fig. 7.4.) Group 4 variable sized fat cells, most of them is small in group 4. (Fig. 7.5.) Nearly all fat cells are small like negative group in group 5.
Photomicrography of perinephric fat showing difference in fat cell size between different groups treated with breads supplemented with different levels of whole barley at the end of exprimental period (H&E, x200). (Fig. 7.1.) Small sized fat cells in negative group. (Fig. 7.2.) Large sized fat cells in Positive group. (Fig. 7.3.) Variable sized fat cells , most of them is large figure in group 3. (Fig. 7.4.) Group 4 variable sized fat cells, most of them is small in group 4. (Fig. 7.5.) Nearly all fat cells are small like negative group in group 5.
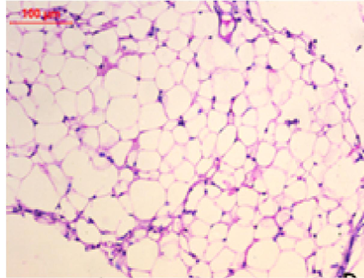
Photomicrography of perinephric fat showing difference in fat cell size between different groups treated with breads supplemented with different levels of whole barley at the end of exprimental period (H&E, x200). (Fig. 7.1.) Small sized fat cells in negative group. (Fig. 7.2.) Large sized fat cells in Positive group. (Fig. 7.3.) Variable sized fat cells , most of them is large figure in group 3. (Fig. 7.4.) Group 4 variable sized fat cells, most of them is small in group 4. (Fig. 7.5.) Nearly all fat cells are small like negative group in group 5.
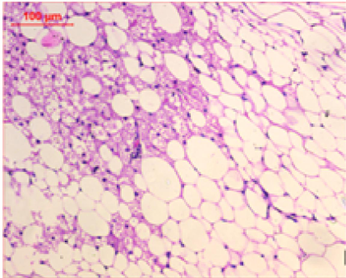
Photomicrography of perinephric fat showing difference in fat cell size between different groups treated with breads supplemented with different levels of whole barley at the end of exprimental period (H&E, x200). (Fig. 7.1.) Small sized fat cells in negative group. (Fig. 7.2.) Large sized fat cells in Positive group. (Fig. 7.3.) Variable sized fat cells , most of them is large figure in group 3. (Fig. 7.4.) Group 4 variable sized fat cells, most of them is small in group 4. (Fig. 7.5.) Nearly all fat cells are small like negative group in group 5.
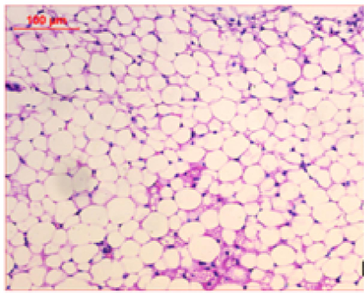
Photomicrography of perinephric fat showing difference in fat cell size between different groups treated with breads supplemented with different levels of whole barley at the end of exprimental period (H&E, x200). (Fig. 7.1.) Small sized fat cells in negative group. (Fig. 7.2.) Large sized fat cells in Positive group. (Fig. 7.3.) Variable sized fat cells , most of them is large figure in group 3. (Fig. 7.4.) Group 4 variable sized fat cells, most of them is small in group 4. (Fig. 7.5.) Nearly all fat cells are small like negative group in group 5.
3.2 Dissection
The increasing in fiber content causes an elevation in water absorption (Sudha et al., 2007). Supplementation caused a decrease in carbohydrate content. These data is confirmed by Hussein et al., (2013) who revealed that WBF-wheat bread was higher in fiber, fat, protein, ash and lower in carbohydrate content than WB. Also, some ingredients, such as β-glucan in barley flour can tightly bound appreciable amounts of water in the dough when added to wheat flour during bread making.Thus β- glucan can affect the texture and volume so dough and availability of water is necessary for the development of the gluten network. An underdeveloped gluten network can cause lower loaf volume and raise bread firmness. Moreover, B-glucan can suppress in the amount of steam generated causing in greater firmness crumb texture and decreased loaf volume (Gill et al., 2002). The results of microbial evaluation of balady breads are confirmed by Liu, (2004) who stated that barley has a several spectrum of phenolic components which considered as a source of antioxidant metabolites that are synthesized in the colon or act as antioxidants themselves. Phenolic compounds play a prominent role in growth and reproduction which can create a defense system against parasites and pathogens (Lattanzio et al., 2006; Mithofer et al., 2012). In conclusion, the incorporation of WBF in balady bread with different levels (60 and 80 %) can increase the shelf life of stored balady bread at room temperature due to its antioxidant properties. the results of effect of balady bread supplemented with different levels of whole barley flour on body weight gain (BWG) of obese rats are in agreement with Kalra et al., (2000) who demonstrated the effects of three barley cultivars containing 6·23, 4·60, 2·18 % b-glucan and showed that final body weight and weight gain for the control treatment were the highest after 40 days of feeding in comparison to test groups. In addition, Aoe et al., (2017) studied the effects of high b-glucan barley cultivar on obesity and the barley was incorporated into rice as a replacement for the ordinary pearled rice. During the experiment, body weight and BMI significantly lowered in the experimental groups. From the resultant data, it could be concluded that the long term consumption of diet containing whole barley flour can help in weight control. There were not significant differences in kidney relative weights between all groups. These results are on the same line with Choi et al., (2010) who mentioned that the treatment with barley containing 2 and 4 % b-glucan (BG) for 12 week led to reducing in weights of liver by 19 and 18.6 % in b- glucan diets 2 and 4 %, respectively and there were no significant reductions in other organ weights after BG treatment. Also, Xia et al., (2018) mentioned that after 8 weeks of feeding high level of hull-less barley, it significantly lowered the organ indexes of liver and abdominal fat in high fat diet rats. In this respect, the liver is considered a prominent agent in keeping lipid homoeostasis (Ogata et al., 2009). In addition, Puskas et al., (2004) showed that an accumulation of intracellular lipid in heart was related to cholesterol and triglycerides elevation in diet. The data of balady bread supplemented with different levels of whole barley flour on serum glucose of obese rats are in agreement with Choi et al., (2010) who revealed that the high levels of β‐glucan in barley led to reduce insulin‐response index and stabilize glucose levels in the blood. Also, Hajifaraji et al., (2012) showed the effect of barley and oat breads on serum glucose in dyslipidemia and type 2 diabetic rats and demonstrated that significant variances were observed in fasting plasma glucose between groups, and these differences were more apparent in the oat bread group at the end of the study. Along with that Brennan et al., (2007) stated the effects of adding Glucagel (a beta-glucan isolate) at ratios 2.5 % and 5 % into breads and the resultant data showed that however, the supplementation led to a reduction in the quality of the end bread, breads supplemented with 5 % Glucagel caused a significant decrement in sugar release after a 300 min of digestion and the authors recommended that we can use beta-glucans against hyper- insulinaemia and hyperglycemia and thus decrease the risk of diabetes and the development of similar chronic diseases. On contrary, Li et al., (2003) studied the effects of barley intake on fasting plasma glucose and found that there were not significant differences between experimental and standard diet after 4 weeks and the authors suggested that, short term consumption of barley had no effect on fasting plasma glucose. In this respect, Wood et al., (1994) reported that β-glucan (from both barley and oat cereals) is considered an important factor in stabilizing of serum glucose and insulin. Soluble dietary fibers can causing many mechanisms process such as stabilize postprandial serum glucose level via delay the release of reducing sugars from food moreover lowered amylolysis (Colonna et al.,1990) and lowering the stomach emptying at the gastrointestinal level (Cherburt, 1995). Similar findings for lipid profile of obese rats fed balady bread supplemented with different levels of whole barley flour were previously mentioned by Ranhotra et al., (1998) who mentioned that serum TG levels showed a dose dependent (decreasing) response to barley in the diet. Compared to diet A, serum TG levels were 9.2 % lower in animals consuming diet B1 (25 % barley diet), 16.8 % lower with diet C1 (50 % barley diet), and 31.1 % lower in animals consuming diet D1 (75 % barley diet). In this respect, Åman (2006) reported that high cholesterol concentration in the blood represents an independent diet-associated risk factor for atherosclerosis. It is known that certain types of dietary fiber such as psyllium fiber and partly soluble b-glucan, help to decrease the cholesterol concentration. Previous investigations have established that dietary fiber can reduce the up-take of lipids and dietary cholesterol through interfering with the micellar solubility of these lipids or likely modify the site and ratio of up-take (Schweizer et al., 1991 & Marlett et al., 1994). The data liver functions of obese rats fed balady bread supplemented with different levels of whole barley flour are on the same line with Maraia et al., (2017) who reported that the daily treatment of whole barley 200 mg/ kg.b.w and 100, 200 mg/kg.b.w. barley bran in hyperlipidemia rats ameliorated liver enzymes in comparison with positive control group at the end of experimental period. Along with that, Abulnaja et al., (2015) reported that the daily dose with 5 %,10 % barley bran significantly lowered all liver enzymes bran in hypercholesterolemia male rats and found that the higher level of barley bran decreased the liver enzymes activity more than the lower one. Liver function tests are usually used in clinical practice to examine liver disease and monitor the development of known disease. The most common liver function tests are the serum aminotransferases (ALT& AST), alkaline phosphatase, bilirubin, albumin and prothrombin (Fleming, 2001). The data of kidney function of obese rats are in agreement with Abulnaja et al., (2015) who studied the effects of barley bran 5, 10 % on kidney function of the hypercholesterolemia rats and found that the concurrent barley bran supplementation had non-significant decrease on creatinine value. Creatinine is the main chemical waste product that’s procreated by muscle metabolism. In the healthy kidney, creatinine is leached by the glomerulus and efficiently secreted by the tubules. Furthermore, test creatinine shows of how well the kidneys filter (Foley et al., 2005 & Stevenes et al., 2006).
4 Conclusion
We can fully exploit WBF in bakery products for increasing daily fiber intake as revealed by chemical analyses. But, the incorporating high levels of WBF into leavened bakery products lead to a decrease in the sensorial quality of these products. Thereby, we need more research to expand the utilization of barley to add healthy properties to wheat- based products. The high levels of whole barley flour improved serum lipids parameters, ameliorated liver enzymes and improved histological structure of liver. The higher level of whole barley incorporated into bread improved those parameters than the lower one. The long term consumption of WBF-wheat bread with high b-glucan levels can help weight management and this can likely due to the decrement of total calories intake and promoting satiation. The outer bran of whole barley which possessed the majority of soluble fibers and β- glucan could possibly have preferential effects than any other whole barley fractions.
Acknowledgments
The authors extend their appreciation to the Researchers Supporting Project number (RSPD2023R653), King Saud University, Riyadh, Saudi Arabia for funding this project.
Declaration of competing interest
The authors declare that they have no known competing financial interests or personal relationships that could have appeared to influence the work reported in this paper.
References
- The efficiency of barley (Hordeum Vulgare) bran in ameliorating blood and treating fatty heart and liver of male rats. Evid. Based Complement. Alternat. Med. 2015740716
- [CrossRef] [Google Scholar]
- AIN, 1993. American Institute of Nutrition Purified Diet for Laboratory Rodent, Final Report. J. Nutrition, 123: 1939-1959.
- Enzymetic determination of total serum cholesterol. J. Clin. Chem.. 1974;20:470S-475S.
- [CrossRef] [Google Scholar]
- Effect of addition sesame seeds powder with different ratio on microstructural and some properties of low fat Labneh. Arab. J. Chem.. 2020;13(10):7572-7582.
- [CrossRef] [Google Scholar]
- Aly, A.A., 2019. Chemical, Rheological, Sensorial and Microbial Evaluation of Supplemented Wheat Flour Biscuit with Guava Seeds Powder.“ J. Food and Dairy Sci., Mansoura 10 no. 5, 147-152. 10.21608/jfds.2019.43132.
- Cholesterol-lowering effects of barley dietary fibre in humans: Scientific support for a generic health claim. Scand. J. Food Nutr.. 2006;50(4):173-176.
- [CrossRef] [Google Scholar]
- AOAC, 2000. Official Methods of Analysis. Association of Official Analytical Chemist., EUA.
- Aoe, S., Ichinose, Y., Kohyama, N., Komae, k., Takahashi, A., Abe, D., Yoshioka, T. and Yanagisawa, T., 2017. Effects of High Β-Glucan Barley on Visceral Fat Obesity in Japanese Individuals: A Randomized, Double-Blind Study. Nutrition 42, 1-6. 10.1016/j.nut.2017.05.002.
- Anti-obesity effect of aqueous fruit extract of Carica Papaya L. in rats fed on high fat cafeteria diet. Int. J. Pharm. Pharm. Sci.. 2012;4:327-330.
- [Google Scholar]
- Dietary conjugated linoleic acid reduces rat adipose tissue cell size rather than cell number. J. Nutr.. 2000;130(6):1548-1554.
- [CrossRef] [Google Scholar]
- Barley for food: Characteristics, improvement and renewed interest. Crit. Rev. Cereal Sci.. 2008;30:1-10.
- [CrossRef] [Google Scholar]
- Banchroft, J.D., Stevens, A. and Turner, D.R., 1996. Theory and practice of Histological technique. Fourth Ed. Churchil livingstone, New York, London, San Francisco, Tokyo. 10.1111/j.1365-2559.1990.tb00755.x.
- Bartels, H. and Bohmer, M., 1971. Creatinine Standard and Measurements of Serum Creatinine with Picric Acid. Clin. Chem. Acta, 31-81. https://www.researchgate.net/deref/http%3A%2F%2Fdx.doi.org%2F10.3136%2Ffstr.16.571.
- Dietary intake of whole and refined grain breakfast cereals and weight gain in men. Obes. Res.. 2005;13(11):1952-1960.
- [CrossRef] [Google Scholar]
- Lipids significantly reduced by diets containing barley in moderately hypercholesterolemic men. J. Am. Coll. Nutr.. 2004;23(1):55-62.
- [CrossRef] [Google Scholar]
- A colorimetric method of determination of serum gluatamic oxaloacetic and glutamic pyruvic transaminase. Clin. Biochem. Toronto. 1986;24–28
- [CrossRef] [Google Scholar]
- Utilisation glucagel in the Β-glucan enrichment of breads: A physicochemical and nutritional evaluation. Food Res. Int. (Ottawa, Ont.). 2007;40(2):291-296.
- [CrossRef] [Google Scholar]
- High (1→3,1→4)-Β-glucan barley fractions in bread making and their effects on human glycemic response. J. Cereal Sci.. 2002;36(1):59-66.
- [CrossRef] [Google Scholar]
- Evaluation of protein in foods: 1. A method for the determination of protein efficiency ratios. Can. J. Biochem. Physiol.. 1959;37(5):679-686.
- [CrossRef] [Google Scholar]
- Role of gastrointestinal motility in the delay of absorption by dietary fibre. Eur. J. Clin. Nutr.. 1995;49(Suppl 3):S74-S80.
- [Google Scholar]
- Consumption of barley beta-glucan ameliorates fatty liver and insulin resistance in mice fed a high-fat diet. Mol. Nutr. Food Res.. 2010;54(7):1004-1013.
- [CrossRef] [Google Scholar]
- Enzymic susceptibility of starch from pasta. J. Cereal Sci.. 1990;11:59-70.
- [CrossRef] [Google Scholar]
- The addition of locust bean gum but not water delayed the gastric emptying rate of a nutrient semisolid meal in healthy subjects. BMC Gastroenterol.. 2003;3(1):12.
- [Google Scholar]
- Independent influences of body mass and gastric volumes on satiation in humans. Gastroenterology. 2004;126(2):432-440.
- [CrossRef] [Google Scholar]
- Viscosity as related to dietary fiber: A review. Crit. Rev. Food Sci. Nutr.. 2006;46:649-663.
- [Google Scholar]
- Evaluation of maize-soybean flour blends for sour maize bread production in Nigeria. Afr. J. Biotech.. 2005;4:911-918.
- [Google Scholar]
- Efficiency of barley bran and oat bran in ameliorating blood lipid profile and the adverse histological changes in hypercholesterolemic male rats. Biomed. Res. Int. 2013263594
- [CrossRef] [Google Scholar]
- Evaluation of some biological parameters of Opuntia Ficus Indica. 1. Influence of a seed oil supplemented diet on rats. Bioresour. Technol.. 2006;97(12):1382-1386.
- [CrossRef] [Google Scholar]
- Effect of barley flour on quality of balady bread. Int. J. Food Prop.. 2006;9(1):39-49.
- [CrossRef] [Google Scholar]
- FDA. , 2005. Food Labelling: Soluble Dietary Fibre from Certain Foods and Coronary Heart Disease. Federal Register 70, 76150-76162. https://www.govinfo.gov/app/details/FR-2005-12-23/05-24387.
- FDA., 2006. Food Labeling: Health Claims; Soluble Dietary Fiber from Certain Foods and Coronary Heart Disease. Final Rule. Fed Regist 71, no. 98, 29248-50. https://pubmed.ncbi.nlm.nih.gov/16749215/.
- Prevalence and trends in obesity among Us adults, 1999–2008. J. Am. Med. Assoc.. 2010;303(3):235-241.
- [CrossRef] [Google Scholar]
- Fleming, S., 2001. Liver Disease and Laboratory Medicine. I. Mcfarlane, A. Bomford, and R. Sherwood. London: Acb Venture Publications, 2000. Clinical Chemistry 47, 358-358. 10.1093/clinchem/47.2.358.
- Foley, J. A., Defries, R., Asner, G. P., Barford, C., Bonan, G., Carpenter, S. R., Chapin, F. S. , Coe, M. T., Daily, G. C., Gibbs, H. K., Helkowski, J. H., Holloway, T., Howard, E. A., Kucharik, C. J., Monfreda, C., Patz, J. A., Prentice, I. C., Ramankutty, N.and Snyder, P. K., 2005. Global Consequences of Land Use. Science 309, no. 5734, 570-4. https://www.researchgate.net/deref/http%3A%2F%2Fdx.doi.org%2F10.1126%2Fscience.1111772.
- Estimation of the concentration of low density lipoprotein cholesterol in plasma without use of preparative ultracentrifuge. Clin. Chem. 1972;18:499-509.
- [Google Scholar]
- The nutrition transition in Egypt: Obesity, undernutrition and the food consumption context. Public Health Nutr.. 2002;5(1a):141-148.
- [Google Scholar]
- Wheat Bread quality as influenced by the substitution of waxy and regular barley flours in their native and extruded forms. J. Cereal Sci.. 2002;36(2):219-237.
- [CrossRef] [Google Scholar]
- Comparison study between the effect of oat and barley breads on serum glucose and lipid profiles in dyslipidemic and type 2 diabetic subjects: A short-term trial effects of whole grains on coronary heart disease risk. Mediterranean J. Nutr. Metabol.. 2012;5
- [Google Scholar]
- Impact of dietary polyphenols on carbohydrate metabolism. Int. J. Mol. Sci.. 2010;11(4):1365-1402.
- [CrossRef] [Google Scholar]
- Flavanol and bound phenolic acid contents in different barley varieties. J. Agric. Food Chem.. 2006;54(6):2253-2260.
- [CrossRef] [Google Scholar]
- Effect of wheat flour supplemented with barely and/or corn flour on balady bread quality. Polish J. Food Nutr. Sci.. 2013;63:11-18.
- [Google Scholar]
- Whole-grain intake may reduce the risk of ischemic heart disease death in postmenopausal women: The Iowa Women's Health Study. Am. J. Clin. Nutr.. 1998;68(2):248-257.
- [CrossRef] [Google Scholar]
- Effect of dietary barley Β-glucan on cholesterol and lipoprotein fractions in rat. J. Cereal Sci.. 2000;31(2):141-145.
- [CrossRef] [Google Scholar]
- High-fiber diet in the treatment of obesity and hypercholesterolemia. J. Natl. Med. Assoc.. 1993;85(3):231-232.
- [Google Scholar]
- The effects of concentrated barley beta-glucan on blood lipids in a population of hypercholesterolaemic men and women. Br. J. Nutr.. 2007;97(6):1162-1168.
- [CrossRef] [Google Scholar]
- Influence of malt on rheological and baking properties of wheat-cassava composite flours. LWT-Food Sci. Technol.. 2000;33:159-164.
- [CrossRef] [Google Scholar]
- Prevalence and functional correlates of obesity in an Egyptian Village. Ecol. Food Nutr.. 1996;34(4):311-325.
- [CrossRef] [Google Scholar]
- Changes in whole-grain, bran, and cereal fiber consumption in relation to 8-Y weight gain among men. Am. J. Clin. Nutr.. 2004;80(5):1237-1245.
- [Google Scholar]
- Lattanzio, V., Lattanzino, V. M. T. and Cardinali, A., 2006. Role of Phenolics in the Resistance Mechanisms of Plants against Fungal Pathogens and Insects. 661, 23-67. https://www.researchgate.net/publication/303270594_.
- Long-term effects of high dietary fiber intake on glucose tolerance and lipid metabolism in Gk rats: Comparison among barley, rice, and cornstarch. Metabolism. 2003;52(9):1206-1210.
- [CrossRef] [Google Scholar]
- Potential synergy of phytochemicals in cancer prevention: Mechanism of action. J. Nutr.. 2004;134(12):3479S-3485S.
- [CrossRef] [Google Scholar]
- Cholestrol determination in high density lipoproteins separated by three different method. Clin. Chem.. 1977;23(5):882-891.
- [Google Scholar]
- Maraia, F., Elmhdwi and El Aali, N., 2017. Prophylactic and Curative Effects of Barley and Its Bran against Hyperlipidemia in Albino Rats Int. Immunopharmacology and Immunotoxicology 2, 20-32. https://www.researchgate.net/publication/336955912_.
- Mechanism of serum cholesterol reduction by oat bran. Hepatology. 1994;20(6):1450-1457.
- [CrossRef] [Google Scholar]
- Marshall, T.R., 1992. Standard Methods for the Examination of Dairy Products. American Public Health Association, Washington, DC. https://agris.fao.org/agrissearch/search.do?recordID=US19950104912.
- Whole-grain intake is favorably associated with metabolic risk factors for type 2 diabetes and cardiovascular disease in the framingham offspring study. Am. J. Clin. Nutr.. 2002;76(2):390-398.
- [CrossRef] [Google Scholar]
- Baking performance and consumer acceptability of raw and extruded cowpea flour breads. J. Food Qual.. 2004;27:337-351.
- [CrossRef] [Google Scholar]
- Plant defense against herbivores: Chemical aspects. Annu. Rev. Plant Biol.. 2012;63(1):431-450.
- [CrossRef] [Google Scholar]
- Supplementation of a high-fat diet with chlorogenic acid is associated with insulin resistance and hepatic lipid accumulation in mice. J. Agric. Food Chem.. 2013;61(18):4371-4378.
- [CrossRef] [Google Scholar]
- Dietary patterns and changes in body mass index and waist circumference in adults. Am. J. Clin. Nutr.. 2003;77(6):1417-1425.
- [CrossRef] [Google Scholar]
- On the mechanism for Ppar agonists to enhance Abca1 gene expression. Atherosclerosis. 2009;205(2):413-419.
- [CrossRef] [Google Scholar]
- Quality characteristics of bread produced from composite flours of wheat, plantain and soybeans. Afr. J. Biotech.. 2006;5:1102-1106.
- [Google Scholar]
- Effect of baking temperatures on the proximate composition, amino acids and protein quality of de-oiled bottle gourd (Lagenaria Siceraria) seed cake fortified biscuit. LWT Food Sci. Technol.. 2019;106:247-253.
- [CrossRef] [Google Scholar]
- Cholesterol diet-induced hyperlipidemia influences gene expression pattern of rat hearts: A DNA microarray study. FEBS Lett.. 2004;562(1):99-104.
- [CrossRef] [Google Scholar]
- Dose response to soluble fiber in barley in lowering blood lipids in hamster. Plant Foods Hum. Nutr. (Dordrecht, Netherlands). 1998;52:329-336.
- [CrossRef] [Google Scholar]
- Study on microbial profile of bread during storage. Int. J. Adv. Res. Biol. Sci.. 2016;3(9):60-63.
- [Google Scholar]
- Schermer, S., 1967. The Blood Morphology of Laboratory Animal Longmans, Printed in Great Britain, Green and CO.LTD., P. 350.
- Schweizer, T.F. and Wu¨rsch, P., 1991. The Physiological and Nutritional Importance of Dietary Fiber.“ Experientia, 47:181. 10.1007/bf01945423.
- Shaban, N. M., 2006. Chemical And Technological Studies On Some Products Produced From Barley, M. Sc. Thesis, Nutrition and Food Science,Faculty of Home Economics , Minufiya University, Cairo, Egypt.
- The effects of purslane and celery on hypercholesterolemic mice. World J. Dairy Food Sci.. 2012;7(2):212-221.
- [Google Scholar]
- Assessing kidney function — Measured and estimated glomerular filtration rate. N. Engl. J. Med.. 2006;354(23):2473-2483.
- [CrossRef] [Google Scholar]
- Apple pomace as a source of dietary fiber and polyphenols and its effect on the rheological characteristics and cake making. Food Chem.. 2007;104(2):686-692.
- [CrossRef] [Google Scholar]
- The increasing use of barley and barley by-products in the production of healthier baked goods. Trends Food Sci. Technol.. 2013;29:124-134.
- [CrossRef] [Google Scholar]
- Tabacco, A., Searcy, R.L. and Reardon, J.E., 1979. Standard Methods of Clinical Chemistry. Edited Selig Son, D. Clin. Chem., 25-336.
- Trinder, P., 1969. Enzymatic colometric method for determination of glucose. Ann. Clin. Bioch. 6: pp24. 10.1177%2F000456326900600108.
- Pomegranate and its many functional components as related to human health: A review. Compr. Rev. Food Sci. Food Saf.. 2010;9(6):635-654.
- [CrossRef] [Google Scholar]
- Effect of dose and modification of viscous properties of oat gum on plasma glucose and insulin following an oral glucose load. Br. J. Nutr.. 1994;72(5):731-743.
- [CrossRef] [Google Scholar]
- Wood, P.J., 1984. Physiochemical properties and technological and nutritional significance of cereal beta-glucan. In Cereal polysaccharide in technology and nutrition, (V.F.Rasper, ed.), AAAC the Association, St Paul, M.N., PP 45-68. https://agris.fao.org/agris-search/search.do?recordID=US8605495.
- Hypocholesterolaemic effect of whole-grain highland hull-less barley in rats fed a high-fat diet. Br. J. Nutr.. 2018;119(10):1102-1110.
- [CrossRef] [Google Scholar]
- Corn- wheat pan bread quality as affected by hydrocolloids. J. Amer. Sci.. 2010;6(10):684-690.
- [Google Scholar]


