

Translate this page into:
Effects of stratified mining on the low-temperature oxidation and physicochemical properties of lower coal layers
⁎Corresponding author at: College of Safety Science and Engineering, Liaoning Technical University, Liaoning 123000, China. djhu0418@gmail.com (Dongjie Hu)
-
Received: ,
Accepted: ,
This article was originally published by Elsevier and was migrated to Scientific Scholar after the change of Publisher.
Peer review under responsibility of King Saud University. Production and hosting by Elsevier.
Abstract
To investigate the impact of stratified mining on the spontaneous combustion characteristics of lower coal in thick coal seams, an analysis was conducted on the macro pore structure, temperature rise, oxygen consumption characteristics, chemical structure, surface chemical properties, and functional group distribution of the upper and lower stratified coal samples (LSC, LSR) from the LinSheng Mine 1202 re-mining face. Post re-mining, the specific surface area, average pore diameter for adsorption, micropore volume, and mesopore volume of LSR showed a significant increase compared to LSC. The maximum mass loss rate for LSR was approximately three times that of LSC, and the characteristic temperature of LSR was lower. When the volumetric fraction of oxygen exceeded 12%, the oxygen consumption rate and CO generation rate of LSR surpassed those of LSC. The alkyl carbon content in LSR was 2% lower compared to LSC, while the oxygenated carbon content was higher by 4.37%. The oxygen content in LSR and the O/C ratio were higher than those in LSC. The structural order of LSR was lower by 11.3%, and the oxygen-containing functional groups were higher by 1.15%. These findings suggest that stratified mining increases the spontaneous combustion risk of lower coal layers. This study underscores the need for careful consideration of mining strategies to mitigate potential risks.
Keywords
Stratified Mining
Spontaneous Combustion of Coal
Macro Pore Structure
Oxidation Characteristics
Micro Chemical Structure

1 Introduction
Coal has consistently been a critical component in the global energy supply. However, fires instigated by coal spontaneous combustion (CSC) have emerged as a significant issue for both miners and environmentalists worldwide (Inyang et al., 2010; Zolotukhin et al., 2017; Fatkulina et al., 2021). In the context of mining thick coal seams, a prevalent strategy to augment coal recovery entails dividing the entire thick coal seam into several smaller layers, each with a mining height of 2–3 m, and subsequently mining them in sequence. This practice primarily stems from pressure changes during the mining of the upper coal layer, leading to rupture and an increased distribution of fissures in the lower coal layer (Ju, 2009; Wang et al., 2021). Furthermore, modifications in ventilation can enhance the penetration of oxygen into the lower coal strata, thereby triggering initial oxidation in specific segments of the coal (Yang et al., 2022). When the lower layer, already subjected to initial oxidation, is exposed to oxygen during secondary mining, secondary oxidation ensues (Zhang et al., 2016). Consequently, the study of the altered oxidation process of the lower coal layer, inclusive of its macrophysical structure, spontaneous combustion characteristics, and microchemical properties, is of paramount importance in the prevention and control of spontaneous combustion hazards during the stratified mining of thick coal seams.
Numerous scientists have utilized thermogravimetric (Liu et al., 2011; Yu et al., 2009; Zhang et al., 2008) and temperature-regulated experiments (Chang et al., ,2012; Liu et al., 2013; Xu et al., 1999) to explore the macro-level self-combustion properties of coal, yielding significant progress. In his study, Wang (Wang et al., 2023) examined the kinetic features of spontaneous combustion, emphasizing that the pre-oxidation duration impacts the rate of CO production from coal during secondary oxidation. It was apparent that the parameters characterizing spontaneous combustion and the apparent activation energy of coal in the secondary oxidation phase possess phase-specific properties. Zhao (Zhao et al., 2023) compared the combustion scenarios of fresh coal and weathered coal samples under varying heating speeds, discovering that fresh coal samples burn more intensely than weathered coal samples, with the latter being more susceptible to thermal decomposition and reaction in the early combustion stage. Liu (Liu et al., 2023) posited that an increase in oxygen content accelerates the rate of oxygen consumption in coal samples and heightens heat discharge. In Wang’s (Wang et al., 2018) research, it was observed that during the initial stage of the coal-oxygen recombination reaction, pre-oxidation favorably influences the coal self-ignition attributes. However, as the coal-oxygen oxidation reaction progresses, the effect of pre-oxidation appears to diminish. Deng (Deng et al., 2014) found that in the early stage of oxidation, the oxygen consumption rate, CO generation rate, and heat release intensity of secondary oxidation coal samples are all higher than those of primary oxidation coal samples. However, in the later stage of oxidation, the situation is reversed.
In the study of the microchemical characteristics of coal, experimental methods such as FT-IR (Zha et al., 2022; Fredericks et al., 1985), XPS (Jing et al., 2019; Ping et al., 2020), EPR, and XRD (Tzvetkov et al., 2016; Liu et al., 2017; Winburn et al., 2000) are often employed. Deng (Deng et al., 2016) demonstrated that the carbon content of the secondary oxidized coal sample decreased, while the oxygen content, specific surface area, and porosity increased. In the latter stages of the reaction, there was a considerable consumption and regeneration of active functional groups. Liang (Liang et al., 2015) discovered that after the initial oxidation, there was a noticeable increase in coal’s porosity and its oxygen absorption capability, along with a surge in active oxygen-containing functional groups and changes in the coal’s molecular structure. Xu (Xu et al., 2021; Xu et al., 2021) identified that throughout the secondary oxidation process, the –OH group undergoes rapid consumption with the low-rank coal transitioning into a stable fatty chain structure. The consumption of the -C = O group emerged as the dominant factor, while the -C-O- group primarily facilitated the secondary oxidation. Wang (Wang et al., 2023) demonstrated that the quantities of –OH, -C = O, and -C = C- groups progressively rise with the extension of pre-oxidation duration. The pre-oxidized coal’s aromatic structure exhibits a higher susceptibility to oxidation.
The spontaneous combustion traits and underlying mechanisms of coal samples, as examined from macroscopic or microscopic perspectives, have been extensively acknowledged in prior research (Cheng and Lei, 2021). However, the specific impact of extracting the upper coal on the lower coal during stratified mining remains relatively unclear. For thick coal seam stratified mining, it is imperative to investigate the impact of the upper-coal mining on the lower coal from both macroscopic and microscopic perspectives. In this study, we employed a variety of experiments, such as low-temperature N2 adsorption experiments (Wang et al., 2020), simultaneous thermal analysis experiments, closed oxygen consumption characteristic tests, 13C NMR (Wemmer et al., 1981; Song et al., 1993), XPS, and FT-IR. These were used to explore the differences in macroscopic pore structure, characteristic temperature differences during oxidation and spontaneous combustion, oxygen consumption characteristics, CO release features, microscopic chemical structures, surface chemical properties, and functional group distribution of two bituminous coal samples (LSC, LSR) from the upper and lower strata of the LinSheng Mine 1202 re-mining working face. Here, re-mining refers to the process of mining the lower coal layer after the completion of mining the upper coal layer in stratified mining. The study also analyzed the causes of the differences in the spontaneous combustion ability of the two coal samples from various perspectives. The lower coal layer exhibits a more developed pore structure, facilitating increased oxygen contact. This results in a lower ignition temperature, higher heat release, and faster oxidation rate. Additionally, there is an elevated oxygen content in the chemical structure, indicating lower stability. This research can provide more theoretical support and practical guidance for the safe management and environmental protection of mines in thick coal seam stratified mining.
2 Experiments research method
2.1 Industrial analysis and elemental analysis
Coal samples of LSR and LSC were collected, crushed, and sieved to obtain a particle size of 200 mesh, and subsequently, they were vacuum-sealed for preservation. The coal samples underwent an industrial analysis in compliance with the Chinese National Standard GB/T212-2008, using a 5E-MAG6600B industrial analyzer manufactured by Jinan Huamei Mining Equipment Co., Ltd., China. The elemental analysis was carried out in accordance with GB/T 31391–2015, employing a Vario EL elemental analyzer produced by Elementar Group, Germany. Table 1 discloses the results garnered from the industrial and elemental analyses of the coal samples. The calculated atomic ratio findings are exhibited in Table 2.
Coal sample
Proximate analysis (%)
Elemental analysis (%)
Moisture
Ash
Volatile
Fixed carbon
C
H
O
N
S
LSR
0.71
3.50
29.85
65.94
83.50
4.65
8.43
1.14
2.27
LSC
0.73
4.34
25.16
69.77
84.43
4.73
7.37
1.40
1.81
Coal sample
H/C
O/C
N/C
S/C
LSR
0.6683
0.0757
0.0117
0.0102
LSC
0.6723
0.0655
0.0142
0.0080
The disparity in elemental content between the two coal samples is marginal, with a difference of less than 1 %. As indicated by the industrial analysis in Table 1, the volatile matter content of coal sample LSR is 29.85 %, which is higher than that of LSC at 25.14 %. Concurrently, both sulfur and oxygen content are higher in LSR compared to LSC. The elevated volatile matter content implies that the coal will release more combustible gases upon heating. A higher sulfur and oxygen content could potentially augment the autoignition propensity of the coal (Genetti et al., 1999; Kaymakçi and Didari, 2002; Onifade and Genc, 2020). Conversely, a higher nitrogen content may aid in suppressing the spontaneous combustion of the coal.
2.2 Determination of low temperature liquid nitrogen adsorption
The pore structure parameters of the sample were ascertained using the ASAP 2460 Surface Area and Pore Size Analyzer, a product of Micromeritics Instrument Corp., USA. This instrument is capable of measuring pore diameters within the range of 1.7 to 400 nm. A nitrogen sorption technique was employed for this purpose. The sample was degassed post-drying to eliminate impurities, followed by measurement to obtain relevant parameters pertaining to the pore structure. The Brunauer–Emmett–Teller (BET) theory model was utilized to calculate the specific surface area of the pores, while the Barrett-Joyner-Halenda (BJH) theory model was used to calculate the pore volume (Chang et al., ,2012; Liu et al., 2013).
2.3 Synchronous thermal analysis experiment
The synchronous thermal analysis experiments were conducted using a STA 449F5-QMS 403D synchronous thermal analyzer, a product of NETZSCH, Germany. Each experiment utilized a coal sample with a mass of 10 mg. The temperature range for program control during the experiment was set between 30 and 800 °C. The rate of program-controlled temperature increase was set at 10 °C·min−1. The total flow rate of the introduced gas environment was 50 mL·min−1, with a gas ratio of N2:O2 = 4:1.
2.4 Closed oxygen consumption test of coal sample
The experimental setup, designed by Professor Li Zongxiang from Liaoning University of Technology (Li et al., 2017), primarily consists of several interconnected components, as follows: 1- Computer, 2-Air pump, 3-Gas concentration sensor, 4-Data collector, 5-Flow meter, 6-Condensation tube, 7- Water collection bottle, 8-Drying tube, 9-Preheating pipeline, 10- Coal sample can, 11-Constant temperature box. As depicted in Fig. 1, the internal pipeline of the apparatus is interconnected, with the pressure inside the coal sample can being maintained at standard atmospheric pressure.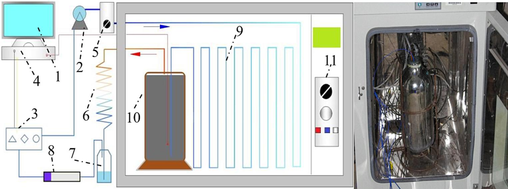
Schematic of sealed oxygen consumption experimental device.
The coal samples collected from the field were transported to the laboratory in sealed packages and subsequently stored at low temperatures to inhibit oxidation. For each experimental group, large pieces of unprocessed coal were broken down, and 2 kg of coal particles, sized between 0.4 and 2.4 mm, were selected for experimental use.
The experimental preparation steps encompass the placement of the air intake tube and temperature sensor within a canister filled with coal samples, which is subsequently sealed securely. Prior to the initiation of the experiment, the coal samples undergo an air purge for a specified duration to mitigate the influence of any extraneous gases present within the canister. The thermostatic chamber is operated until it consistently maintains a temperature of 25 °C, a value determined based on the working conditions at the coal sample’s site. Subsequently, the data collection software is activated to record the concentrations of O2 and CO. Throughout the experiment, the temperature control system adjusts the temperature of the coal mass. The experiment is considered complete upon the stabilization of the data curve. To minimize experimental errors, all operations performed on the two coal samples should be as consistent as possible, including the selection of coal particle size, the consistency of particle size distribution, the experimental temperature, and the frequency of data collection.
2.5 X-ray photoelectron spectroscopy test
The X-ray photoelectron spectroscopy (XPS) testing of two coal samples was conducted using the ESCALAB Xi + X-ray photoelectron spectrometer, manufactured by Thermo Fisher Scientific in the United States. The analysis chamber maintained a vacuum level of 8 × 10⁻¹⁰ Pa. The excitation source was Al Ka radiation (hv = 1486.6 eV), and signal accumulation was performed over ten cycles. The full spectrum (passing-energy) was set at 100 eV for the test, with a narrow spectrum at 30 eV, a step size of 0.05 eV, and a dwell time of 40 ∼ 50 ms. The XPS data were processed by Avantage software for peak fitting. Charge correction was performed using the C 1 s binding energy of 284.80 eV as the energy standard.
2.6 13C NMR test
The carbon spectrum analysis was conducted in accordance with the SY/T 5777–1995 standard using a high-precision Bruker 400 MHz nuclear magnetic resonance spectrometer, manufactured in Switzerland. Utilizing a high-resolution double-resonance MAS probe with a diameter of 4.0 mm, the rotor operated at a speed of 10 kHz, pulse width of 4 µs, pulse delay time of 1 s, and contact time of 2 ms. A total of 10,000 scans were conducted to obtain carbon atomic information from the coal sample.
2.7 Fourier transform infrared spectroscopy test
Fourier Transform Infrared Spectroscopy (FT-IR) analysis was conducted using the Nicolet iS10 FT-IR spectrometer, manufactured by Thermo Fisher Scientific Inc., United States. The FT-IR spectrometer has a resolution of 0.5–1 cm−1, and the scanning wave number range is between 4000 and 400 cm−1. The coal was thoroughly ground and mixed with KBr at a ratio of 1:200. The instrument performed 32 scans, utilizing KBr pellets. In peakfit software, the Gaussian method is used for peak fitting processing.
3 Results and discussion
3.1 Macroscopic structure and oxidation characteristics
3.1.1 Aperture distribution characteristics
Micropores, possessing a large specific surface area, provide an abundance of adsorption and catalytic activity sites. They serve as the primary locations for the initial reactions of coal low-temperature oxidation. Mesopores function as channels for oxygen infiltration into the coal matrix (Schure et al., 1985; Okolo et al., 2015). Fig. 2 illustrates the distribution of low-temperature N2 adsorption test results for the two coal samples. The pore diameter distribution of micropores (Fig. 2c) and mesopores (Fig. 2d) indicates that the LSR curve is higher than that of the LSC coal sample. Table 3 presents the pore structure parameters of the coal samples obtained through low-temperature N2 adsorption. The specific surface area, adsorption average pore diameter, Horvath-Kawazoe (HK) micropore volume, and BJH mesopore volume of LSR increased by approximately 19.5 %, 57.0 %, 118.4 %, and 75.0 % respectively compared to LSC after re-mining.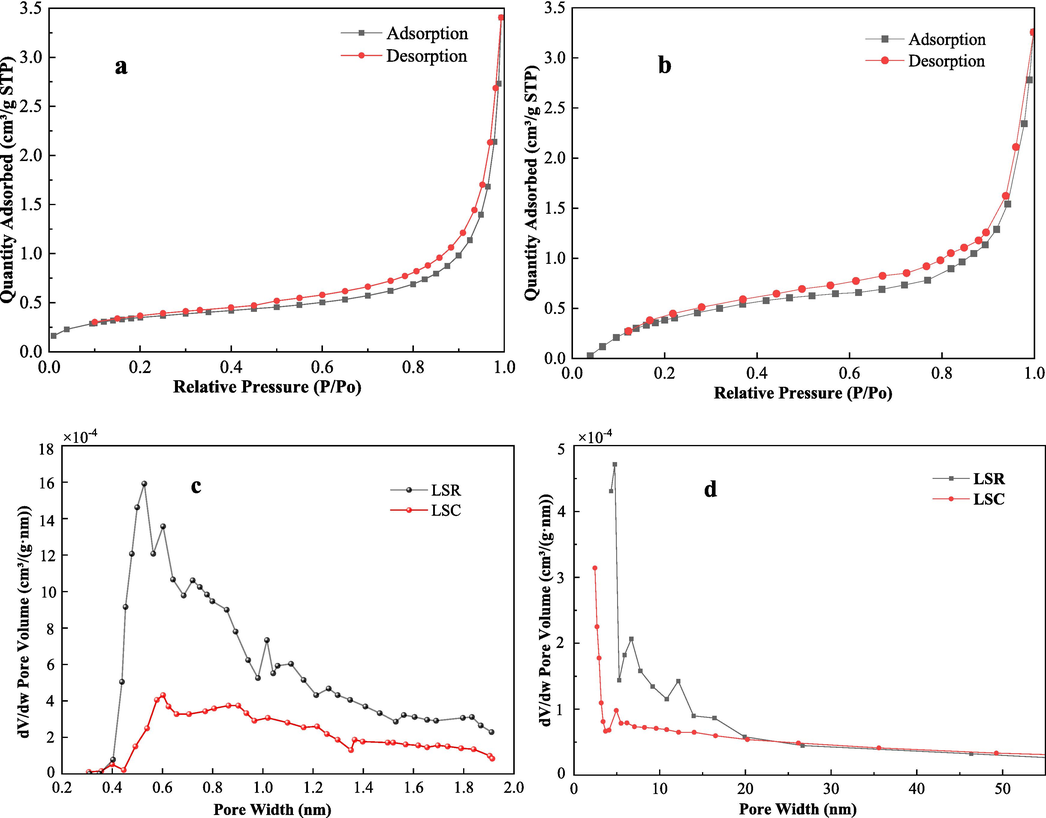
Results of low temperature liquid nitrogen adsorption test (a – LSR, b-LSC, c- microhole aperture distribution, d- mesopore aperture distribution).
Coal sample
BET Surface Area/
m2·g−1
Adsorption average pore diameter/ nm
HK microhole aperture distribution / 10-3·cm3·g−1
BJH mesopore aperture distribution / 10-3·cm3·g−1
LSR
1.915
16.446
9.355
5.822
LSC
1.281
10.475
4.283
3.326
The increase in specific surface area, average adsorption pore diameter, and cumulative desorption pore volume of coal samples after secondary mining indicates that the pore structure of coal samples influenced by mining stress has become more developed, providing more adsorption sites and reaction surfaces. The contact area of LSR, its adsorption capacity for combustible materials, and the storage capacity of combustible materials in coal all have increased. These changes promote the adsorption, storage, and reaction of combustible materials in coal, having a positive impact on the spontaneous combustion of coal.
3.1.2 Experimental results of synchronous thermal analysis
Based on the Thermogravimetric (TG) curve, the process of CSC can be divided into five stages (Zhang et al., 2008): T0-T1, T1-T2, T2-T3, T3-T5, as shown in Fig. 3. The difference in the area values obtained by integrating the DSC curve in Fig. 3 is relatively small, indicating that the total amount of heat released by the two coal samples is nearly the same throughout the experimental process. However, the peak value of the DTG curve for coal sample LSR is approximately −12 %·℃-1, while for coal sample LSC it is around −4%·℃-1. This suggests that in the heating process, the rate of weight loss for LSR is higher than that for LSC.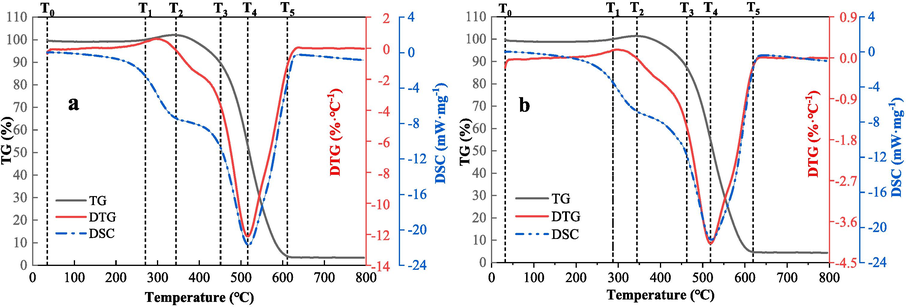
TG-DTG&DSC curves of coal samples (a-LSR, b-LSC).
The DSC curve reflects the heat released during the experimental process, with the peak size indicating the exothermic degree of the coal. A larger peak area in the DSC curve of the LSR coal sample suggests a more intense exothermic reaction. This implies that, during the heating process, coal sample LSR releases a higher amount of heat before reaching the temperature T4, where the rate of weight loss is at its maximum, resulting in faster weight loss. Therefore, this indicates that coal sample LSR is more prone to spontaneous combustion during the low-temperature oxidation of coal (Zhao et al., 2023; Niu et al., 2023). Table 4 presents the characteristic temperatures of the two coal samples from the thermogravimetric experiments.
Coal sample
T0
T1
T2
T3
T4
T5
LSR
32.00
270.42
343.87
450.80
515.96
611.19
LSC
32.00
287.17
344.00
462.19
518.34
619.74
Data in Table 4 shows that the cracking, maximum mass, ignition, maximum weight loss rate, and burnout temperatures are always higher for LSC than LSR samples. The pyrolysis temperature indicates the temperature at which the coal sample begins to undergo pyrolysis reaction. A lower pyrolysis temperature T1 signifies that the coal sample starts to generate combustible gases at a lower temperature. The ignition temperature T3 represents the temperature at which the coal sample begins autoignition, i.e., it can sustain combustion autonomously. A lower ignition temperature means that the coal sample is more prone to spontaneous combustion, which is often used to evaluate the autoignition characteristics of the coal sample (Deng et al., 2014). Data from the simultaneous thermal analysis experiment show that LSR is more prone to autoignition than LSC.
3.1.3 Results of closed oxygen consumption test
Fig. 4 presents the results of the closed oxygen consumption tests for two coal samples. From Fig. 4 (a) and (c), it can be inferred that: (1) The volume fraction of oxygen obtained from the closed oxygen consumption test exhibits an exponential decay distribution over time. There is a positive correlation between the volumetric oxygen consumption rate of the coal sample and the volume fraction of oxygen. (2) As the coal sample reacts with oxygen, the volume fraction of oxygen in the closed canister gradually stabilizes, with a stable value of approximately 10 %. The stable value for LSC is slightly higher than that for LSR. (3) The oxygen consumption rate of the LSR coal sample remains higher than that of LSC for approximately the first 1500 min of the experiment (before the volume fraction of oxygen exceeds 11 %).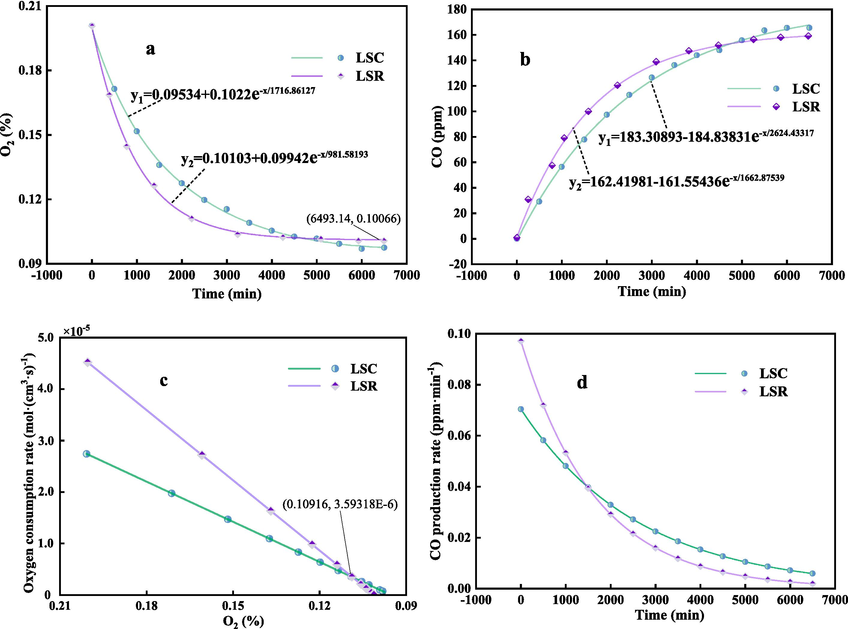
Results of closed oxygen consumption test (a is oxygen decay curve, b is CO generation change curve, c is oxygen consumption rate curve of coal sample under different oxygen volume fraction, d is CO generation rate change curve).
From Fig. 4 (b) and (d), it can be deduced that: (1) Coal oxidation begins to produce CO gas. Unlike the ventilation test, the amount of gas produced in the closed test continues to accumulate and is less disturbed by the ventilation airflow. The gas detection device can detect even more minute quantities of CO. (2) The trend of CO production follows a negative exponential growth pattern, with the overall CO gas yield from the coal sample approximating 160 ppm. Moreover, the yield from LSC is higher than that from LSR. (3) In accordance with the volumetric oxygen consumption rate, the CO production rate of LSR was notably higher than LSC before 1500 min. The analysis of these findings suggests that the integrity of the coal in the lower stratum is compromised due to the impact of mining activities in the upper stratum, leading to an increase in fractures. Consequently, a portion of the coal in the lower stratum comes into contact with oxygen and undergoes initial oxidation. However, with the advancing working face of the upper stratum resulting in a gradual reduction of oxygen, the oxidation of the coal in contact with oxygen in the lower stratum is not complete. Upon mining of the lower stratum (i.e., secondary mining), this portion of coal is exposed to oxygen again, triggering secondary oxidation. In the sealed oxygen consumption test, although the total oxygen consumption and CO production of coal sample LSR are slightly lower than those of LSC, both the volumetric oxygen consumption rate and the CO production rate have increased. This is in line with the findings of references (Deng et al., 2014; Deng et al., 2016; Wang et al., 2018), suggesting that LSR is more susceptible to spontaneous combustion.
The algorithmic principle used to determine experimental parameters is elaborated as follows (Hu and Li, 2022). It is hypothesized that the volume fraction of oxygen concentration C(τ) in the sealed vessel adheres to the distribution of a negative exponential function:
where C0 is the initial volume fraction of oxygen, %;
λc is the decay rate of the oxygen volume fraction, s−1;
Cb is the stable oxygen volume fraction value, %;
τ is the oxidation time, s.
By differentiating Eq. (1) with respect to time τ, we can determine the rate of change in the mole mass of oxygen consumed per unit time and volume by the coal sample in the sealed vessel:
Where 44.64 is the amount of substance per unit volume, mol·m−3;
γ is the volumetric oxygen consumption rate, mol·(m3·s)−1.
From Eq. (3), the oxygen consumption rate and oxygen volume fraction of coal sample in the closed vessel are a one-time function. This correlation is evident for coal in a loosely packed state.
Hence, the constant for the volumetric rate of oxygen consumption in the coal sample vessel is derived when the oxygen volume fraction is C0:
where γ0 is the initial oxygen consumption rate constant, mol·(m3·s)−1.
3.2 Microscopic basic chemical information of coal sample
3.2.1 XPS test results
The C 1 s, N 1 s, O 1 s, and S 2p binding energies of LSR and LSC coal samples were fitted and shown in subfigures a, b, c, and d of Fig. 5 and Fig. 6. Fig. 7 shows the XPS total spectra of the two coal samples. The detailed binding energy assignments are summarized in Table 5. For LSR, the C 1 s binding energy region exhibits four peaks, which are attributed to C–C/C–H, C-O, C = O, and COO–. They account for 70.38 %, 3.71 %, 6.74 %, and 19.16 %, respectively. In the O 1 s binding energy spectrum of LSR, the primary form of oxygen atoms is C-O, accounting for 87.85 %, and C = O accounts for 12.15 %. The main forms of nitrogen atoms in LSR are pyrrole and pyridine, with a small amount of oxidized nitrogen, of which pyrrole accounts for 52.02 %. In the S 2p binding energy region of LSR, Thiophene accounts for 54.67 %.
XPS sub-peak fitting diagram of LSR (a is C 1 s, b is N 1 s, c is O 1 s, d is S 2p).
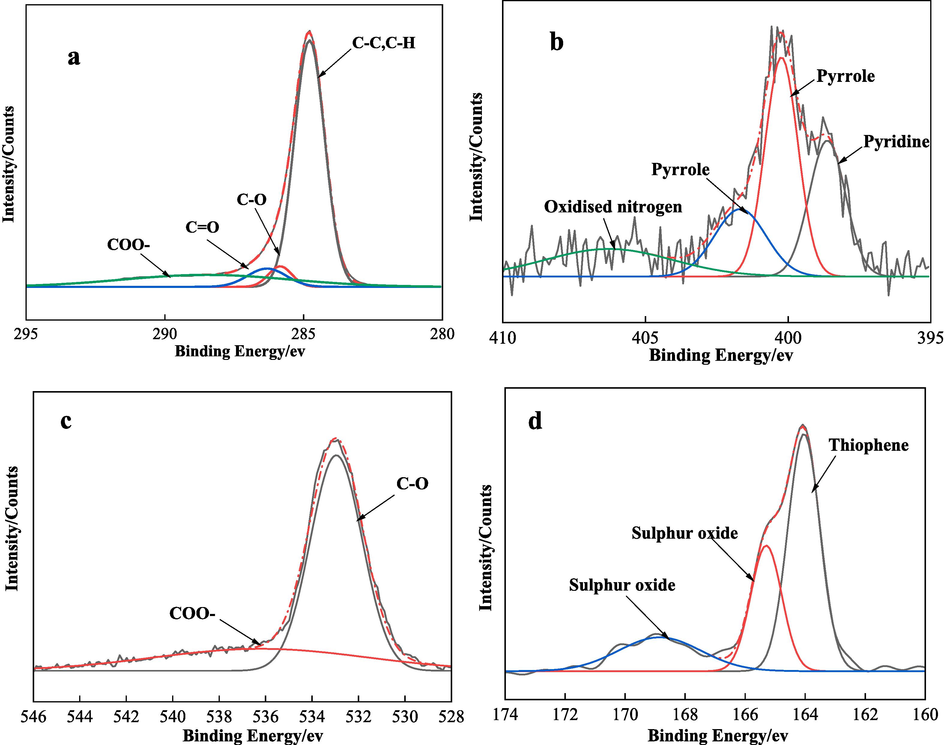
XPS peak fitting diagram of LSC (a is C 1 s, b is N 1 s, c is O 1 s, d is S 2p).
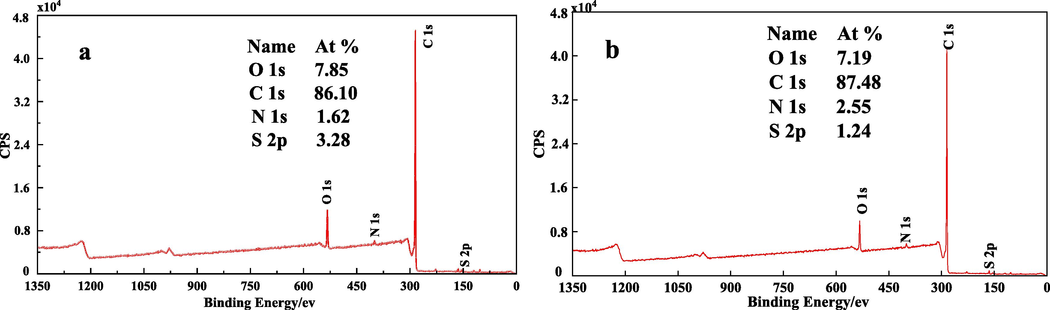
General XPS energy spectrum diagram of coal sample (a is LSR, b is LSC).
Figure
LSR
LSC
Attribution
Number
Peak position /eV
FWHM /eV
Area
Relative area /%
Peak position /eV
FWHM /eV
Area
Relative area /%
a/C 1 s
1
284.80
1.26
221360.00
70.38
284.80
1.29
203420.00
69.98
C–C/C–H
2
285.83
0.90
11675.86
3.71
285.86
1.00
13115.40
4.51
C-O
3
286.31
1.54
21203.8
6.74
286.34
1.64
19241.88
6.62
C = O
4
288.51
7.21
60273.08
19.16
288.51
7.15
54917.85
18.89
COO–
b/N 1 s
1
398.63
1.46
2092.34
20.09
398.64
1.50
2356.77
25.77
pyridine
2
400.22
1.38
2550.78
24.49
400.24
1.36
3457.85
37.81
pyrrole
3
400.80
2.54
2867.78
27.53
401.69
2.12
1657.36
18.12
pyrrole
4
405.85
5.79
2174.52
20.88
406.30
5.24
1672.19
18.29
oxidised nitrogen
5
396.33
1.68
731.08
7.02
–
–
–
–
metal nitrides
c/O 1 s
1
532.91
2.50
63342.96
87.85
532.97
2.64
48867.77
70.48
C-O
2
537.16
12.10
8763.61
12.15
536.22
10.86
20470.15
29.52
C = O
d/S 2p
1
164.07
1.22
2888.78
54.67
164.05
1.26
2820.24
53.35
thiophene
2
165.28
1.05
1343.91
25.43
165.31
1.22
1437.31
27.19
sulphur oxides
3
168.83
3.49
1051.29
19.90
168.86
3.24
1028.32
19.45
metal sulfate
Similar to LSR, the C 1 s binding energy region of LSC also exhibits four peaks, which are attributed to C–C/C–H, C-O, C = O, and COO–. They account for 69.98 %, 4.51 %, 6.62 %, and 18.89 %, respectively. In the O 1 s binding energy spectrum of LSC, the primary form of oxygen atoms is C-O, accounting for 70.48 %, and C = O accounts for 29.52 %. The main forms of nitrogen atoms in LSC are pyrrole and pyridine, with a small amount of oxidized nitrogen, of which pyrrole accounts for 55.93 %. In the S 2p binding energy region of LSC, Thiophene accounts for 53.35 %.
Analysis from the perspective of the strength and weakness of coal self-ignition ability: The oxygen content in coal has a significant impact on its auto-ignition tendency. A higher O/C ratio in coal samples indicates a higher content of oxides, which could make the coal more prone to oxidation, thereby leading to self-ignition (Bilgen and Kaygusuz, 2008; Lu et al., 2000).
As shown in Fig. 7, the O/C ratio of LSR, calculated to be approximately 0.091, is higher than that of LSC, which is 0.088. Moreover, oxygen-containing functional groups such as hydroxyl (–OH), carboxyl (–COOH), and ether (-O-) are more prone to oxidation, which could increase the auto-ignition tendency of coal. According to the XPS table, the total area of the peaks corresponding to the oxygen-containing functional groups in LSR, at 165259.31, is greater than that in LSC, at 156612.05. This suggests that LSR coal samples are more prone to self-ignition.
3.2.2 13C NMR test results
Fig. 8 depicts the 13C NMR spectra for two distinct coal samples, labeled as LSC and LSR.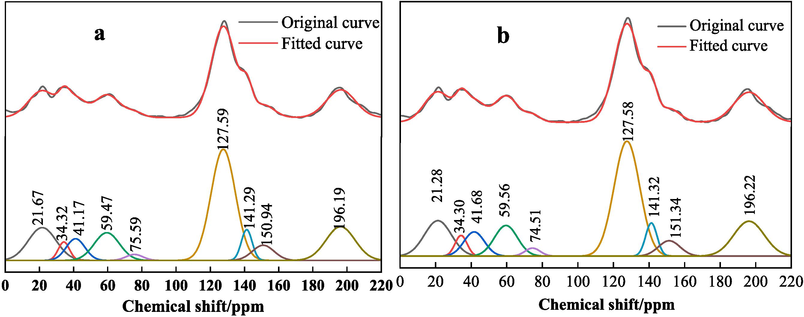
Comparison diagram of 13C NMR peak fitting of coal samples (a is LSR, b is LSC).
The chemical structures within the coal are categorized into four unique peaks, each representing a specific chemical shift range. These include: Peak one (0–60 ppm, corresponding to alkyl carbon groups), Peak two (60–90 ppm, associated with ether oxygen groups), Peak three (90–165 ppm, representing aromatic carbon groups), and Peak four (around 200 ppm, linked to carbonyl groups) (Chang et al., 2023; Alvarez et al., 1996). After identifying appropriate points for peak fitting, the NMR spectra were processed through Peakfit software, leading to the information compiled in Tables 6 and 7.
Number
Center
FWHM
Anlytc Area
% Area
Attribution
1
21.67
19.15
2.85 × 10⁹
13.72
Aryl methyl
2
34.32
7.72
6.44 × 10⁸
3.10
methylene
3
41.17
12.90
1.27 × 10⁹
6.12
Quaternary carbon, methylene carbon
4
59.47
17.24
2.16 × 10⁹
10.40
Oxygen to methyl and Oxygen to methylene carbon
5
75.59
11.63
3.14 × 10⁸
1.51
Oxygen bonded to quaternary carbon
6
127.59
16.76
8.54 × 10⁹
40.64
Protonated aryl carbon
7
141.29
7.40
1.23 × 10⁹
4.96
Collateral aryl carbon
8
150.94
14.92
1.12 × 10⁹
4.91
Oxygen to aryl carbon
9
196.19
19.91
3.04 × 10⁹
14.64
Carbonyl carbon
Number
Center/ppm
FWHM/ppm
Anlytc Area
% Area
Attribution
1
21.29
17.76
2.86 × 10⁹
13.13
Aryl methyl
2
34.30
7.95
7.47 × 10⁸
3.43
methylene
3
41.68
13.59
1.50 × 10⁹
6.86
Quaternary carbon, methylene carbon
4
59.56
15.21
2.12 × 10⁹
9.71
Oxygen to methyl and Oxygen to methylene carbon
5
74.51
10.06
3.67 × 10⁸
1.68
Oxygen bonded to quaternary carbon
6
127.58
16.97
8.86 × 10⁹
40.65
Protonated aryl carbon
7
141.32
7.56
1.14 × 10⁹
5.22
Collateral aryl carbon
8
151.34
14.27
1.00 × 10⁹
4.59
Oxygen to aryl carbon
9
196.22
20.25
3.21 × 10⁹
14.73
Carbonyl carbon
From the 13C NMR spectra and their peak fitting results of the coal samples obtained from the experiment, it can be seen that the number of peaks, peak positions, and peak intensities of the two coal samples are roughly the same. This indicates that the carbon chemical shifts in the two coal samples are basically the same, suggesting a close similarity in their molecular structures. Specifically, there are nine distinct peaks in the 13C NMR spectra of both coal samples, with the peaks of the greatest absorption intensity located at about 127 ppm, corresponding to protonated aromatic carbon. This suggests that the coal molecular structure of both samples is based on a protonated aromatic carbon framework. Following this are carbonyl carbon, aromatic methyl, ether-linked methyl, and ether-linked methylene carbon. Looking at the peak intensities, the contents of side-chain aromatic carbon and ether-linked tertiary carbon are comparable, and the content of tertiary carbon/methyl secondary carbon is about twice the content of methylene.
From the analysis of the strength of coal’s self-ignition ability, the content of aromatic carbon and alkyl carbon may affect the self-ignition ability of coal. Generally speaking, the higher the content of aromatic carbon and the lower the content of aromatic carbon alkyl carbon, the better the thermal stability of coal, and the weaker the self-ignition ability (Yuan et al., 2016; Jaromı́r, 2001). As shown in Fig. 8 and Tables 6 and 7, the aromatic carbon peak is at 90–165 ppm, the content of aromatic carbon in LSR accounts for 50.51 %, and the content of aromatic carbon in LSC coal samples accounts for 50.46 %, with a small difference. The content of alkyl carbon in LSR (with corresponding chemical shift at 0–50 ppm) at 22.94 % is less than that of LSC at 23.42 %. Therefore, it is difficult to judge the strength of the self-ignition ability from the perspective of aromatic carbon and alkyl carbon content. However, the content of oxygen-containing functional groups in LSR (with corresponding chemical shift at 60–90 ppm) at 11.91 % is greater than that of LSC at 11.39 %. The more oxygen-containing functional groups, the more prone the coal is to self-ignition. In summary, it can be judged that LSR has stronger self-ignition properties than LSC.
3.2.3 FT-IR test results
Fig. 9 illustrates the comprehensive infrared spectra of two coal samples, namely LSR and LSC. The infrared spectra of coal typically includes four key absorption peaks: between 3600 and 3000 cm−1, 3000–2800 cm−1, 1800–1000 cm−1, and 900–700 cm-1 (Ge et al., 2017; Yang et al., 2017).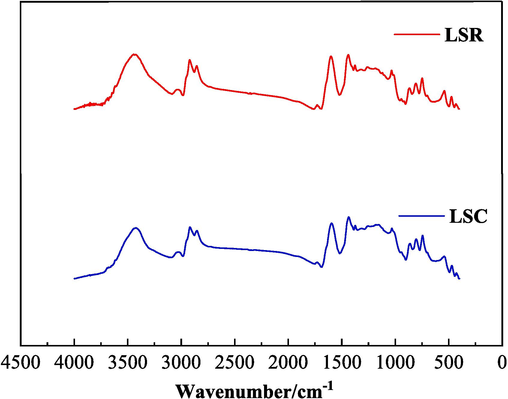
FT-IR test results of coal samples.
The intensities of these four variant types of absorption peaks across both coal samples exhibit no noteworthy differences, implying that the quantity of functional groups within the molecular structures of the two coal samples are alike. The fitting results of LSR and LSC are shown in Figs. 10 and 11. The main replacement methods were determined in combination with references (Ge et al., 2017; Yang et al., 2017) as shown in Table 8.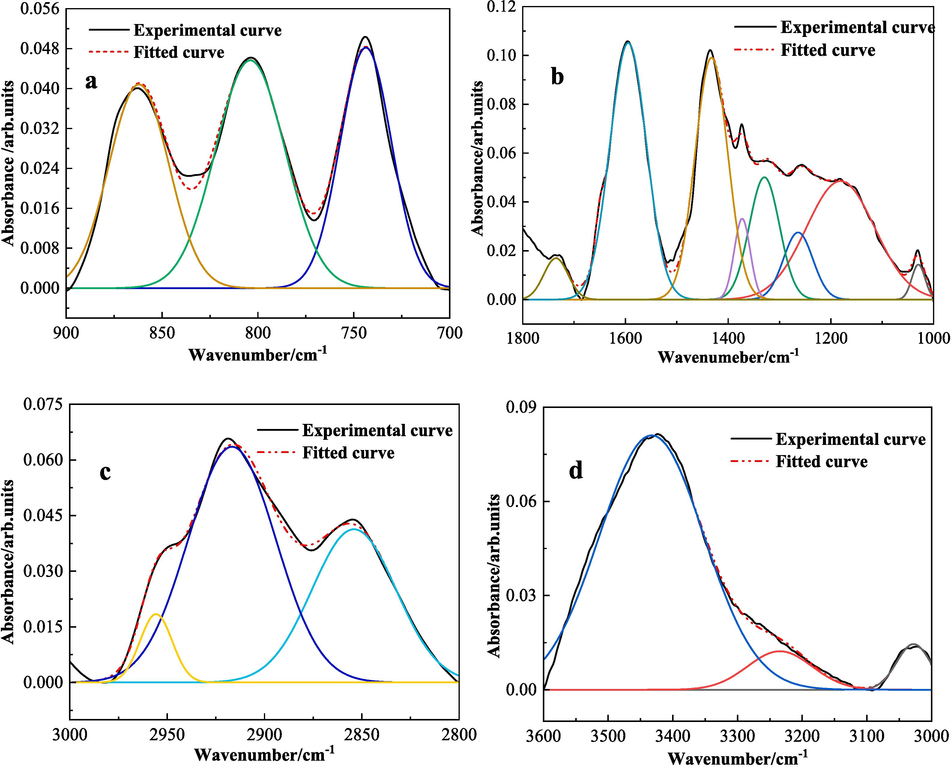
FT-IR sub-peak fitting control diagram of LSR (a is 900–700 cm−1,b is 1800–1000 cm-1,c is 3000–2800 cm−1,d is 3600–3000 cm−1).
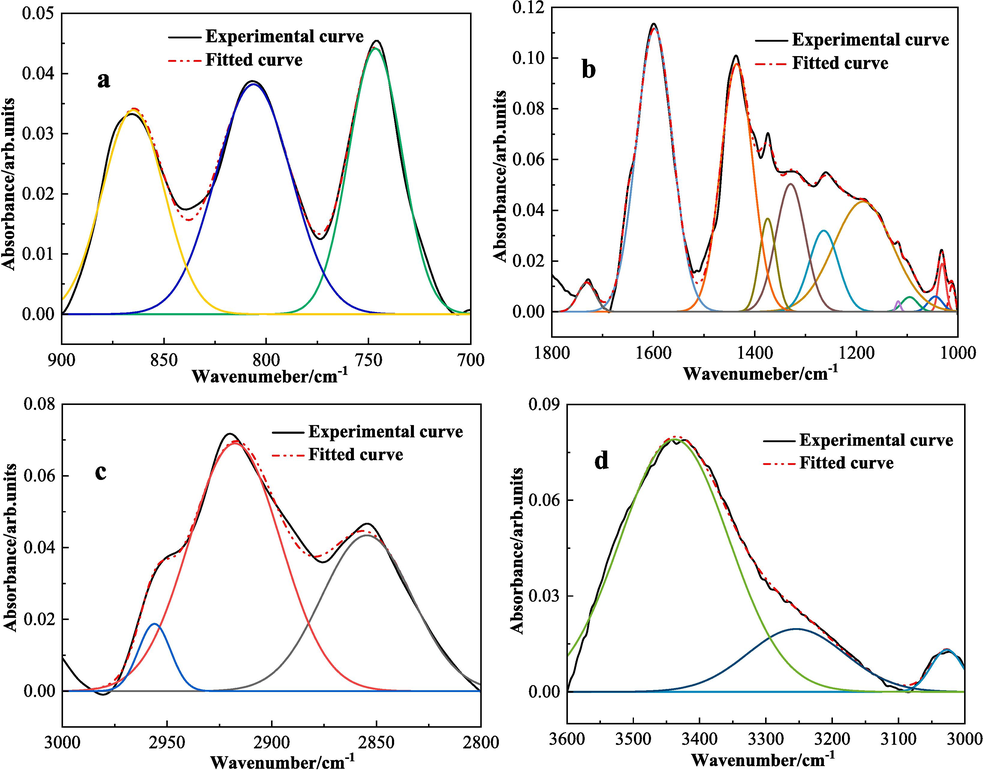
FT-IR sub-peak fitting control diagram of LSC (a is 900–700 cm−1,b is 1800–1000 cm-1,c is 3000–2800 cm−1,d is 3600–3000 cm−1).
Figure
LSR
LSC
Attribution
Number
Peak position /cm−1
FWHM /cm−1
Area
Relative area /%
Peak position /cm−1
FWHM /cm−1
Area
Relative area /%
a
700–900
cm−1
1
743.71
31.60
1.62
30.58
746.60
30.78
1.45
32.14
1,2-Substituted aromatic hydrocarbon
2
803.95
42.80
2.07
39.21
806.16
43.49
1.77
39.27
1,2,4-Substituted aromatic hydrocarbon CH
3
862.04
36.87
1.60
30.21
864.90
35.63
1.29
28.58
1,2,4/1,2,3,4,5-Substituted aromatic hydrocarbon CH
b
1000–1800 cm−1
1
1029.60
30.41
0.46
1.32
1029.16
29.00
0.55
1.67
Ash content
2
1181.30
157.22
8.12
23.29
1197.09
173.04
8.18
24.74
C-O of phenols, alcohols, ethers, esters
3
1263.39
66.62
1.93
5.53
1262.02
56.09
1.20
3.63
4
1329.06
69.51
3.71
10.64
1329.01
70.73
3.43
10.39
5
1372.82
37.30
1.58
4.53
1375.02
39.09
1.50
4.53
–CH3 symmetric deformation vibration
6
1432.55
74.05
7.83
22.37
1435.89
72.86
7.58
22.92
–CH2&–CH3,Inorganic carbonate
7
1595.37
86.03
9.57
27.44
1598.71
86.91
10.25
31.02
Aromatic hydrocarbons C = C
8
1752.02
82.10
1.70
4.88
1728.44
29.68
0.36
1.09
Carbonyl
c
2800–3000
cm−1
1
2854.03
50.87
2.24
36.01
2854.57
50.89
2.35
36.20
Cycloalkanes or aliphatic HydrocarbonsCH3
2
2916.67
53.12
3.59
57.84
2917.59
51.49
3.78
58.24
3
2955.69
19.45
0.38
6.15
2956.01
18.09
0.36
5.56
CH3 scales Asymmetrically
d
3000–3600
cm−1
1
3027.82
61.29
0.95
5.02
3027.16
56.08
0.79
3.81
Aromatic hydrocarbon CH stretching vibration
2
3234.56
117.68
1.54
8.13
3254.34
172.93
3.62
17.56
Hydrogen bond association –OH,–NH, phenols
3
3432.66
190.08
16.39
86.84
3437.65
192.79
16.22
78.63
–OH
From the analysis of Table 8, we can determine the types, contents, and substitution modes of the chemical functional groups contained in the two coal samples, LSR and LSC: The numbers of peaks in the two coal samples are the same, and the peak positions also differ slightly. By comparing Fig. 10(a) and 11(a), it can be determined that the substitution mode of aromatic hydrocarbons in the two coal samples is mainly 1,2,4-substitution on the benzene ring, accounting for about 70 %, and the remaining 30 % is 1,2-substitution of aromatic hydrocarbons. Analyzing Fig. 10(b) and 11(b), there are 8 peaks in the range of 1800–1000 cm−1, among which there are 3 peaks corresponding to the C-O of phenols, alcohols, ethers, and esters, with a total peak area accounting for approximately 40 %. There are also peaks corresponding to the carbonyl group, but the content proportion is relatively small, with LSR accounting for 1.7 % and LSC only 0.36 %. From Fig. 10(c) and 11(c), after peak fitting processing, there are 3 distinct peaks. The two absorption peaks with smaller wavenumbers represent the CH3 of cycloalkanes or aliphatic hydrocarbons, and the other one represents the CH stretching vibration of aromatic hydrocarbons. In Fig. 10(d) and 11(d), there are also three peaks. The peak positions from large to small respectively represent hydroxyl groups, hydrogen-bonded –OH, –NH, phenols, and CH stretching vibration of aromatic hydrocarbons. In summary, from the perspective of peak intensity, the two coal samples contain more aromatic hydrocarbons, C-O, and CH3, followed by –OH.
Analyzing the infrared spectral data of the two coal samples from the perspective of coal's spontaneous combustion ability, the ability of coal to self-ignite depends on the chemical composition of the coal and the active functional groups present in the coal. Among them, the more the content of active groups such as oxygen-containing functional groups like hydroxyl (–OH), ether bonds (C-O-C), and ketones (C = O), the easier it is for the coal sample to self-ignite, indicating that LSR is more prone to spontaneous combustion compared to LSC. Moreover, the degree of structural order in coal affects the rate of coal oxidation reactions. In FT-IR spectra, the degree of coal's structural order can be evaluated by absorption peaks related to aromaticity. Coal samples with a lower degree of structural order have a stronger ability to self-ignite. For example, the ratio of the peak areas at 1600 cm−1 and 1375 cm−1: this ratio reflects the relative content of aromatic C = C bonds and alkyl chains. A higher ratio means that there is more aromatic structure in the coal, and the degree of structural order is relatively high. A lower ratio indicates that the coal contains more alkyl chains, and the degree of structural order is relatively low (Cimadevilla et al., 2003; Ban et al., 2016). As indicated in Table 8, the ratio of peak areas at 1600 cm−1 and 1375 cm−1 for LSR is approximately 6.1, while the corresponding value for LSC is approximately 6.8. Therefore, it can be inferred that the structural order of LSC is higher than that of LSR, suggesting that LSR is more prone to self-ignition compared to LSC.
4 Conclusion
Layered mining of thick coal seams enhances coal recovery but also increases spontaneous combustion risk. This study examines the impact of upper seam mining on lower seam coal's spontaneous combustion characteristics. Key findings include:
Physical Structure Impact: Layered mining alters the stress state of lower seam coal, changing its pore structure. Lower seam coal (LSR) has a larger specific surface area, average adsorption pore diameter, mesopore volume, and micropore volume than upper seam coal (LSC), facilitating oxygen penetration and increasing spontaneous combustion risk.
Low-Temperature Oxidation Characteristics Impact: LSR has a lower oxidation combustion characteristic temperature than LSC, indicating a stronger spontaneous combustion tendency. LSR releases more heat before reaching the ignition point temperature T3 than LSC. When the oxygen volume fraction exceeds 11 %, LSR's oxygen consumption rate and CO generation rate surpass those of LSC, suggesting LSR is more prone to spontaneous combustion during the early low-temperature oxidation phase.
Chemical Characteristics Impact: LSR has a lower alkyl carbon content, higher oxygen carbon content, and more oxygen-containing functional groups than LSC. These chemical changes make LSR more prone to spontaneous combustion during oxidation.
CRediT authorship contribution statement
Dongjie Hu: Supervision, Funding acquisition. Zongxiang Li: Data curation. Yu Liu: Supervision. Cong Ding: Data curation, Supervision. Chuntong Miao: Supervision. Haiwen Wang: Supervision.
Acknowledgments
The authors acknowledge the financial support from the National Natural Science Foundation of China (51774170).
Declaration of Competing Interest
The authors declare that they have no known competing financial interests or personal relationships that could have appeared to influence the work reported in this paper.
References
- Influence of wet and preheated coal charging on the nature of quinoline insolubles of coal tars and their derived pitches[J] Fuel Process. Technol.. 1996;47(3):281-293.
- [Google Scholar]
- Effect of inorganic acid elution on microcrystalline structure and spontaneous combustion tendency of Shengli lignite[J] J. Fuel Chem. Technol.. 2016;44(9):1059-1065.
- [Google Scholar]
- The calculation of the chemical exergies of coal-based fuels by using the higher heating values[J] Appl. Energy. 2008;85(8):776-785.
- [Google Scholar]
- Chang, X.H., Wang, D.M., Jia, H.L. 2012. Thermogravimetric determination of the critical oxygen volume fraction forspontaneous combustion of coal [J]. Journal of China University of Mining & Technology 41(4):526-530+550.
- Correction of sideband effects of nuclear magnetic resonance carbon spectrum in coal and its application in coal structure analysis[J] Energy Sci. Eng. 2023
- [Google Scholar]
- Causality between tectonic coal and coal and gas outbursts[J] J. China Coal Soc.. 2021;46(1):180-198.
- [Google Scholar]
- Photoacoustic FT-IR study of weathered stockpiled coking coals[J] Vib. Spectrosc. 2003;31(1):133-141.
- [Google Scholar]
- Experimental study on spontaneous combustion characteristics of secondary oxidation of Jurassic coal [J] China Safety Science Journal. 2014;24(01):34-40.
- [Google Scholar]
- Thermal analysis ofspontaneous combustion behavior of partially oxidized coal[J] Process Saf. Environ. Prot.. 2016;104:218-224.
- [Google Scholar]
- Fatkulina, A V., Konokotin, D N, Koroleva, L A, Salov, S M, & Samoylenko, D. V. 2021. Environmental problems in the coal mining industry in Russia. In IOP Conference Series: Earth and Environmental Science (Vol. 867, No. 1, p. 012087). IOP Publishing.
- Materials characterization using factor analysis of FT-IR spectra. Part 1: Results[J] Appl. Spectrosc.. 1985;39(2):303-310.
- [Google Scholar]
- XPS and FTIR spectroscopy characterization about the structure of coking coal in Xinyang[J].Spectroscopy and Spectral. Analysis. 2017;37(8):2406-2411.
- [Google Scholar]
- Development and application of a correlation of 13C NMR chemical structural analyses of coal based on elemental composition and volatile matter content[J] Energy Fuel. 1999;13(1):60-68.
- [Google Scholar]
- Dynamic distribution and prevention of spontaneous combustion of coal in gob-side entry retaining goaf[J] PLoS One. 2022;17(5):e0267631
- [Google Scholar]
- Environmental issues from coal mining and their solutions[J] Mining Science and Technology (china). 2010;20(2):215-223.
- [Google Scholar]
- Jaromı́r, N., Josef, K., Janoš, P., Čežı́ková, J., Věnceslava, T., Libuše, M. 2001. Humic acids from coals of the North-Bohemian coal field: I. Preparation and characterisation[J]. Reactive and Functional Polymers, 47(2), 101-109.
- Use of FTIR, XPS, NMR to characterize oxidative effects of NaClO on coal molecular structures[J] Int. J. Coal Geol.. 2019;201:1-13.
- [Google Scholar]
- Study on reasons of rock burst in roadway and prevention technology of steeply-inclinedand extremely thick coal seam with horizontally slicing way[D]. Beijing: Beijing Jiaotong University; 2009.
- Relations between coal properties and spontaneous combustion parameters[J] Turk. J. Eng. Environ. Sci.. 2002;26(1):59-64.
- [Google Scholar]
- Critical oxygen volume fraction of smothering quenched zone based on closedoxygen consumption experiment [J] J. China Coal Soc.. 2017;42(07):1776-1781.
- [Google Scholar]
- Characteristics of coal re-oxidation based on microstructural and spectralobservation[J].International Journal of. Min. Sci. Technol.. 2015;25(5):749-754.
- [Google Scholar]
- Numerical and experimental investigation of the impact fragmentation of bluestone using multi-type bits[J] Int J Rock Mech Min Sci. 2017;91:18-28.
- [Google Scholar]
- Experimental study on combustion characteristics of coals under enriched-oxygencondition by thermo-gravimetric analysis [J] Journal of Harbin Institute of Technology. 2011;43(01):104-108.
- [Google Scholar]
- Effects of air volume and pre-oxidation on re-ignition characteristics of bituminous coal[J] Energy. 2023;265:126124
- [Google Scholar]
- Testing on indicator gases of coal spontaneous combustion based on temperature program[J] Journal of Liaoning Technical University(natural Science). 2013;32(3):362-366.
- [Google Scholar]
- Characteristics of chars prepared from various pulverized coals at different temperatures using drop-tube furnace[J] Energy Fuel. 2000;14(4):869-876.
- [Google Scholar]
- Investigation of the thermal behaviour of pre-oxidation coal in deep mines[J] Environ. Sci. Pollut. Res.. 2023;30(19):55414-55423.
- [Google Scholar]
- Comparing the porosity and surface areas of coal as measured by gas adsorption, mercury intrusion and SAXS techniques[J] Fuel. 2015;141:293-304.
- [Google Scholar]
- A review of research on spontaneous combustion of coal[J] Int. J. Min. Sci. Technol.. 2020;30(3):303-311.
- [Google Scholar]
- Construction of bituminous coal vitrinite and inertinite molecular assisted by 13C NMR, FTIR and XPS[J] J. Mol. Struct.. 2020;1222:128959
- [Google Scholar]
- Surface area and porosity of coal fly ash[J] Environ. Sci. Tech.. 1985;19(1):82-86.
- [Google Scholar]
- CPMAS 13C-NMR and pyrolysis-GC-MS studies of structure and liquefaction reactions of Montana subbituminous coal[J] Fuel Process. Technol.. 1993;34(3):249-276.
- [Google Scholar]
- Mechanochemical and chemical activation of lignocellulosic material to prepare powdered activated carbons for adsorption applications[J] Powder Technol.. 2016;299:41-50.
- [Google Scholar]
- Characterization of pore structure and the gas diffusion properties of tectonic and intact coal: Implications for lost gas calculation[J] Process Saf. Environ. Prot.. 2020;135(C):12-21.
- [Google Scholar]
- Multiscale thermal behavioral characterization of spontaneous combustion of pre-oxidized coal with different air exposure time[J] Energy. 2023;262:125397
- [Google Scholar]
- Influences of the pre-oxidation time on coal secondary spontaneous combustion behaviors by temperature-programmed technique[J] Int. J. Coal Prep. Util.. 2023;43(1):190-202.
- [Google Scholar]
- Secondary spontaneous combustion characteristics of coal based on programed temperature experiments[J] J. Energy Res. Technol.. 2018;140(8):082204
- [Google Scholar]
- Instability mechanism and control of section coal pillar in fully mechanizedmining face with super thick roof and extra thick seam [J] J. China Coal Soc.. 2021;46(12):3756-3770.
- [Google Scholar]
- 13C-nmr studies of coal and coal extracts[J] Philosophical Transactions of the Royal Society of London. Series a, Mathematical and Physical Sciences. 1981;300(1453):15-41.
- [Google Scholar]
- Quantitative XRD analysis of coal combustion by-products by the Rietveld method. Testing with Standard Mixtures[j]. Adv. X-Ray Anal. 2000;42:387-396.
- [Google Scholar]
- Effect of particle size and low-temperature secondary oxidation on the active groups in coal structures[J] Process Saf. Environ. Prot.. 2021;149:334-344.
- [Google Scholar]
- Secondary oxidation of crushed coal based on free radicals and active groups[J] Fuel. 2021;290:120051
- [Google Scholar]
- The oxidative heat release intensity of coal is estimated by the change of bond energy in temperature programmed experiment [J] Fire Safety Science. 1999;04:61-65.
- [Google Scholar]
- A new insight into the structure of Huolinhe lignite based on the yields of benzene carboxylic acids[J] Fuel. 2017;189:408-418.
- [Google Scholar]
- Comparative analysis of oxidation characteristics of raw coal, primary oxidized coaand secondary oxidized coal with different particle sizes [J] Journal of Henan Polytechnic University(natural Science). 2022;41(01):17-22.
- [Google Scholar]
- Experiment research on coal spontaneous combustion characteristics by TG-FTIR. [J]. Journal of Henan Polytechnic University(natural Science). 2009;28(5):547-551.
- [Google Scholar]
- Effect of microwave irradiation on the propensity for spontaneous combustion of Inner Mongolia lignite[J] J. Loss Prev. Process Ind.. 2016;44:390-396.
- [Google Scholar]
- Construction of Pingdingshan coal molecular model based on FT-IR and 13C-NMR[J] J. Mol. Struct.. 2022;1262:132992
- [Google Scholar]
- Zhang, Y.N., Deng, J., Luo, Z.M., Wen, H., Wang, W. 2008. Thermogravimetric analysis on influence factor of coal spontaneous combustion [J]. Journal of Xi'an University of Science and Technology (2):388-391.
- Study on the law of heat dissipation zone, oxidization and heat accumulation zone, suffocative zone in goaf and spontaneous combustion prevention in slicing mining of thick seam [J] Coal Science and Technology. 2016;44(10):24-28.
- [Google Scholar]
- Spontaneous oxidation kinetics of weathered coal based upon thermogravimetric characteristics[J] Energy. 2023;275:127489
- [Google Scholar]
- Ideological paradigms and their impact on environmental problems solutions in coal mining regions. In: E3S Web of Conferences. Vol Vol. 21. EDP Sciences; 2017. p. :04008.
- [Google Scholar]


