

Translate this page into:
Effects of thermodynamic properties of rice and ambient conditions on moisture migration during storage at naturally ventilated warehouses
⁎Corresponding authors. n.maftoon@areeo.ac.ir (Neda Maftoon Azad), shgahaieghbaghaie@yahoo.com (Shaghayegh Baghaei)
-
Received: ,
Accepted: ,
This article was originally published by Elsevier and was migrated to Scientific Scholar after the change of Publisher.
Peer review under responsibility of King Saud University.
Abstract
Characterizing the effect of external variables on the moisture migration phenomenon. Thermodynamic properties of rice during the rehydration cycle were illustrated. The isosteric heat of sorption was linearly correlated with the entropy of sorption. The most suitable conditions to store rice were determined.
Abstract
The current study dealt with characterizing the effect of external variables on the moisture migration phenomenon in two naturally ventilated rice warehouses. Secondly, the thermodynamic properties of rice during the rehydration cycle were illustrated as numerical models to predict their behavior. Thai rice was stored at Shiraz city and Abadeh town for a total of 9 months in two identical warehouses. The effect of outside temperature and relative humidity on ambient conditions inside the warehouses as well as rice moisture content was evaluated. The dehydration rate of rice stored at Shiraz facility was higher than those stored at Abadeh warehouse by an average of 166% resulting in lower rice moister content. The 60-day latency in reaching minimum rice bulk moisture content at Abadeh warehouse was due to its cooler climate and less intense boundary area temperature gradient. The type II sigmoid-shaped sorption isotherm (fitted with the GAB model) indicated moisture content elevation above 11% sharply increased with the water activity beyond 0.7. The isosteric heat of sorption was linearly correlated with the entropy of sorption indicating adsorption was governed by compensation theory, was enthalpy driven and non-spontaneous. The most suitable conditions to store rice were determined by relating the grain’s moisture content and its thermodynamic properties during the sorption process. Therefore, storage of rice for prolonged durations was possible by maintaining the ambient temperature and relative humidity between 20.0 °C and 28.5 °C and 15.0% to 25%, respectively.
Keywords
Moisture migration
Rice
Compensation Theory
Adsorption
Thermodynamic Properties

1 Introduction
Rice (Oryza sativa L.) is a staple food for more than half of the world’s population, especially in Asian countries including the entire Middle East region (Zhou et al. 2015). Most of the cultivated rice is consumed as cooked rice rather than processed food or feed ingredient due to simplicity in its preparation at any setup (Yu et al. 2017). Therefore, a requirement to store rice for prolonged and varying durations should be fulfilled to maintain its sustainable supply to the public (Zhou et al. 2002). Climatic conditions, pre-harvest operations, types of variety and safe storage managements are the factors affecting grain quality. Because of the seasonality of the rice crop, ensuring the preservation and availability of the product for a long period is of great importance (Müller et al. 2022, Esfe et al. 2022b). Therefore, proper selection of right procedures in postharvest of rice grains including storage conditions greatly influence the rice quality (Shad and Atungulu 2019, Olorunfemi and Kayode 2021).This concept is vital for people residing in the Middle East area due to the region’s harsh dry climate, recurring drought cycles and rapidly increasing population growth leading to food insecurity (Cheeseman 2016). Worsening the situation, most countries within the region are considered as the developing world possessing fragile and unstable economies. Consequently, it is rather difficult for governmental or private sectors to construct storage facilities equipped with mechanical ventilation or air conditioning systems. Hence, the concept of naturally ventilated warehouses suitable to store substantial quantities of rice for prolonged durations is lucrative. However, it is off importance to characterize the effect of factors on rice moisture content contributing to its quality, stability and market acceptability.
During storage, cereal grains interact with the surrounding environment and interchange moisture and heat resulting in grain temperature and moisture variation (Novoa-Muñoz 2019). This heat and relative humidity fluctuation may cause a decrease in rice quality. For example,
Yanxia et al. found that an ample decrease in the water content of rice grains was observed at higher temperatures influencing the protein, lipid and ash contents (Yanxia et al., 2018). Temperatures>35 °C caused the grains become more transparent because of the water content (Esfe et al. 2022c). On the other hand, the increase in the water content and temperature of the grain mass induces higher respiration and more intense respiratory process, and accordingly speeding up the grain metabolism resulting in higher consumption of dry matter and reducing the starch content.
The temperature gradients within grain bulk and/or the surrounding air induce moisture-carrying convection currents across the facility resulting in the moisture migration phenomenon (Chelladurai et al. 2016, Esfe et al. 2022c, Esfe et al. 2022b, Esfe et al. 2022a).
Ideally, successful storage would be achieved when the aforementioned process is halted and grain moisture migration or exchange is prevented (Jian, Jayas and White 2009). However, uneven distribution of temperature across different sections of stored bulk results in a slow and steady moisture translocation preventing the establishment of equilibrium conditions (Khatchatourian et al. 2017). Therefore; monitoring the temperature, relative humidity and water content of the rice grains is imperative for maintaining quality throughout storage. Rice quality cannot be improved during storage, but a temperature- and relative-humidity-controlled environment allows the grains to be preserved until the appropriate period for sowing, with no reduction in quality (Bernaola et al. 2018).
Moisture migration in the form of an adsorption mechanism could compromise the physicochemical quality of rice to a greater extent rather than desorption. Therefore, it is of significant importance to characterize and predict the effect of external factors on rice grain sorption behaviour using thermodynamic models. The thermodynamic properties of food provide valuable information for predicting its behaviour during processes such as storage and drying (Rosa, Moraes and Pinto 2010). Sorption isotherm models contribute to food quality stability during storage by understanding the relationship between moisture content and water activity (García-Pérez et al. 2008). The isosteric heat of sorption provides an extensive understanding of the state of water and its binding strength to the food surface. The differential entropy of sorption indicated is analogous to available sorption sites at a specific energy level (Toğrul and Arslan 2006, Esfe et al. 2022a). Its relationship with enthalpy could be established via compensation theory indicating the driving force behind the moisture sorption process and the nature of the process (Carvalho Lago and Noreña 2015, Chen et al. 2023). A range of studies has dealt with characterizing and/or modelling the behaviour of grains including rice during storage in a variety of storage setups (Jian et al. 2009, Jiménez-Islas, Navarrete-Bolaños and Botello-Álvarez 2004, Bartosik, Rodriguez and Cardoso 2008, Gastón et al. 2009, Khatchatourian et al. 2017). Others have dealt with the thermodynamic properties of crops to predict their behaviour during storage (McMinn, Al-Muhtaseb and Magee 2005, McMinn and Magee 2003, Wan et al. 2018). However, to the best of our knowledge, no published study has related the thermodynamic properties of rice (during the moisture sorption process) with the grain moisture content fluctuation while stored in a dry climate. In this study, the effect of temperature and relative humidity variation as a result of season and storage location change on rice moisture content was characterized. Furthermore, thermodynamic properties of the rice were utilized to predict and improve the quality of rice during storage, especially during the rehydration period.
2 Materials and methods
2.1 Chemicals and reagents
All of the chemicals namely lithium chloride (LiCl), potassium acetate (C2H3KO2), magnesium chloride (MgCl2), potassium carbonate (K2CO3), sodium chloride (NaCl), magnesium nitrate (MgNO3), barium chloride (BaCl2), and copper sulfate (CuSO3) were purchased from Sigma Aldrich (St. Louis, MO, USA).
2.2 Descriptions of storage facilities
A total of two rice warehouse facilities belonging to Fars Provence Grain Company and Commercial services (FGCCS) were inspected. One of these storage facilities was located in Abadeh (AF) and the other in Shiraz city (SC). These structures were built out of a metallic ceiling, cement flooring and brick walls and were located in the municipal area. Loading capacity, surface area and the surrounding wall height were 25 metric tons, 1000 m2 and 4 m, respectively. The interior structure height at its highest was 6 m providing a gabled roof structure equipped with two windows on each side (Fig. 1(a)). The window surface area ratio to the surrounding walls was 1 to 8; providing natural ventilation to the storage facilities. The rice bags were stored in ten rows, with each row measuring up to 2 m from the ground. A clearance of 20 cm from each wall was maintained to prevent physical damage to the bags or obstructing the emergency routes.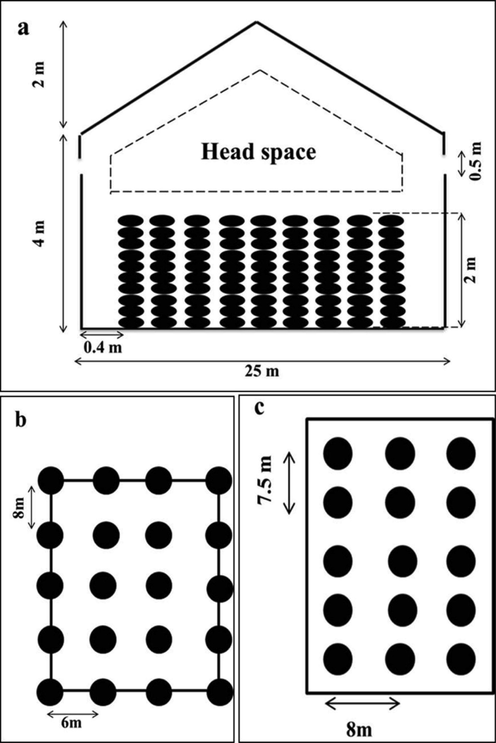
Illustration of warehouse schematics.
2.3 Ambient condition measurements of the storage facilities
The temperature and relative humidity (RH%) of air inside the storage facility were monitored using a digital sensor (TSH206, Teracom, Ruse, Bulgaria) connected to a series of wireless remote controllers (TCG 140 GPRS remote module, Teracom, Ruse, Bulgaria) via 1-Wire interface. The acquisition data were collected and processed using supervisory control and data acquisition (SCADA) systems using graphical user interfaces (TC Monitor 2.1, Teracom, Ruse, Bulgaria). RH% and temperature collection were performed continuously with a 2-hour interval and an accuracy of 3.0% and 0.4 °C, respectively. The sensors were situated on removable plastic columns anchored to the facilities floor at predetermined heights and distances (Fig. 1(b)). Furthermore, the sensors and controllers monitoring the headspace area humidity and temperature were mounted from the ceiling using detachable suction cup holders.
2.4 Plant material
The white rice (Thai rice) was shipped to Iran by sea then the shipment was transported to the mentioned warehouses. The stored rice bags could be held for any duration ranging from 6 weeks up to 9 months depending on the market demand. However, the samples used in this study were from the same batch which entered the facilities simultaneously and was stored for the same time frames.
2.5 Sampling procedure
The sampling procedure was conducted for a total of 9 months with an interval of 30 days from May 2018 until January 2019 using a sampling spear. It should be noted that Iran is located in the northern hemisphere therefore the experiments were conducted in late spring, summer, fall and early winter (Hejazi et al. 2023). Sampling was performed at 12 locations within each of the storage heights ranging from 0.5 m to 2 m with 0.5 m intervals (Fig. 1(c)). A total of 10 g samples were taken from the center of each bag using a sampling spear. Subsequently, the samples were transferred into a polyethylene plastic bag which was vacuum sealed onsite. The sealed bags were then transferred on the same day to laboratory for further analysis. The temperature of rice bulk inside the bags was monitored at an interval of 2 h using a modified digital thermometric system (StorMax, OPI, Canada) throughout the storage process.
2.6 Moisture content
The moisture content of collected samples in sealed plastic bags was determined by an oven method as described by Jian et al. (2009) with some modifications. Briefly, a total of 30 g rice was transferred to tared aluminium dishes which were dried at 130 °C till no weight loss was observed (∼20 hrs). The moisture content was determined by the following equation (Esfe et al. 2022c):
Where MC, Wi and Wf were moisture content, initial and final sample weight, respectively.
2.7 Sorption isotherm
The sorption isotherm analysis was conducted to determine the quantity of moisture absorption of rice samples in a determined environmental condition. A total of seven saturated salts representing various water activities ranging from 0.05 to 0.9 were used. A total of 5 g of samples was transferred to an aluminium sample pan which was then placed in an air-tight enclosure filled with saturated salt solutions. The enclosures were incubated at 25 °C and 40 °C for a week to reach equilibrium moisture content (EMC). The EMC of samples was determined using the oven method as described in section 2.4. The sorption isotherm graphs were prepared and the obtained nonlinear regressions were compared with various models (Table 1) based on root mean square error (RMSE) and correlation coefficient (R2) and mean relative percentage error (Pe) (Xia et al. 2022, Esfe et al. 2022c, Esfe et al. 2022b).
X is the moisture content (db), Xm is monolayer moisture content (db), aw is water activity; A, B, c1, c2, C and K are constants.
Model
Equation
Hasley
Henderson
Iglesias-Chirife
Kuhn
Oswin
Smith
GAB
Where, Y, Y* and N are the experimental value of EMC, predicted value of EMC, and a number of observations, respectively.
2.8 Isosteric heat of sorption and entropy of sorption
The isosteric heat of sorption (Qst) could determine the temperature dependence of water activity during the sorption process (Dalgıç, Pekmez and Belibağlı 2012). The net isosteric heat of sorption (qst) of rice grain bulks was determined using Clausius–Clapeyron equation using the data provided by the best-fitted model (Iguaz and Vírseda 2007, Martínez-Las Heras et al. 2014). The isosteric heat of sorption is defined as net isosteric heat of sorption plus heat of vaporization of water at the system temperature (Tolaba et al. 2004).
where, qst, R, aw, T, Qst and HL were net isosteric heat of sorption (kJ.mol−1), universal gas constant (8.314 J.mol-1K−1), water activity, temperature (K), isosteric heat of sorption (kJ.mol−1) and heat of condensation of water vapor (kJ. mol−1), respectively. The qst was calculated using equation (4), by plotting the natural logarithmic value of aw against inverse temperature in kelvins at constant MC values. The obtained slope of the isosteres (linear plots) was equal to –qst/R; consequently, the qst value was plotted as a function of various MC.
The differential entropy of adsorption (
is an indicator of the number of available sorption sites at specific energy which was calculated using the following equation:
The ΔSd value was calculated from the intercept (-ΔS/R) of the linear isoster plots discussed previously.
2.9 Enthalpy-entropy compensation theory
The compensation theory validates whether a single mechanism is responsible for the sorption process by all members of the starchy food structure or not (Carvalho Lago and Noreña 2015). The Qst and ΔSd were obtained from equations 4, 5 and 6 as the slope (-ΔQst/R) and intercept (ΔSd/R) of the linear equation when ln aw was plotted against 1/T at given MC contents. Consequently, the dependence of Qst and ΔSd with MC was determined by applying them at a range of MCs. The linear relationship proposed between Qst and ΔSd by compensation theory is provided below:
where, Qs, Tβ, ΔSd and ΔG were differential isosteric heat of sorption (kJ.mol−1), isokinetic temperature (°C), the entropy of sorption (J/mol.°k) and Gibbs free energy (kJ.mol−1), respectively; Tβ and ΔG were calculated via linear regression.
The theory is only valid if Tβ was unequal with harmonic mean temperature (Thm) which was calculated using the equation below (Chen et al. 2023):
The effect of temperature on the sorption process was evaluated via compensation theory using equations described below by Aguerre et al.(1986):
2.10 Statistical analysis
A two-way analysis of variance (ANOVA) using a general linear model with a 95% level of significance (Minitab 17.2.0, Minitab Ltd., Coventry, UK) was performed to determine the significance of the difference in temperature and relative humidity of air and moisture content of rice at different locations and months. The post-doc test utilized to separate means was Tukey's honestly significant difference (HSD) test.
3 Results and discussion
3.1 Climate conditions outside the storage facilities
The temperature and RH% outside the AF and SC facilities have been illustrated in Fig. 2(a) and (b), respectively. The weather conditions at both locations followed a similar pattern in terms of temperature and RH% during different seasons. Given this, it should be stated that although both cities had similar RH% (annual average ∼ 35%), Abadeh (annual average ∼ 14.80 °C) enjoyed a relatively cooler climate than Shiraz (annual average ∼ 18.80 °C). The RH% content was at its lowest during hot and dry summer months whereas from August onwards an increase in RH% was seen. This was due to the seasonal transition into wet, cold and windy autumn months when most of the annual precipitation occurs throughout the region. Furthermore, monthly sunshine hours during autumn and winter are considerably lesser (∼20%) due to more cloudy days with shorter daylight hours.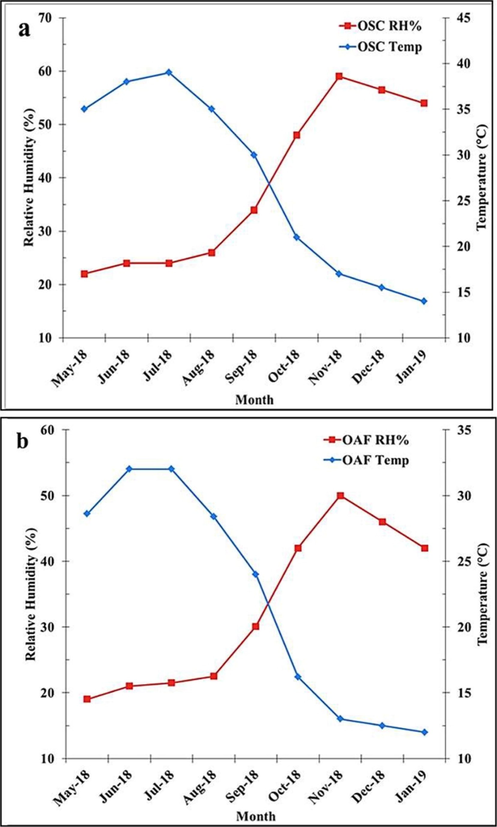
Temperature and RH% of outside environments.
3.2 Ambient conditions inside the storage facilities
The ambient conditions at different sampling positions inside each storage facility followed similar trends. The RH% and temperature fluctuation at the SC facility were greater than AF warehouse throughout the study especially from June to September (Fig. 3(a-d)). Shiraz Central, The RH% content measured at different points within the same height was not significantly (P > 0.05) different. The only exception observed was recorded at locations within the 20 cm clearance area close to the entrance doors, walls and ceiling. These areas are more prone to outside climate fluctuations due to heat and moisture retainment within structures in their proximity. Furthermore, the RH% significantly (P < 0.05) decreased during storage with an order of floor (SCF), midsection (SCM), near the highest standing rice bag (SCS) from 0.5 to 2 m and headspace area (SCH) from ∼ 2 to 4 m (Fig. 3(a)). From June to August the RH% content at SCH, SCS, SCM and the SCF decreased by 6.00%, 5.50%, 4.80% and 4.50%, respectively. However, in September the RH% of the storage facility returned to the same values observed in June and kept rising until January (Fig. 3(a)). This was due to the season change from summer into autumn and winter which are relatively colder and damper. The ambient temperature within the storage facility significantly varied (P < 0.05) at locations with different heights (Fig. 3(b)). For instance, SCH retained the highest temperatures due to its vicinity to the metallic roof structure which was exposed to direct sunlight. SCH area temperature and its fluctuations affected the SCS area the most due to their proximity. However, the further the sampling positions distances were from the SCH, the lower the temperatures were. The same trend was observed when temperature fluctuations between day and night at different sampling positions were accounted. Especially from May to August which consisted of the hottest and longest days throughout the year. This was because solar radiation heated up the metallic roof and consequently the SCH. The SCH area cools down by transferring its heat across itself and the neighbouring SCS area through convection (Jian et al. 2009). Furthermore, temperature fluctuations at all sections decreased significantly (P < 0.05) from August to January; due to less sun presence during the autumn and winter months. Abadeh-Fars, Similar to the SC facility RH% and temperature at different sections of the warehouse followed a parabolic trend during the storage period (Fig. 3(c) and (d)). The AFH had the highest temperature and lowest RH% followed by AFS whereas these terms were opposite in AFF and AFM areas. The RH% content at AFH, AFS, AFM and AFF areas from June to August decreased by 4.50%, 4.00%, 3.00% and 1.5%, respectively. The RH% content inside the AF warehouse fluctuated significantly (P < 0.05) lesser extent than SC storage facility. This could be due to the cooler climate of Abadeh contributing to better air moisture retention and lesser RH% fluctuations. Consequently, the ambient temperature at different areas inside the AF warehouse was cooler by an average of 7 °C than at the Shiraz facility. It is worthy to mention that the RH% of OSC and OAF was not significantly (P > 0.05) different; therefore its impact on the aforementioned comparison was negligible. The average temperature fluctuation between night and day at different areas inside the AF facility was significantly (P < 0.05) lesser than at the SC site at all times. Furthermore, a lesser variation in the temperature fluctuation value throughout the storage period could be seen at the AF site. This was due to Abadeh’s relatively more stable climate in terms of temperature variations. Moreover, a negative polynomial correlation (R2SC and R2AF = 0.99) between the temp and RH% inside both warehouses at all sampling positions was seen (Fig. 4(a) and (b)). However, the aforementioned correlation followed a negative linear trend (R2SC = 0.96 and R2AF = 0.93) outside the facilities at both locations (data not shown). The nonlinear correlation indicated an initial latency in RH% content increase due to temperature decrease which was later compensated at certain points. This could be due to confinement of air inside the facilities and restricted air fellow in comparison to the surrounding area. In this regard, Rizwan et al. (Rizwan et al. 2022) compared the interstitial relative humidity and temperatures of hermetic and polypropylene bag for wheat grain storage under different agro-climatic conditions of rice–wheat ecosystem of Pakistan in three different sites. They reported that the propylene bags showed fluctuation related to relative humidity of the environment while packaging grains in hermetic bags caused to reduce these variations and represented a plateau within a week for the rest of the period. Great variation in temperature fluctuation in both bags on all three sites was recorded.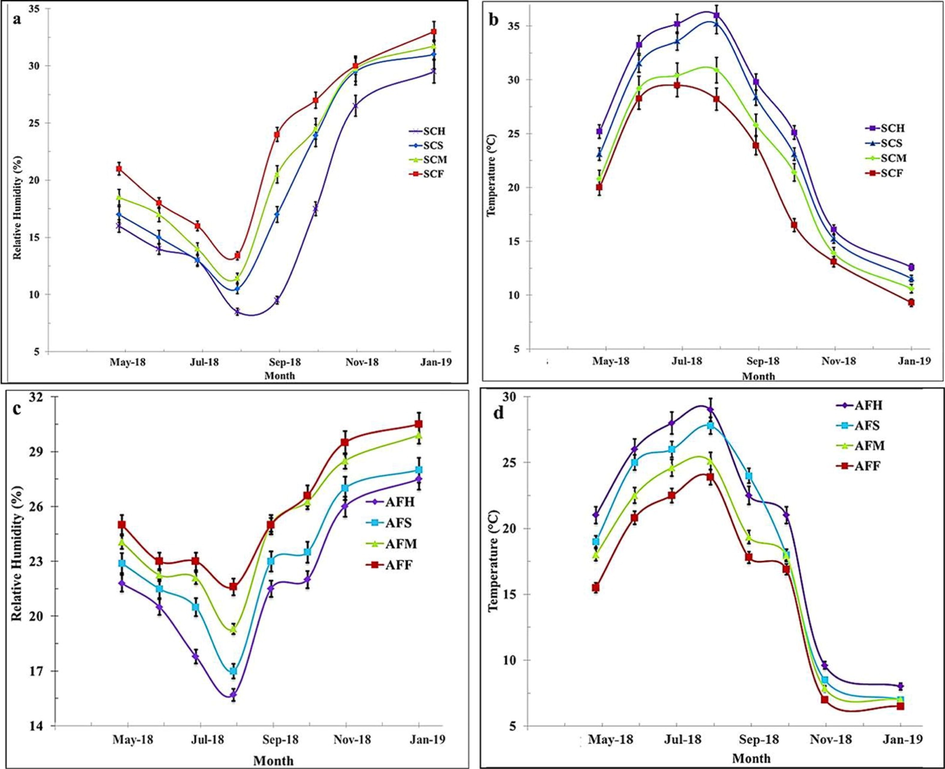
Temperature and RH% inside the storage facilities.
Temperature and RH% correlation inside the facilities.
It is worthy to mention that the temperature and RH% at all sampling positions followed similar trends. Therefore, empirical models illustrating the effect of outside climate on ambient conditions near the floor were shown and discussed here.
3.3 Influence of surrounding environment on storage conditions
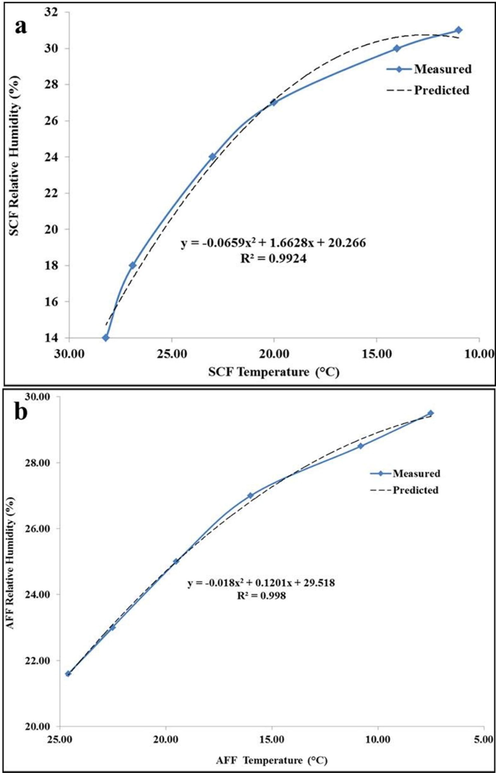
It was evident that at each location, environmental conditions outside the storage facilities governed the ambient conditions inside the warehouses. The interaction between inside and outside conditions in Shiraz facility (R2temp = 0.989 and R2RH%=0.942) and Abadeh warehouse (R2temp = 0.972 and R2RH%=0.935) followed a positive polynomial correlation. The polynomial trends shown in Fig. 5(a-d), illustrated a heat up and cool down lag inside storage facilities in comparison to the surroundings. This could be due to the type of construction material used in the facilities acting as a barrier toward climate fluctuations and variations as well as restricting the airflow. The distribution of air flow change with different factors including the loading method, compaction, grain sphericity, moisture and porosity. Grain storage in bulk warehouses significantly affects the air-flow field, which leads to anisotropy due to the variable area and in homogeneity of the grain mass, making air distribution more complex (Müller et al. 2022, Souza and Binelo 2020). Coradi et al. (Coradi et al. 2020) expressed that the factors such as the height and flow of the grain mass, temperature and relative humidity of the storage air and the temperature of the grain mass must be investigated accurately to address a safe storage (Coradi et al. 2020).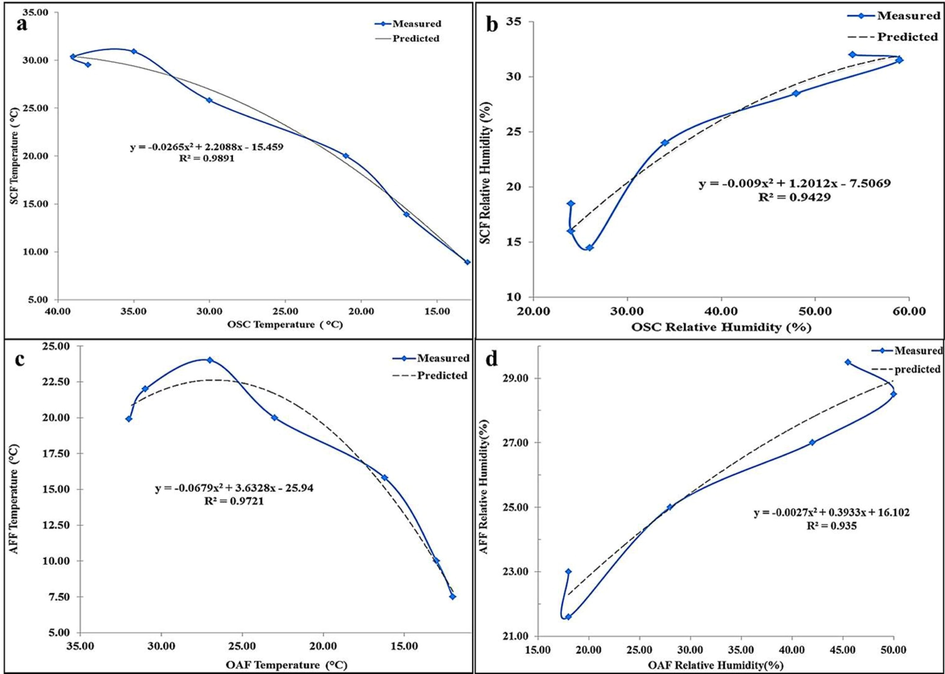
Correlation of inside and outside ambient conditions at Shiraz and Abadeh facilities.
The nature of the region’s climate could be the cause of mentioned correlations; where greater temperatures are coupled with lower humidity and vice versa.
3.4 Effect of storage conditions on grain bulk temperature
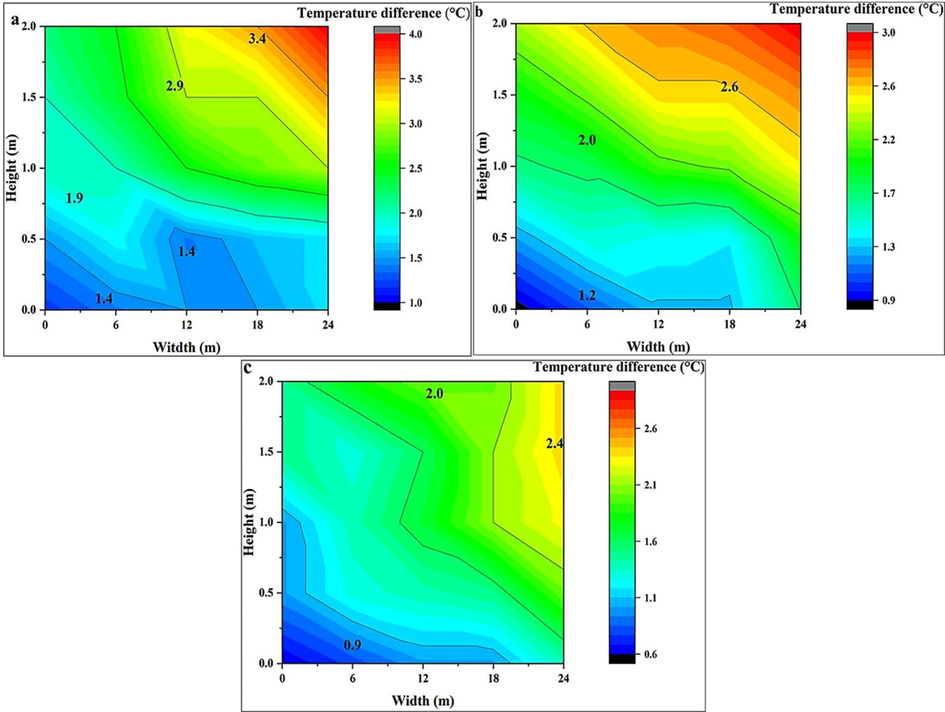
The grain bulk temperature was mainly affected by seasonal variations throughout the storage process regardless of the storage facility location. In this sense, solar radiation and its exposure to the surrounding walls had a remarkable effect. At the SC facility, the Southern-Western structure was heated to a considerably higher extent while at the AF site this occurred at the North-West orientation. Therefore, this section has dealt with the temperature behavior of rice bags located across the aforementioned alignments within a 20 cm distance from the wall. Shiraz-Central, The Northern and Eastern walls did not heat up to the same extent as their counterparts did; since it was only exposed to direct sunlight during early morning hours. Therefore, rice bags stored along these sections will have lower temperatures during the day compared to those located along South-East walls. Non-uniform heat distribution resulted in an uneven moisture migration and grain bulk temperature difference across the facility (Chelladurai et al. 2016). Similar results were reported by Jian et al. (2005) where the South-West walls were heated the most in comparison to their counterparts between May and July resulting in nonhomogeneous moisture migration. As expected, grain bulk temperature was significantly correlated with the vertical position of storage in the warehouse rather than their lateral position. However, an exception at areas close to the boundary areas especially at rice bulks stored from July to October close to the wall boundary areas; contributing to uneven heat and moisture distribution. In all cases the lowest temperature areas were situated below the 0.5 m height and within the 6 m to 18 m width range. Moreover, the heat accumulation was observed at the south-west and -east wall junctions reaching its maximum above the 1.5 m height (Fig. 6a-c). The temperature gradient between the top and bottom areas in August, October and January were 6.50 °C, 5.00 °C, and 4.00 °C, respectively. Furthermore, the temperature difference was the highest in July and further decreased while transitioning into fall and winter months (Fig. 7). In each case the temperature difference increased by moving from the floor to 2 m elevation due to the proximity to the headspace area. This sizeable temperature gradient may have resulted in moisture migration between different layers of stored grains. Furthermore, water condensation on the inner lower sections of the wall surface was noticed during autumn and winter facilitating uneven moister migration within the layers. Differences between the ambient air, inner and outer wall surface and intra-granular temperatures caused water condensation (Jian et al. 2015, Chelladurai et al. 2016). Bartosik et al. (2008) reported that temperature differences between stored sunflower seed layers resulted in moisture migration, repeated condensation cycles, and its accumulation at certain layers.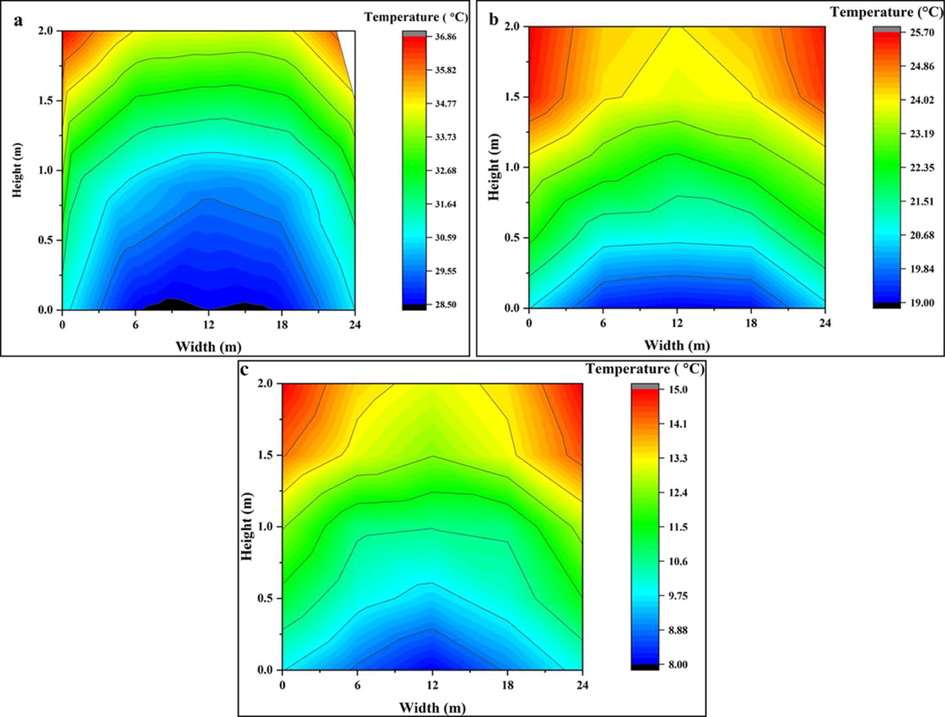
Rice bulk Temperature of bags located close to the Southern wall at Shiraz warehouse in a) July 2018, b) October 2018 and c) January 2019.
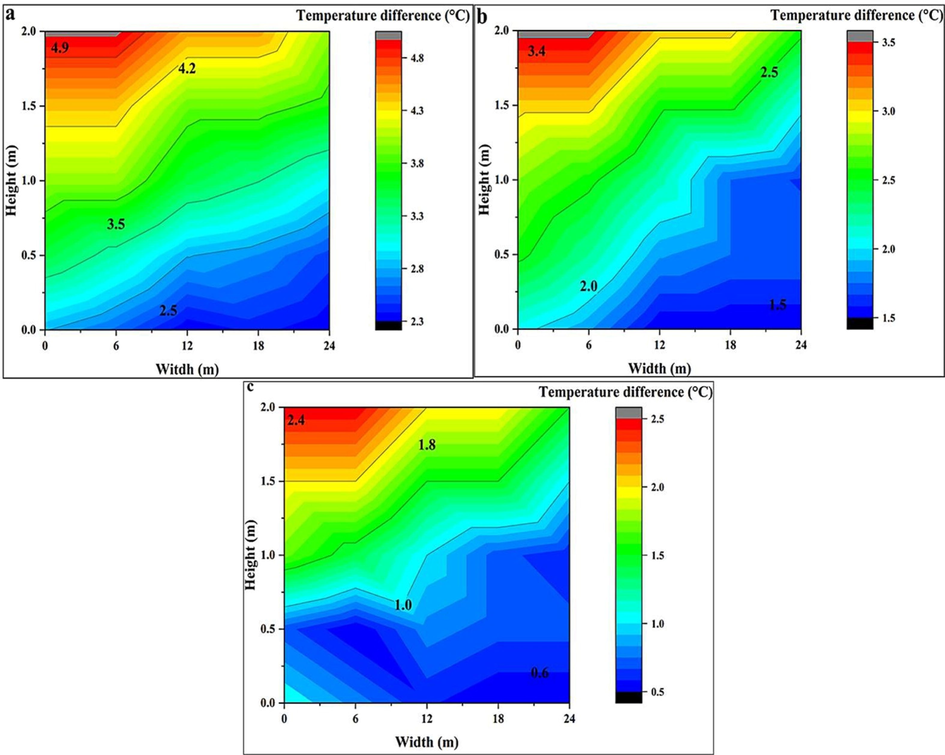
A temperature difference of rice bulk close to the boundary and non-boundary area at Shiraz facility in a) summer, b) fall and c) winter.
Fars-Abadeh, At the AF site, is contrary to SC facilities the North-West walls were heated the most during the storage duration. The heat gradient between the hottest and coldest areas in August, October and January were 5.00 °C, 4.00 °C, and 3.80 °C, respectively. The temperature difference between the top and the bottom section at the AF warehouse was lesser than in the SC facility (Fig. 8a-c). Moreover, temperature gradients between the Northern boundary wall and non-boundary areas were comparatively lesser than what was observed at the Shiraz facility (Fig. 9). Consequently, moisture migration between rice layers was observed to a lesser extent at the AF site. This could be due to regional and climatic differences between the two locations. Sunlight intensity and UV index at Abadeh are lower than at Shiraz throughout the year and are rather windier. Wind trajectory and velocity during storage have a considerable effect on grain bulk temperature located close to the walls (Montross et al., 2002). Furthermore, in either storage location grain bulk temperature followed a similar trend as described earlier in section 3.2 at sampling positions far away from the walls (Fig. 10).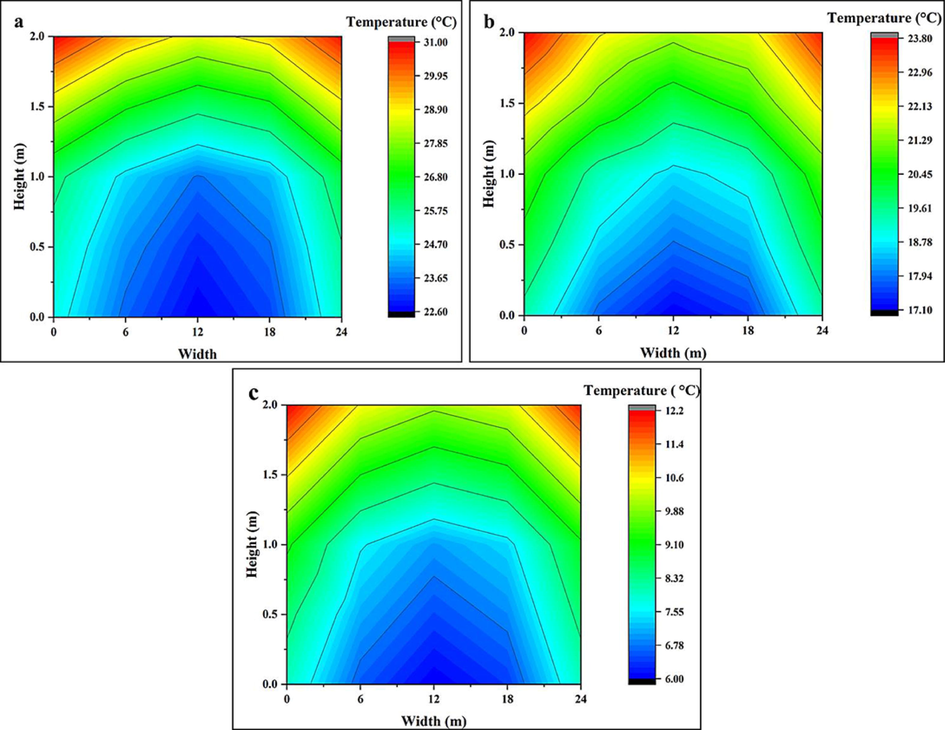
Rice bulk Temperature of bags located on the Northern wall at Abadeh warehouse in a) July 2018, b) October 2018 and c) January 2019.
A temperature difference of rice bulk close to the boundary and non-boundary area at Abadeh facility in a) summer, b) fall and c) winter.
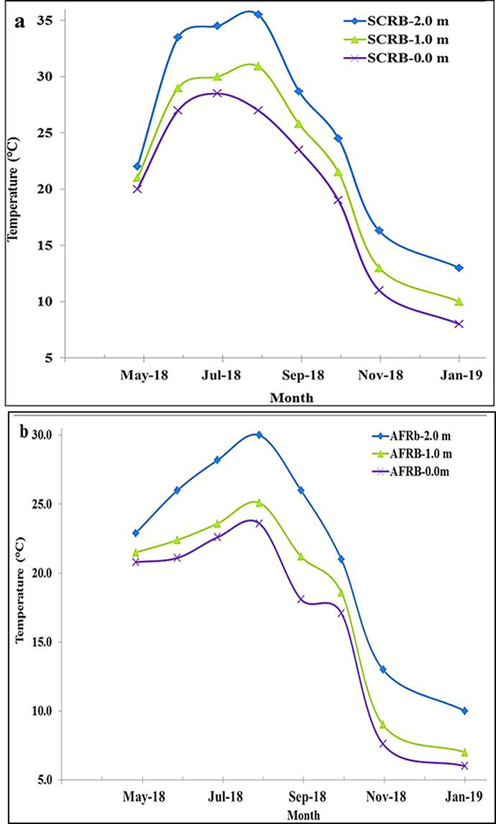
Rice bulk temperature stored at different elevations at a) Shiraz facility and B) Abadeh Facility.
3.5 Effect of storage conditions on grain bulk moisture content
At both facilities, the moisture content (MC%) of rice stacked at the floor section (up to 0.5 m) was the highest followed by the middle (∼0.5–1.5 m) and surface sections (∼1.5 – 2 m). At the same elevation and different lateral positions, the MC% of grain bulk did not vary significantly (P > 0.05) except for the clearance area. The lower MC% of rice bulk stored at higher heights was due to their proximity to the headspace area. As described previously in section 3.2 the headspace area is more readily affected by the outside environment and its changes. However, lower elevations were further away from the headspace area and confined by other rice bags reducing the chances of turbulent airflow. Therefore, the grain bulk stacked at the aforementioned positions had higher MC% with lesser fluctuations during the storage period. Shiraz-Central, At the center of the storage facility, the rice bulk MC% decreased from May to August and consequently increased from September onwards (Fig. 11). The dehydration and rehydration rates were illustrated as percentage point per month rate (PP.M−1)). The average MC% decrease rate was 1.10 PP.M−1, 0.90 PP.M−1 and 0.65 PP.M−1 at SCST, SCMT and SCFT layers, respectively. Furthermore, a rehydration rate of 0.28 PP.M−1 (SCST), 0.30 PP.M−1 (SCMT) and 0.40 PP.M−1 (SCFT) was observed at almost ∼ 1.5 – 2 m, ∼0.5–1.5 m and<0.5 m. As mentioned above, rice stored at different heights underwent moisture desorption and adsorption at rather different rates. This phenomenon was due to the difference in temperature gradient and its fluctuations within the rice bulk as well as the ambient air surrounding the grain bags (Lane and Woloshuk 2017). This would result in moisture migration from warmer areas at a higher elevation to colder lower standing rice bulk (Jian et al. 2009, Chelladurai et al. 2016). Therefore, the rice bulk stored in the floor section was dehydrated at a lower rate and rehydrated at a higher pace in comparison to higher-standing rice (1 m and 2 m) bags. Furthermore, an uneven temperature gradient between the rice bulk close to clearance areas and the non-boundary area could have resulted in an unsteady moisture migration within lateral directions (Jian et al. 2009). Moisture migration has been reported by researchers in a variety of grains and storage facilities (Arias Barreto et al. 2017, Jian et al. 2015, Jian et al. 2009, Gastón et al. 2009). It should be considered that high and low-temperature zone allocation and therefore moisture migration direction could vary based on the regional climate of the warehouse location and construction type. Chelladurai et al. (2016) reported that the bottom layer of stored canola grains in silo bags had the lowest temperature during Spring and Summer while the opposite was seen in autumn and winter. Barreto et al. (2017) reported changes in high and low-temperature zones during the storage of soybean from day 90 onwards as well.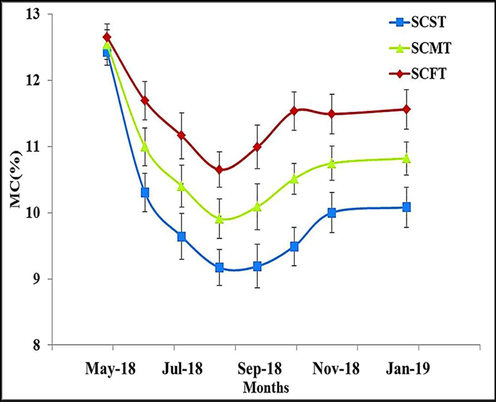
Rice bulk moisture content% variation stored at Shiraz facility during storage period at surface (SCST), midsection (SCMT) and Floor (SCFT).
Abadeh-Fars, The MC% of grain bulk stored at the AF warehouse followed a rather different pattern than those stored at the SC facility (Fig. 12). At all layers, the MC% decreased at a significantly (P < 0.05) slower rate and with a lesser magnitude than grain bulk stored in SC facilities. The dehydration rate at AFST, AFMT and AFFT from May to October was 0.50 PP.M−1, 0.35 PP.M−1 and 0.25 PP.M−1, respectively. Furthermore, a rehydration rate of 0.45 PP.M−1 (AFST), 0.30 PP.M−1 (AFMT) and 0.35 PP.M−1 (AFFT) was observed. The MC% of samples stored at the AF warehouse was higher than those stored at SC facilities at all times which may be due to weather differences between Abadeh and Shiraz. As described earlier in section 3.1 Abadeh had cooler climate with less intense sun light in comparison to Shiraz.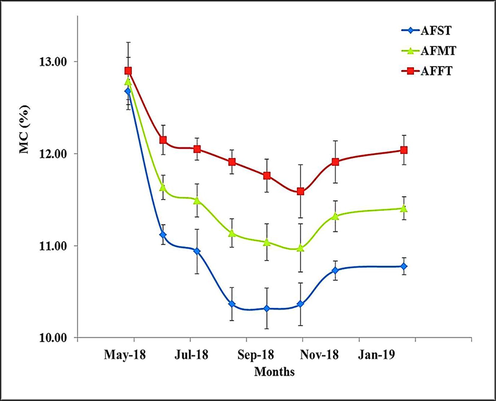
Rice bulk moisture content% variation stored at Abadeh facility during storage period at the surface (AFST), midsection (AFMT) and Floor (AFFT).
3.6 Moisture sorption isotherm
As illustrated in Fig. 13 Thai rice exhibited sigmoid-shaped type II sorption isotherms at both temperatures based on Al-Muhtaseb et al. (2002) classifications. This indicated the possibility of multilayer adsorption on starch granules due to their microporous surface structure which is typical of agricultural products (Wan et al. 2018). The typical “rounded knee” appearance in rice isotherms at high relative humidity was attributed to the formation of moisture monolayers and multilayers on the granular surfaces. (Saripella, Mallipeddi and Neau 2014). Furthermore, the non-linear increase of EMC relative to water activity was due to the inability of the rice matrix to retain vapor pressure in unity with decreasing moisture content (Toğrul and Arslan 2006). Therefore the moisture content inside the matrix demonstrates lower vapor pressure and tends to change as a function of atmospheric humidity (Esfe et al. 2022a, Caurie 1971, Esfe et al. 2022c).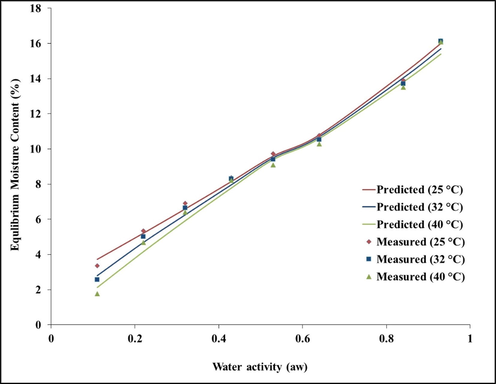
Moisture sorption isotherm of rice fitted with GAB model.
Increasing the temperature from 25 °C to 40 °C at constant water activities resulted in a downshift of EMC to lower values. This phenomenon was due to the elevation in water vapor pressure of the moisture which facilitates the moisture transfer from the rice bulk matrix to the surrounding atmosphere (Siripatrawan and Jantawat 2006). Besides this, temperature changes within the matrix could affect the mobility of the molecules as well as the dynamic equilibrium between water vapor and adsorbed phases (Rohvein, Santalla and Gely 2004). At higher temperatures the water molecules possessed higher energies facilitating their break away from water binding sites within the matrix resulting in lower EMC (Wani and Kumar 2016). Moreover, increasing the temperature at fixed EMC values resulted in higher water activity values. This could result in elevated physicochemical and biological reactions rate leading to the disintegration of the food material (Staudt et al. 2013, Eftekhari, Hashemian and Toghraie 2020).
3.7 Modelling of moisture sorption isotherm
The sorption isotherm was analysed using a range of models based on their R-square (R2), root mean square error (RSME) and mean relative percentage error (Pe). The model providing the highest R2 value and lowest RMSE and Pe values are found fit with the experimental values (Xia et al. 2022, Babajamali et al. 2022). In this study the experimental values were best fitted with GAB followed by Henderson, Oswin, Smith and Halsey models providing the highest R2 values (Table 2). Amongst these five models, GAB had the least Pe value (Pe < 5.0) making it the most suitable and well-fitted model of other models. BET, Chirif-Iglasias (C&I) and Kuhn models provided the most ill-fitted models with the lowest R2 values. BET models are more suitable for explaining isotherms below water activity of 0.4 and C&I models are suitable for fruits with high sugar content (Al-Muhtaseb et al. 2002, Khajekhabaz et al., 2018, Khabaz et al., 2022). Therefore, the GAB model was found the most suitable model to predict and explain the adsorption behaviour of stored rice. The superiority of GAB models to others might be due to including the monolayer moisture content (Mo) of the matrix while others do not (Wani and Kumar 2016). In the current study, at both storage locations, the rice bulk MC content increased to values ranging from 10.0% and 12.5% from September onwards. Based on the sorption isotherms and the fitted GAB models (Fig. 8) the water activity values ranged from 0.50 to 0.80 regardless of the equilibrium temperature. Dry matter food including rice grains is susceptible to mold and yeast contamination at water activities above 0.70 (Tapia et al., 2020). Abdullah et al. (2000) reported that the visible appearance of fungi was observed after 57 ± 2, 20 ± 2 and 13 ± 1 days at water activities of 0.65, 0.75 and 0.80, respectively. The moisture content for ordinary rice grains having a water activity of 0.65 at 25 °C was 12% (dry basis) which is similar to the AFFT and AFMT grain bulk layers.
Model
Constant
Temperature
25 °C
32 °C
40 °C
GAB
Xm
0.39
8.55
10.24
C
53.1
10.91
5.5
K
0.10
0.49
0.53
R2
0.9961
0.9962
0.9894
RSME
0.24
0.36
0.44
Pe
0.22
0.13
0.11
Henderson
A
0.006
0.008
0.011
B
2.203
1.837
1.954
R2
0.9916
0.9629
0.9766
RSME
0.32
0.27
0.48
Pe
1.83
1.21
0.85
Chirife and iglasias
A
7.014
6.443
6.574
B
0.799
0.837
0.865
R2
0.713
0.651
0.6572
RSME
2.14
2.71
2.62
Pe
11.82
20.06
31.68
Halsey
A
446.811
331.403
187.721
B
3.064
2.766
2.759
R2
0.9063
0.8473
0.8774
RSME
1.22
1.30
1.51
Pe
7.25
12.37
20.54
Smith
A
4.892
3.962
4.012
B
4.671
4.805
5.003
R2
0.9208
0.8601
0.8996
RSME
1.12
1.11
1.37
Pe
5.24
9.43
15.95
Kuhn
A
0.796
0.736
0.858
B
6.679
5.735
6.210
R2
0.7211
0.6170
0.6655
RSME
2.11
2.39
2.59
Pe
11.56
19.62
31.11
Oswin
A
8.54
8.71
7.89
B
0.267
0.301
0.298
R2
0.947
0.891
0.930
RSME
0.85
1.14
0.94
Pe
4.9
8.9
15.6
3.8 Isosteric heat of sorption and entropy of sorption
At low MC content, the qst is at its maximum while it logarithmically decreased as the MC content increased in the rice (Fig. 14 (a)). The qst values at 25 °C, 32 °C and 40 °C were 5.47 kJ/mol for 3.36 g water/100 g dry matter (%), 5.59 kj/mol for 2.56 g water/100 g dry matter (%) and 5.74 for 1.77 g water/100 g dry matter (%), respectively. The required higher qst at low MC content was due to the significant influence of the highly active binding sites over the adsorbed molecules (Kaymak-Ertekin and Gedik 2004). These polar sites are located on the surface of the food material and are covered with water molecules producing a monomolecular layer tightly bound to the surface of grains (Edrisi Sormoli and Langrish 2015). Consequently, at lower MC values there was more resistance to water movement from the interior to the surface of the grain. However, increasing the MC value resulted in rice swelling and exposing new binding sites to the water leading to lower isosteric heat of sorption values (Toğrul and Arslan 2006). Similar results were reported by other studies for various cereal grains including rice, wheat, corn and sorghum (Moreira et al. 2010, Bonner and Kenney 2013, Samapundo et al. 2007, Iguaz and Vírseda 2007). Furthermore, the differential entropy of adsorption decreased as the MC content increased (Fig. 14(b)). This indicated a strong dependence between the binding sites, moisture and the surface (McMinn and Magee 2003). Understanding the correlation between the heat of sorption and moisture content could determine the state of sorbed water within the food matrix. This could be used as an indication of the physiochemical and microbiological stability of the food material during storage (Kaya and Kahyaoglu 2007). For instance, in the current study qst sharply decreases to values close to pure water vaporization heat at MC contents higher than 10 g.100 g−1 DS indicating substantial existence of free water. This could facilitate microbiological as well as chemical reactions such as reactions linked to enzymatic activity.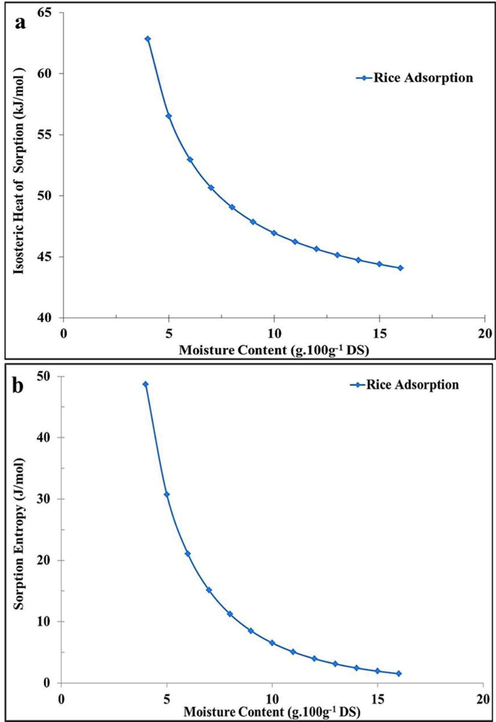
Enthalpy and entropy of sorption.
3.9 Enthalpy-entropy compensation theory
Variation of the heat of sorption (enthalpy) against the entropy of sorption specified the thermodynamics of the sorption process and the driving force behind it. As illustrated in Fig. 15(a), a linear correlation between the ΔS and Qst values with a coefficient of determination value of R2 = 0.9889 was obtained. The Tβ, ΔG and Thm were 439 K, 43.85 kJ.mol−1 and 305.315 K, respectively. The significant difference between Tβ and Thm indicated that compensation theory validly described the adsorption process. The temperature did not affect ΔS and Qst at specific moisture contents whereas enthalpy was the main influencer (Alpizar-Reyes et al. 2017). Similar findings were reported by other studies dealing with potato, mint leaf, dehydrated yacon bagasse and herbal tea thermodynamic properties (McMinn and Magee 2003, Dalgıç et al. 2012, Carvalho Lago and Noreña 2015, Červenka, Hloušková and Žabčíková 2015). Moreover, the obtained ΔG value of more than zero (43.85 kJ.mol−1) indicates the water adsorption process was not spontaneous, especially during the rehydration process. Similar results in other starchy products containing a high quantity of amylopectin and high amylose were observed (Carvalho Lago and Noreña 2015, McMinn et al. 2005). Furthermore, the compensation theory successfully modeled the effect of temperature on sorption behavior using equations 9 and 10. The linear correlation between ln ((1/Tβ-1/T) ln (aw)) and moisture content was illustrated in Fig. 15(b); indicating that the temperature-moisture content relationship followed a power law. The K1 and K2 values obtained from the linear regression were found to be 3261.50 K and 0.17, respectively.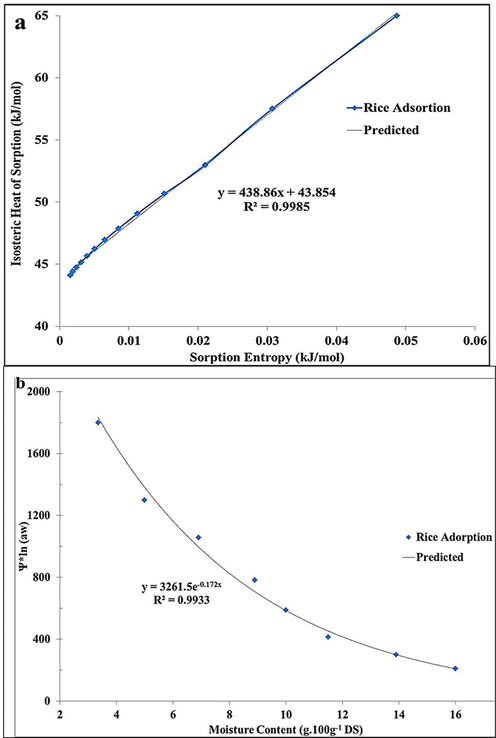
Compensations Theory.
3.10 Most suitable storage conditions
Relating rice moisture content, its thermodynamic properties and temperature radiance at the boundary area determined the most suitable storage conditions. Based on the information provided in sections 3.4 and 3.5 moisture migration was increased when the maximum temperature difference at intra-boundary areas was above 2.5 °C. Adsorption isotherms illustrated that MC% of stored rice should not surpass 11% to avoid water activity surge and stability deterioration. The depreciation of MC% during storage in the summer months especially at the Shiraz warehouse could reduce its quality and market acceptability. Therefore, the recommended combination of storage temperature and relative humidity should range from 20.0 °C to 28.5 °C and 15.0% to 25%, respectively. The aforementioned requirements could be achieved by managing the time of storage and organization of stored bags. For instance, spoilage risk at the Abadeh facility could be managed by reducing the storage duration 7 months. At Shiraz warehouse providing more space between stored lines could facilitate the free flow of air and reduce the chances of condensation and moisture accumulation.
4 Conclusion
This study dealt with characterizing the impact of extrinsic factors on rice dehydration-rehydration cycle stored inside naturally ventilated facilities located in semi-arid geography. The observed differences in ambient conditions between the two warehouses at the same timeframes were due to outside temperature dissimilarities rather than relative humidity. In this sense, the main contributors to air temperature fluctuations during the storage period were the solar radiation intensity and seasonal changes in the designated terrains. The observed differences in rice bulk dehydration and rehydration cycle trends at Abadeh and Shiraz warehouses augment the importance of this issue.
The sorption process of Thai rice was presented by a type II sigmoid isotherm which was best fitted with the GAB equation model. The isosteric heat of absorption calculated by Clausius–Clapeyron equation followed a power model law with moisture content. The compensation theory successfully illustrated that the process was enthalpy driven rather than temperature influenced and non-spontaneous. A combination of storage temperature above between 20 °C and 28.5 °C and relative humidity of below 15% to 25% would be recommended. Hence, it could be concluded that naturally ventilated storage facilities if properly managed could be an economical and straightforward alternative for storing hygroscopic grains in developing countries.
Acknowledgment
The authors would like to acknowledge and appreciate the financial support provided by the Fars Provence Grain Company and Commercial Services (FGCCS).
Declaration of Competing Interest
The authors declare that they have no known competing financial interests or personal relationships that could have appeared to influence the work reported in this paper.
References
- Fungal spoilage of starch-based foods in relation to its water activity (aw) J. Stored Prod. Res.. 2000;36:47-54.
- [Google Scholar]
- Enthalpy-Entropy compensation in sorption phenomena: application to the prediction of the effect of temperature on food isotherms. J. Food Sci.. 1986;51:1547-1549.
- [Google Scholar]
- Moisture sorption isotherm characteristics of food products: a review. Food Bioprod. Process.. 2002;80:118-128.
- [Google Scholar]
- Thermodynamic sorption properties and glass transition temperature of tamarind seed mucilage (Tamarindus indica L.) Food Bioprod. Process.. 2017;101:166-176.
- [Google Scholar]
- Validation of a heat, moisture and gas concentration transfer model for soybean (Glycine max) grains stored in plastic bags (silo bags) Biosyst. Eng.. 2017;158:23-37.
- [Google Scholar]
- Pareto multi-objective optimization of tandem cold rolling settings for reductions and inter stand tensions using NSGA-II. ISA Trans. 2022
- [Google Scholar]
- Bartosik, R. E., Rodriguez, J.C., Cardoso, L., 2008. Storage of corn, wheat, soybean and sunflower in hermetic plastic bags. In: International Grain Quality and Technology Congress, 15-18. Chicago, IL.
- Natural colonization of rice by arbuscular mycorrhizal fungi in different production areas. Rice Sci.. 2018;25:169-174.
- [Google Scholar]
- Moisture sorption characteristics and modeling of energy sorghum (Sorghum bicolor (L.) Moench) J. Stored Prod. Res.. 2013;52:128-136.
- [Google Scholar]
- Thermodynamic analysis of sorption isotherms of dehydrated yacon (Smallanthus sonchifolius) bagasse. Food Biosci.. 2015;12:26-33.
- [Google Scholar]
- A practical approach to water sorption isotherms and the basis for the determination of optimum moisture levels of dehydrated foods. Int. J. Food Sci. Technol.. 1971;6:85-93.
- [Google Scholar]
- Moisture adsorption isotherms and thermodynamic properties of green and roasted Yerba mate (Ilex paraguariensis) Food Biosci.. 2015;12:122-127.
- [Google Scholar]
- Food Security in the Face of Salinity, Drought, Climate Change, and Population Growth. In: Khan M.A., Ozturk M., Gul B., Ahmed M.Z., eds. Halophytes for Food Security in Dry Lands. San Diego: Academic Press; 2016. p. :111-123.
- [Google Scholar]
- Quality changes in 12% moisture content canola stored in silo bags under Canadian Prairie conditions. J. Stored Prod. Res.. 2016;68:33-43.
- [Google Scholar]
- Transverse vibration analysis of double-walled carbon nanotubes in an elastic medium under temperature gradients and electrical fields based on nonlocal Reddy beam theory. Mater. Sci. Eng. B. 2023;291:116220
- [Google Scholar]
- Evaluation of the operating system of a storage unit for drying silos and the quality of rice grains. Res. Soc. Dev.. 2020;9:e235997073.
- [Google Scholar]
- Effect of drying methods on the moisture sorption isotherms and thermodynamic properties of mint leaves. J. Food Sci. Technol.. 2012;49:439-449.
- [Google Scholar]
- Moisture sorption isotherms and net isosteric heat of sorption for spray-dried pure orange juice powder. LWT Food Sci. Technol.. 2015;62:875-882.
- [Google Scholar]
- Optimal vibration control of multi-layer micro-beams actuated by piezoelectric layer based on modified couple stress and surface stress elasticity theories. Physica A. 2020;546:123998
- [Google Scholar]
- A novel integrated model to improve the dynamic viscosity of MWCNT-Al2O3 (40: 60)/Oil 5W50 hybrid nano-lubricant using artificial neural networks (ANNs) Tribol. Int. 2022:108086.
- [Google Scholar]
- Application of artificial intelligence and using optimal ANN to predict the dynamic viscosity of Hybrid nano-lubricant containing Zinc Oxide in Commercial oil. Colloids Surf. A Physicochem. Eng. Asp. 2022;647:129115
- [Google Scholar]
- Prediction the dynamic viscosity of MWCNT-Al2O3 (30: 70)/Oil 5W50 hybrid nano-lubricant using Principal Component Analysis (PCA) with Artificial Neural Network (ANN) Egyptian Informatics J. 2022
- [Google Scholar]
- Water sorption isotherms for lemon peel at different temperatures and isosteric heats. LWT Food Sci. Technol.. 2008;41:18-25.
- [Google Scholar]
- Mathematical modelling of heat and moisture transfer of wheat stored in plastic bags (silobags) Biosyst. Eng.. 2009;104:72-85.
- [Google Scholar]
- Numerical investigation of rigidity and flexibility parameters effect on superstructure foundation behavior using three-dimensional finite element method. Case Stud Construct. Mater. 2023:e01867.
- [Google Scholar]
- Moisture desorption isotherms of rough rice at high temperatures. J. Food Eng.. 2007;79:794-802.
- [Google Scholar]
- A Three-Dimensional, asymmetric, and transient model to predict grain temperatures in grain storage bins. Trans. ASAE. 2005;48:263-271.
- [Google Scholar]
- Temperature fluctuations and moisture migration in wheat stored for 15 months in a metal silo in Canada. J. Stored Prod. Res.. 2009;45:82-90.
- [Google Scholar]
- Three-dimensional transient heat, mass, and momentum transfer model to predict conditions of canola stored inside silo bags under canadian prairie conditions: Part II. Model of canola bulk temperature and moisture content. Trans. ASABE. 2015;58:1135-1144.
- [Google Scholar]
- Numerical study of the natural convection of heat and 2-D mass of grain stored in cylindrical silos. Agrociencia. 2004;38:17.
- [Google Scholar]
- Moisture sorption and thermodynamic properties of safflower petals and tarragon. J. Food Eng.. 2007;78:413-421.
- [Google Scholar]
- Sorption isotherms and isosteric heat of sorption for grapes, apricots, apples and potatoes. LWT Food Sci. Technol.. 2004;37:429-438.
- [Google Scholar]
- Vibration and dynamic analysis of a cantilever sandwich microbeam integrated with piezoelectric layers based on strain gradient theory and surface effects. Appl. Math. Comput.. 2022;419:419.
- [Google Scholar]
- Free vibration analysis of sandwich micro beam with piezoelectric based on modified couple stress theory and surface effects. J. Simulation Anal. Novel Technologies Mech. Eng.. 2018;10:33-48.
- [Google Scholar]
- Models to predict the thermal state of rice stored in aerated vertical silos. Biosyst. Eng.. 2017;161:14-23.
- [Google Scholar]
- Impact of storage environment on the efficacy of hermetic storage bags. J. Stored Prod. Res.. 2017;72:83-89.
- [Google Scholar]
- Moisture sorption isotherms and isosteric heat of sorption of dry persimmon leaves. Food Biosci.. 2014;7:88-94.
- [Google Scholar]
- Enthalpy–entropy compensation in sorption phenomena of starch materials. Food Res. Int.. 2005;38:505-510.
- [Google Scholar]
- Thermodynamic properties of moisture sorption of potato. J. Food Eng.. 2003;60:157-165.
- [Google Scholar]
- Validation of a finite–element stored grain ecosystem model. Trans. ASAE. 2002;45:1465.
- [Google Scholar]
- Water adsorption and desorption isotherms of chestnut and wheat flours. Ind. Crop. Prod.. 2010;32:252-257.
- [Google Scholar]
- Rice drying, storage and processing: effects of post-harvest operations on grain quality. Rice Sci.. 2022;29:16-30.
- [Google Scholar]
- Simulation of the temperature of barley during its storage in cylindrical silos. Math. Comput. Simul. 2019;157:1-14.
- [Google Scholar]
- Post-harvest loss and grain storage technology-a review. Turkish J. Agric.-Food Sci. Technol.. 2021;9:75-83.
- [Google Scholar]
- The comparison of interstitial relative humidity and temperatures of hermetic and polypropylene bag for wheat grain storage under different agro-climatic conditions of rice-wheat ecosystem of Pakistan: Effect on seed quality and protection against insect pests. J. Stored Prod. Res.. 2022;96:101936
- [Google Scholar]
- Note: Estimation of Sorption Isotherm and the Heat of Sorption of Quinoa (Chenopodium quinoaWilld.) Seeds. Food Sci. Technol. Int.. 2004;10:409-413.
- [Google Scholar]
- Sorption isotherms and isosteric heats of sorption of whole yellow dent corn. J. Food Eng.. 2007;79:168-175.
- [Google Scholar]
- Crospovidone interactions with water. II. Dynamic vapor sorption analysis of the effect of Polyplasdone particle size on its uptake and distribution of water. Int. J. Pharm.. 2014;475:174-180.
- [Google Scholar]
- Post-harvest kernel discoloration and fungi activity in long-grain hybrid, pureline and medium-grain rice cultivars as influenced by storage environment and antifungal treatment. J. Stored Prod. Res.. 2019;81:91-99.
- [Google Scholar]
- Determination of Moisture Sorption Isotherms of Jasmine Rice Crackers Using BET and GAB Models. Food Sci. Technol. Int.. 2006;12:459-465.
- [Google Scholar]
- Souza, K.B.E., Binelo, M.O., 2020. ANÁLISE COMPARATIVA DOS MODELOS KHATCHATOURIAN E DARCY-FORCHHEIMER DO FLUXO DE AR EM ARMAZÉNS GRANELEIROS. Salão do Conhecimento, 6.
- A new method for predicting sorption isotherms at different temperatures using the BET model. J. Food Eng.. 2013;114:139-145.
- [Google Scholar]
- Tapia, M.S., Alzamora, S.M., Chirife, J., 2020. Effects of water activity (aw) on microbial stability as a hurdle in food preservation. In: Water activity in foods: Fundamentals and applications, pp. 323-355.
- Moisture sorption behaviour and thermodynamic characteristics of rice stored in a chamber under controlled humidity. Biosyst. Eng.. 2006;95:181-195.
- [Google Scholar]
- Sorption isotherm and state diagram for indica rice starch with and without soluble dietary fiber. J. Cereal Sci.. 2018;80:44-49.
- [Google Scholar]
- Moisture sorption isotherms and evaluation of quality changes in extruded snacks during storage. LWT. 2016;74:448-455.
- [Google Scholar]
- Using feed-forward perceptron Artificial Neural Network (ANN) model to determine the rolling force, power and slip of the tandem cold rolling. ISA Trans 2022
- [Google Scholar]
- Changes in physicochemical, cooking and sensory characteristics of rice shifted from low-temperature storage. Grain Oil Sci. Technol.. 2018;1:8-14.
- [Google Scholar]
- Review of the effects of different processing technologies on cooked and convenience rice quality. Trends Food Sci. Technol.. 2017;59:124-138.
- [Google Scholar]
- Ageing of stored rice: changes in chemical and physical attributes. J. Cereal Sci.. 2002;35:65-78.
- [Google Scholar]
- The ageing mechanism of stored rice: a concept model from the past to the present. J. Stored Prod. Res.. 2015;64:80-87.
- [Google Scholar]


