

Translate this page into:
Efficient photocatalytic degradation of methyl orange dye using facilely synthesized α-Fe2O3 nanoparticles
-
Received: ,
Accepted: ,
This article was originally published by Elsevier and was migrated to Scientific Scholar after the change of Publisher.
Peer review under responsibility of King Saud University.
Abstract
In this paper, α-Fe2O3 nanoparticles were fabricated via the combustion process using glucose and sucrose as organic fuels for the first time. The fabricated products were characterized using XRD, FT-IR, HR-TEM, and UV–vis spectrophotometer. The average crystallite size of the α-Fe2O3 samples, which were synthesized using glucose and sucrose fuels, is 27.25 and 6.13 nm, respectively. The HR-TEM images confirmed the presence of spherical and irregular shapes with an average diameter of 31.92 and 8.83 nm for the α-Fe2O3 samples, which were synthesized using glucose and sucrose fuels, respectively. The optical energy gap of the α-Fe2O3 samples, which were synthesized using glucose and sucrose fuels, is 2.00 and 2.48 eV, respectively. Additionally, the synthesized α-Fe2O3 samples were employed as a photocatalyst for the degradation of methyl orange dye under UV irradiations in the absence and presence of hydrogen peroxide. The optimum pH, irradiation time, and dose of α-Fe2O3 that achieved the highest degradation efficiency in the presence of hydrogen peroxide (82.17 % in the case of using an α-Fe2O3 sample which was synthesized using glucose or 95.31 % in the case of using an α-Fe2O3 sample which was synthesized using sucrose) are 3, 100 min, and 0.05 g, respectively.
Keywords
α-Fe2O3 nanoparticles
Methyl orange dye
Photocatalytic degradation
Characterization

1 Introduction
Methyl orange is a toxic azo dye that is soluble in water. It is also classified as an anionic or acidic dye. It may result in diarrhea and nausea. Exposure to high doses of methyl orange dye can be fatal (Amenaghawon et al., 2022; Carolin et al., 2021; Wu et al., 2021). Because methyl orange dye is stable, non-biodegradable, and soluble in water, it is hard to remove it from aqueous media using conventional water treatment methods (Raliya et al., 2017; Zyoud et al., 2015). Dye contamination in effluents can be removed in three ways: biological degradation, physical separation, or chemical processes, each of which has advantages and disadvantages (Ahmad et al., 2015). Ion exchange, adsorption, membrane filtration, coagulation–flocculation, advanced oxidation processes, and aerobic–anaerobic digestion are all viable technologies for removing organic materials from wastewater, most notably dyes (Kumar Sinha et al., 2021; Yadav and Dindorkar, 2022; Zhao et al., 2021; Nnaji et al., 2022; Gadow and Li, 2020; Hegazey et al., 2020; Alharbi and Abdelrahman, 2020; Abdelrahman et al., 2019). Advanced oxidation processes are the most favorable of all these techniques due to their low cost, low temperature operation, and ability to convert organic contaminants to harmless water (H2O) and carbon dioxide (CO2) (Hegazey et al., 2020; Alharbi and Abdelrahman, 2020; Abdelrahman et al., 2019; Abdelrahman and Hegazey, 2019). It is well established that photocatalysis is extremely effective in removing organic dyes. Thus, ultraviolet light causes some electrons in the valence band of the catalyst to transfer to the conduction band. As a result, holes and electrons were produced on the catalyst surface. The holes and electrons then combine with water to form hydroxide free radicals, which are well-known for their tendency to degrade dyes into harmless gases, for example, water and carbon dioxide (Hegazey et al., 2020; Alharbi and Abdelrahman, 2020; Abdelrahman et al., 2019; Abdelrahman and Hegazey, 2019). Numerous catalysts have been utilized for degrading organic dyes, including polymeric hydrogel with embedded TiO2 nanoparticles, CuO/ZnO nanocomposite, graphitic carbon nitride, tellurium-based metal alloy, polyaniline/SnO2 nanospheres, α-Fe2O3, and CeO2/Ce2S3 composite (Mansurov et al., 2022; Yadav et al., 2022; tang Guo et al., 2022; Sayed et al., 2022; Rauf et al., 2022). Due to its non-toxicity, high efficiency, and resilience to corrosion, hematite (α-Fe2O3) is one of the most significant catalysts (Hegazey et al., 2020; Alharbi and Abdelrahman, 2020; Abdelrahman et al., 2019). Numerous techniques, including hydrothermal, thermal decomposition, microwave/ultrasound, electrospinning, co-precipitation, and combustion have been employed to synthesize α-Fe2O3 nanoparticles (Wang et al., 2017; Yang et al., 2018; Chizari Fard et al., 2017; Supattarasakda et al., 2013; Lassoued et al., 2018; Pu et al., 2014). However, these processes necessitate the use of expensive substances or complicated equipment. Due to its simplicity, low heat consumption, and low cost, the combustion process was employed to synthesize several nanoparticles. So, α-Fe2O3 nanoparticles were produced in this work using the combustion process. Glucose and sucrose were employed as organic fuels. Additionally, the synthesized nanoparticles were employed as a photocatalyst for the degradation of methyl orange dye. Additionally, several parameters affecting the degradation of methyl orange dye were examined, including the photocatalyst dose, time, initial pH, and initial methyl orange dye concentration.
2 Experimental
2.1 Chemicals
The utilized chemicals are glucose (C6H12O6), sucrose (C12H22O11), iron(III) nitrate nonahydrate (Fe(NO3)3·9H2O), hydrogen peroxide (H2O2), and methyl orange dye (C14H14N3NaO3S). Sigma-Aldrich Company provided all of the compounds mentioned above.
2.2 Synthesis of α-Fe2O3 nanoparticles
The fuel solution was prepared as the following; 0.5571 g of glucose or 0.5293 g of sucrose was dissolved in 60 mL of distilled water. The iron(III) solution was prepared as the following; 2 g of iron(III) nitrate nonahydrate was dissolved in 60 mL of distilled water. After that, fuel solution was added to iron(III) solution drop by drop with constant stirring at 200 °C until the complete solution evaporates. The powder that remained was collected and calcined for 2 hrs at 550 °C.
2.3 Photocatalytic degradation of methyl orange dye
The photocatalytic activity of the synthesized Fe2O3 nanoparticles on the degradation of methyl orange dye was studied under UV irradiation. In all photocatalysis experiments, 50 mL of 20 mg/L of methyl orange and 0.05 g of Fe2O3 nanoparticles was stirred in a dark place for 60 min then irradiated under a 15 W UV lamp. After that, the Fe2O3 nanoparticles were separated using a 5000-rpm centrifuge then the concentration of methyl orange dye in the filtrate was determined using a UV–Vis spectrophotometer at the maximum wavelength of the dye (465 nm). The preceding experiments were repeated with the addition of 2 mL of a 2 M solution of hydrogen peroxide. Experiments on the degradation of methyl orange dye in aqueous media were performed under a series of conditions, including dose of Fe2O3 nanoparticles (0.0125–0.20 g), pH (3–8), irradiation time (10–140 min), and methyl orange dye concentration (5–30 mg/L). The percent of photocatalytic degradation (% D) was calculated using Eq. (1).
Ce (mg/L) is the equilibrium concentration of the methyl orange dye whereas Co (mg/L) is the initial concentration of methyl orange dye.
2.4 Physicochemical measurements
The α-Fe2O3 products were analyzed using X-ray diffraction equipment (18 kW; Model D8 Advance; Bruker) equipped with monochromated Cu Kα radiation with a wavelength of 1.54 Å. A transmission electron microscopy was used to produce HR-TEM images of the α-Fe2O3 products. The α-Fe2O3 products were measured in the FT-IR range from 4000 to 400 cm−1 utilizing an FT-IR spectrophotometer (PerkinElmer Version 10.6.2). A UV–Vis spectrophotometer was used to determine the optical energy gap of α-Fe2O3 products and the absorption spectra of methyl orange (Jasco; Model v530).
3 Results and discussion
3.1 Characterization
Fig. 1A-B represents the synthetic mechanism of the α-Fe2O3 samples, which were obtained using glucose and sucrose fuels, respectively. Iron(III) nitrate nonahydrate reacts with fuel (glucose or sucrose) to produce α-Fe2O3 nanoparticles as well as N2, CO2, and H2O gases. The quantity of evolved gases and the reduction power of the fuels vary. As a result, the type of fuel affects the shape and/or crystallite size of the synthesized α-Fe2O3 samples. Fig. 2A-B represents the XRD patterns of the α-Fe2O3 samples, which were obtained using glucose and sucrose fuels, respectively. The obtained peaks are well matched with those of hematite in ICDD No. 01–076-4579. The crystal system of the synthesized hematite samples is Rhombohedral. The typical peaks of hematite at 2θ = 24.189, 33.206, 35.701, 40.934, 49.550, 54.154, 57.672, 62.557, and 64.137° are due to the (0 1 2), (1 0 4), (1 1 0), (1 1 3), (0 2 4), (1 1 6), (0 1 8), (2 1 4), and (3 0 0) crystal planes, respectively (Hegazey et al., 2020). The average crystallite size, which was determined using the Scherrer equation, of the α-Fe2O3 samples which were synthesized using glucose and sucrose fuels is 27.25 and 6.13 nm, respectively. Also, Fig. 3A-B represents the FT-IR spectra of the α-Fe2O3 samples, which were obtained using glucose and sucrose fuels, respectively. The bands, which appeared at 451 and 463 cm−1 in the α-Fe2O3 samples which were obtained using glucose and sucrose fuels, are attributed to the stretching vibration of the Fe-O bond, respectively. The bands, which appeared at 535 and 538 cm−1 in the α-Fe2O3 samples which were obtained using glucose and sucrose fuels, are attributed to the formation of hematite (α-Fe2O3) with no phase transformation, respectively (Hegazey et al., 2020). The bands, which appeared at 1636 and 1629 cm−1 in the α-Fe2O3 samples which were obtained using glucose and sucrose fuels, are attributed to the bending vibration of adsorbed water, respectively. The bands, which appeared at 3444 and 3428 cm−1 in the α-Fe2O3 samples which were obtained using glucose and sucrose fuels, are attributed to the stretching vibration of adsorbed water, respectively (Shalapy et al., 2021; Youssef et al., 2021; Abdelghany et al., 2021; Abdelbaset et al., 2020; Abdelrahman et al., 2021; Abdelrahman et al., 2020; Abdelrahman and Hegazey, 2019; Abdelrahman and Hegazey, 2019). Fig. 4A-B represents the HR-TEM images of the α-Fe2O3 samples, which were obtained using glucose and sucrose fuels, respectively. The results confirmed the presence of spherical and irregular shapes with a mean diameter of 31.92 and 8.83 nm in the α-Fe2O3 samples which were obtained using glucose and sucrose fuels, respectively. Also, the optical energy gap (Egap) of the Fe2O3 samples, which were synthesized using glucose and sucrose fuels, was determined using equation (2) (Hegazey et al., 2020).
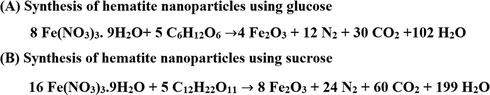
Synthetic mechanism of the α-Fe2O3 samples, which were synthesized using glucose (A) and sucrose (B) fuels.
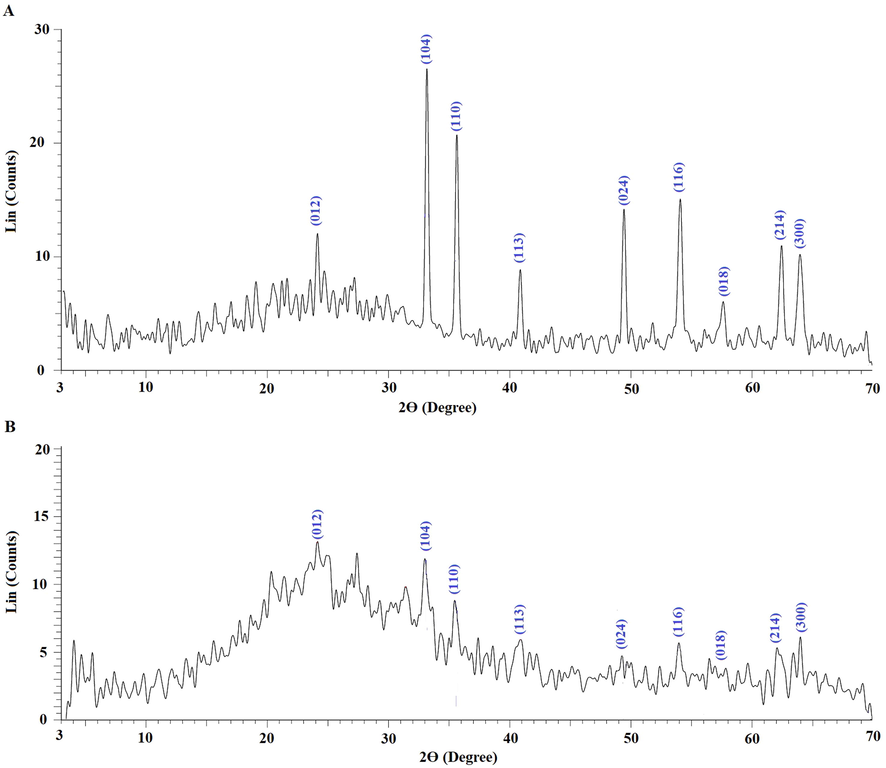
XRD patterns of the α-Fe2O3 samples, which were synthesized using glucose (A) and sucrose (B) fuels.
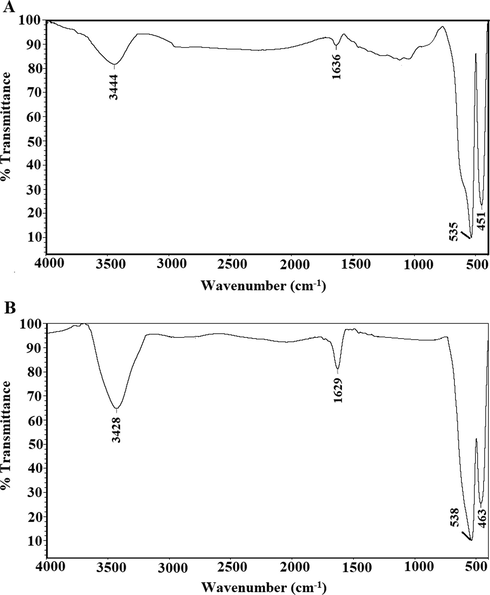
FT-IR of the α-Fe2O3 samples, which were synthesized using glucose (A) and sucrose (B) fuels.
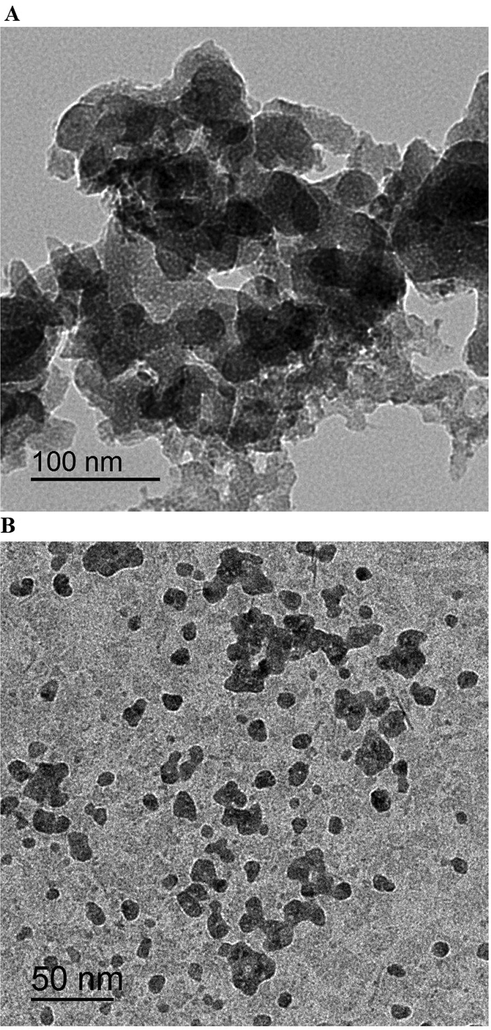
HR-TEM images of the α-Fe2O3 samples, which were synthesized using glucose (A) and sucrose (B) fuels.
n, K, and A are an integer depending on the kind of electronic transitions, a constant, and absorption coefficient, respectively. In the case of n = 2, direct permitted transitions were predominant. In the case of n = 0.5, indirect allowed transitions were predominant. Fig. 5A-B shows the plot of (Ahυ)2 versus hυ for the α-Fe2O3 samples which were obtained using glucose and sucrose fuels, respectively. The optical energy gap (Egap) was established by extrapolating the graph until (Ahυ)2 equals zero. The optical energy gap of the α-Fe2O3 samples, which were obtained using glucose and sucrose fuels, is 2.00 and 2.48 eV, respectively.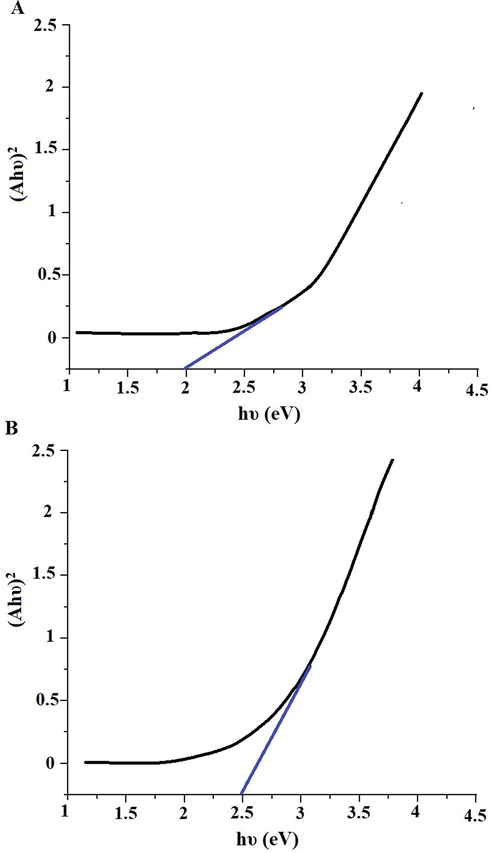
Plot of (Ahυ)2 versus hυ for the α-Fe2O3 samples, which were synthesized using glucose (A) and sucrose (B) fuels.
3.2 Photocatalytic degradation of methyl orange dye
3.2.1 Effect of pH
The photocatalytic degradation of the methyl orange dye employing α-Fe2O3 nanoparticles, which were obtained using glucose and sucrose, in the absence of H2O2 and its presence was examined at a pH = 3–8 as presented in Fig. 6A-B, respectively. According to the findings, as the pH of methyl orange dye decreases, the degradation efficiency increases. Consequently, pH = 3 is the optimum pH that achieves the maximum degradation of methyl orange dye. It was also observed that the percentage of methyl orange dye degradation increased in the presence of H2O2 due to its ability to generate more hydroxyl free radicals. Besides, the % degradation of methyl orange dye using the α-Fe2O3 sample which was synthesized using sucrose is higher than that synthesized using glucose. This is explained because the average crystallite size of the α-Fe2O3 sample which was synthesized using sucrose is less than that of the sample which was synthesized using glucose. Hence, the surface area and degradation efficiency of the α-Fe2O3 sample, which was synthesized using sucrose, have increased. Methyl orange is an anionic dye, and when the pH is low, α-Fe2O3 absorbs hydrogen ions (H+) from the medium, resulting in a positive charge and consequently the highest percentage of degradation. Methyl orange is an anionic dye, and when the pH is high, α-Fe2O3 absorbs hydroxide ions (OH–) from the medium, resulting in a negative charge and consequently the lowest percentage of degradation (Alharbi et al., 2021).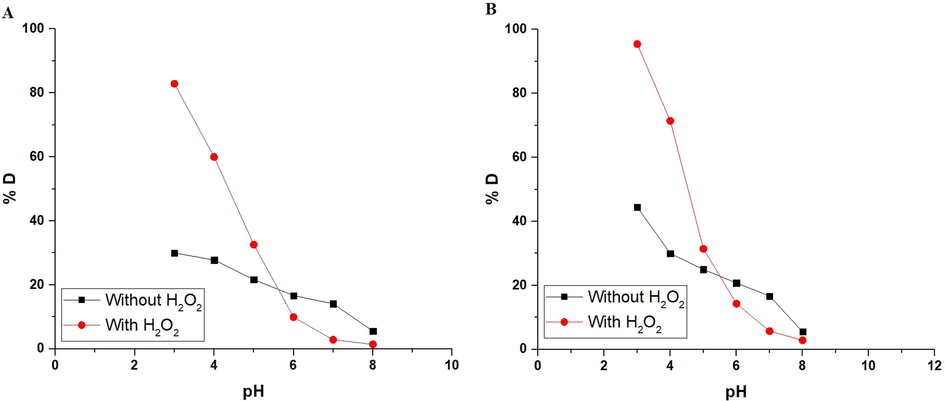
The plot of % D versus pH in the case of using α-Fe2O3 samples, which were synthesized using glucose (A) and sucrose (B) fuels.
3.2.2 Effect of irradiation time
To evaluate the effect of irradiation time on % degradation of methyl orange dye using the α-Fe2O3 nanoparticles, which were obtained using glucose and sucrose, in the absence of hydrogen peroxide and in its presence, time experiments were performed at a time = 10–140 min as clarified in Fig. 7A-B, respectively. The % degradation of methyl orange dye increased when the irradiation time increased from 10 to 100 min. Afterward, when the irradiation time is increased from 100 to 140 min, the % degradation remains almost constant because of the saturation of the active sites. Accordingly, 100 min is the optimal irradiation time that will be considered for following impacts. It was also observed that the percentage of methyl orange dye degradation increased in the presence of H2O2 due to its ability to generate more hydroxyl free radicals. The degradation of methyl orange dye using α-Fe2O3 nanoparticles matched well with the first-order kinetic model which was described by Eq. (2) (Hegazey et al., 2020).
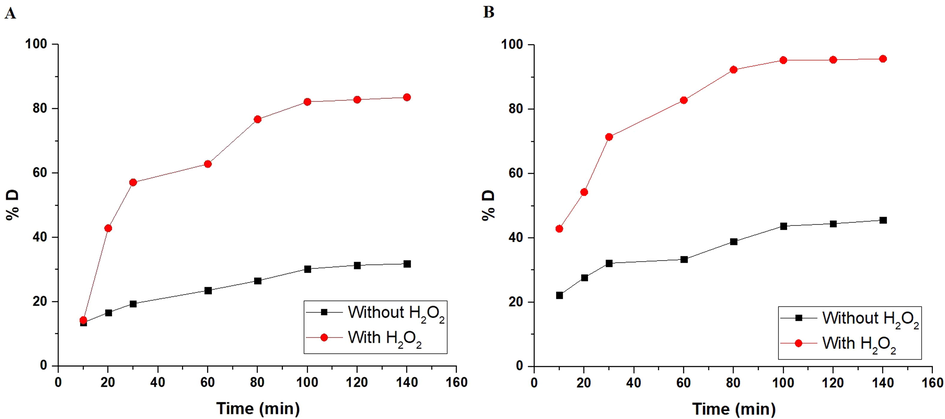
The plot of % D versus time in the case of using α-Fe2O3 samples, which were synthesized using glucose (A) and sucrose (B) fuels.
K (1/min) is a constant of first order. The graphs of ln (Co/Ce) versus time in the case of α-Fe2O3 nanoparticles, which were synthesized using glucose and sucrose, are presented in Fig. 8A-B. The K and correlation coefficients (R2) values were represented in Table 1.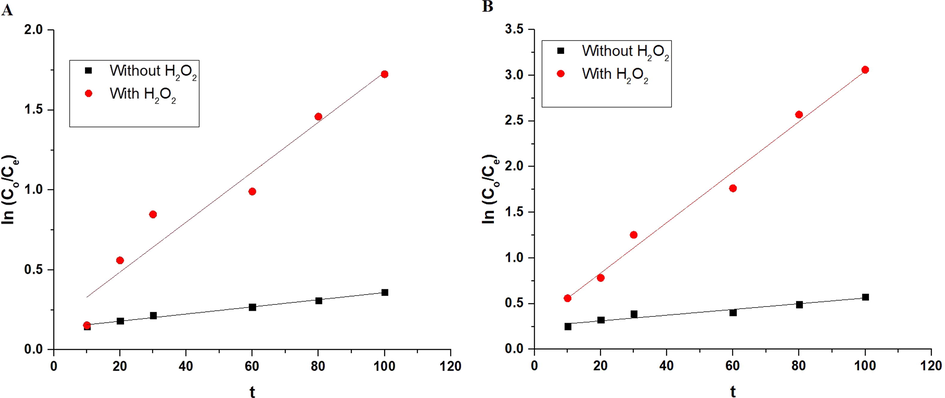
The plot of ln (Co/Ce) versus time in the case of using α-Fe2O3 samples, which were synthesized using glucose (A) and sucrose (B) fuels.
Condition
Constants
R2
K (1/min)
Synthesized Fe2O3 using glucose
Synthesized Fe2O3 using sucrose
Synthesized Fe2O3 using glucose
Synthesized Fe2O3 using sucrose
Without H2O2
0.986
0.921
0.0022
0.0031
With H2O2
0.929
0.985
0.0156
0.0276
3.2.3 Effect of photocatalyst dose
Fig. 9A-B shows the effect of the dose of α-Fe2O3 nanoparticles, which were obtained using glucose and sucrose, on the % degradation of methyl orange dye, respectively. The dose of α-Fe2O3 nanoparticles can rapidly alter the % degradation. Additionally, the experiments were performed using several amounts of α-Fe2O3 nanoparticles (0.0125–0.20 g). Using 0.05 g of the α-Fe2O3 nanoparticles, the degradation efficiency achieved its highest value. It was also observed that the percentage of methyl orange dye degradation increased in the presence of H2O2 due to its ability to generate more hydroxyl free radicals. With an increase in quantity of α-Fe2O3 nanoparticles, the active sites on the surface of the α-Fe2O3 nanoparticles are boosted, leading to a rise in the number of free radicals that can accelerate the degradation of methyl orange dye. The photocatalytic degradation of the methyl orange dye is reduced when the quantity of α-Fe2O3 nanoparticles is increased over a specific limit (0.05 g) because of the accumulation of α-Fe2O3 nanoparticles and subsequently decreasing surface area and active sites (Alharbi et al., 2021). Consequently, the ideal catalyst dose to be considered for future impacts is 0.05 g. The transition of the methyl orange dye solution from homogeneous to turbid, which reduces the penetration of UV irradiations into the methyl orange dye solution, also contributes to the decrease in photocatalytic activity. As a result, ultraviolet irradiations are scattered, and the percentage of methyl orange dye degradation is reduced (Alharbi et al., 2021).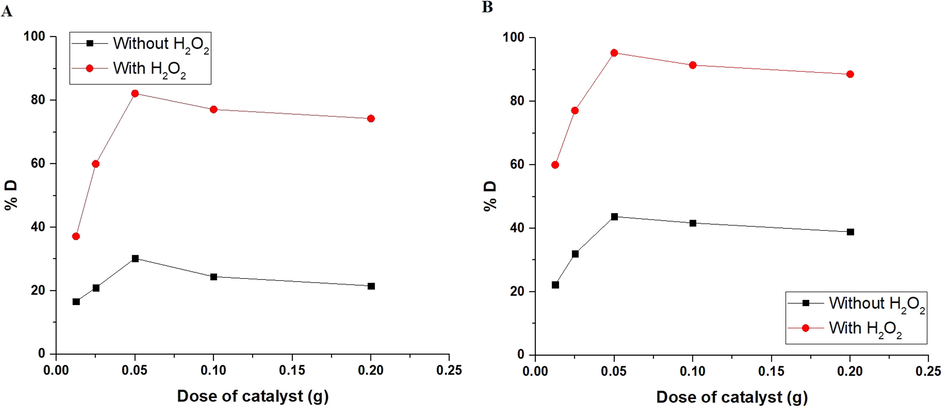
The plot of % D versus dose of catalyst in the case of using α-Fe2O3 samples, which were synthesized using glucose (A) and sucrose (B) fuels.
3.2.4 Effect of dye concentration
The photocatalytic degradation of the methyl orange dye using α-Fe2O3 nanoparticles, which were obtained using glucose and sucrose, in the absence of hydrogen peroxide and in its presence was examined at a concentration = 5–30 mg/L as shown in Fig. 10A-B, respectively. According to the results, the degradation efficiency reduces as the concentration rises. This performance may be attributed to the increased quantity of methyl orange dye adsorbed to the surface of hematite nanoparticles, which inhibits ultraviolet light from reaching the surface of hematite. Consequently, the production of hole/ electron pairs on the surface of hematite and the production of hydroxyl free radicals, which are principally responsible for the degradation of methyl orange, are limited (Alharbi et al., 2021). It was also observed that the percentage of methyl orange dye degradation increased in the presence of hydrogen peroxide due to its ability to generate more hydroxyl free radicals.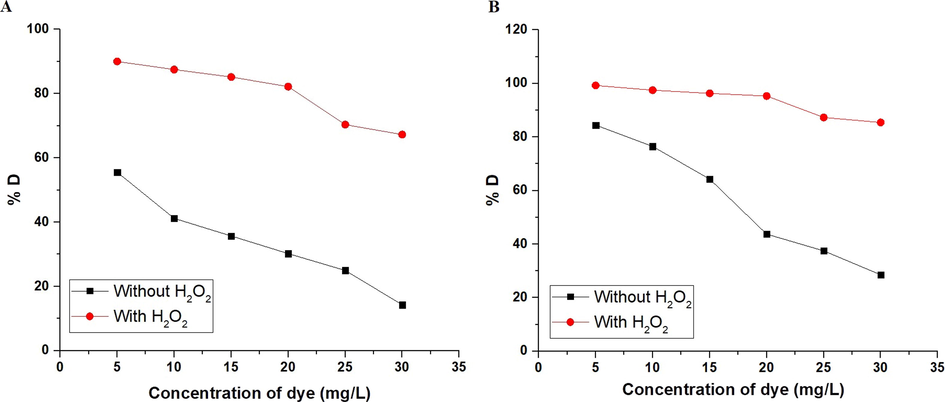
The plot of % D versus concentration of dye in the case of using α-Fe2O3 samples, which were synthesized using glucose (A) and sucrose (B) fuels.
3.2.5 Effect of regeneration and reusability
Three further batches of the synthesized α-Fe2O3 nanoparticles were regenerated then reused. Furthermore, for regenerating the hematite photocatalyst, α-Fe2O3 nanoparticles was carefully washed using hot distilled water observing the completion of the first batch, causing in an almost equivalent catalyst that was exploited for subsequent batches. In addition, the results confirmed that the photocatalytic efficiency of the α-Fe2O3 nanoparticles, which were obtained using glucose and sucrose, was conserved with a minor drop in the % degradation value as presented in Fig. 11A-B, respectively.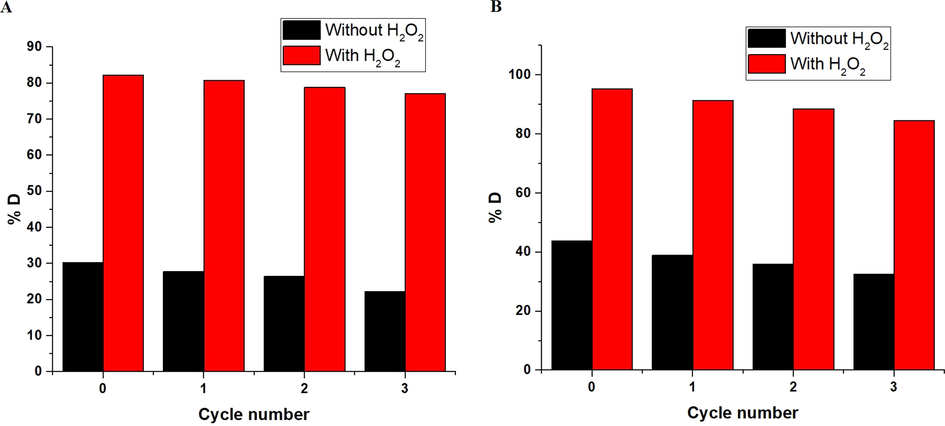
The plot of % D versus cycle number in the case of using α-Fe2O3 samples, which were synthesized using glucose (A) and sucrose (B) fuels.
3.2.6 Mechanism of photocatalytic degradation
The photocatalytic degradation of methyl orange dye is depicted in Fig. 12. Holes and electrons are created on the surface of α-Fe2O3 nanoparticles following UV irradiation. The holes and electrons then combine with water to form hydroxide free radicals, which are well-known for their tendency to degrade dyes into harmless gases, for example, water and carbon dioxide. Also, the addition of hydrogen peroxide can improve degradation efficiency. UV irradiation of a hydrogen peroxide solution generates enough energy to break the O—O bonds and produce additional hydroxide free radicals.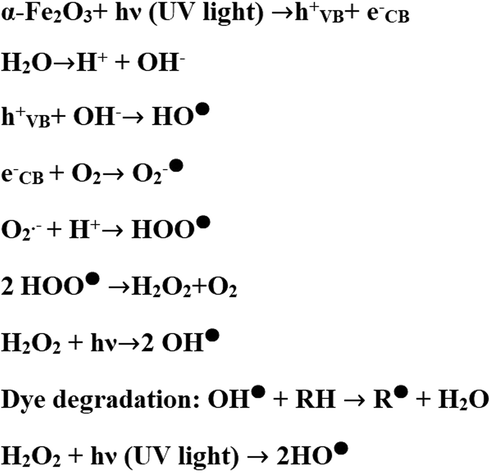
Mechanism of photocatalytic degradation of methyl orange dye.
3.2.7 Evaluation of photocatalytic performance of α-Fe2O3 nanoparticles in comparison to that of alternative photocatalysts
The results of photocatalytic degradation of methyl orange dye using α-Fe2O3 nanoparticles are compared to that obtained using various photocatalysts as clarified in Table 2 (Hanafi and Sapawe, 2020; Gomathi Devi and Mohan Reddy, 2010; Mousavi et al., 2021; Regraguy et al., 2022). The degradation efficiency of the synthesized α-Fe2O3 nanoparticles reveals a high potential for methyl orange dye degradation.
Photocatalyst
% Degradation
Dose of catalyst (g)
Concentration of dye (mg/L)
Volume of dye (mL)
Ref
NiO
96.80
0.0375
10
50
(Hanafi and Sapawe, 2020)
Silver metallized TiO2 particles
76
0.04
10
250
(Gomathi Devi and Mohan Reddy, 2010)
La0.7Sr1.3CoO4
94
0.05
20
20
(Mousavi et al., 2021)
NiSO4/TiO2
75
0.1
10
100
(Regraguy et al., 2022)
Synthesized α-Fe2O3 using glucose
82.17
0.05
20
50
This study
Synthesized α-Fe2O3 using sucrose
95.31
0.05
20
50
This study
4 Conclusions
The present work used glucose and sucrose as organic fuels to produce α-Fe2O3 nanoparticles. FT-IR, XRD, HR-TEM, and UV–vis spectrophotometers were used to characterize the synthesized products. The average crystallite size of the α-Fe2O3 samples produced with glucose and sucrose is 27.25 nm and 6.13 nm, respectively. Additionally, the produced α-Fe2O3 samples were efficiently used as a photocatalyst in the absence of hydrogen peroxide and in its presence under UV irradiations to degrade methyl orange dye. The optimum pH, irradiation time, and dose of α-Fe2O3 that achieved the highest degradation efficiency in the presence of hydrogen peroxide (82.17 % in the case of using an α-Fe2O3 sample which was synthesized using glucose or 95.31 % in the case of using an α-Fe2O3 sample which was synthesized using sucrose) are 3, 100 min, and 0.05 g, respectively.
Declaration of Competing Interest
The author declares that he has no known competing financial interests or personal relationships that could have appeared to influence the work reported in this paper.
References
- Utilisation of wastes for low-cost synthesis of chitosan composites with nanosized sodium aluminium silicate hydrate and geopolymer/zeolite A for the removal of Hg(II) and Pb(II) ions from aqueous media. Int. J. Environ. Anal. Chem. In Press 2020
- [CrossRef] [Google Scholar]
- Facile Synthesis of CuO and Ag Nanoparticles by Thermal Decomposition of Novel Schiff Base Complexes. J. Inorg. Organomet. Polym. Mater.. 2021;31:4281-4299.
- [Google Scholar]
- Exploitation of Egyptian insecticide cans in the fabrication of Si/Fe nanostructures and their chitosan polymer composites for the removal of Ni(II), Cu(II), and Zn(II) ions from aqueous solutions. Compos. Part B Eng.. 2019;166:382-400.
- [Google Scholar]
- Facile Synthesis of HgO Nanoparticles Using Hydrothermal Method for Efficient Photocatalytic Degradation of Crystal Violet Dye Under UV and Sunlight Irradiation. J. Inorg. Organomet. Polym. Mater.. 2019;29:346-358.
- [Google Scholar]
- Utilization of waste aluminum cans in the fabrication of hydroxysodalite nanoparticles and their chitosan biopolymer composites for the removal of Ni(II) and Pb(II) ions from aqueous solutions: Kinetic, equilibrium, and reusability studies. Microchem. J.. 2019;145:18-25.
- [Google Scholar]
- Facile synthesis of Fe2O3 nanoparticles from Egyptian insecticide cans for efficient photocatalytic degradation of methylene blue and crystal violet dyes, Spectrochim. Acta - Part A Mol. Biomol. Spectrosc.. 2019;222:117195
- [Google Scholar]
- Facile fabrication of novel analcime/sodium aluminum silicate hydrate and zeolite Y/faujasite mesoporous nanocomposites for efficient removal of Cu(II) and Pb(II) ions from aqueous media. J. Mater. Res. Technol.. 2020;9:7900-7914.
- [Google Scholar]
- Utilization of rice husk and waste aluminum cans for the synthesis of some nanosized zeolite, zeolite/zeolite, and geopolymer/zeolite products for the efficient removal of Co(II), Cu(II), and Zn(II) ions from aqueous media. J. Hazard. Mater.. 2021;401:123813
- [Google Scholar]
- Recent advances in new generation dye removal technologies: Novel search for approaches to reprocess wastewater. RSC Adv.. 2015;5:30801-30818.
- [Google Scholar]
- Efficient photocatalytic degradation of malachite green dye using facilely synthesized hematite nanoparticles from Egyptian insecticide cans, Spectrochim. Acta - Part A Mol. Biomol. Spectrosc.. 2020;226:117612
- [Google Scholar]
- Facile synthesis of novel zinc sulfide/chitosan composite for efficient photocatalytic degradation of acid brown 5G and acid black 2BNG dyes. Alexandria Eng. J.. 2021;60:2167-2178.
- [Google Scholar]
- Hydroxyapatite-based adsorbents: Applications in sequestering heavy metals and dyes. J. Environ. Manage.. 2022;302:113989
- [Google Scholar]
- Sustainable approach to decolourize methyl orange dye from aqueous solution using novel bacterial strain and its metabolites characterization, Clean Technol. Environ. Policy.. 2021;23:173-181.
- [Google Scholar]
- Hydroxylated α-Fe2O3 nanofiber: Optimization of synthesis conditions, anionic dyes adsorption kinetic, isotherm and error analysis. J. Taiwan Inst. Chem. Eng.. 2017;70:188-199.
- [Google Scholar]
- Development of an integrated anaerobic/aerobic bioreactor for biodegradation of recalcitrant azo dye and bioenergy recovery: HRT effects and functional resilience. Bioresour. Technol. Reports.. 2020;9:100388
- [Google Scholar]
- Enhanced photocatalytic activity of silver metallized TiO2 particles in the degradation of an azo dye methyl orange: Characterization and activity at different pH values. Appl. Surf. Sci.. 2010;256:3116-3121.
- [Google Scholar]
- Influence of pH on the photocatalytic degradation of methyl orange using nickel catalyst. Mater. Today Proc.. 2020;31:339-341.
- [Google Scholar]
- Facile fabrication of hematite nanoparticles from Egyptian insecticide cans for efficient photocatalytic degradation of rhodamine B dye. J. Mater. Res. Technol.. 2020;9:1652-1661.
- [Google Scholar]
- Ammonium phosphomolybdate [(NH4)3PMo12O40] an inorganic ion exchanger for environmental application for purification of dye contaminant wastewater. J. Photochem. Photobiol. A Chem.. 2021;418:113427
- [Google Scholar]
- Synthesis, photoluminescence and Magnetic properties of iron oxide (α-Fe2O3) nanoparticles through precipitation or hydrothermal methods. Phys. E Low-Dimensional Syst. Nanostructures.. 2018;101:212-219.
- [Google Scholar]
- Photocatalytic degradation of organic textile dyes using tellurium-based metal alloy. Vacuum.. 2022;199:110960.
- [Google Scholar]
- Dynamics of diffusion-limited photocatalytic degradation of dye by polymeric hydrogel with embedded TiO2 nanoparticles. J. Catal.. 2022;406:9-18.
- [Google Scholar]
- Investigation of methyl orange photocatalytic degradation using La0.7Sr1.3CoO4 Ruddlesden-Popper nanoparticles. Ceram. Int.. 2021;47:20651-20658.
- [Google Scholar]
- Potential of Luffa cylindrica seed as coagulation-flocculation (CF) agent for the treatment of dye wastewater: Kinetic, mass transfer, optimization and CF adsorption studies. Arab. J. Chem.. 2022;15:103629
- [Google Scholar]
- Thickness effect of hematite nanostructures prepared by hydrothermal method for solar water splitting. Appl. Surf. Sci.. 2014;320:213-217.
- [Google Scholar]
- Recent advances and perspectives of g–C3N4–based materials for photocatalytic dyes degradation. Chemosphere.. 2022;295:133834.
- [Google Scholar]
- Photocatalytic degradation of methyl orange dye by pristine titanium dioxide, zinc oxide, and graphene oxide nanostructures and their composites under visible light irradiation. Appl. Nanosci.. 2017;7:253-259.
- [Google Scholar]
- New insight in photocatalytic degradation of textile dyes over CeO2/Ce2S3 composite. Phys. B Condens. Matter.. 2022;632:413760
- [Google Scholar]
- Photocatalytic degradation of methyl orange in the presence of nanoparticles NiSO4/TiO2. Nanotechnol. Environ. Eng. In Press 2022
- [CrossRef] [Google Scholar]
- Mesoporous polyaniline/SnO2 nanospheres for enhanced photocatalytic degradation of bio-staining fluorescent dye from an aqueous environment. Inorg. Chem. Commun.. 2022;139:109326
- [Google Scholar]
- Facile synthesis and characterisation of novel Sn/Si mixtures for the efficient removal of methylene blue and crystal violet dyes from aqueous media. Int. J. Environ. Anal. Chem. In Press 2021
- [CrossRef] [Google Scholar]
- Control of hematite nanoparticle size and shape by the chemical precipitation method. Powder Technol.. 2013;249:353-359.
- [Google Scholar]
- Preparation of mesoporous magnetic Fe2O3 nanoparticle and its application for organic dyes removal. J. Mol. Liq.. 2017;248:13-18.
- [Google Scholar]
- Study on the adsorption properties of methyl orange by natural one-dimensional nano-mineral materials with different structures. Sci. Rep.. 2021;11:1-11.
- [Google Scholar]
- Photocatalytic degradation of textile dyes using β-CD-CuO/ZnO nanocomposite. J. Phys. Chem. Solids. In press 2022
- [CrossRef] [Google Scholar]
- Adsorption behaviour of hexagonal boron nitride nanosheets towards cationic, anionic and neutral dyes: Insights from first principle studies. Colloids Surfaces A Physicochem. Eng. Asp.. 2022;640:128509
- [Google Scholar]
- Ultrafast response and recovery of single crystalline α-Fe2O3 nanorhombohedrons for trimethylamine sensing applications. Mater. Lett.. 2018;210:1-3.
- [Google Scholar]
- Facile Hydrothermal Procedure for the Synthesis of Sodium Aluminum Silicate Hydrate/Analcime and Analcime for Effective Removal of Manganese(II) Ions From Aqueous Solutions. J. Inorg. Organomet. Polym. Mater.. 2021;31:1035-1046.
- [Google Scholar]
- Highly-efficient PVDF adsorptive membrane filtration based on chitosan@CNTs-COOH simultaneous removal of anionic and cationic dyes. Carbohydr. Polym.. 2021;274:118664
- [Google Scholar]
- Optimizing photo-mineralization of aqueous methyl orange by nano-ZnO catalyst under simulated natural conditions. J. Environ. Heal. Sci. Eng.. 2015;13:1-10.
- [Google Scholar]


