

Translate this page into:
Efficient stepwise-purification and mechanism of germanium-containing materials with ammonium
⁎Corresponding authors. truepsyche@sina.com (Kun Yang), zhanglibopaper@126.com (Libo Zhang)
-
Received: ,
Accepted: ,
This article was originally published by Elsevier and was migrated to Scientific Scholar after the change of Publisher.
Peer review under responsibility of King Saud University.
Abstract
Germanium (Ge) is a dispersed metal and it is mainly recovered from secondary resources. In order to improve the purification efficiency of Ge-containing materials, a new method for purification of Ge-containing materials by ammonium was proposed. The results showed that the zinc (Zn) components in raw materials were complex, including water-soluble Zn and water-insoluble Zn, which should to be removed by the two-stage purification of primary water purification (PWP) and secondary ammonium purification (SAP). The results of single factor experiment on the process of SAP showed that under the optimal purification conditions of total ammonium concentration of 0.69 mol/L, pH of 2.5∼, liquid–solid ratio of 3:1 mL/g, reaction time of 10 min and reaction temperature of 20 °C, 95.68% Zn could be removed from raw materials. The purification mechanism indicated that the water-soluble Zn in the form of physical adsorption and water-insoluble Zn in the form of chemical adsorption can be removed in PWP stage and SAP stage, respectively. After the two-stage purification, the Zn component that was difficult to be removed by burning was greatly reduced, which provided favorable conditions for improving the quality of Ge concentrate.
Keywords
Germanium (Ge)
Stepwise-purification
Zinc (Zn)
Ammonium
Mechanism

1 Introduction
Germanium (Ge) is a dispersed metal and a non-renewable scarce strategic resource (Lei et al., 2011). Ge metal and its products are widely used in national defense, military and civil fields (Wang and He, 2005). In recent years, with the escalation of international conflicts, the Ge demand is increasing. Therefore, efficient utilization of limited Ge resources is of great practical significance to the high quality development of Ge industry. Ge is extracted from various secondary Ge-containing resources in industrial production, and the Ge production resources in China is mainly from zinc smelting process. Ge was extracted from Ge-containing zinc oxide dust by acid leaching, tannin precipitation, purification and roasting in domestic Ge smelting enterprises. This method has the advantages of short process, convenient and mature operation, it is a classical method for Ge enrichment in the world (Lei et al., 2011; Wang et al., 2005; Moskalyk, 2004). However, in the actual production of Ge enrichment by tannin precipitation, when tannins are coordinated with Ge, impurity metal ions in the solution will also enter the precipitation, especially the large amount of zinc (Zn) will affect the purity of tannin germanium residue (TGR) to some extent (Liang et al., 2008).
In order to improve the purity of TGR, researchers have tried to purify TGR in different systems. In traditional industry, water was used to remove impurities from TGR, which had a little effect on the removal of impurity Zn in the residue, and the removal efficiency of Zn was only about 80%. The purity of purified residue is still low. Researchers (Yang, 2019) purified TGR by HCl-NaCl, and the removal efficiency of impurity Ca, Pb, Zn and Fe reached 90%, 95%, 92% and 80%, respectively. However, the introduction of Cl- in the system will accelerate the corrosion of equipment and deteriorate the factory operating environment. After improving the process, the researchers (Xu, 2003) purified TGR twice by sulfuric acid, in which the main impurity content of Zn was reduced from 14% to 2.7%, As was reduced from 1.0% to 0.4%, S was reduced from 10.0% to 0.7%, and the loss of Ge reached 3.2%. In order to effectively remove Zn impurities from TGR, it is urgent to seek a new method of purifying TGR with higher efficiency.
Ammonium leaching process is characterized by mild reaction conditions and little corrosion to reaction equipment. Based on the reaction principle that NH4+ ions can selectively coordinate with Zn2+ to achieve high efficiency separation of Zn, the ammonium leaching process has been widely used in hydrometallurgy. The NH3-CH3COONH4-H2O system (Ma et al., 2018) was used to extract Zn from blast furnace gas ash. The impurity elements such as Pb, Fe, Ca and Si were difficult to be extracted, and the leaching rate of Zn reached 77.79%. A new process of ammonium sulfate leaching (Tang et al., 2007) was used to treat zinc dust. Under the optimal conditions, the Zn leaching rate reached 85.16%. In an experimental study (Zhang et al., 2017) on the recovery of Zn from low-grade zinc oxide ores by microwave roasting and ultrasonic irradiation of ammonia and ammonium citrate solutions, the maximum recovery of Zn was 88.57% under the best treatment conditions.
In order to improve the removal efficiency of impurity Zn, a new method of efficient stepwise-purification of Ge-containing materials by ammonium was proposed. Based on the PWP of Ge-containing materials, the effects of reagent type, total ammonium concentration, pH, reaction time and reaction temperature on the removal of Zn were studied in detail. Furthermore, the purification mechanism of Ge-containing materials by PWP and SAP were analyzed. This study is helpful to improve the purification efficiency of Ge-containing materials and has important practical significance for improving the utilization of Ge resources and promoting the high quality development of Ge industry.
2 Experimental
2.1 Materials and reagents
The raw materials used in this experiment was derived from the Ge extraction process of a smelting enterprise in Yunnan Province. All chemical reagents used in the experiment were analytically pure, as shown in Table 1. The solution was prepared with deionized water.
Reagent
Purity
Molecular formula
Manufacturer
Ammonium chloride
AR
NH4Cl
Tianjin Zhiyuan Reagent Co., Ltd
Ammonium sulfate
AR
(NH4)2SO4
Tianjin Zhiyuan Reagent Co., Ltd
Ammonium oxalate
AR
(NH4)2C2O4
Tianjin Zhiyuan Reagent Co., Ltd
Ammonium persulfate
AR
(NH4)2S2O8
Tianjin Zhiyuan Reagent Co., Ltd
Ammonium acetate
AR
CH3COONH4
Tianjin Zhiyuan Reagent Co., Ltd
Ammonium bicarbonate
AR
NH4HCO3
Fuchen (Tianjin) Chemical Reagent Co., Ltd
Sulfuric acid
95–98%
H2SO4
Xilong Scientific Co., Ltd
Sodium hydroxide
AR
NaOH
Tianjin Zhiyuan Reagent Co., Ltd
2.2 Experimental process
The flow chart of this experimental is shown in Fig. 1. The experiments were conducted in a PF-101S thermostatic heating magnetic stirrer (Gongyi Yuhua Instrument Co., Ltd.), and the reaction vessels were 500 mL glass beakers, as shown in Fig. 2.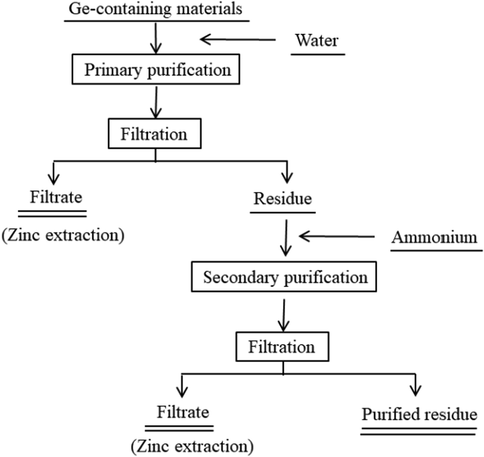
The flow chart of this experiment.
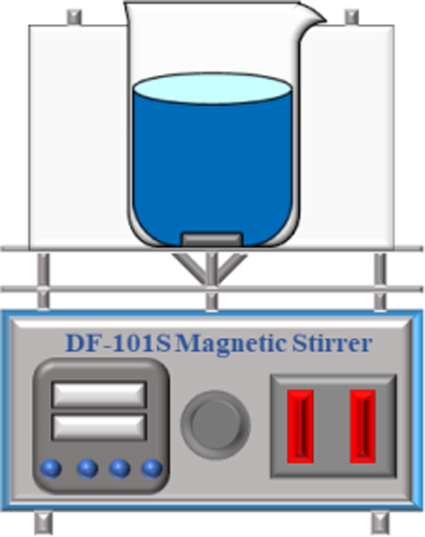
Diagram of purification experiment device.
In purification process, the parameters of regent type, total ammonium concentration, pH, reaction time and reaction temperature were studied separately. The experimental conditions were as follows: total ammonium concentration of 0.069–3.45 mol/L, pH of 0.5–7.5, reaction time of 5–120 min and reaction temperatures of 20–80 °C. The purified residue was filtered using a vacuum suction pump and dried in a drying box to a constant weight for analysis.
2.3 Characterization
X-ray fluorescence (XRF) (PANalytical Axios, Netherlands) was used to analyze the elemental composition of the samples. X-ray diffraction (XRD) (XʼPert3 powder diffractometer, PANalytical, Netherlands) was used to characterize the component phases of the samples. Scanning electron microscopy (SEM-EDS) (JSM 7401F, JEOL, Japan) was used to analyze the elements in the samples surface. Simultaneous thermogravimetry (TG) (STA 449F3, NETZSCH, Germany) was used to measure the thermochemical characteristics of the samples in the temperature range 30 to 800 °C at a heating rate of 10 °C/min. X-ray photoelectron spectroscopy (XPS) (PHI-5000 Versaprobe II, Ulvac-Phi, Japan) was used to analyze the chemical states of elements on the sample surface. Fourier transform infrared spectroscopy (FT-IR) (Bruker Tensor 27, Germany) was used to analyze the functional group information of the samples.
2.4 Methods
The content of water-soluble Zn in samples was determined by flame atomic absorption spectrometry. The samples were selectively leach soluble Zn with ammonia-ammonium chloride as solvent, and appropriate amount of anticyclic blood acid and stannous dichloride dihydrate were added as inhibitors to effectively separate soluble Zn such as zinc sulfate, zinc oxide and zinc carbonate from zinc sulfide and insoluble Zn salts. In dilute nitric acid medium, the absorbance of Zn was measured at 213.9 nm by using air-acetylene flame, and the soluble Zn content was calculated by standard curve method.
The content of acid-soluble Zn in samples was determined by Na2EDTA volumetric method. The samples were first leached in 8% H2SO4 medium at 85–90 °C. After filtration and separation, masking agent was added to filtrate to mask a small number of interference elements. In the buffer solution of acetic acid-sodium acetate with pH 5.5–6.0, the standard titration solution of Na2EDTA was titrated with xylenol orange as indicator. The measured result is the total amount of zinc and cadmium, and the content of zinc is deducted from the amount of cadmium.
The HYDRA/MEDUSA software (Zhou, 2015) was developed by Ignasi Puigdomenech, an inorganic chemistry specialist at the Royal Swedish Institute of Technology. It consists of two basic modules: HYDRA and MEDUSA. The MEDUSA module is calculated and mapped according to the chemical equilibrium system determined by HYDRA, which can use complex algorithms for equilibrium mapping. In this study, HYDRA/MEDUSA software was used to calculate the coordination chemical equilibrium process.
3 Results and discussion
3.1 Raw materials analysis
The XRF (Table 2) and chemical quantitative analysis (Table 3) were used to analyze the chemical composition of the raw materials. The semi-quantitative analysis results of elements in Table 2 show that the raw material consists of a large number of non-metallic elements O and S and a variety of metallic elements such as Zn, Mg, Ge and Fe. Due to the limitation that XRF technology cannot detect the content of elements between H and N, combined with the production practice of raw materials containing a large number of tannic acid (Laing et al., 2008), it can be inferred that there are still a large number of elements C and H in raw materials. Further analysis of the main components of the raw material in Table 3 shows that the main metal impurity elements contained in the raw material are Zn, Mg and Fe, among which the content of impurity Zn is the largest, which is about 12.89%. The non-metallic elements C and S in raw materials will have little influence on the quality of the purified residue due to the subsequent burning process.
Elements
O
Zn
S
Mg
Ge
Fe
Pb
Sb
As
Ti
Ca
Mn
Conc./%
38.83
19.54
17.05
4.73
2.54
1.40
0.34
0.68
0.13
0.44
0.32
0.67
Elements
Zn
Mg
Fe
Ge
As
CaO
TiO2
Pb
Sb
C
S
wt/%
12.89
2.75
1.13
1.59
0.23
0.42
0.40
0.16
0.54
10.53
10.45
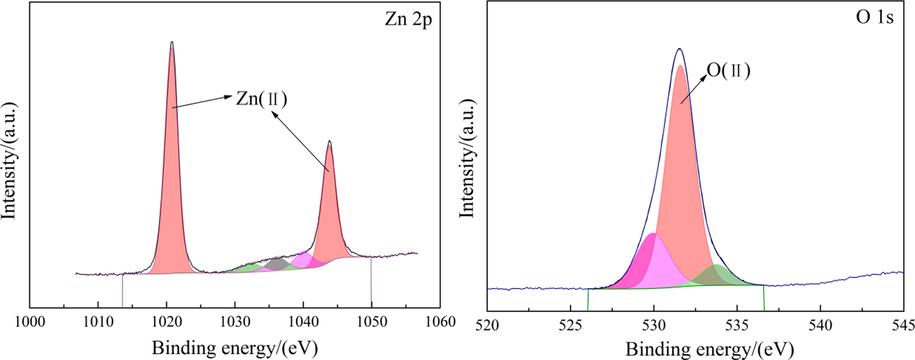
The XRD pattern of raw materials is shown in Fig. 3. The main phase composition of the raw materials includes ZnSO4, MgSO4, Zn2GeO4, Fe2(SO4)3 and Zn3(AsO4)2, etc. Fig. 4 shows the SEM-EDS of the raw materials. It can be seen that the distribution of elements S, O and Zn is similar, indicating the existence of ZnSO4. The signal of element Ge is completely distributed within the signal of elements S, O and Zn, indicating that Ge may be present in the sample in the form of germanium oxide or zinc germanate. Other elements, such as Fe, Sb and Ti, are difficult to judge because of their weak signals. In order to analyze the chemical states of the elements on the surface of raw materials, the XPS detailed spectrum is shown in Fig. 5. For the Zn 2p in Fig. 5, the binding energy at 1044 eV (Zn 2p1/2) and 1021 eV (Zn 2p3/2) is consistent with the characteristic peak of Zn(II) (Xue, 2020). The Zn 2p3/2 is often used to study the chemical state of the element Zn because of the stronger energy. In the detailed spectrum of Zn 2p3/2, the characteristic peak of binding energy at 1021.16 eV corresponds to Zn in Zn-O (Feng et al., 2021). For the O 1 s in Fig. 5, the characteristic peak of binding energy at 531.59 eV represents O(II), which is consistent with the oxide of zinc and zinc sulfate (Valtiner et al., 2007; Maticiuc et al., 2017). Therefore, it can be determined that the element Zn in the raw materials is present in the form of zinc sulfate.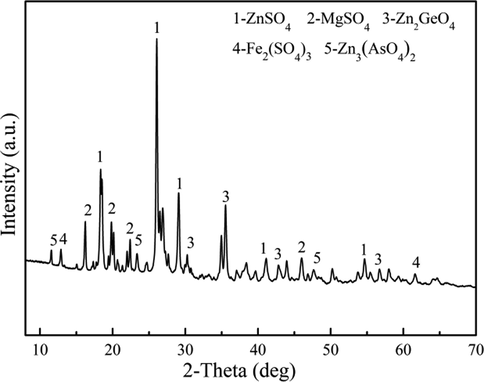
XRD pattern of raw materials.
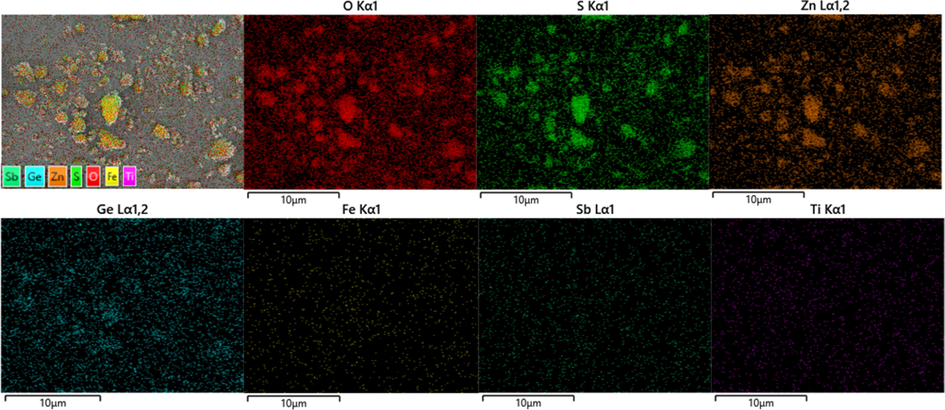
SEM-EDS of raw materials.
XPS detailed spectrum of the elements on the surface of raw materials.
3.2 Purification method
The separation of Zn by ammonium leaching process is based on the formation of soluble complex between Zn2+ and NH4+ ligand. Fig. 6(a) shows the distribution of zinc-ammonium coordination equilibrium species in the Zn2+-NH4+-SO42-–H2O system. In the pH range of 0.5 to 7.5, the impurity zinc components will exist in the solution in the form of zinc-ammonia complex. This indicates that it is desirable to use ammonium in the secondary purification process. In addition, when the solution pH value increases within 0.5–7.5, the zinc species gradually changes from ZnNH32+ to the more stable complex Zn(NH3)42+. Therefore, the larger pH value is conducive to the zinc-ammonia coordination reaction during purification. In order to further determine the appropriate pH range of the reaction system during purification, the E-pH diagram of the Zn-H2O system is drawn in Fig. 6(b). It shows that when the pH value of the system exceeds 5.9, the ionic Zn(II) in the solution will hydrolyze and produce precipitated Zn(OH)2. In order to prevent zinc ions in the solution from precipitating again and entering the purification residue, the purification process should be carried out in a system with a pH value below 5.9. In conclusion, it is thermodynamically feasible to remove Zn impurities in samples by ammonium purification at appropriate pH.![(a) Zinc-ammonium coordination equilibrium species distribution in the system; (b) E-pH diagram of the Zn-H2O system ([Zn2+]TOT = 0.18 mol/L, [NH4+]TOT = 0.69 mol/L, [SO42-]TOT = 0.35 mol/L).](/content/184/2023/16/10/img/10.1016_j.arabjc.2023.105119-fig6.png)
(a) Zinc-ammonium coordination equilibrium species distribution in the system; (b) E-pH diagram of the Zn-H2O system ([Zn2+]TOT = 0.18 mol/L, [NH4+]TOT = 0.69 mol/L, [SO42-]TOT = 0.35 mol/L).
The PWP, secondary water purification (SWP) and SAP experiments were carried out on raw materials successively to judge the difficulty of removing impurity Zn from raw materials. The PWP process was carried out under the following experimental conditions: pH of 2.5∼, liquid–solid ratio of 3:1 mL/g, reaction time of 20 min, and reaction temperature of 20 °C. The SWP process was carried out under the following experimental conditions: pH of 6.0∼, liquid–solid ratio of 3:1 mL/g, reaction time of 30 min, and reaction temperature of 20 °C. The SAP process was carried out under the following experimental conditions: pH of 3.0∼, total ammonium concentration of 0.69 mol/L, liquid–solid ratio of 3:1 mL/g, reaction time of 30 min and reaction temperature of 20 °C.
According to “Analysis method of water-soluble Zn and acid-soluble Zn” in Section 2.4, different Zn components in the sample can be determined, and the removal efficiency of Zn under different purification conditions can be calculated. The results are shown in Fig. 7. In Fig. 7, the difference between the content of acid-soluble Zn and water-soluble Zn in the sample is the content of water-insoluble Zn. It can be seen that the contents of water-soluble Zn and acid-soluble Zn in the sample gradually decreased with the change of purification methods (from (b) to (c)). While the contents of water-insoluble Zn did not change significantly after PWP (1.73%) and SWP (1.82%), indicating that the zinc component easily dissolved by water in the sample has reached the limit value. Therefore, it is necessary to introduce ammonium in the secondary purification process to promote the removal of Zn. As shown in Fig. 7, the removal efficiency of Zn after purification by SAP significantly increased from 87.78% to 96.58%, and the content of water-insoluble Zn in the purified residue was only about 0.56%, indicating that the experimental scheme of PWP and SAP was effective.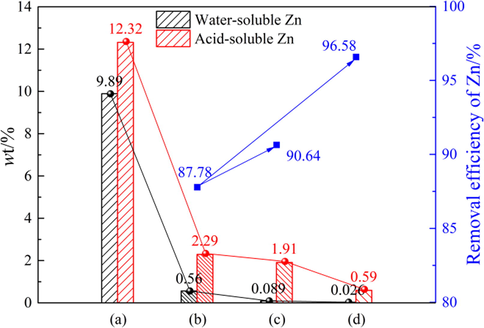
Different Zn components in the sample and Zn removal efficiency: (a) raw materials; (b) PWP; (c) SWP; (d) SAP.
3.3 Influencing factor
In this study, the raw materials were first purified by water. Then the effects of reagent type, total ammonium concentration, pH, reaction time and reaction temperature on the Zn removal efficiency of secondary purification were discussed according to the single factor experimental method. The effects of different influencing factors on the removal efficiency of Zn from raw materials were shown in Fig. 8(a)–(e).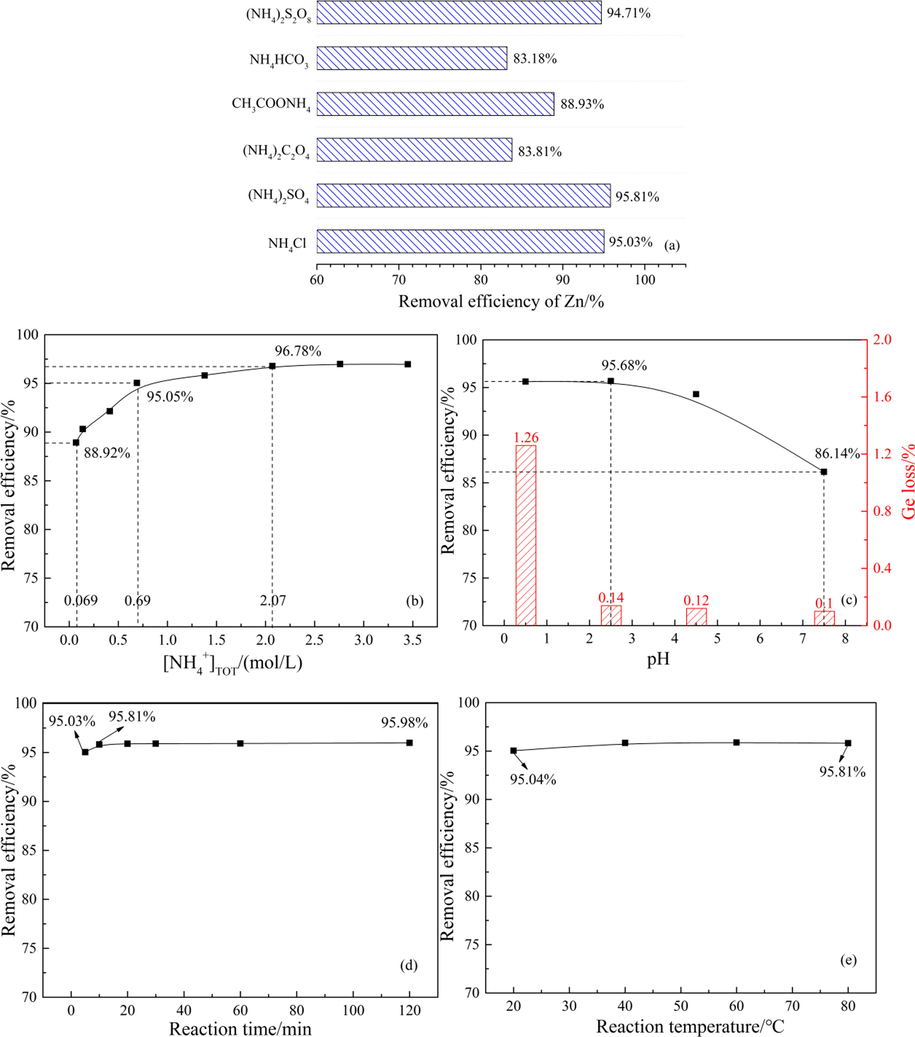
Effects of different influencing factors on the removal efficiency of Zn from raw materials: (a) reagent type; (b) total ammonium concentration; (c) pH; (d) reaction time; (e) reaction temperature.
3.3.1 Reagent type
Under the experimental conditions of total ammonium concentration of 0.69 mol/L, pH of 2.5∼, liquid–solid ratio of 3:1 mL/g, reaction time of 10 min and reaction temperature of 20 °C, the effects of different kinds of reagents such as ammonium chloride (NH4Cl), ammonium sulfate ((NH4)2SO4), ammonium oxalate ((NH4)2C2O4), ammonium acetate (CH3COONH4), ammonium bicarbonate (NH4HCO3) and ammonium persulfate ((NH4)2S2O8) on the purification efficiency of raw materials were studied. The results were shown in Fig. 8(a).
Under the same total ammonium concentration, the removal efficiency of (NH4)2S2O8, (NH4)2SO4 and NH4Cl on Zn from raw materials was similar. When (NH4)2S2O8 is used for purification, the loss of Ge in raw materials is 4.78%, while the loss of Ge in both (NH4)2SO4 and NH4Cl is less than 0.15%, which is caused by the strong oxidation of (NH4)2S2O8 in solution. (NH4)2S2O8 will produce NH4+, S2O82-, HSO4-, and SO42- ions in aqueous solution and make the solution acidic. The S2O82- is a highly oxidizing peroxy group, which will destroy the chemical structure of tannic acid in raw materials during purification, resulting in a large amount of loss of coordination Ge. The addition of NH4Cl reagent will introduce a large amount of Cl- into the system, which will cause corrosion to the equipment. The waste liquid produced by purification must be dechlorinated before it can be recycled. Since (NH4)2SO4 does not introduce impurities into the purification system, it is cheap and easy to obtain. Therefore, the (NH4)2SO4 was selected as the purification reagent in this experiment.
3.3.2 Total ammonium concentration
Under the experimental conditions of pH of 2.5∼, liquid–solid ratio of 3:1 mL/g, reaction time of 10 min and reaction temperature of 20 °C, the effects of total ammonium concentration of 0.069–3.45 mol/L on the purification efficiency of raw materials were studied. The results were shown in Fig. 8(b).
When the total ammonium concentration increased between 0.069 mol/L and 0.69 mol/L, the removal efficiency of Zn increased significantly from 88.92% to 95.05%. As the total ammonium concentration continued to increase from 0.69 mol/L to 2.07 mol/L, the removal efficiency of Zn increased slowly, only increasing to 96.78%. Then, the removal efficiency of Zn did not change with the increase of total ammonium concentration. However, when the total ammonium concentration increased gradually between 0.069 mol/L and 2.07 mol/L, the Ge loss in the solution remained at a low level, which did not exceed 0.5%. This indicated that the total ammonium concentration had no significant effect on the loss of Ge. Considering the production efficiency and economic cost, the total ammonium concentration of (NH4)2SO4 was 0.69 mol/L as the purification condition.
3.3.3 pH
Under the experimental conditions of total ammonium concentration of 0.69 mol/L, liquid–solid ratio of 3:1 mL/g, reaction time of 10 min and reaction temperature of 20 °C, the effects of pH between 0.5 and 7.5 on the purification efficiency of raw materials were studied. The results were shown in Fig. 8(c).
In Fig. 8(c), the effects of pH on Zn removal efficiency is very significant. The removal efficiency of Zn is almost constant when the pH varies between 0.5 and 2.5. When the pH exceeds 2.5, the removal efficiency of Zn rapidly decreases from 95.68% to 86.14% as the pH continues to increase. When the pH is 4.5, the decrease of Zn removal efficiency may be due to the large amount of Fe3+ hydrolysis in the solution (Bian and Jin, 2008). As can be seen from the E-pH diagram of the Zn-H2O system in Fig. 6(b) that Zn2+ begins to precipitate Zn(OH)2 when the pH is 5.9. Therefore, when the pH is 7.5, a large amount of Zn2+ has been hydrolyzed in the solution (Xu and Liu, 2002), and these factors greatly reduce the removal efficiency of Zn. The change of Ge loss with pH in Fig. 8(c) shows that the Ge loss is 1.26% when pH is 0.5, and the Ge loss is the largest. When the solution pH exceeds 2.0, the loss of Ge rapidly decreases to less than 0.15%. This is due to the fact that in high acid systems, the excess H+ in the solution promotes the protonation process of the tannin-germanium complex to tannic acid, thus accelerating the loss of Ge. Therefore, pH = 2.5 was selected as the purification condition in this experiment, which was exactly the pH value of the mixed system of raw materials and water.
3.3.4 Reaction time
Under the experimental conditions of total ammonium concentration of 0.69 mol/L, pH of 2.5∼, liquid–solid ratio of 3:1 mL/g and reaction temperature of 20 °C, the effects of reaction time of 5–120 min on the purification efficiency of raw materials were studied. The results were shown in Fig. 8(d).
As shown in Fig. 8(d), the removal efficiency of Zn remained constant as the purification time increased from 5 min to 120 min, indicating that the reaction time was not the key factor affecting the removal efficiency of Zn. Therefore, in this experiment, only the raw materials and reagents should be mixed evenly. Considering the necessity of reserving sufficient operation time, the reaction time of 10 min was selected as the purification condition in this experiment.
3.3.5 Reaction temperature
Under the experimental conditions of total ammonium concentration of 0.69 mol/L, pH of 2.5∼, liquid–solid ratio of 3:1 mL/g and reaction time of 10 min, the influence of reaction temperature between 20 and 80 °C on the purification efficiency of raw materials were studied. The results were shown in Fig. 8(e).
Fig. 8(e) shows that the removal efficiency of Zn remains constant when the reaction temperature increases from 20 °C to 80 °C, indicating that temperature is not the key factor affecting the removal efficiency of Zn. Therefore, the room temperature of 20 °C was selected as the purification condition.
3.4 Purification mechanism analysis
In summary, the optimal purification conditions for Ge-containing materials are as follows: PWP was selected under the conditions of pH 2.5∼, liquid–solid ratio 3:1 mL/g, reaction time 20 min and reaction temperature 20 °C, and SAP was selected under the conditions of total ammonium concentration 0.69 mol/L, pH 2.5∼, liquid–solid ratio 3:1 mL/g, reaction time 10 min and reaction temperature 20 °C. In order to clarify the purification mechanism, based on the PWP experiment, the SWP residue was set as the reference (conditions: pH 2.5∼, liquid–solid ratio 3:1 mL/g, reaction time 10 min, reaction temperature 20 °C). The PWP residue, SWP residue and SAP residue obtained under the optimal purification conditions were compared. Table 4 shows the main elemental contents in the purified residues obtained by different purification methods.
—
Elements
Zn
Mg
Fe
Ge
S
Purification methods
PWP
3.42
0.62
1.69
3.86
0.79
SWP
2.72
0.58
2.27
4.18
0.17
SAP
1.03
0.60
1.68
4.69
0.14
3.4.1 SEM-EDS and XRD
Fig. 9 shows the XRD patterns of purified residue obtained by different purification methods. Obviously, the main phases of purified residue obtained by different purification methods include (Zn,Fe)2GeO4 and ZnFe2O4 phases (Zhao et al., 2019; Gao et al., 2023). Fig. 10 shows the SEM-EDS of purified residue obtained by different purification methods. In Fig. 10, the distribution of elements O, Zn and S in all samples is consistent, indicating the presence of ZnSO4 phase in the samples. The distribution of elements O, Zn and Ge is consistent, indicating the presence of Zn2GeO4 phase in the samples. The distribution of Fe is concentrated and completely falls within the distribution of elements O and Zn, indicating that ferric exists in the form of ZnFe2O4. With the change of purification method (from (a) to (c)), the signal of elements S, O and Zn in the phase of ZnSO4 in the purified residue gradually disappeared, while the signal of element Zn in Zn2GeO4 and ZnFe2O4 still existed. This indicated that the Zn removed by PWP and SAP came from ZnSO4 rather than Zn2GeO4 and ZnFe2O4.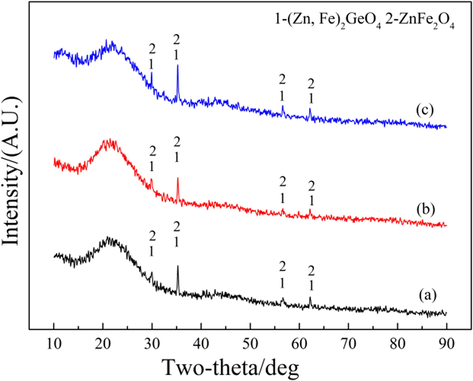
XRD patterns of purified residue obtained by different purification methods: (a) PWP; (b) SWP; (c) SAP.
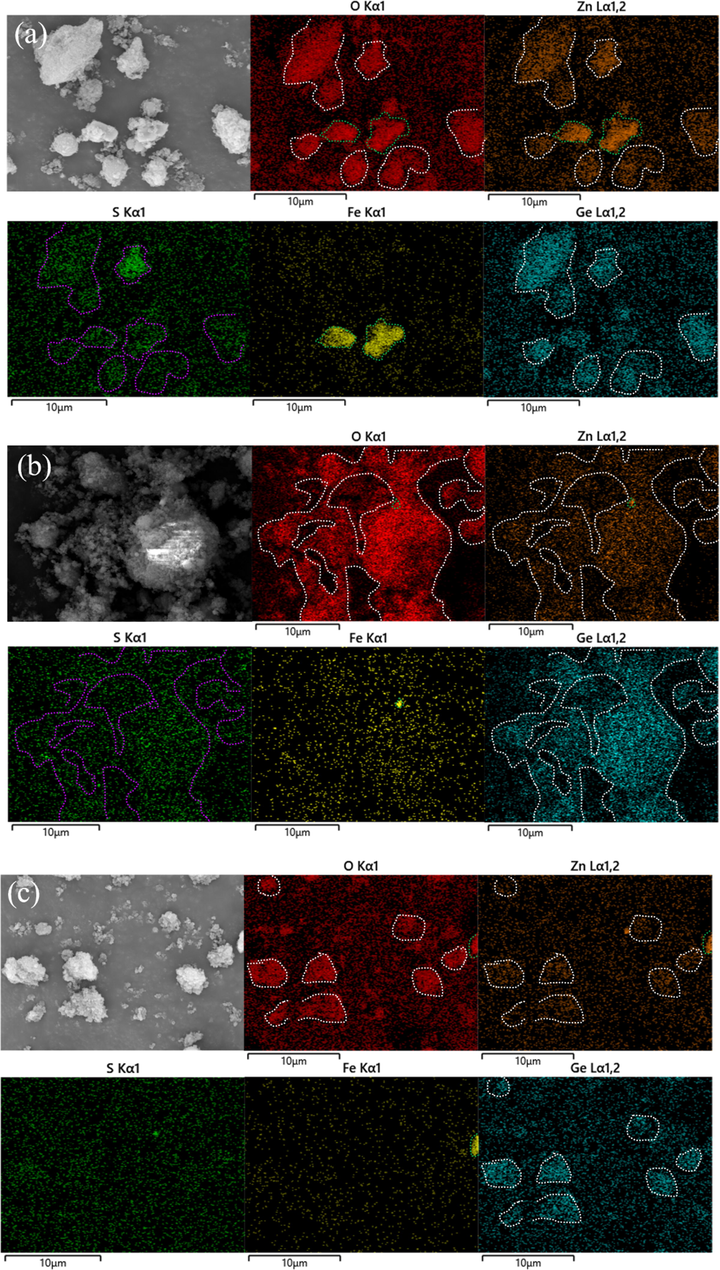
SEM-EDS of purified residue obtained by different purification methods: (a) PWP; (b) SWP; (c) SAP.
3.4.2 XPS
Fig. 11 shows the XPS detailed spectra of purified residue obtained by different purification methods. For the XPS detailed spectrum of Ge 3d, the binding energy peaks at 35 eV ∼ in Fig. 11(a) corresponds to Ge(IV), the binding energy peaks at 31 eV ∼ and 25 eV ∼ corresponds to Ge(II) (Xu et al., 2023; Gavrilin et al., 2021; Zhang et al., 2019). The Ge exists as Ge(IV) and Ge(II) in the purified residue. The binding energy of Ge did not shift with the change of purification method, indicating that NH4+ did not react with Ge in SAP process. For the XPS detailed spectrum of Zn 2p, the binding energy peaks at 1022 eV ∼ and 1045 eV ∼ in Fig. 11(a) corresponds to Zn(II), which may be ZnSO4 or Zn(OH)2. For the XPS detailed spectrum of O 1 s, the binding energy peaks at 531 eV, 532 eV and 533 eV in Fig. 11(a) correspond to O(II), which is consistent with the oxygen elements in zinc oxide and zinc sulfate (Liao, 2021). Since the pH of the purification system remains acidic, the binding energy at Zn 2p in Fig. 11(a)–(c) can be identified as ZnSO4. After SWP, the binding energy at the peak of Zn 2p in Fig. 11(b) did not shift, indicating that SWP did not affect the residual zinc sulfate in the sample. After SAP, the peak binding energy of Zn 2p in Fig. 11(c) shifts from 1022.50 eV to 1020.96 eV, which may be caused by the coordination between zinc sulfate and ammonium (Yang et al., 2022). In addition, the peak area of Zn 2p decreases significantly after SAP, indicating that the content of zinc sulfate has been significantly reduced, and the purification effect is remarkable.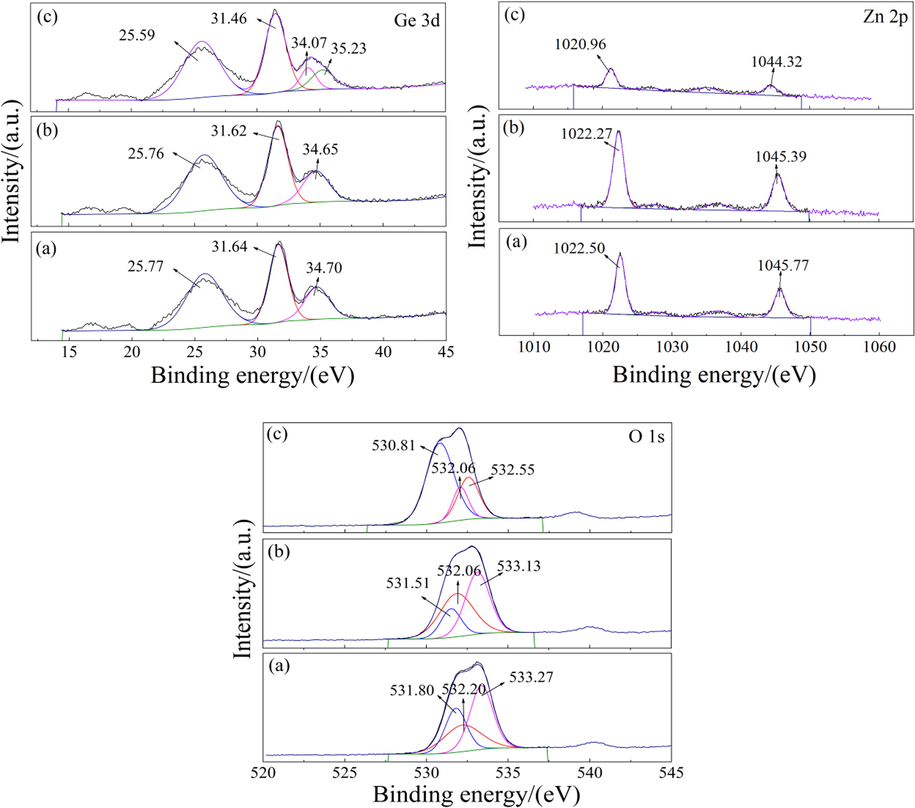
XPS detailed spectra of purified residue obtained by different purification methods: (a) PWP; (b) SWP; (c) SAP.
3.4.3 FT-IR
Fig. 12 shows FT-IR spectra of different samples. In Fig. 12(a), the absorption peak in the range of 3200–3400 cm−1 is the vibration peak of phenol hydroxyl O–H in tannic acid. The absorption peaks in the range of 750–1750 cm−1 are mainly the characteristic peaks of C–H, C–O, C = O, C = C on the benzene ring of tannic acid (Xie et al., 2019). The absorption peak near 451 cm−1 is the lattice vibration of Zn-O (Hussein et al., 2009), the absorption peak near 1097 cm−1 and 629 cm−1 is the bending vibration of SO42- (Wang et al., 2010), and the absorption peak at 1146 cm−1 is the stretching vibration of SO42- (Chang et al., 2007). After SAP, the absorption peaks related to ZnSO4 gradually weakened or disappeared with the purification process, indicating that the ZnSO4 existed in the form of chemical adsorption in the sample was effectively removed.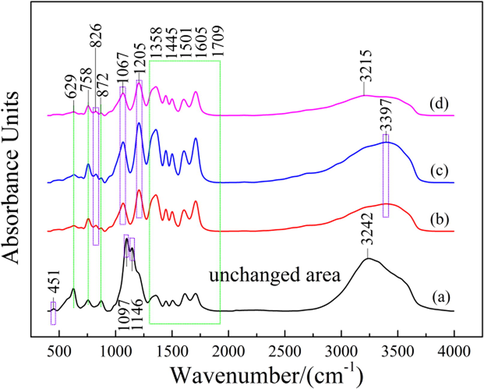
FT-IR spectra of different samples: (a) raw materials; (b) PWP; (c) SWP; (d) SAP.
3.4.4 TG-DSC
The weight loss of the sample was investigated in an air atmosphere at a heating rate of 10 °C/min within the temperature range of 30–800 °C. Fig. 13 shows TG-DSC curves of different samples. The TG curve shows that the weight loss of the raw materials in Fig. 13(a) consists of four stages, with 46.46% residue remaining at 800 °C. In Fig. 13(b)–(d), the weight loss process of the sample consists of two stages. The residual residue of the SWP at 800 °C is close (about 18%), while the residual residue of the SAP at 800 °C is only 14.91%. This indicates that the composition of raw materials is complex, and only organic matter and sulfur components can be completely removed when the temperature rises, while a large number of zinc components continue to remain in the residue in the form of oxides. After SWP, the weight of residue after roasting was significantly reduced, because the water-soluble Zn was almost completely removed from the raw materials in the purification process. After SAP, the weight of residue after roasting was further reduced, indicating that the use of ammonium could remove the water-insoluble Zn more completely. It can be concluded that the purification of raw materials by PWP and SAP is beneficial to the preparation of subsequent Ge concentrate.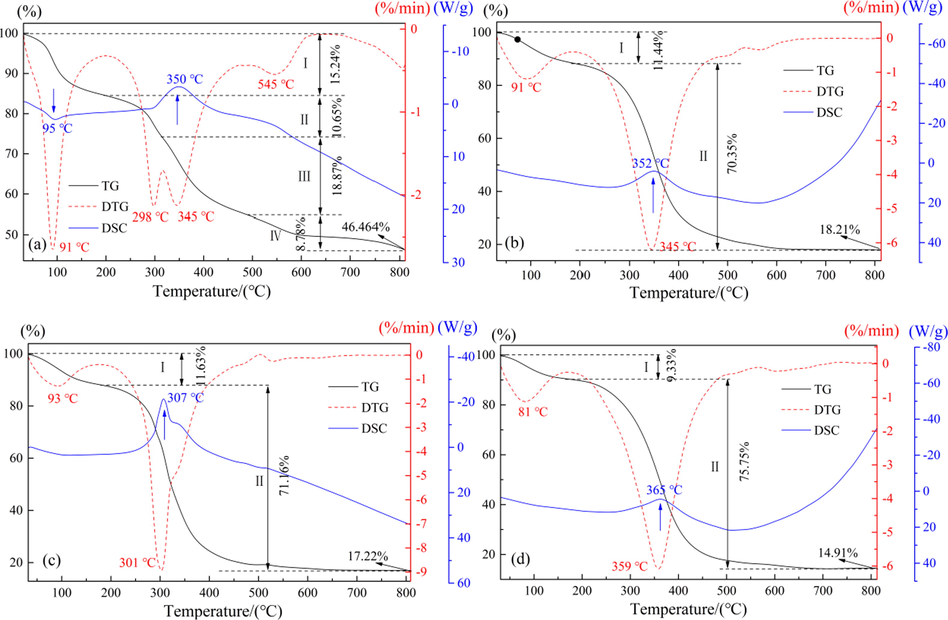
TG-DSC curves of different samples: (a) raw materials; (b) PWP; (c) SWP; (d) SAP.
4 Conclusion
In this study, a new method of efficient stepwise-purification of Ge-containing materials by ammonium was proposed. The Zn components in Ge-containing materials mainly include water-soluble Zn and water-insoluble Zn. The water-soluble Zn in the form of physical adsorption zinc sulfate can be removed by PWP, and the water-insoluble Zn in the form of chemical adsorption zinc sulfate can be removed by SAP. After the two-stage purification of the raw material, under the optimal purification conditions of total ammonium concentration of 0.69 mol/L, pH of 2.5∼, liquid–solid ratio of 3:1 mL/g, reaction time of 10 min and reaction temperature of 20 °C, 95.68% of zinc components could be removed. The water-insoluble Zn in the raw material was removed by forming soluble complexes with NH4+ ligand. This study can provide favorable conditions for the subsequent Ge extraction process.
Author contributions
All authors were involved in the design of the study. Haokai Di conceived the experiments and wrote the manuscript. Yan Hong and Ming Liang checked the format and language. Leiting Song checked the data. Kun Yang and Libo Zhang provided resources and approved the final version of the manuscript.
Acknowledgements
This work was supported by National Natural Science Foundation of China [grant number 51974141]; Major Science and Technology Project of Yunnan Province [grant number 202202AB080005]; Yunnan Fundamental Research Projects [grant number 202301AT070480]; Yunnan Fundamental Research Projects [grant number 202101AT070280]; Analysis and Testing Foundation of Kunming University of Science and Technology [grant number 2022P20213102008].
Declaration of Competing Interest
The authors declare that they have no known competing financial interests or personal relationships that could have appeared to influence the work reported in this paper.
References
- E(pE)-pH diagrams of Fe system and transformation accoring to time. Total Corros. Control. 2008;22(3):25-28.
- [Google Scholar]
- Study on crystal growth of metallorganic coordination compound-zinc tris(thiourea) sulfate. J. Synth. Cryst.. 2007;36(4):780-783.
- [Google Scholar]
- Effect and mechanism of potassium-permanganate strengthening and sodium-alginate depression of sphalerite flotation. J. Univ. Sci. Technol. Beijing. 2021;43(5):612-618.
- [Google Scholar]
- Green synthesis of an ethylenediamine hybrid zinc germanate nanoribbon and its application in adsorption and detection of uranyl ions. FENXI CESHI XUEBAO (J. Instrumental Anal.). 2023;42(5):577-585.
- [Google Scholar]
- High-rate and low-temperature performance of germanium nanowires anode for lithium-ion batteries. J. Electroanal. Chem.. 2021;888:115209
- [Google Scholar]
- Synthesis and characterization of (zinc-layered-gallate) nanohybrid using structural memory effect-Science Direct. Materials Chemistry & Physics. 2009;113(1):491-496.
- [Google Scholar]
- Behavior of tannins in germanium recovery by tannin process. Hydrometall.. 2008;93:140-142.
- [Google Scholar]
- Study on deep purification of zinc sulfate solution with zinc powder enhanced by ultrasonic wave. Kunming Univ. Sci. Technol. 2021:27-31.
- [Google Scholar]
- Leaching zinc from blast furnace dust with ammonium acetate. Chinese J. Environ. Eng.. 2018;12(5):1547-1556.
- [Google Scholar]
- XPS study of OH impurity in solution processed CdS thin films. Sol. Energy Mater. Sol. Cells. 2017;160:211-216.
- [Google Scholar]
- Leaching zinc dust in system of Zn(II)-(NH4)2SO4-H2O. J. Central South Univ. (Sci. Technol.). 2007;5:867-872.
- [Google Scholar]
- Preparation and characterisation of hydroxide stabilised ZnO(0001)-Zn-OH surfaces. PCCP. 2007;9(19):2406-2412.
- [Google Scholar]
- Phase evolution from rod-like ZnO to plate-like zinc hydroxysulfate during electrochemical deposition. J. Alloy. Compd.. 2010;493(1–2):471-475.
- [Google Scholar]
- Optimization of preparation conditions and antibacterial activities of tannic acid complexing magnesium by RSM. Chem. Reagents. 2019;41(4):348-353.
- [Google Scholar]
- Study on technology of pickling purification of germanium tannin to produce high grade germanium concentrate. China Metal Bull.. 2003;19:19-22.
- [Google Scholar]
- E-pH diagram of Zn-H2O system and its application in corrosion protection. Inner Mongolia Petrochem. Industry. 2002;28(3):3.
- [Google Scholar]
- Ultrasonic enhanced hydrazine sulfate acid leaching of low-grade germanium dust. Appl. Energy. 2023;332:120485
- [Google Scholar]
- Study on isobutene oligomerization over supported zinc sulfate catalyst. Dalian Univ. Technol. 2020:45-46.
- [Google Scholar]
- Study on upgrading of germanium concentrate. Nonferrous Metals (Extractive Metall.). 2019;4:60-63.
- [Google Scholar]
- Preparation of ZnO/AgCl/Ag/g-C3N4 Composite Structure and Its Photocatalytic Properties. Zhejiang Chemical Industry. 2019;53(11):31-38.
- [Google Scholar]
- Microwave and ultrasound augmented leaching of complicated zinc oxide ores in ammonia and ammonium citrate solutions. Metals. 2017;7(6):216.
- [Google Scholar]
- Thermodynamics, kinetics model, and reaction mechanism of low-vacuum phosphate reduction process for germanium recovery from optical fiber scraps(Article) ACS Sustain. Chem. Eng.. 2019;7(2):2176-2186.
- [Google Scholar]
- Preparation of Zn2GeO4: Mn2+ green phosphors and investigation of afterglow characteristics. Chinese J. Lumin.. 2019;40(2):189-195.
- [Google Scholar]
- Applications of chemical equilibrium diagram software HYDRA /MEDUSA in teaching college chemistry*. Univ. Chem.. 2015;4:21-25.
- [Google Scholar]


