

Translate this page into:
Electrochemical behavior of Sn-Zn alloys with different grain structures in chloride-containing solutions
⁎Corresponding author at: Instituto de Materiales de Misiones-IMAM (CONICET-UNaM), 3300 Posadas, Misiones, Argentina. aares@fceqyn.unam.edu.ar (Alicia E. Ares)
-
Received: ,
Accepted: ,
This article was originally published by Elsevier and was migrated to Scientific Scholar after the change of Publisher.
Peer review under responsibility of King Saud University.
Abstract
In the present research the electrochemical behavior of the Sn-Zn alloys (Sn-1 wt.%Zn, Sn-4 wt.%Zn and 8.9 wt.%Zn) in 3% NaCl solution is analyzed using potentiodynamic cyclic polarization measurements and Electrochemical Impedance Spectroscopy (EIS) technique. Specimens were longitudinally solidified with simultaneous heat extraction in two opposite directions. Working electrodes were constructed using longitudinal and cross sections of the specimens with both types of structure: columnar and equiaxed.
Results obtained from the polarization curves indicated that the two types of grain structures of Sn-Zn alloys (Sn-1 wt.%Zn, Sn-4 wt.%Zn and Sn-8.9 wt.%Zn) corresponding to longitudinal section present a pseudo passive zone. In the case of specimens from cross sections of the samples, the columnar and equiaxed zones of Sn-8.9 wt.%Zn are the only ones that do not have this pseudo passive region. In addition, the interdendritic zone of alloys is susceptible to corrosion by dealloying because this phase is zinc-rich. This type of corrosion also occurs in the zinc rich lamellar structure present in the eutectic. The percentage of zinc in the alloy increases with increasing susceptibility to pitting corrosion. The EIS values obtained revealed that the susceptibility to corrosion increases with increasing zinc content in alloys, for both the columnar and equiaxed zones. In addition, the columnar zones of Sn-4 wt.%Zn and Sn-8.9 wt.%Zn specimens are more resistant to corrosion than the equiaxed grain specimens. However, the equiaxed zone of Sn-1 wt.%Zn alloy is less susceptible to corrosion than the columnar zone. After adjustment by equivalent circuits it is revealed that the equiaxed zone of Sn-8.9 wt.%Zn alloy has a second porous layer composed of corrosion products on the electrode surface.
Keywords
Sn-Zn alloys
Corrosion
EIS
NaCl
Grain structures

1 Introduction
Both zinc and tin are widely used in industrial activity as coatings protect steel against corrosion, as mentioned in the literature (Cuthertson and Angles, 1948; Zhang, 1996; Adams, 2004; Pistofidis et al., 2006; Yang et al., 2012; Ares and Gassa, 2012). One of most common uses of zinc is galvanized for outdoor use. Because tin and zinc are respectively more and less noble than iron, the Sn-Zn alloys in a given region are believed to be closer but more active than iron. These types of alloys can act as sacrificial anodes with good anticorrosive properties for ferrous base metals (Wang et al., 2001; Wang et al., 2002; Wang et al., 2004). Therefore, the corrosion behavior of Sn-Zn alloys with variable composition is worth to be investigated systematically (Hu and Wang, 2006).
The Sn-Zn coatings provide protection against corrosion, frictional and anti-frictional properties (Vitkova et al., 1996), ductility and weldability to the base metal in question (Wang et al., 2001; Guaus and Torrent-Burgués, 2003; Guaus and Torrent-Burgués, 2005; Dubent et al., 2007). These coatings are also used in various industrial applications such as in the frame of electrical and electronic equipment due to the low electrical contact resistance of Sn-Zn (Ashiru and Shirokoff, 1996; Wang et al., 2001; Guaus and Torrent-Burgués, 2003). Also, they are used as an alternative to cadmium and nickel coatings due to toxic and allergenic effects they produce to individuals who manipulate objects covered with these metals (Cuthertson and Angles, 1948; El-Sharif et al., 2000; Guaus and Torrent-Burgués, 2003; Guaus and Torrent-Burgués, 2005). The Sn-Zn coatings with high tin content provide very good protection against oxidation and uniform corrosion of metals (Arici et al., 2011). In materials with pure tin coatings or tin rich alloys, a process of uniform corrosion affects the substrate, while the coating is attacked slightly. After prolonged exposure to the corrosive medium, tin and tin-rich coatings are not damaged. However, zinc-rich coatings offer greater protection to steel substrates. Previous investigations have evidenced that Sn-25 wt.%Zn sheets are better than pure zinc or cadmium in corrosion tests of saline fog, and equal to cadmium and higher than zinc in humid atmosphere tests. During atmospheric tests, it has been found that the advantages of zinc covers, Sn-Zn and cadmium depend on aggressive media (Vitkova et al., 1996). In general, analysis of the electrochemical behavior of the Sn-Zn alloys is performed by cyclic potentiodynamic polarization test, widely used to study corrosion (Lin and Liu, 1998; Chou et al., 2003; Quartarone et al., 2003; Park and Pyun, 2003; Zuo et al., 2003; Lin et al., 1998) and measures of Electrochemical Impedance Spectroscopy (EIS) technique. During testing potentiodynamic polarization, the specimen (working electrode) is brought from a state of cathodic polarization to anodic values. When the specimen reaches a predetermined potential value, called passivation potential, it is possible the formation of passive film, where the current density at this point is called critical current density (Icrit). After this point, the corrosion current density begins to fall at a much lower value. When a compact passivation film on the surface is formed, the density of corrosion current becomes stable, obtaining the passivation current density (Ip), and remaining constant while the potential of the sample continuously increases until the potential reaches the rupture potential. At this point, the passive film begins to break and pitting corrosion occurs in the material under the film, resulting in an increase in corrosion current density (Li et al., 2008). The Electrochemical Impedance Spectroscopy (EIS) technique allows continuous monitoring of the corrosion process without acceleration of the corrosion reaction and may provide sufficient information on the dielectric behavior, reactions and mass transport through the electrochemical interface with a well-defined equivalent circuit (EC). In addition, it is very sensitive to the evolution of resistive and capacitive behavior of the electrochemical interface, considered one of the most effective methods for the study of localized corrosion (pitting) (Hu and Wang, 2006; Liu et al., 2015a,b,c).
At the present, few papers address microstructure phase composition and type of grain structures with the corrosion resistance of alloys.
Taking into account the above mentioned, the objective of the present research was to analyze the corrosion susceptibility of Sn-Zn alloys (Sn-1 wt.%Zn, Sn-4 wt.%Zn and Sn-8.9 wt.%Zn), which have different grain structures, using cyclic potentiodynamic polarization tests and Electrochemical Impedance Spectroscopy (EIS). The tests are carried out in a naturally aerated solution of 3% NaCl (pH ≅ 5) and at room temperature (25 °C).
2 Materials and methods
To analyze the corrosion resistance of the alloys, the specimens were first obtained by directional solidification method. To this end, metals were horizontal unidirectional solidified inside clay molds in a furnace with heat extraction in two opposite directions and simultaneously (Fig. 1).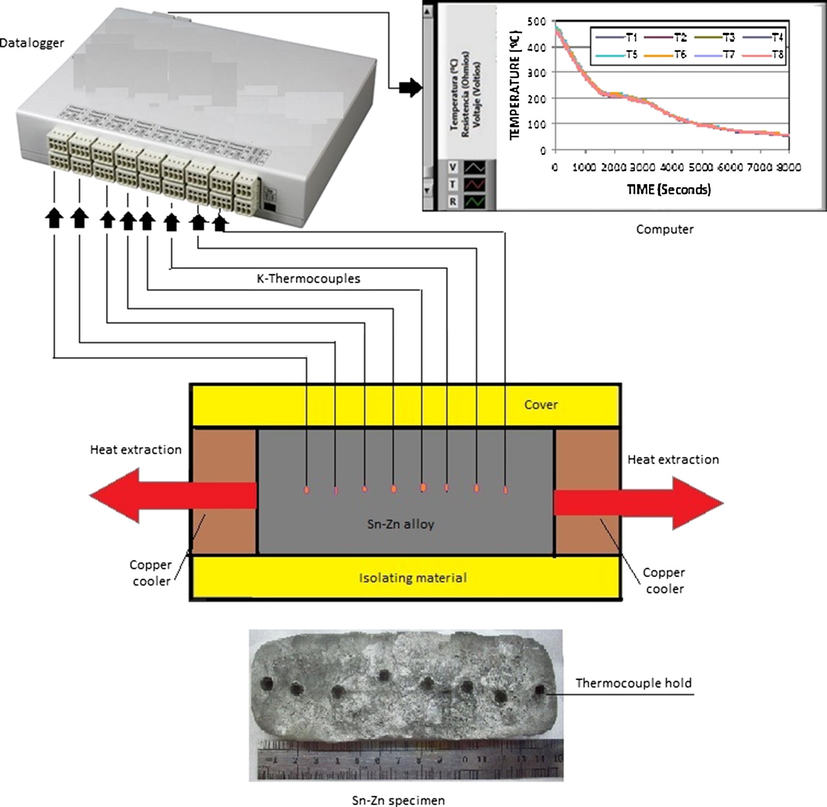
Horizontal directional solidification system with heat extraction in two opposite directions.
To appreciate the macrostructure, the obtained specimens were subjected to a chemical attack and roughed previously with abrasive paper of SiC with a wide particle size between # 60 and # 1500 and then with alumina (0.25 μm). Etching involves immersing the specimens in a solution composed of 5 g FeCl3, 10 mL HCl and 100 mL distilled water solution for about 10 s at room temperature (25 °C).
This allowed defining three zones of different grains structures along the samples (Ares et al., 2002;Ares et al., 2008; Agaliotis et al., 2008; Rosenberger et al., 2010; Gueijman et al., 2010; Ares and Gassa, 2012; Ares et al., 2012; Parra et al., 2013; Scheiber et al., 2014; Scheiber et al., 2015; Kociubczyk et al., 2016): A columnar (C) zone with large and elongated grains, a zone of columnar-to-equiaxed transition (CET) and an equiaxed (E) zone, with smaller grains. Samples of columnar and equiaxed zones were taken by longitudinal and transverse sections and used as working electrodes (Fig. 2).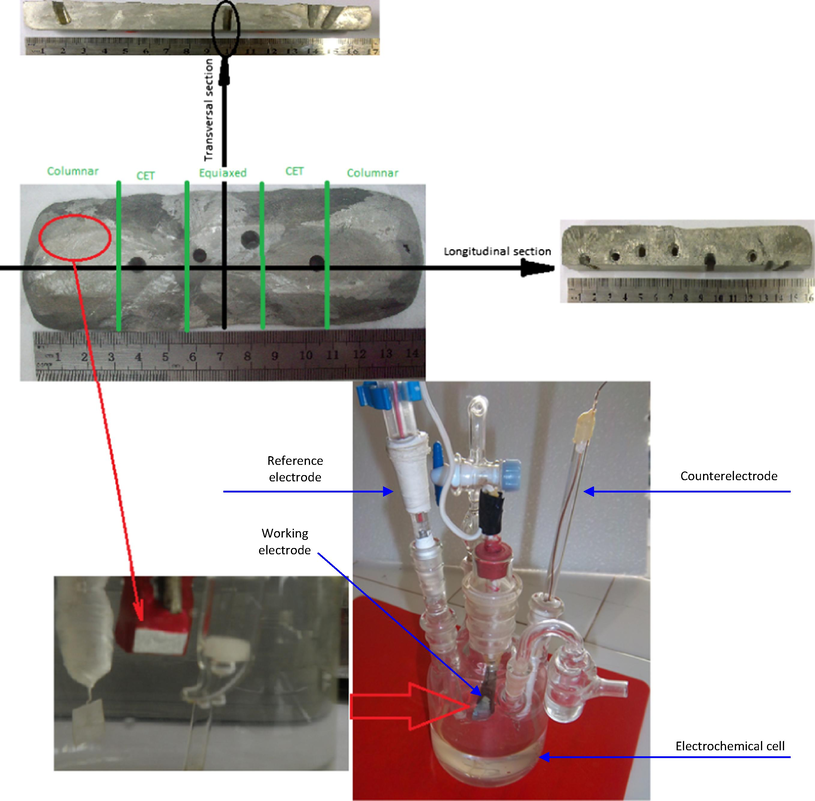
(a) Solidifying system used with heat extraction system in two opposite directions. (b) Conventional electrochemical cell of three electrodes used.
The electrochemical behavior of the materials was evaluated by cyclic potentiodynamic measures in an electrochemical cell of three electrodes Pyrex (ASTM G-5) with a saturated calomel electrode (SCE) as a reference electrode and a platinum wire as spiral as counterelectrode (Fig. 2).
Assays were performed in a solution of 3% NaCl (pH ≅ 5) at room temperature (25 °C) in the naturally aerated. The average area of the samples exposed to the electrolyte was 0.44 cm2. A potentiostat/galvanostat/ZRA Reference 600 Gamry was used.
The polarization curves were performed at a sweep velocity of 1.6 · 10−4 V/s (ASTM 61-86) from 0.1 V below the open circuit potential, increasing the potential in the anodic direction until reaching a current density of 3.25 ∗ 10−3 A/cm2, and then, the sweep direction was reversed until the back curve was cut back, closing the hysteresis cycle, or until the corrosion potential was reached.
The analysis of the specimens before and after each measurement, was done by optical microscopy technique. In addition, Electrochemical Impedance Spectroscopy (EIS) tests were performed using a Reference 300 Gamry®. The amplitude of the sinusoidal signal of applied potential, around the corrosion potential, was 10 mV in a frequency range between 1 × 10⁻¹ Hz and 1 × 10⁵ Hz. The equivalent circuits that simulate the electrochemical response obtained from the system were built with the help of Equivcrt version 3 software. For both types of trials, an initial delay of 300 s at open circuit potential was considered to stabilize the system (Liu et al., 2010), see Fig. 3(a) and (b).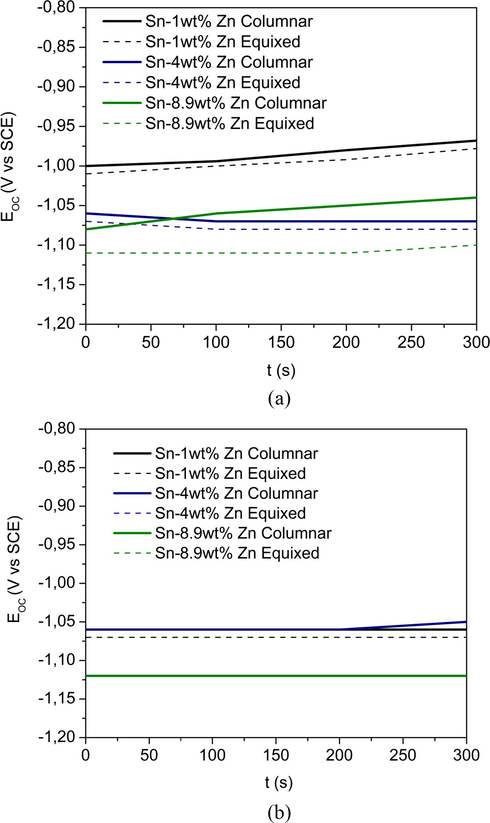
OCP done before cyclical polarization and EIS measurements. (a) Transversal and (b) longitudinal.
Each measurement (potentiodynamic polarization and electrochemical impedance spectroscopy (EIS)) was repeated at least three times for repeatability.
3 Results and discussion
3.1 Macrostructure and microstructure
The three grain structures, Columnar (C), Columnar-to-Equiaxed Transition (CET) and Equiaxed (E) were differentiated along the specimens by the macrostructure revealed alloys (Fig. 2).
Fig. 4 shows the microstructure for hypoeutectic composition, in which the presence of two phases is observed: β-Sn phase in the case of Sn-1 wt.%Zn (Fig. 4(a)) and β-Sn plus eutectic phase (β-Sn + Zn) for Sn-4 wt.%Zn (Fig. 4(b)). Both phases are well distributed throughout the system. The β-Sn, light gray (free Zn) zone phase has an elliptical morphology with an approximate size ranging from 20 to 30 [μm], while the eutectic phase is observed as fine needles of Zn (black color) dispersed in a matrix of β-Sn. By increasing the content of Zn in the alloy to the eutectic composition, the zones of β-Sn (Zn free) disappear completely and only the eutectic phase is observed, which is described above as fine needles Zn (black color) dispersed in a matrix of β-Sn (light gray) (Fig. 4(c)).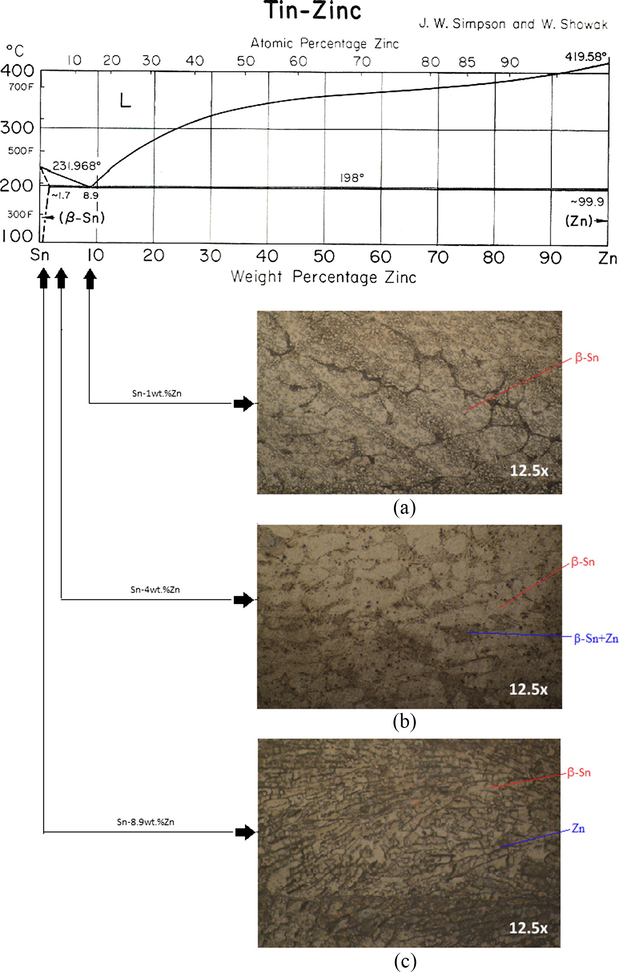
Sn-Zn phase diagram and microstructures of Sn-1 wt.%Zn, Sn-4 wt.%Zn and Sn-8.9 wt.%Zn.
Fig. 5 shows the typical microstructures of hypoeutectic and eutectic Sn-Zn alloys along the length of the casting, as also previously reported (Garcia et al., 2010). The Sn-8.9%Zn alloy has a characteristic eutectic structure with large, dispersed precipitates rich in zinc, in the β-Sn matrix (Liu et al., 2015a,b,c; Garcia et al., 2010; El-Daly et al., 2014; Garcia et al., 2009). For the case of hypoeutectic Sn-4%Zn alloy (Fig. 6), fine precipitates rich in zinc are segregated from the β-Sn matrix to form part of the eutectic appearance and β-Sn islands can be clearly observed, as reported in the literature (Liu et al., 2015a,b,c;El-Daly et al., 2014). In the case of Zn-1%Zn alloy, only β-Sn islands without the formation of interdendritic zone are observed (Fig. 7).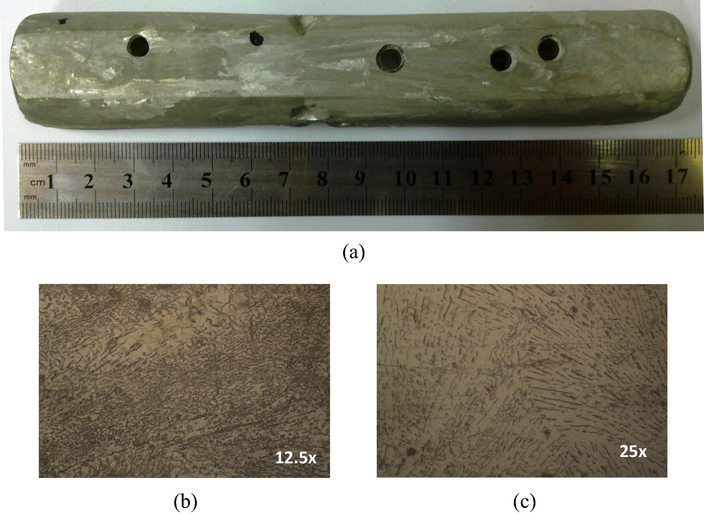
(a) Macrostructure of Sn-8.9 wt.%Zn. (b) and (c) Microstructures of columnar and equiaxed zones of the specimens, respectively.
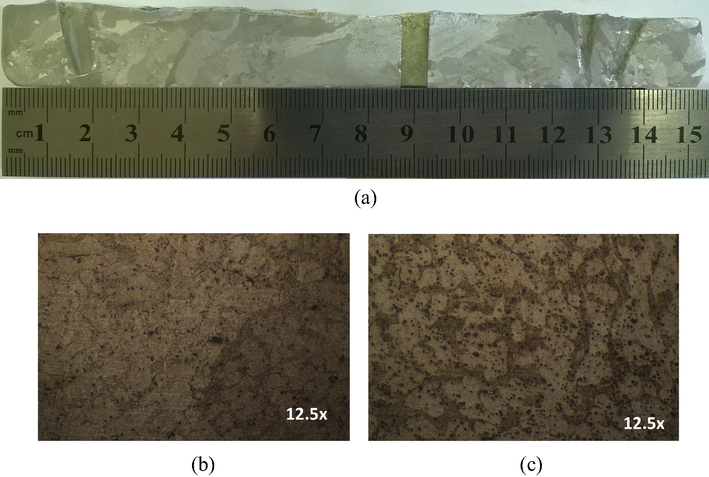
(a) Macrostructure of Sn-4 wt.%Zn. (b) and (c) Microstructures of columnar and equiaxed zones of the specimens, respectively.
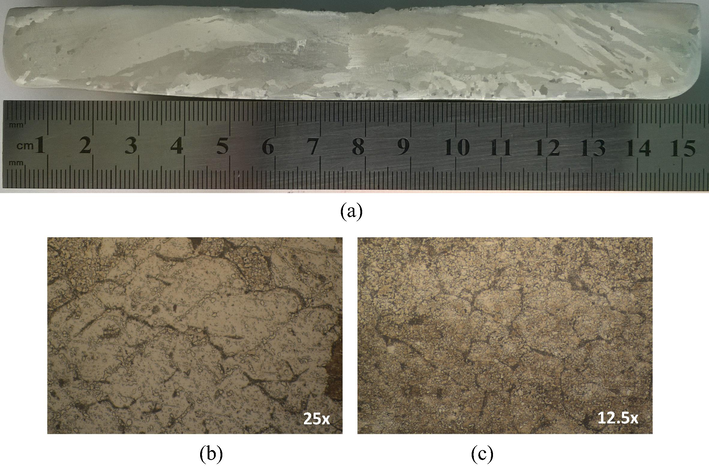
(a) Macrostructure of Sn-1 wt.%Zn. (b) and (c) Microstructures of columnar and equiaxed zones of the specimens, respectively.
3.2 Cyclic potentiodynamic polarization curves
As shown in Table 1, no significant differences were observed between the corrosion potentials of the alloys for the three different grain structures or regarding the longitudinal and transversal sections. However, potentials for transversal sections are higher than for longitudinal sections. In addition, it can be seen that there is no significant variation of corrosion potential with respect to increased zinc content in the alloy. –: it is not observed.
Corrosion potentials (V vs SCE)
icorrosion (μA/cm2)
icritic (μA/cm2)
ipseudopassivea (μA/cm2)
Break pseudo passivity potential (V vs SCE)
Long.
Transv.
Long.
Transv.
Long.
Transv.
Long.
Transv.
Long.
Transv.
Sn-1 wt.%Zn
C
−1
−0.95
2.51
2.51
27.54
12.19
16.98
10.96
−0.457
−0.545
E
−1.07
−0.95
0.63
14.12
43.05
133.05
27.23
73.62
−0.526
−0.452
Sn-4 wt.%Zn
C
−1.04
−1.05
2.51
6.31
767.36
1081.43
557.19
685.49
−0.452
−0.467
E
−1.13
−1.05
5.62
1.58
1205.04
1207.81
524.81
783.43
−0.463
−0.45
Sn-8.9 wt.%Zn
C
−1.13
−0.98
3.16
6.31
1547.03
–
1545.61
–
−0.459
−0.98
E
−1.13
−1.10
10.00
6.31
436.52
–
524.52
–
−0.466
−1.10
If corrosion potentials obtained for each of the alloys are compared to the potentials reported in Scheiber et al. (2014), which correspond to pure metals tested under the same conditions, being −0.491 V vs. SCE (saturated calomel electrode) for Sn and −1.146 V vs. SCE (saturated calomel electrode) for Zn, it is observed that all samples have potentials close to corresponding of pure Zn.
The corrosion current values are low in general for longitudinal cutting. There is no a clear trend of corrosion current with respect to the content of Zn or with respect to the structure of alloys.
Figs. 8 and 9 reveal that in the case of the longitudinal section, the three alloys exhibit curves with similar characteristics, and the same behavior applies in the case of cross sections of Sn-1 wt.%Zn and Sn-4 wt.%Zn alloys.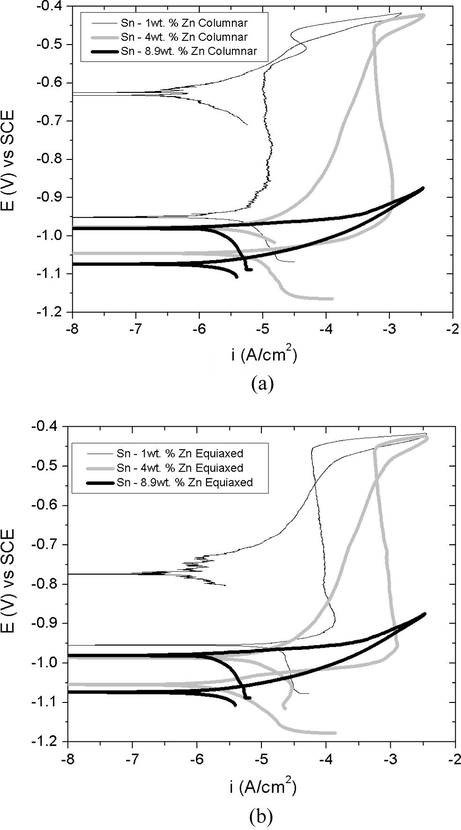
Potentiodynamic polarization curves obtained from the superimposed alloys according to the grain structure, transversal sections (a) columnar and (b) equiaxed.
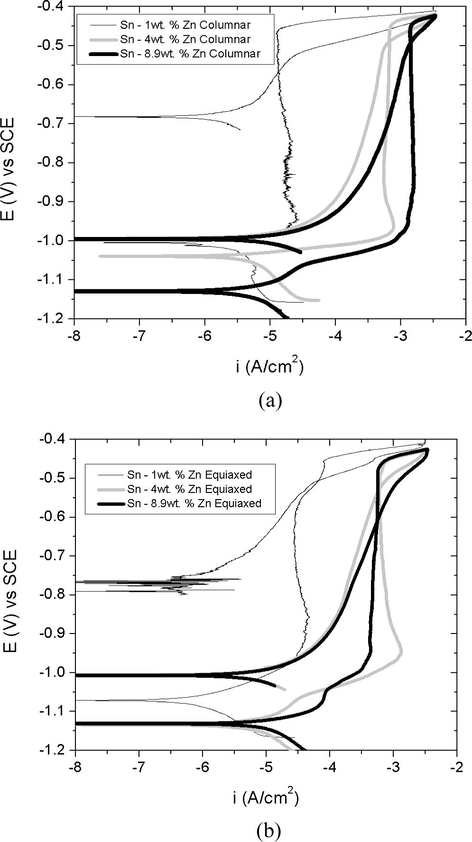
Potentiodynamic polarization curves obtained from the superimposed alloys according to the grain structure, longitudinal sections (a) columnar and (b) equiaxed.
In these curves, it is observed that the current density reaches a point and then advancing active simulating a passivity range. That is, a pseudo-passivity for more positive values than the corrosion potential was observed. While this region of the curve has a density of approximately constant current it cannot be considered as a passive zone due to the high current values reached, especially after achieving high critical current values, see Table 1. According to Liu et al. (2015a,b,c); Ahmido et al. (2015) this pseudo passive region is attributed to the formation of oxides and/or hydroxides supersaturated surface of alloys. These oxides act as a barrier that inhibits the dissolution of the alloys, and the Sn-1 wt.%Zn alloy shows the lowest density corrosion values in the pseudo-passive zone.
However, columnar and equiaxed grain structures of Sn-8.9 wt.%Zn alloy corresponding to the cross section do not present such pseudo-passive region. This could be attributed to the fact that zinc is very active and acts as anode in the chlorinated solution as reported in Hu and Wang (2006).
The current values of this pseudo-passivity generally grow in the direction of Zn% increase for both longitudinal and transversal sections, Sn-1 wt.% (C) < Sn-1 wt.% (E) < Sn-4 wt.% (C) = Sn-4 wt.% (E).
Comparison of the superposed curves revealed that when values are greater than −0.5 V (see Table 1), the current increases rapidly (i ⩾ 10−5 A/cm2) suggesting the breakage of pseudo-passive film covering the surface thereof.
Except for Sn-8.9 wt.% Zn alloy, that is not presenting this pseudo-passive range, a rapid increase was in current from corrosion potential. Given these results, we can state that the Sn-8.9 wt.%Zn alloy is the most susceptible to corrosion.
Because the tests were performed in a deaerated solution of 3% NaCl, the feasible cathodic reaction is the hydrogen evolution from water reduction, section AB of curves (Ahmido et al., 2015; Mohanty and Lin, 2008) (Fig. 5)
The current abruptly increases from point B, where dissolution of zinc occurs according to the following reactions (Mohanty and Lin, 2008),
Point B corresponds to the corrosion potential where cathodic and anodic slopes were intercepted and the current equals to zero. The dissolution of Zn begins at this point and continues up until the region C.
As a result of the oxidation of zinc, the surface of the alloys become tin rich (Figs. 4–7 - micrographs) (Mohanty and Lin, 2008). In the region of the BC curve, the tin dissolution to Sn (II) and Sn (IV) species also occurs by the reactions shown (Newman, 1985; Harrington and Devine, 2008; Brug et al., 1984; Boissy et al., 2013).
Insoluble zincates formed were deposited on the surface of the specimens of the alloys and generated the CD zone. This region of the curve shows an almost vertical line since the current density in this region is independent of the potential, in a range of approximately 0.55 V (Fig. 5) except for columnar and equiaxed structures in Sn-8.9 wt.%Zn The film formed in this segment of the curve is not passive (Ahmido et al., 2015). This fact is attributed to the irregular distribution of the oxides forming on the surface of the specimens, since each alloy comprises a tin solution and a phase rich in zinc. Zn phase is usually diluted in NaCl and consequently, this phase does not present a passive layer (Mohanty and Lin, 2007). As the formation of pseudo passive film begins with the precipitation of Zn (OH)2 on the surface (Ahmido et al., 2015), the Zn(OH)2 becomes ZnO according to Ec. (2), being ZnO a semiconductor which can degrade the corrosion resistance. Therefore, ZnO is detrimental to film formation. At point D, the curves show an increase in current density accompanied by an increase in potential, indicating the rupture of pseudo passive layer. The break of the film may be attributed to the penetration of Cl− ions for the oxide layer or oxygen evolution (Ahmido et al., 2015; Mohanty and Lin, 2007). The halide ions promote the dissolution of zinc, which results in rupture of the oxide film (Ahmido et al., 2015). Pistorius and Burstein reported that Cl− penetration occurs within the oxide layer and causes mechanical disruption thereof (Pistorius and Burstein, 1994).
After performing cyclic potentiodynamic polarization measures, the observation of each of the samples through an optical microscope (Fig. 10) revealed the microstructure in the specimens exposed to corrosive medium. The most susceptible zone to localized corrosion is the interdendritic region, which is the zinc rich phase, while β-Sn phase presents generalized corrosion.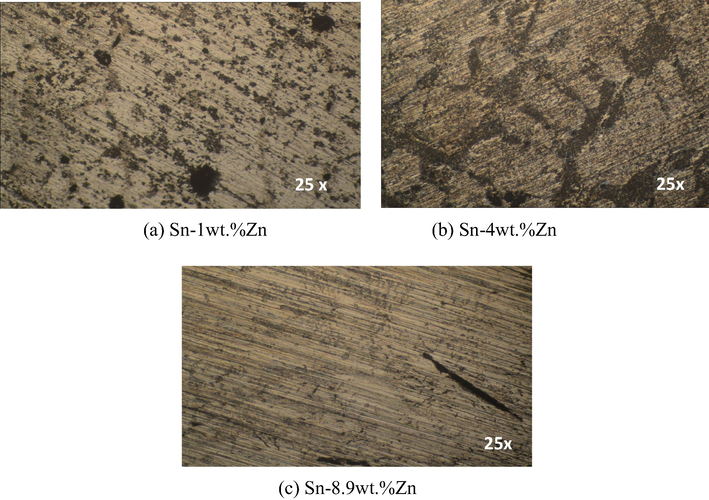
Micrographs of alloys, after performing the polarization curves, corresponding to the cross section of columnar structure: (a) Sn-1 wt.%Zn, (b) Sn-4 wt.%Zn y and (c) Sn-8.9 wt.%Zn.
The type of corrosion that occurs in the interdendritic region is by dealloying (Liu et al., 2015a,b,c; Khireche et al., 2014). This is consistent with reports by Zhang (2005) who stated that alloys containing zinc are associated with loss process thereof, in which the metal is preferably dissolved. As a result of dezincification, the surface concentration of the other components of the alloy increases. Therefore, the corrosion potential and the current density tend to vary much more with time for the case of pure zinc (Galvele and Duffó, 2006). The Sn-4 wt.%Zn and Sn-8.9 wt.%Zn alloys, also in β-Sn phase present a varied litmus color on the surface of the specimen, which could be attributed to the presence of an adherent oxide layer (Liu et al., 2015a,b,c). Regarding the eutectic case (Liu et al., 2015a,b,c), indicated that Cl− anions migrate along the intergranular boundaries of zinc precipitate into the β-Sn matrix alloys. The intergranular edges provide efficient diffusion path anions Cl− and therefore promote the pitting process. With reference to corrosion susceptibility, as mentioned above, the corrosion potential of zinc is more electronegative than tin (ASTM G82, 2006), indicating that zinc is preferably dissolved due to galvanic coupling and, therefore, favors the process of pitting in Sn-Zn alloys. Furthermore, it is observed that the most affected zone of the test pieces was the zone where these specimens experienced shear stress.
3.3 Electrochemical Impedance Spectroscopy (EIS)
EIS measures were carried out on longitudinal sections of the specimens of the alloys. The spectra obtained were simulated using three models by equivalent circuits including a set of electrical elements that describe the electrochemical characteristics of the electrode-solution interface. As can be seen in Fig. 11, the first model (a) RΩ(R1CPE1) consists of RΩ, which corresponds to the resistance of the electrolyte, R1, which is the resistance to charge transfer occurring in the double layer and finally, the constant phase element, CPE1, corresponding to the capacitance attributed to the double layer. The second model (b) (Liu et al., 2015a,b,c; Osório et al., 2012; Liu et al., 2016) consists of RΩ(CPE2(R2(R1CPE1)))and R2, which corresponds to the charge transfer resistance associated with the metal-oxide interface and the CPE2 that relates to the process of diffusion through the oxide film formed on metal.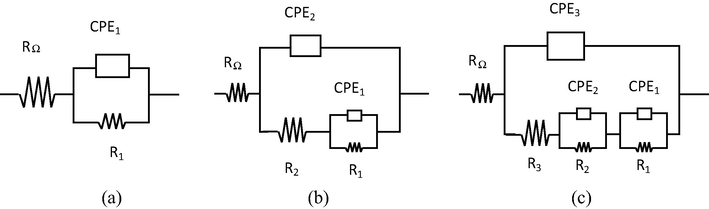
Models of equivalent circuits used to adjust the spectra obtained.
The model (c) RΩ(CPE3(R3(R2CPE2)(R1CPE1))), has the same electrical circuit elements (b) and is also formed by the arrangement (R3CPE3), indicating the presence of a second porous oxide layer on the electrode surface. The origins of the CPE are summarized in the literature (Jorcin et al., 2006; Brug et al., 1984), including surface roughness and heterogeneity, the porosity of the electrode, slow adsorption reactions, non-uniform potential and current distribution. The CPE is defined by Eq. (5),
*Data in parenthesis are the estimated error.
RΩ (Ω * cm2)
CPE1 (Ω−1 cm−2 sn)
n1
R1 (Ω * cm2)
R2 (Ω * cm2)
CPE2 (Ω−1 cm−2 sn)
n2
R3 (Ω * cm2)
CPE3 (Ω−1 cm−2 sn)
n3
Equivalent circuit (Fig. 11)
χ2 (10−4)
Sn-1 wt.%Zn
C
4.57 (6.12%)
6.02 * 10−6 (16.61%)
1
4.48 * 102 (29.09%)
2.52 * 103 (30.55%)
4.90 * 10−5 (21.28%)
0.62
(b)
7.6 * 10−1
E
5.52 (5.07%)
2.10 * 104 (16.57%)
0.74
9.79 * 103 (5.10%)
(a)
3.8 * 102
RΩ (Ω * cm2)
CPE1 (Ω−1 cm−2 sn)
n1
R1 (Ω * cm2)
R2 (Ω * cm2)
CPE2 (Ω−1 cm−2 sn)
n2
R3 (Ω * cm2)
CPE3 (Ω−1 cm−2 sn)
n3
Equivalent circuit (Fig. 11)
Sn-4 wt.%Zn
C
3.02 (0.05%)
5.04 * 10−5 (0.37%)
0.85
1.53 * 102 (0.77%)
4.95 * 103 (0.54%)
5.33 * 10−4 (0.14%)
0.47
(b)
3.8 * 10−2
E
4.26 (0.09%)
1.64 * 10−5 (30.19%)
0.92
1.99 * 10−15 (31.0%)
3.66 * 102 (1.98%)
2.89 * 10−4 (4.16%)
0.42
(b)
2.4 * 10−2
RΩ (Ω * cm2)
CPE1 (Ω−1 cm−2 sn)
n1
R1 (Ω * cm2)
R2 (Ω * cm2)
CPE2 (Ω−1 cm−2 sn)
n2
R3 (Ω * cm2)
CPE3 (Ω−1 cm−2 sn)
n3
Equivalent circuit (Fig. 11)
Sn-8.9 wt.%Zn
C
4.58 (0.09%)
5.26 * 10−4 (9.93%)
1
1.29 * 102 (46.85%)
4.30 * 103 (0.14%)
2.87 * 10−4 (0.31%)
0.46
(b)
2.1 * 10−2
E
5.14 (0.06%)
2.50 * 10−5 (1.14%)
0.91
2.58 * 101 (1.22%)
5.39 * 100 (9.53%)
9.78 * 10−4 (10.49%)
1
2.95 * 103 (6.4%)
3.95 * 10−3 (0.26%)
0.39
(c)
2.1 * 10−2
According to electrical circuits used for different alloys observed in the case of the columnar structure, the spectra are adjusted with the same model. Therefore, it can be assumed that increasing the percentage of zinc does not affect its electrochemical behavior, since in Parra et al. (2013) the same circuit was used for pure tin tested under the same conditions. In the case of the equiaxed zone it was observed that the zinc content in the alloy increases with increasing capacitive contributions.
Also, according to the electric circuit model that fits the spectrum obtained for the Sn-8.9 wt.%Zn alloy, with equiaxed structure, the formation of a second oxide layer on its surface is due to the contribution of CPE3.
Bode plots are obtained for each grain structures of the three alloys (Fig. 12). Fig. 12 shows that the tested specimens have two capacitive contributions, except for Sn-1 wt.%Zn in the equiaxed structure. The first loop, located in the high frequency region corresponds to the capacitance of the double layer, instead of a pure capacitance an element of constant phase is used not only for a good fit but also to remove the dispersion frequency capacitance (Harrington and Devine, 2008). Then, the metal acts as an RC equivalent circuit to the potential difference at the interface metal-solution itself of a metal electrode immersed RC circuit. The second loop, at low frequencies, reveals the presence of an oxide layer for which the resistance to charge transfer (R2) is greater than the polarization resistance (R1), except for the equiaxed structure of Sn-8.9 wt.%Zn alloy. Table 2 shows the values obtained from the resulting adjustment experiences. This feature could be interpreted as a preferential dissolution of zinc as a form of selective corrosion of Sn-Zn alloys.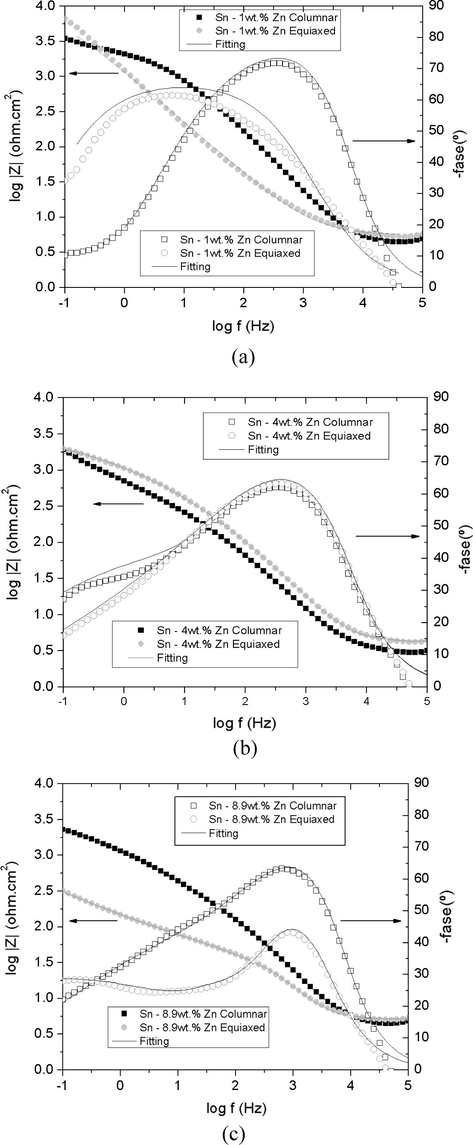
Bode diagrams superposed structures according to the type of grain structures of alloys. (a) Sn-1 wt.%Sn. (b) Sn-4 wt.%Zn. (c) Sn-8.9 wt.%Zn.
The low definition of the second semi-circle, could be attributed to a variation in the chemical composition of the oxide film and the various processes of diffusion and/or dissolution that develop through it. In the case of the equiaxed zone of Sn-8.9 wt.%Zn alloy has a third contribution attributed to a second layer, formed as a result of the deposit of corrosion products on the surface of the specimens. According to Dubent et al. (2010), the charge transfer occurs without mass transport by dissolving the alloy.
A decrease in the corrosion resistance was observed for the two structures of grain with increasing zinc content of alloys. This feature is consistent with the results of potentiodynamic polarization measurements, which indicate that the alloys are more susceptible to pitting corrosion with increasing zinc content in the alloy.
This fact agrees with reports in Liu et al. (2015a,b,c). In addition, it was observed that in the case of Sn-4 wt.%Zn and Sn-8.9 wt.%Zn alloys, the columnar structure has greater corrosion resistance than the equiaxed structure, while in the case of Sn-1 wt.%Zn the equiaxed zone is more resistant to corrosion than the columnar structure.
4 Conclusions
After considering the measures of cyclic potentiodynamic polarization curves and the EIS tests conducted in Sn-1 wt.%Zn, Sn-4 wt.%Zn and Sn-8.9 wt.%Zn, we conclude the following:
The zinc content in the alloys does not significantly affect the corrosion potentials (Ecorr).
The corrosion resistance increases in the direction of reducing the percentage of zinc in the alloy; this is evidenced by the decrease in current in the pseudopassive zone as the zinc content decreases.
The interdendritic zone (zinc rich) is the phase more susceptible to localized corrosion in the case of the two-grain structures of alloys.
The alloys have two capacitive contributions that are attributed to charge transfer, diffusion and dissolution processes, which are developed in layers composed of corrosion products.
Regarding the structure, columnar zones of Sn-4 wt.%Zn and Sn-8.9 wt.%Zn alloys are more resistant to corrosion than the equiaxed zones. However, for the Sn-1 wt.%Zn alloy this is reversed.
The columnar grain structure has the same equivalent circuit in all alloys, while the equiaxed grains present a greater number of capacitive contributions as rising the weight percentage in zinc alloys.
Acknowledgments
V. L. Schreiber acknowledges the financial support of the Executive Committee of Development and Technological Innovation (CEDIT) to perform this research.
This work was supported by PICT-2012-2952 of the National Agency for Promotion of Science and Technology of Argentina.
Thanks are due to the Argentinean Research Council (CONICET) for the financial support.
References
- Numerical calculation of the drag force applied to particle pushing. J. Cryst. Growth. 2008;310:1366-1370.
- [Google Scholar]
- Corrosion behavior of Sn-9Zn-XBi lead-free solder alloys in NaCl 3% solution. Mat. Sci. Ind. J.. 2015;13:69-76.
- [Google Scholar]
- Corrosion susceptibility of Zn–Al alloys with different grains and dendritic microstructures in NaCl solutions. Corros. Sci.. 2012;59:290-306.
- [Google Scholar]
- Semi-empirical modeling for columnar and equiaxed growth of alloys. J. Cryst. Growth. 2002;241:235-240.
- [Google Scholar]
- Correlation between thermal parameters, structures, dendritic spacing and corrosion behavior of Zn-Al alloys with columnar-to-equiaxed transition. J. Cryst. Growth. 2008;310:1355-1361.
- [Google Scholar]
- Corrosion and wear resistance of hypoeutectic Zn-Al alloys as a function of structural features. Mater. Chem. Phys.. 2012;136:394-414.
- [Google Scholar]
- Investigation of Sn–Zn electrodeposition from acidic bath on EQCM. J. Alloy Comp.. 2011;509:1534-1537.
- [Google Scholar]
- Electrodeposition and characterization of tin-zinc alloy coatings. Appl. Surf. Sci.. 1996;103:159-169.
- [Google Scholar]
- Guide for Development and Use of a Galvanic Series for Predicting Galvanic Corrosion Performance. West Conshohocken, PA: ASTM Book of Standards; ASTM International; 2006.
- EIS evaluation of steady-state characteristic of 316L stainless steel passive film grown in acidic solution. Electr. Comm.. 2013;26:10-12.
- [Google Scholar]
- The analysis of electrode impedances complicated by the presence of a constant phase element. J. Electr. Chem. Interfacial. 1984;176:275-295.
- [Google Scholar]
- Corrosion resistance of ZrN films on AISI 304 stainless steel substrate. Surf. Coat. Technol.. 2003;167:59-67.
- [Google Scholar]
- The electrodeposition and properties of tin-zinc alloys. J. Electrochem. Soc.. 1948;94:73-98.
- [Google Scholar]
- Composition control of tin–zinc electrodeposits through means of experimental strategies. Mater. Chem. Phys.. 2007;104:146-152.
- [Google Scholar]
- Electrodeposition, characterization and corrosion behaviour of tin–20 wt.% zinc coatings electroplated from a non-cyanide alkaline bath. Mater. Chem. Phy.. 2010;120:371-380.
- [Google Scholar]
- Design of lead-free candidate alloys for low-temperature soldering applications based on the hypoeutectic Sn–6.5Zn alloy. Mater. Des.. 2014;56:594-603.
- [Google Scholar]
- Initial Sn-119 Mossbauer spectroscopy and X-ray diffractometry investigations of electrodeposited tin-chromium and tin-zinc-chromium alloys. J. Rad. Nucl. Chem.. 2000;246:137-141.
- [Google Scholar]
- Disolución selectiva (Dealeado) In: Baudino Jorge., ed. Degradación de materiales, Corrosión, Capítulo 12, Buenos Aires, Argentina. Monografías Tecnológicas; 2006.
- [Google Scholar]
- Globular-to-needle Zn-rich phase transition during transient solidification of a eutectic Sn–9%Zn solder alloy. Mater. Let.. 2009;63:1314-1316.
- [Google Scholar]
- Microstructural development and mechanical properties of a near-eutectic directionally solidified Sn–Bi solder alloy. Mater. Char.. 2010;61:212-220.
- [Google Scholar]
- Tin–zinc electrodeposition from sulphate–gluconate baths. J. Elec. Chem.. 2003;549:25-36.
- [Google Scholar]
- Tin–zinc electrodeposition from sulphate–tartrate baths. J. Elec. Chem.. 2005;575:301-309.
- [Google Scholar]
- Vertical and horizontal directional solidification of Zn-Al and Zn-Ag diluted alloys. Mater. Trans.. 2010;51:1861-1870.
- [Google Scholar]
- Analysis of electrodes displaying frequency dispersion in Mott-Schottky tests. J. Electr. Soc.. 2008;155:C381-C386.
- [Google Scholar]
- Effects of composition and reflowing on the corrosion behavior of Sn–Zn deposits in brine media. Electrochim. Acta. 2006;51:4125-4134.
- [Google Scholar]
- CPE analysis by local electrochemical impedance spectroscopy. Electrochim. Acta. 2006;51:1473-1479.
- [Google Scholar]
- Corrosion mechanism of Al, Al–Zn and Al–Zn–Sn alloys in 3 wt.% NaCl solution. Corr. Sci.. 2014;87:504-516.
- [Google Scholar]
- Allanore A., Bartlett L., Wang C., Zhang L., Lee J., eds. EPD Congress.Allanore A., Bartlett L., Wang C., Zhang L., Lee J., eds. Solidification and Evaluation of Thermal of Sn-Zn Eutectic Alloys Horizontally Solidified. John Wiley & Sons Inc; 2016.
- [CrossRef]
- Corrosion characterization of tin–lead and lead free solders in 3.5 wt.% NaCl solution. Corr. Sci.. 2008;50:995-1004.
- [Google Scholar]
- The electrochemical corrosion behaviour of Pb-free Al-Zn-Sn solders in NaCl solution. Mater. Chem. Phys.. 1998;56:171-176.
- [Google Scholar]
- The potentiodynamic polarization behavior of Pb-free XIn-9(5Al- Zn)-YSn solders. Mater. Chem. Phys.. 1998;53:55-59.
- [Google Scholar]
- Tensile properties and microstructure of AZ31B magnesium alloy sheet processed by repeated unidirectional bending. Trans. Nonferrous Met. Soc. China. 2010;20:s638-s642.
- [Google Scholar]
- The role of Zn precipitates and Cl− anions in pitting corrosion of Sn–Zn solder alloys. Corr. Sci.. 2015;92:263-271.
- [Google Scholar]
- Metastable pitting and its correlation with electronic properties of passive films on Sn–xZn solder alloys. Corr. Sci.. 2015;99:154-163.
- [Google Scholar]
- Ti addition to enhance corrosion resistance of Sn–Zn solder alloy by tailoring microstructure. J. Alloys Comp.. 2015;644:113-118.
- [Google Scholar]
- Effects of intermetallic-forming element additions on microstructure and corrosion behavior of Sn–Zn solder alloys. Corr. Sci. 2016
- [CrossRef] [Google Scholar]
- The polarization characteristics of Pb-free Sn–8.5 Zn–XAg–0.1 Al–0.05 Ga alloy in 3.5% NaCl solution. Corr. Sci.. 2007;49:2815-2831.
- [Google Scholar]
- Electrochemical corrosion behaviour of Pb-free Sn–8.5 Zn–0.05 Al–XGa and Sn–3Ag–0.5 Cu alloys in chloride containing aqueous solution. Corr. Sci.. 2008;50:2437-2443.
- [Google Scholar]
- The dissolution and passivation kinetics of stainless alloys containing molybdenum—II. Dissolution kinetics in artificial pits. Corr. Sci.. 1985;25:341-350.
- [Google Scholar]
- Metallography and microstructures of zinc and its alloys. Metallography and microstructures.ASM Handbook Series. Vol vol. 9. ASM Int.; 2004. p. :933-941.
- Electrochemical behavior of Zn-rich Zn-Cu peritectic alloys affected by macrosegregation and microstructural array. Electr. Acta. 2012;76:218-228.
- [Google Scholar]
- Pit formation and growth of alloy 600 in Cl− ion-containing thiosulphate solution at temperatures 298–573 K using fractal geometry. Corr. Sci.. 2003;45:995-1010.
- [Google Scholar]
- Corrosion resistance of Zn-Sn alloys horizontally directionally solidified. TMS Annual Meeting 2013:135-142.
- [Google Scholar]
- Microstructure of zinc hot-dip galvanized coatings used for corrosion protection. Mat. Let.. 2006;60:786-789.
- [Google Scholar]
- Aspects of the effects of electrolyte composition on the occurrence of metastable pitting on stainless steel. Corros. Sci.. 1994;36:525-538.
- [Google Scholar]
- Inhibition of copper corrosion by isatin in aerated 0.5 M H2SO4. Corr. Sci.. 2003;45:715-733.
- [Google Scholar]
- Analysis of corrosion resistance in simulated acid rain of Zn-Sn alloys. Revista Matéria. 2015;20:597-611.
- [Google Scholar]
- Electrodeposition of low tin content zinc–tin alloys. Surf. Coat. Technol.. 1996;82:226-231.
- [Google Scholar]
- EQCM studies of the electrodeposition and corrosion of tin–zinc coating. Electrochim. Acta. 2001;46:3835-3840.
- [Google Scholar]
- Corrosion resistance of electroplated Sn-Zn alloy and its improvement. Plat. Surf. Finish.. 2002;89:80-83.
- [Google Scholar]
- Corrosion behavior of electroplated tin-zinc coatings. Plat. Surf. Finish.. 2004;91:34-37.
- [Google Scholar]
- Corrosion behaviour of superplastic Zn-Al alloys in simulated acid rain. Corros. Sci.. 2012;59:229-237.
- [Google Scholar]
- Corrosion and Electrochemistry of Zinc. Ed. Plenum Press; 1996.
- Galvanic corrosion of zinc and its alloys. J. Electrochem. Soc.. 1996;143:1472-1484.
- [Google Scholar]
- Development of corrosion resistant galvanizing alloys. Edgbaston, Birmingham, Reino Unido: School of Engineering - University of Birmingham; 2005. Thesis de D. Fi
- The influences of sealing methods on corrosion behavior of anodized aluminum alloys in NaCl solutions. Surf. Coat. Technol.. 2003;166:237-242.
- [Google Scholar]


