

Translate this page into:
Electrochemical determination of rosiglitazone by square-wave adsorptive stripping voltammetry method
*Corresponding author. Tel.: +966 504737970 aghamdi@taibahu.edu.sa (Ali F. Al-Ghamdi)
-
Received: ,
Accepted: ,
This article was originally published by Elsevier and was migrated to Scientific Scholar after the change of Publisher.
Available online 21 July 2011
Abstract
Square-wave adsorptive stripping voltammetry technique was used to determine rosiglitazone (ROS) on the hanging mercury dropping electrode (HMDE) surface, in Britton Robinson buffer, pH = 5. The voltammetric cathodic peak was observed at −1520 mV vs. Ag/AgCl reference electrode. The voltammetric peak response was characterized with respect to pH, supporting electrolyte, accumulation potential, preconcentration time, scan rate, frequency, pulse amplitude, surface area of the working electrode and the convection rate. Under optimal conditions, the voltammetric current is proportional to the concentration of ROS over the concentration range of 5 × 10⁻⁸–8 × 10⁻⁷ mol l−1 (r = 0.9899) with a detection limit of 3.2 × 10⁻¹¹ mol l−1 using 120 s accumulation time. The developed SW-AdSV procedure showed a good reproducibility, the relative standard deviation RSD% (n = 10) at a concentration level of 5 × 10⁻⁷ mol l−1 was 0.33%, whereas the accuracy was 101% ± 1.0. The proposed method was successfully applied to assay the drug in the human urine and plasma samples with mean recoveries of 90 ± 0.71% and 86 ± 1.0%, respectively.
Keywords
Rosiglitazone
Square wave voltammetry
Adsorptive stripping voltammetry
Pharmaceutical formulations
Biological fluids

1 Introduction
Stripping voltammetry method has been shown to be an efficient electroanalytical technique for the determination of sub-nanomolar levels of a wide range of drugs that have an interfacial adsorptive character onto the working electrode surface. It usually involves a simple accumulation step, and most of the excipients used do not interfere in the subsequent determination of drugs (Wang, 2002). The technique is easy to use, saves of time and costs, low detection limit, high accuracy, wide concentration range, applicability to colored and turbid solutions. Many of the adsorptive stripping voltammetric (AdSV) approach features such as sensitivity, selectivity, simplicity and versatility attributed to the combination of an effective preconcentration step based on non-electrolytic adsorptive accumulation process with advanced measurement procedures such as differential pulse (DP) or square wave (SW) (Wang, 1985, 1994, 1988; Brainina and Neyman, 1993; Kalvoda, 1996). Unlike conventional stripping approaches (anodic and cathodic stripping voltammetry), which are based on an electrolytic nature of the preconcentration step, adsorptive stripping voltammetric approach in contrast is based on adsorptive accumulation of the analyte on the electrode at open circuit with no charge transferred. Consequently, for a wide range of surface-active organic and inorganic species, which cannot be preconcentrated electroanalytically, the adsorption approach allows these analytes to be interfacially accumulated on the electrode and hence analyzed. There have been many reviews devoted to emphasize and illustrate the wide spectrum and scope of adsorptive stripping voltammetric applications and potentialities in the analysis of metal ions (Zaitsev et al., 1999; Abu Zuhri and Voelter, 1998) organic analytes (Brainina et al., 2000; Sirajuddin et al., 2008) and pharmaceutical drugs and biomedical compounds, such as, the anti-inflammatory drug lornoxicam, the antidepressant drug sulpiride and josamycin, a Macrolide Antibiotic (Alghamdi, 2002; Vire et al., 1998; Ghoneim et al., 2002; Farghaly, 2000; Alghamdi et al., 2006).
Rosiglitazone maleate (ROS), 5-[[4-[2-(methyl-2-Pyridinylamino)ethoxy]phenyl] methyl]-2,4-thiazolidinedione; is one of the newly available members of the thiazolidinedione family that act primarily by reducing insulin resistance (Wiley et al., 2005; O’Neil, 2006). It works as an insulin sensitizer, by binding to the PPAR receptors in fat cells and making the cells more responsive to insulin. There are various methods reported for the estimation of ROS in tablets (Radhakrishna et al., 2002; Gomes et al., 2004), in human plasma (Hruska and Frye, 2004; Kolte et al., 2003; He et al., 2007) and in urine (Chou et al., 2005). The methods are also available for the simultaneous estimation of ROS in combination with other antidiabetics (Ho et al., 2004; Thevis et al., 2005; Wang and Miksa, 2007; Yao et al., 2007; Lin et al., 2004; Yardimci et al., 2007; Mamidi et al., 2002).
The evaluation of the quality of drug substance requires complete understanding on the chemistry of the drug molecule, its potential process and degradation related impurities. These methods included high performance liquid chromatography (HPLC) (Gomes et al., 2004; Mamidi et al., 2002; Patil et al., 2011; Bazargan et al., 2011), liquid chromatography (LC) (Hruska and Frye, 2004; Yardimic and Ozaltin, 2007), LC–UV (Jinger et al., 2008), polarography (El-Sherbiny et al., 2008), anodic voltammetry (Dogan et al., 2010) and CE–ESI–MS (Znaleziona et al., 2011).
2 Experimental
2.1 Instrumentation and chemicals
All voltammetric measurements were carried out with 797 VA Computrace (Metrohm, Switzerland) in connection with Dell computer and controlled by (VA computrace 2.0) control software. Stripping voltammograms were obtained via a HP color laserjet CP 1215 printer. A conventional three electrode system was used in the hanging mercury drop electrode (HMDE) mode. pH values were measured with Hanna pH 211 (Romania made). Biohit adjustable micropipette (AU), and Brand adjustable micropipette (Germany), were used to measure microliter volumes of the standard solutions. The labofuge 200 instrument, Heraeus sepatech (Germany) was used for centrifuging of biological fluids to suite for stripping analysis.
All chemicals were used for analytical reagent grade and they were used without further purification. Rosiglitazone drug was obtained from Sigma Chemical Co. (St Louis, MO, USA). ROS stock solution of 1 × 10⁻² mol l−1 was prepared by dissolving the appropriate amount of this drug in ethanol in a 25 ml volumetric flask and this stock solution was stored in the dark. Britton–Robinson supporting buffer was prepared by dissolving 2.47 g of boric acid (Winlab, UK) in 500 ml distilled water containing 2.3 ml of glacial acetic acid (BDH, UK) and then adding 2.7 ml of ortho-phosphoric acid (Riedal-deHaen, Germany) and diluting to 1000 ml with distilled water. In addition, phosphate supporting buffer [0.1 M NaH2PO4 (Winlab, UK) and 0.1 M H3PO4] was prepared by dissolving 12 g of NaH2PO4 and 6.78 g of H3PO4 in 1000 ml distilled water. Acetate supporting buffer (0.02 M in each constituent) was prepared by dissolving 1.68 g of sodium acetate (Winlab, UK) in 500 ml distilled water containing 1.12 ml of acetic acid and diluting to 1000 ml with distilled water. Finally, carbonate supporting buffer (0.1 M in each constituent) was prepared by dissolving 10.6 g of sodium carbonate (BDH, UK) and 8.4 g of sodium hydrogen carbonate (Winlab, UK) in 1000 ml distilled water.
2.2 Procedures and analysis
2.2.1 Analysis of standard ROS
The general procedure adopted for obtaining square wave adsorptive stripping, differential pulse polarogram and cyclic voltammograms was as follows: A 10 ml aliquot of B–R supporting buffer (unless otherwise stated) at desired pH was pipetted in a clean and dry electrochemical cell and the required standard solutions of ROS drug were added. The test solutions were purged with nitrogen for 5 min initially, while the solution was stirred. The accumulation potential of −0.2 V vs. Ag/AgCl was applied to a new mercury drop while the solution was stirred for 120 s. Following the preconcentration period, the stripping was stopped and after 20 s had elapsed, cathodic scans were carried out over the range 0.0 to –2.0 V. The used SW-AdSV procedure recorded a good reproducibility, the relative standard deviation RSD% (n = 10) at a concentration level of 5 × 10⁻⁷ mol l−1 ROS was 0.33%. All measurements were made at room temperature.
2.2.2 Analysis of ROS in spiked urine and human plasma
Accurately measured aliquots of ROS solutions were pipetted into centrifugation tubes containing 500 μl human plasma and/or urine, then vortex was done for 5 min. Into each tube, 0.5 ml of methanol, 0.1 ml NaOH (0.1 M), 0.5 ml ZnSO4·7 H2O (5% w/v) (Al-Ghamdi et al., 2008), were added, then centrifuged for 8 min at 4000 rpm. The clear supernatant layer was filtered through 0.45 μm Milli-pore filter. A 0.1 ml of the supernatant liquor was transferred into the voltammetric cell then completed to 10 ml with a pH 5 B–R universal buffer. Then, ROS was quantified by means of the proposed stripping voltammetric procedure.
3 Results and discussion
3.1 The electrochemical behavior of ROS
The differential pulse polarographic behavior was investigated for ROS compound in Britton–Robinson buffer at pH 5 as shown in Fig. 1, a broad polarographic wave at Ep = −1550 mV was observed. Based on the polarographic studies which were carried out on ROS, this obtained polarographic wave is probably due to the electrochemical reduction of Carbonyl group, to alcohol group (Smyth, 1992; Kolthoff and Lingane, 1965; Zuman, 1970; Morrison and Boyd, 1992). A proposed mechanism for the electrochemical reduction of this electroactive group is given in Scheme 1. This mechanism suggests that the electrochemical reaction is an irreversible process, an assumption which was confirmed by cyclic voltammetric measurement at HMDE and 20 mV/s scan rate of ROS in B–R buffer (pH 5). As can be seen from Fig. 2, no anodic peak was observed on the measured cyclic voltammogram, indicating the irreversibility nature of the cathodic reduction process. The interfacial accumulation of the drug was designated from multi-cyclic voltammograms for ROS recorded following stirring for 120 s at −0.2 V prior to the first scan produced considerable cathodic peak (scan 1) as can be seen from Fig. 3. Thereafter, the subsequent repetitive scans with substantial decrease of the monitored electrochemical signal indicate weak adsorption of ROS onto the working electrode surface. In addition, the observed peak potential shifts to more negative values on the increase of scan rate that confirmed the irreversible nature of the studied cathodic reduction process. The strong adsorption phenomenon of ROS can be used as an effective preconcentration step prior to the actual voltammetric quantification of the analyte. The adsorptive stripping voltammetric response of ROS at HMDE was examined in Britton–Robinson buffer pH 5 using a square wave (SW) excitation waveform. The electrochemical current intensity for the cathodic reduction of ROS recorded by the square wave voltammetric technique was many times higher than that generated by the differential pulse excitation mode. Due to its intense sensitivity, therefore SW-AdSV approach was used in all the subsequent experiments. Fig. 4 shows a square-wave adsorptive stripping voltammogram for 5 × 10⁻⁷ mol l−1 ROS after 120 s accumulation potential at -0.2 V, which illustrates a single well-defined AdSV peak at −1520 mV vs. Ag/AgCl reference electrode.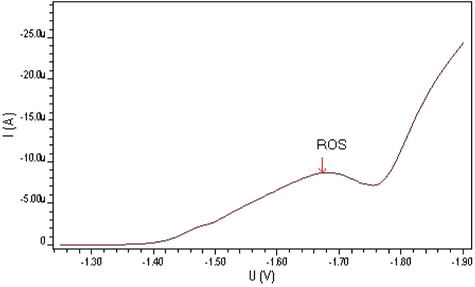
Differential pulse polarography of 2 × 10⁻⁵ M ROS at B–R pH 5, 20 mV/s scan rate and I = −3110 nA.
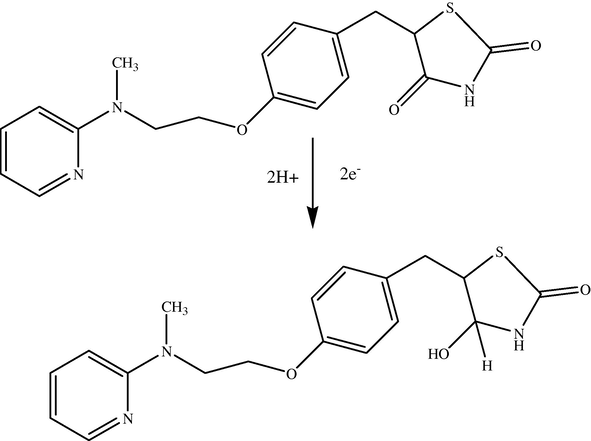
Suggested mechanism of the studied electrochemical reduction process for rosiglitazone drug.
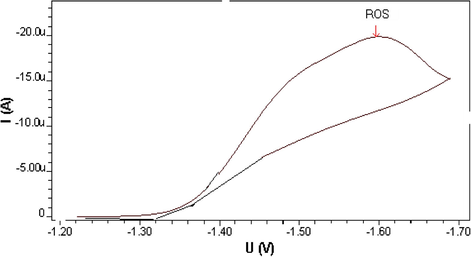
Cyclic voltammogram of 2 × 10⁻⁵ M ROS at B–R pH 5, 20 mV/s scan rate and I = −23950 nA.
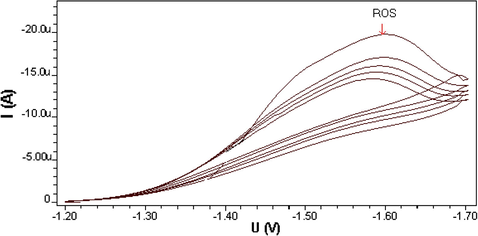
Multi-cyclic voltammograms of 2 × 10⁻⁵ M ROS at B–R pH5, 20 mV/s scan rate and (Sweep 1 = −17500 nA, Sweep 2 = −11150 nA, Sweep 3 = −10610 nA, Sweep 4 = −9700 nA, Sweep 5 = −9400 nA).
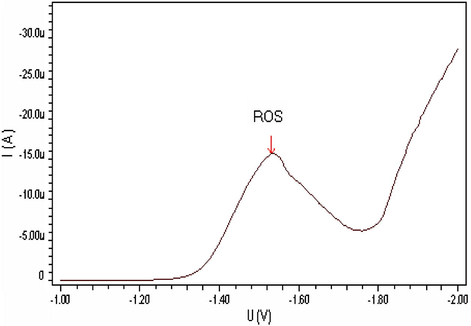
Square wave adsorptive stripping voltammogram of 5 × 10⁻⁷ M ROS at B–R pH5, 200 mV/s scan rate and I = −12480 nA.
3.2 Optimum parameters and experimental conditions
3.2.1 Effect of supporting buffer and pH
Since the adsorptive phenomenon of ROS on the HMDE was utilized as a suitable collection step prior to its voltammetric determination, it was rational to characterize various variables and experimental conditions that affected the engaged adsorption process. In fact, the sensitivity of the square wave-adsorptive stripping procedure for a particular analyte is usually significantly influenced by the composition of the supporting buffer and pH value. Consequently, several supporting buffers such as Britton–Robinson (pH3, pH7 and pH10), phosphate (pH3), acetate (pH3) and carbonate (pH10) buffers were evaluated after 60 s accumulation time at −0.4 V accumulation potential. Among these supporting electrolytes the best electroanalytical signal in terms of SW-AdSV peak current intensity and shape was obtained with B–R buffer (pH3), which was selected as optimal for further works. Generally, the AdSV signal was mainly pH dependent since the monitored voltammetric signal was only observed at acidic media. When the stripping voltammetric peak current was measured as a function of pH over the range 2–6.5, the peak current increased gradually at first and enhanced sharply beyond pH 5 then it reached its maximum value at pH 5, which was adopted as optimum pH value for subsequent investigations. The influence of pH factor on the SW-AdSV signal is illustrated in Fig. 5. In addition, it was observed that the voltammetric peak potential of ROS did not shift when pH was varied over the studied pH range.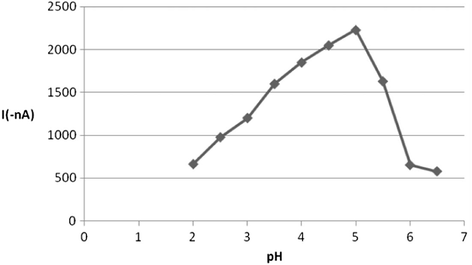
Effect of pH on the voltammetric current for 5 × 10⁻⁷ M ROS at B–R buffer.
3.2.2 Effect of accumulation time and potential
The interfacial accumulation of ROS onto the HMDE surface depends on some operational factors, which were worth additional investigations in order to ensure high sensitive determinations of this drug. Therefore, the effect of accumulation time on the efficiency of the collection of 5 × 10⁻⁷ mol l−1 ROS drug onto the working electrode surface was evaluated by raising the accumulation time over the range of 0–180 s. The resulting peak current-accumulation time (ip−tacc) profile is exhibited in Fig. 6 and as can be seen from this plot, a steady enhancement in the peak current was observed over the range 0–120 s and thereafter the peak intensity nearly decreased probably due to the saturation of the HMDE surface. Hence, 120 s accumulation time was selected for all the future experiments. Furthermore, variation of the accumulation potential over the range from −0.9 to +0.6 V (Fig. 7) at 120 s accumulation time revealed that a preconcentration potential of −0.2 V was the ideal choice for optimal sensitivity.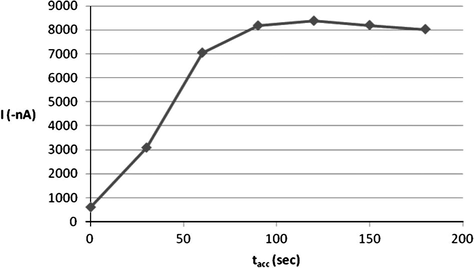
Effect of accumulation time (tacc) on 5 × 10⁻⁷ M ROS peak current at B–R buffer, pH = 5.
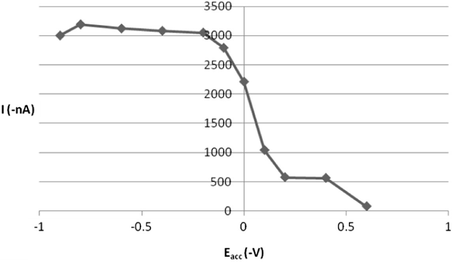
Effect of accumulation potential (Eacc) on 5 × 10⁻⁷ M ROS peak current at B–R buffer, pH = 5, tacc 120 s.
3.2.3 Effect of potential scan conditions
The observed stripping voltammetric signal can be further maximized by adjusting the way the applied potential was scanned. The relationship between the measured peak intensity and scan rate was found to be directly proportional over 100–200 mV s−1 scan arte (from studied range of 100–1000 mV s−1). However, when scan rates faster than 200 mV s−1 were employed, the peak current decreased slightly. The influence of scan rate on the observed voltammetric signal is illustrated in Fig. 8, which indicates that a scan rate value of 200 mV s−1 would be an adequate optimum for succeeding investigations.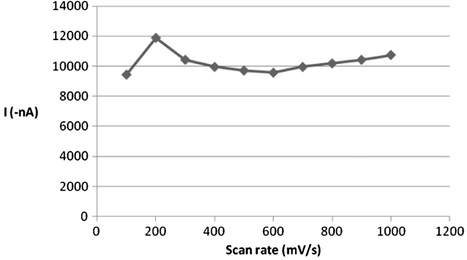
Effect of scan rate on 5 × 10⁻⁷ M ROS peak current at B–R buffer, pH = 5, tacc 120 s, Eacc = −0.2 V.
In addition, the impact of varying the excitation wave pulse amplitude on the voltammetric current intensity was also evaluated. The effect of this operating variable was studied over the range of 10–100 mV (Fig. 9) and the current was increased by increasing of pulse amplitude. It was observed that the best shape of peak was obtained at 60 mV pulse amplitude. After 60 mV, the shape of the peak was not so good. So, 60 mV pulse amplitude was the ideal choice for this operational parameter. Moreover, varying the value of square wave frequency also plays an important role for the measured signal of SW-AdSV approach. Varying this parameter over the range of 10–100 Hz resulted in a substantial enhancement of the voltammetric peak current particularly at range of 10–30 Hz as can be seen from Fig. 10, then the peak of current was gradually decreased. Accordingly, for future work 30 Hz SW frequency value was adopted.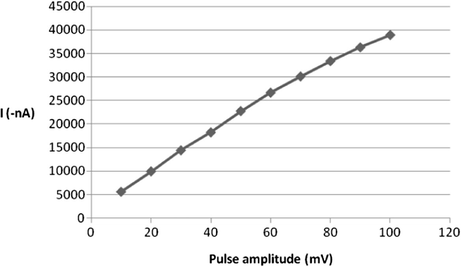
Effect of pulse amplitude on 5 × 10⁻⁷ M ROS peak current at B–R buffer, pH = 5, tacc = 120 s, Eacc = −0.2 V, 200 mV/s scan rate.
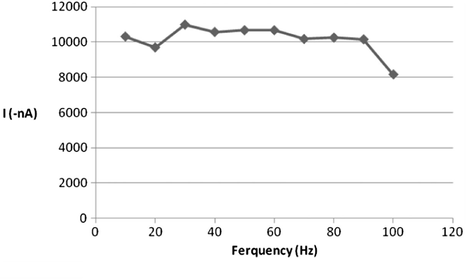
Effect of square wave frequency on 5 × 10⁻⁷ M ROS peak current at B–R buffer, pH = 5, tacc = 120 s, Eacc = −0.2 V, 200 mV/s scan rate, 60 mV pulse amplitude.
3.2.4 Effect of other instrumental variables
The influence of other operating parameters such as the size of the adsorption area (HMDE) and convection rate on the efficiency of the adsorption accumulation of ROS was additionally checked. As expected, a linear enhancement for the electrochemical peak intensity was observed when the surface area of HMDE increased over the range of 0.15–0.6 mm2 drop size area. Besides, the SW-AdSV peak current can be maximized further by increasing the stirring rate of the rotating rod over the range of 0–3000 rpm as shown Fig. 11. Hence, for optimal sensitivity, 0.6 mm2 drop size and 3000 rpm stirring speed were selected.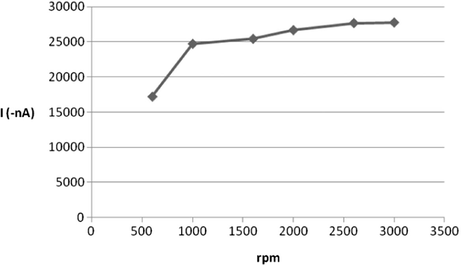
Effect of convection rate on 5 × 10⁻⁷ M ROS peak current at B–R buffer, pH = 5, tacc = 120 s, Eacc = −0.2 V, 200 mV/s scan rate, 60 mV pulse amplitude, 30 Hz, 0.6 mm2.
In conclusion, for electroanalytical purposes, the optimized experimental conditions for SW-AdSV measurements of ROS were accumulating for 120 s at −8.0 V preconcentration potential with a stirring rate of 3000 rpm. These voltammetric measurements were carried out in Britton–Robinson buffer at pH5. The applied potential was scanned at 200 mV s−1 with 30 Hz SW frequency rate and 60 mV pulse amplitude.
3.3 Analytical performance (validation of the method)
3.3.1 Calibration graph (Linearity) and detection limit
Once the optimal chemical conditions and instrumental parameters for the SW-AdSV determination of ROS were established, several analytical characteristics of the proposed were evaluated. Under the optimized conditions, a linear correlation between SW-AdSV peak intensity and the drug concentrations was obtained over the range of 5 × 10⁻⁸ to 8 × 10⁻⁷ mol l−1. The calibration equation was calculated by least-squares method and it has the form: where Ip is the stripping voltammetric peak current in nanoamperes, C is ROS concentration and r is the correlation coefficient. The effective preconcentration step during the adsorption process of the analyzed drug allows a very low detectability. The detection limit estimated based on the signal-to-noise ratio (S/N = 3) was 3.2 × 10⁻¹¹ mol l−1. This obtained sensitivity was significantly preferable than those reported for other analytical techniques used for determination of ROS such as HPLC method (Mamidi et al., 2002) with 3 × 10⁻⁷ mol l−1.
3.3.2 Precision, accuracy and stability
The reproducibility of the developed procedure was evaluated from ten repeated measurements of 5 × 10⁻⁷ mol l−1 ROS drug. The precision of the method in terms of the relative standard deviation (RSD%) was 0.33%. The accuracy of the electrochemical method was checked by calculating the recovery of known amount (1 × 10⁻⁷ mol l−1) of ROS drug spiked in buffer solution and analyzed by the optimized procedure. The results of five measurements obtained by the standard addition method have a recovery mean of 101% ± 1.0. When the SW-AdSV signal of 5 × 10⁻⁷ mol l −1 ROS solution was monitored every 10 min, it was found to nearly stable for a period of 1.5 h at least.
3.4 Analytical applications
The applicability of the SW-AdSV procedure for the analysis of ROS in biological samples was also evaluated by estimating its recovery from spiked urine and plasma samples. A simple and fast pretreatment procedure (Al-Ghamdi et al., 2008) was used. By adding a small amount of 5% ZnSO4·7 H2O solution, NaOH and methanol to the urine or plasma samples and centrifuging the mixture, most of the interfering substances (mainly proteins) were simply removed and eliminated by precipitation. As can be extracted from Table 1, this SW-AdSV method (after appropriate dilution) allowed the determination of ROS in spiked urine and plasma samples with mean recoveries of 90% ± 0.71 and 86% ± 1.0, respectively.
% Drug recovery
Spiked human urine
Spiked human plasma
Added ROS 2 × 10⁻⁷ mol l−1
Reco. ROS conc. 2 × 10⁻⁷ M
91
87
90
87
90
86
90
85
89
85
Mean
90
86
Standard deviation
±0.71
±1.0
4 Conclusion
Square-wave adsorptive stripping voltammetric (SW-AdSV) method has been developed for the determination of rosiglitazone in biological fluids. The principal advantage of the proposed method over the reference potentiometric method is sensitivity and specificity. The proposed voltammetric technique has the advantages of being simpler, faster, more selective and more cost-effective than polarographic procedure. The SW-AdSV method is rapid, requiring about 5 min to run the sample. The possibility of monitoring the compound in human urine and plasma makes the voltammetric method useful for pharmacokinetic and pharmacodynamic purposes.
Acknowledgments
The authors extend their appreciation to the Deanship of Scientific Research at King Saud University and Taibah University for funding the work through the research group project no. RGP-VPP-037. Also, this work was supported by the Chemistry department at Taibah University.
References
- Fresenius J Anal. Chem.. 1998;360:1-9.
- J. Saudi Chem Soc.. 2002;6:185-198.
- Development of adsorptive stripping voltammetric procedure for the determination of josamycin, a macrolide antibiotic. J. Jordan Chem.. 2006;1:171-182.
- [Google Scholar]
- Electrochemical studies and square-wave adsorptive stripping voltammetry of spironolactone drug. Analytical Letter. 2008;41:90-103.
- [Google Scholar]
- J. Pharm. Biomed. Anal.. 2011;55:360-365.
- Electroanalytical Stripping Methods. New York: John Wiley and Sons; 1993. pp. 71–120
- Fresenius J. Anal. Chem. 2000;368:307-325.
- J. Chromatogr. A. 2005;1097:74-83.
- Comb. Chem. High Throuqhput Screen.. 2010;13:694-702.
- Anal. Lett.. 2008;41:806-821.
- Adsorptive stripping voltammetric determination of the antidepressant drug sulpiride. J Pharm Biomed Anal.. 2000;23:783-791.
- [Google Scholar]
- Square-wave adsorptive stripping voltammetric determination of the anti-inflammatory drug lornoxicam. Anal. Sci.. 2002;18:183.
- [Google Scholar]
- J. Pharm. Biomed. Anal.. 2004;36:909-913.
- J. Pharm. Biomed. Anal.. 2007;43:580-585.
- J. Chromatogr. B. 2004;811:65-73.
- J. Chromatogr. B. 2004;803:317-320.
- J. Chromatog.. 2008;67:951-955.
- Kalvoda, R., 1996. in: Zuka J. (ed.), Adsorptive Stripping Voltammetry in Analytical Chemistry II, Ellis Horwood, New York.
- J. Chromatogr. B. 2003;788:37-44.
- Polarography Vol vol. 2. (2nd ed.). New York: John Wiley & Sons; 1965. pp. 683–684
- J. Chromatogr. B. 2004;801:265-272.
- Arzneimittelforschunq.. 2002;52:560-564.
- Organic Chemistry (6th ed.). New York: Prentice Hall, Inc.; 1992. pp. 671–677
- The Merck Index (14th ed.). Whitehouse Station, NJ: Merck & Co, Inc.; 2006. pp. 1484
- Der. Pharmacia Sinica. 2011;2:368-374.
- J. Pharm. Biomed. Anal.. 2002;29:873-880.
- Adsorptive stripping voltammetric determination of hydroquinone using an electrochemically pretreated glassy carbon electrode. Pak. J. Anal. Environ. Chem.. 2008;9:110-117.
- [Google Scholar]
- Voltammetric Determination of Molecules of Biological Significant. New York: John Wiley & Sons; 1992. pp. 65
- Rapid Commun. Mass Spectrum.. 2005;19:928-936.
- J. Pharma. Biomed. Anal.. 1998;7:1323-1335.
- Stripping Analysis: Principles, Instrumentation and applications. Florida: VCH Publishers Inc.; 1985. pp. 1–160
- Electroanalytical techniques in clinical chemistry and laboratory medicine. New York: VCH Publishers Inc.; 1988. pp. 17-20
- Analytical Electrochemistry (2nd ed.). New York: VCH Publishers, inc.; 1994. pp. 44–54
- Analytical Electrochemistry (2nd ed.). New York: Wiley-VCH; 2002.
- J. Chromatogr. B. 2007;856:318-327.
- Foye’s Principles of Medicinal Chemistry Insulin and Oral Hypoglycemic Drugs (5th ed.). New Delhi: (Lippincott Williams and Wilkins; 2005. pp.641-646.
- J. Chromatogr. B. 2007;853:254-259.
- Talanta. 2007;72:1416-1422.
- Chromatogr.. 2007;66:589-593.
- Indus. Lab Diagno. Mater.. 1999;65:1-15.
- J. Separa. Scie.. 2011;34:1163-1173.
- Topic in Organic Polarography. New York: Plenum Press; 1970. pp. 38–67


