

Electrochemical reduced graphene oxide-poly(eriochrome black T)/gold nanoparticles modified glassy carbon electrode for simultaneous determination of ascorbic acid, dopamine and uric acid
⁎Corresponding author. yusran@upm.edu.my (Yusran Sulaiman)
-
Received: ,
Accepted: ,
This article was originally published by Elsevier and was migrated to Scientific Scholar after the change of Publisher.
Peer review under responsibility of King Saud University.
Abstract
This work reports on the preparation of electrochemically reduced graphene oxide (ERGO)-poly(eriochrome black T) (pEBT) assembled gold nanoparticles for the simultaneous determination of ascorbic acid (AA), dopamine (DA) and uric acid (UA) in PBS pH 6.0. Characterisations of the composite were carried out by scanning electron microscopy (SEM), Fourier transform infrared (FTIR), electrochemical impedance spectroscopy (EIS) and cyclic voltammetry. As a result of the synergistic effect, the modified glassy carbon electrode (GCE) possessed an efficient electrochemical catalytic activity with a high selectivity and sensitivity in oxidising AA-DA and DA-UA as compared to the bare GCE. The peak separations of AA and DA, DA and UA were 183 mV and 150 mV, respectively. The linear response ranges for AA, DA and UA were 10–900 μM, 0.5–20 μM and 2–70 μM with detection limits of 0.53 μM, 0.009 μM and 0.046 μM (S/N = 3), respectively. The sensitivity of ERGO-pEBT/AuNPs was measured as 0.003 µA/μM, 0.164 µA/μM and 0.034 µA/μM for AA, DA, and UA, respectively. The modified electrochemical sensor was used in the determination of AA, DA, and UA in vitamin C tablets and urine sample with good recovery.
Keywords
Reduced graphene oxide
Eriochrome black T
Gold nanoparticles
Simultaneous detection

1 Introduction
Ascorbic acid (AA) is an antioxidant that found to be effective in the metabolism and functioning of the human central nervous system. It is viewed as an inhibitor or a potential cure for the common cold, mental illness and cancers (Lian et al., 2014). Dopamine (DA) is a catecholamine neurotransmitter (Gilbert et al., 2009), which has a crucial role in the hormonal action of the cardiovascular, renal and central nervous system (Cheemalapati et al., 2013). Its deficiency may result in diseases such as Schizophrenia and Parkinson’s (Tukimin et al., 2018). Uric acid (UA) is an end product of purine metabolism in human beings. Irregular levels of degradation of purine nucleotide metabolic product of UA may lead to various illnesses such as hyperuricemia, gout, and pneumonia (Ibrahim and Temerk, 2016). In general, the level of UA in serum is 240–520 µM and in urinary excretion ranging from 1.4 to 4.4 mM (Revin and John, 2012). However, the level of base DA in serum is extremely low (0.01–1.0 μM), compared to the concentration of UA and AA which is 100–1000 times more (Ghanbari and Hajheidari, 2015a). The recognition of these electrochemically active species in biological fluids is prominent in the diagnosis and monitoring of various ailments and providing information on interactions involving these species in physiological processes. It is generally accepted that the electrochemical reactions of these species with non-modified electrodes cannot be reversed, implying that the oxidation potentials are very close to each other, leading to a voltammetric overlap response (Balamurugan and Chen, 2007; Ghanbari and Hajheidari, 2015b). The main challenge in its electrochemical determination is the coexistence of AA and UA in body fluids at high levels that easily oxidise a fairly close potential of DA and always interfere with the determination of each species in ordinary electrodes. Therefore, enhancing the sensitive and selective levels of the working electrode for selective or simultaneous determination has become a long-standing challenge for researchers (Tukimin et al., 2017, 2018).
In recent years, electrochemical sensors have gained much attention due to their advantages of operational simplicity, rapid response, cost-effectiveness, high selectivity, and detection sensitivity. The recognition of carbon-based materials, in particular, carbon nanotubes (CNT) and graphene in the last twenty years were the most popular topic in the study of materials. Graphene, a two-dimensional carbon-based material has attracted great interest in the nanoelectronics and electrochemical industry. It is currently being studied for use in electrical catalysis and bio-sensing because of its superior electrical conductivity, high surface area, and chemically stable behaviour. The preparation of graphene can be from graphite by various techniques; such as mechanical peeling, epitaxial growth and also by chemical reduction of graphene oxide (GO). Of the above methods, the most inexpensive is a chemical reduction due to the high reliability and scalability of the method. In addition, other methods have disadvantages such as slow rate and the toxicity of the solvent used. Another approach is the electrochemical reduction of GO, which offers simplicity, relatively low cost, speed, efficiency and the attractiveness of being a green technology. In recent times, the electrochemical reduction of graphene oxide (ERGO) surfaces has been investigated for electrochemical biosensor applications (Khan et al., 2013; Li et al., 2013). Graphene has been used in such sensing platforms as a photoelectrochemical sensor functionalized AuNPs and cerium-doped CdS respectively (Cai et al., 2018; Han et al., 2018), biosensors (Li et al., 2014; Lin et al., 2015; Zhao et al., 2011), and immunosensors (Ren et al., 2017; Xing et al., 2018; Yang et al., 2017). Incorporating noble metal nanoparticles to graphene was performed to detect DA, UA, and AA (Pruneanu et al., 2015; Sun et al., 2011; Wang et al., 2013).
Gold nanoparticles (AuNPs) possess amazing properties viz. biocompatible, low-toxicity and easy separation. It has gained much attention as catalysts in the fields of biomedical, biotechnological and sensing (Chen et al., 2014; Lin et al., 2010). Eriochrome black T (EBT) is an azonaphthol dye that is well known as the metallochromic indicator used in complexometric titrations (Dave et al., 2011), as well as in electrochemical procedures (Chandra et al., 2008; Geng et al., 2008). For the synthesis of nanoparticles, the usage of an organic dye as a stabilising agent gives improved properties rather than other stabilising agents due to it is special ionic, polar, non-bonding functional groups (-azo, -sulphite, -hydroxyl and -nitro) and is a highly conjugated
In this work, we present a facile electrochemical two-steps method to modify glassy carbon electrode (GCE) with ERGO-pEBT and AuNPs nanocomposite in an alkaline medium. The occupancy of graphene leads to an increase in the active surface area. While the interaction of the EBT and AuNPs as well as at ERGO resulted in a fast electron transfer rate and current signal enhancement. Benefiting from the synergistic effects of ERGO, pEBT, and AuNPs, the electrochemical sensor was built up to simultaneously determine AA, DA, and UA. The simultaneous determination of AA, DA, and UA by ERGO-pEBT/AuNPs modified GCE revealed low detection limit, good selectivity, and sensitivity.
2 Experimental
2.1 Chemicals
Chloroauric acid (HAuCl4·3H2O), DA and UA were purchased from Sigma Aldrich. EBT, AA, and GO were received from Fisher Scientific, Merck, and Graphenea, respectively. Potassium ferricyanide K3[Fe(CN)6], potassium ferrocyanide K4[Fe(CN)6] and potassium chloride (KCl) were obtained from BDH Analar. The preparation of phosphate buffer solutions (PBS) was performed by mixing an appropriate volume of 0.2 M KH2PO4 (Merck) and 0.2 M K2HPO4 (Merck), and adjustment was made to the pH with 1 M H3PO4 (Eriendemann Schmidt) or 0.1 M KOH (Hmbg Chemicals). All chemicals were of analytical grade and used without further purification. All solutions were prepared with deionised water acquired from the purification system Milli-Q water (18 MΩ cm).
2.2 Instrumentation
Cyclic voltammetry, differential pulse voltammetry, and electrochemical impedance spectroscopy (EIS) measurements were conducted using a potentiostat/galvanostat (Autolab PSTAT204). Field emission scanning electron microscopy (FESEM) JOELSEM, 6400 was used to characterise the morphology of the composite. Fourier transform infrared spectroscopy (FTIR) measurements were carried out in the range of 4000–280 cm−1 at room temperature with Perkin-Elmer FT-IR spectrophotometer coupled with UTAR accessory.
2.3 Preparation of ERGO-pEBT/AuNPs film modified electrode
Prior to modification, the bare GCE was subjected to polishing to a mirror finish, utilising 0.05 µm alumina slurry. The electrode was then sonicated in 1:1 concentrated HNO3 and distilled water for 10 min each to eliminate any substance adhering to the surface. Finally, it was cycled in 0.1 M H2SO4 and 0.1 M NaOH for 15 cycles to obtain pre-treated GCE followed by rinsing with deionised water. 0.82 mg/ml GO and 0.5 mM EBT were dispersed into 0.1 M PBS pH 9.2 solution under ultrasonic agitation for 15 min. The cleaned GCE was then cycled in GO-EBT ranging between 1.5 and −0.4 V to obtain ERGO-pEBT. The ERGO-pEBT film thickness was optimised by controlling the scan numbers. After drying, the modified GCE was dipped into 0.15 mM HAuCl4 dispersed in 0.1 M PBS (pH 9.0) and cyclic voltammetry was performed for three cycles to obtain ERGO-pEBT/AuNPs/GCE. The other modified electrodes i.e. ERGO/GCE, AuNPs/GCE, pEBT/GCE, pEBT/AuNPs/GCE, and ERGO-pEBT/GCE were also prepared for comparison. The modified electrodes were rinsed thoroughly with water and then dried at 25 °C before use. A typical three-electrode arrangement was operated. The modified GCE was used as working electrode, while Pt wire and Ag/AgCl were utilised as counter and reference electrodes, respectively.
3 Results and discussion
3.1 Preparation of ERGO-pEBT/AuNPs film modified electrode
Fig. 1 presents the cyclic voltammograms (CVs) obtained during the electrodeposition of GO-EBT at 100 mV/s for 15 successive cycles. Fig. 1 shows peaks of oxidation-reduction which have a cathodic peak (I) corresponding to the irreversible (Shao et al., 2010) reduction of oxygenated functional group existing in the GO (Madhu et al., 2015). The anodic peak (IV) and cathodic peak (V) are due to the redox pair of some electrochemically active oxygen-containing groups on graphene planes that have high stability to be reduced by the cyclic voltammetry (Chen et al., 2011; Zhang et al., 2016). The two anodic peaks (II) and (III) and cathodic peak (VI) represents the oxidation-reduction of EBT (Tavares and Sales, 2018). As seen from Fig. 1, there is a reduction in current with the increase in cycle number, which resulted in a less conductive polymer (Tavares and Sales, 2018).
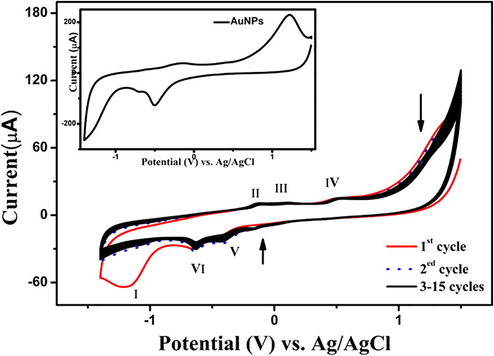
- Electrochemical deposition of ERGO-pEBT on GCE in 0.1 M PBS (pH 9.2) at 100 mVs−1. The inset is the first cycle of deposition of AuNPs on ERGO-pEBT.
Inset Fig. 1 shows the first cycle of ERGO-pEBT/GCE immersed in a solution containing HAuCl4 in 0.1 M PBS (pH 9.2) by scanning the potential from 1.4 to −1.5 V at a scan rate of 100 mVs−1. Two reduction peaks are observed at −0.45 and −0.63 V during the cathodic potential scan. These two peaks are referred to AuCl4− adsorption and reduction of AuCl4− to Au particles, respectively. In addition, there is an anodic peak at +1.14 V which could be assigned to the oxidation of Au nanoparticles (Devasenathipathy et al., 2014). This result indicates that the formation of electroactive Au nanoparticles on the ERGO-pEBT/GCE was successful.
The possible electropolymerisation of GO-EBT and their interaction with AuNP and the analytes are proposed (Geng et al., 2008; Prabakaran et al., 2016; Wei et al., 2013). The ERGO accepts one electron from activated GCE and interacts with pEBT by the
3.2 Optimisation of electrodeposition of ERGO-pEBT/AuNPs on GCE
GO-PEBT film was electropolymerised on GCE using cyclic voltammetry in the potential range of −0.4 to 1.5 V in 0.1 M PBS pH 9.2 supporting electrolyte. An essential factor for improving electrochemical sensor performance is the electrode thickness. Fig. 2(a) shows the effect of ERGO-pEBT scans on top GCE. As the number of cycles increased from 5 to 15, an increase in the anodic peak current is noticed. This may be caused by the increase of the ERGO layers that leads to a larger specific surface area and more active sites. Whereas, at 20th cycle, the anodic peak current declined drastically and it has resulted in the close-packed structure of excess graphene nanosheets at the GCE which reduces the specific surface area and blocks the mass movement (Zhang et al., 2016). Since the highest anodic peak current is obtained at the 15th cycle, therefore this condition is used for the following studies.
![(a) Effect of different ERGO-pEBT cycles in 5.0 mM K3[Fe(CN)6] + 0.1 M KCl solution at 100 mV/s, inset shows the relation between ERGO-pEBT cycles and anodic peak current (b) different concentration of HAuCl4 in 5.0 mM K3[Fe(CN)6 ] + 0.1 M KCl solution at 100 mV/s, inset shows the relation between the HAuCl4 concentration and anodic peak current.](/content/184/2018/11/8/img/10.1016_j.arabjc.2018.09.002-fig2.png)
- (a) Effect of different ERGO-pEBT cycles in 5.0 mM K3[Fe(CN)6] + 0.1 M KCl solution at 100 mV/s, inset shows the relation between ERGO-pEBT cycles and anodic peak current (b) different concentration of HAuCl4 in 5.0 mM K3[Fe(CN)6 ] + 0.1 M KCl solution at 100 mV/s, inset shows the relation between the HAuCl4 concentration and anodic peak current.
Fig. 2(b) shows the effect of different concentration of HAuCl4 on the electrochemical performances of ERGO-pEBT/AuNPs electrode. It can be seen from the CV curves that the maximum peak current is obtained at a concentration of 0.15 mM HAuCl4. The existence of HAuCl4 serves two roles; first, it acts as the chemical oxidant of pEBT and keeps the ratio of benzenoid/quinoid forms at a higher level which accompanies the lower concentration of HAuCl4. Secondly, it represents the source of AuNPs in the composite which resulted in enhanced electrochemical performance (Han et al., 2012). Given the synergistic effect of ERGO, pEBT and Au nanoparticles, an adequate amount of HAuCl4 will affect the electrochemical behaviour of the modified GCE.
3.3 Characterisations
Morphology studies of the modified electrode were performed by FESEM. Fig. 3(a) shows the gauze structure of reduced graphene oxide, which is wrinkled and crumpled. Fig. 3(b) demonstrates pEBT with branch-like shape, thus confirming the polymerisation of pEBT on GCE. When the ERGO-pEBT layer is introduced, the surface becomes uniformly rough as indicated in Fig. 3(c). As shown in Fig. 3(d), the AuNPs are distributed homogeneously on the surface of ERGO-pEBT film.
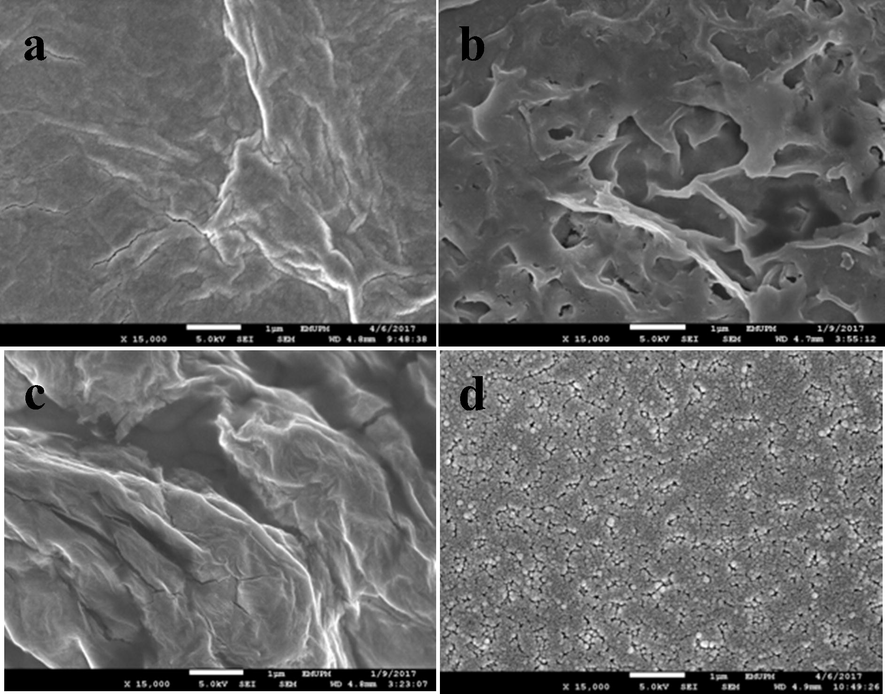
- FESEM images of (a) ERGO, (b) pEBT, (c) ERGO-pEBT and (d) ERGO-pEBT/AuNPs.
The FTIR spectra of GO-EBT and ERGO-pEBT/AuNPs composites are displayed in Fig. 4. The peak at 1246 cm−1 in Fig. 4(a) reveals (—N⚌N—) azo group in EBT (Wei et al., 2013). The peaks at 1061 and 3159 cm−1 are related to C—O stretching and O—H groups, respectively that originated from GO and EBT. While the peaks at 1642 and 842 cm−1 represent the phenyl group and sulfonic group in EBT (Liu et al., 2012). After the electrodeposition of the film, the spectrum of ERGO-pEBT/AuNPs displays some differences due to the interaction between pEBT, ERGO and AuNPs. As shown in Fig. 4(b), the peaks of phenyl ring stretching and sulfonic HSO3− are observed at 1453 and 790 cm−1, respectively. The disappearance of the azo group indicates that the polymerisation of EBT occurred on the —N⚌N— group (Prabakaran et al., 2016) and the absence of —OH peak confirmed the reduction of GO (Yu et al., 2013).
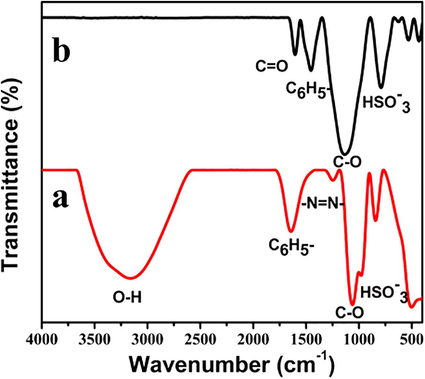
- FTIR of (a) GO-EBT and (b) ERGO-pEBT/AuNPs.
3.4 Electrochemical behavior of ERGO-pEBT/AuNPs/GCE
The CVs of different modified electrodes and bare GCE recorded in the presence of 5.0 mM K3[Fe (CN)6] in 0.1 M KCl at a scan rate of 100 mVs−1 are presented in Fig. 5(a). At the bare GCE, a pair of poor redox peak is visible with a peak separation (ΔEp) of 129 mV, which suggests the sluggish electron transfer at the interface. However, the enhancement is noticed for modified electrodes i.e. ERGO/GCE, pEBT/GCE, ERGO-pEBT/GCE, pEBT/AuNPs/GCE, and AuNPs/GCE. Interestingly, ERGO-pEBT/AuNPs/GCE shows the highest oxidation peak current of 57 µA with ΔEp of 112 mV. These observations indicate that ERGO-pEBT/AuNPs/GCE not only enhances the peak current but also improves the peak separation due to the larger electroactive surface area of the composite upon modification of the GCE. The degree of reversibility of the oxidation-reduction systems is also improved, as implied by a higher oxidation and reduction waves. The highest peak current is observed at ERGO-pEBT/AuNPs/GCE could be ascribed to the effective electrical conductivity of the electrode with the presence of ERGO. Randles–Sevcik equation was used to calculate the active surface area of the ERGO-pEBT/AuNPs/GCE (Abdelwahab and Shim, 2015):
![(a) CVs and (b) Nyquist plots of different modified electrodes in 5.0 mM [Fe(CN)6]−3/−4 + 0.1 M KCl at 100 mVs−1.](/content/184/2018/11/8/img/10.1016_j.arabjc.2018.09.002-fig5.png)
- (a) CVs and (b) Nyquist plots of different modified electrodes in 5.0 mM [Fe(CN)6]−3/−4 + 0.1 M KCl at 100 mVs−1.
Electrochemical impedance spectroscopy (EIS) measurements can give information on the interface properties of the modified electrode surface (Zeng et al., 2006). Nyquist plots of different modified electrodes were studied for conductivity and electron transfer properties as shown in Fig. 5(b). The Nyquist plots comprise a semi-circular part and a linear portion. The higher frequency semi-circular part resembles a limited electron transfer process and its diameter is equal to the charge transfer resistance (Rct), controlling the electron transfer kinetics of the redox sensor to the electrode interface. The linear portion at the lower frequencies indicates the diffusion process (Wang et al., 2011). When the GCE is modified with different composites, it shows different values of resistance. The Rct for ERGO and AuNPs are 94.1 Ω and 157.2 Ω, respectively, while increasing in Rct are found for pEBT (Rct = 639.8 Ω), ERGO-pEBT (Rct = 747.2 Ω), and pEBT/AuNPs (Rct = 920.9 Ω). The increase in Rct values could be explained by the less conductive film of pEBT (Tavares and Sales, 2018). On the other hand, the decrease with ERGO and AuNPs in their individual and binary composite exhibits more facilitating electron transfer. Favouring by the synergistic effect, the ERGO-pEBT/AuNPs gives the lowest Rct which is 57.13 Ω compared to other modified electrodes and bare GCE (Rct = 1036 Ω). These results are in agreement with CV and suggest that the ERGO-pEBT/AuNPs modified GCE can lower the resistance and thus improve the electron transfer process.
3.5 Electrocatalytic oxidation of AA, DA, and UA
The electrochemical oxidation responses of the coexistence of AA, DA and UA in 0.1 M PBS (pH 6.0) were studied at various electrodes using CV. At the bare GCE (Fig. 6(a)), only one oxidation peak is observed, which may be related to the electrode fouling caused by the deposition of AA, DA, and UA and their oxidation products on the electrode surface (Ping et al., 2012). However, the ERGO-pEBT/GCE, AuNPs/GCE, pEBT/GCE, and pEBT/AuNPs/GCE show only two oxidation peaks, assigned to overlapping of AA and DA at same oxidation potential, while UA observed at another potential. Three oxidation peaks are noticed at ERGO modified GCE when exposed to AA, DA, and UA with a broad peak at AA. In contrast, ERGO-pEBT/AuNPs/GCE displays more prominent oxidation peaks at 0.15, 233 and 370 mV implying the oxidation of AA, DA, and UA, respectively. It is also observed that the peak currents of UA, DA, and AA are improved considerably with the shift to more negative potentials compared to other modified electrodes. This improvement is attributed to the different interaction between the three analytes and the composite of the ERGO-PEBT/AuNPs. For AA, a formation of hydrogen bonds between lactone of AA and the carboxylic and sulphate groups at ERGO and pEBT, respectively would enhance the peak current. The DA shows the electrostatic interaction between positively charged of DA and negatively —NO2, SO−3 and —COOH at ERGO-pEBT, as well as the
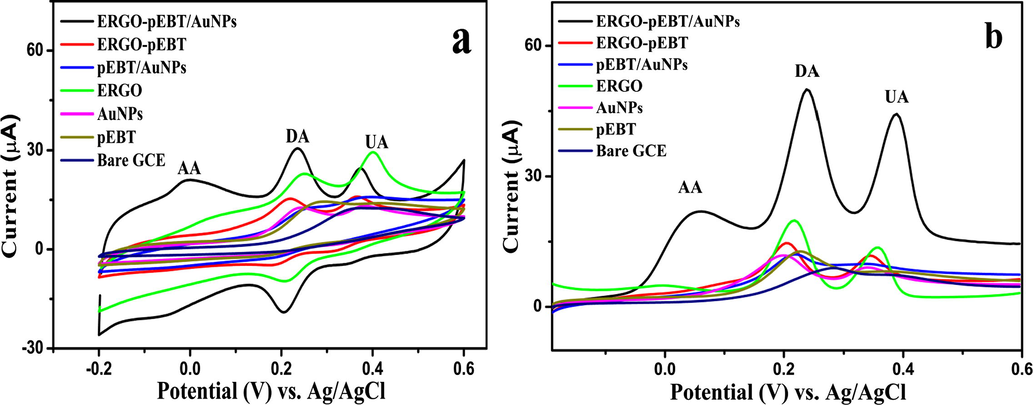
- (a) CVs of 10 mM AA, 50 µM DA and 200 µM UA in 0.1 M PBS (pH 6.0) at different modified electrodes (b) DPV of 1 mM AA, 70 µM DA 100 µM UA at modified electrode and bare GCE.
These results resembled by the differential pulse voltammograms (DPVs) obtained from AA, DA and UA mixture solution at various modified electrodes as shown in Fig. 6(b). The voltammetric peak is broken down into three peaks i.e. 55, 238 and 388 mV at ERGO-pEBT/AuNPs/GCE, and the peak potentials of AA, UA, and DA can be distinguished separately. The ΔEP values for AA-DA and DA-UA are 150 mV and 183 mV, respectively. Therefore, the ERGO-pEBT/AuNPs can be used to determine UA, DA, and AA simultaneously with obvious and pre-eminent sensitive and selective properties. Such an improvement in electron transfer kinetics is resulted from a synergistic effect associated with each component in ERGO-pEBT/AuNPs/GCE. The high density of edge plane-like defective sites on ERGO sheets can provide more favourable sites for transferring the electron to AA, DA, and UA and would promote the electron transfer (Ping et al., 2012). The AuNPs in the presence of oxygenated pre-monolayer that is found in GO-EBT can easily aid the nanoparticle growth. This can provide more conductive tunnels as well as active sites which enhances the oxidation AA, DA, and UA at the electrode surface (Du et al., 2013; Plowman et al., 2010). Thus, the synergistic manner of the combined of ERGO-pEBT and AuNPs nominated the composite for the electrocatalytic application.
3.6 Effect of solution pH
The influence of the pH of the solution on the potential response and peak current for AA, DA and UA at ERGO-pEBT/AuNPs/GCE in 0.1 M PBS was investigated in the pH range of 4–8 using differential pulse voltammetry. From Fig. 7(a), it is noted that there is an increment in anodic peak current for AA, DA and UA with the increase of solution pH until it reaches pH 6.0 and then decreases at higher pH. The decrease in peak current is attributable to the electrostatic repulsion among UA, AA, and nanocomposite since AA (pKa = 4.1) and UA (pKa = 5.7) would be deprotonated in the solution at pH above 6. However, the peaks of oxidation current of DA (pKa = 8.8) and UA are seen to almost steady through an increase in the pH of 7 and 8. It is recognised that AA and UA exist as anionic forms at low pH while DA exists in cationic form at pH > 6. The anionic form of AA and UA are attracted to the positively charged ERGO-pEBT/AuNPs, while DA has a good affinity with the heteroatoms (N and S) in the pEBT film (Kalimuthu and John, 2010). Therefore, given the application conditions, pH 6 is fixed as the pH of the supporting electrolyte in the simultaneous detection of AA, DA, and UA. In addition, from Fig. 7(b), all the anodic peak potentials of the oxidation of UA, AA, and DA are shifted in the negative direction with the increment in pH, demonstrating that protons are involved in the electrode reaction processes. The equation of linear regression for anodic peak potentials could be described by the following equations:
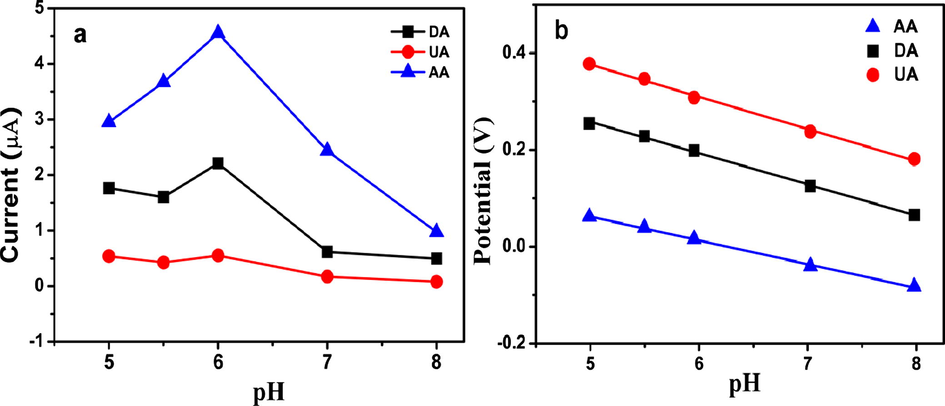
- (a) Effect of pH on the peak currents and the (b) peak potentials derived from DPV for 100 µM AA, 100 µM UA and 100 µM DA at the ERGO-pEBT/AuNPs/GCE.
The slopes of −50 mV and −54 mV per pH unit for DA and UA indicate that two protons and two electrons are involved in the oxidation process, which is close to the Nernst equation value of −59 mV (Ghoreishi et al., 2012). However, the slope of −32 mV for AA is less than this value, indicating that the electrochemical oxidation of AA on the modified electrode occurs with the involvement of less than one proton (Sheng et al., 2012).
3.7 Simultaneous detection of AA, DA, and UA
It is well known the attractive properties of differential pulse voltammetry which allow it to be used in the electrochemical detection extensively. Hereby, differential pulse voltammetry was utilised for both individual and simultaneous investigation of AA, DA, and UA detection. As shown in Fig. 8(a–c) the individual detection of AA was performed in the concentration range of 5–750 µM, while DA is in the linear range of 0.5–140 µM, and UA was determined in the range of 1–600 µM. The insets demonstrate the calibration curves of AA, DA, and UA with an obtained detection limit of 0.390, 0.009 and 0.046 µM for AA, DA and UA, respectively.
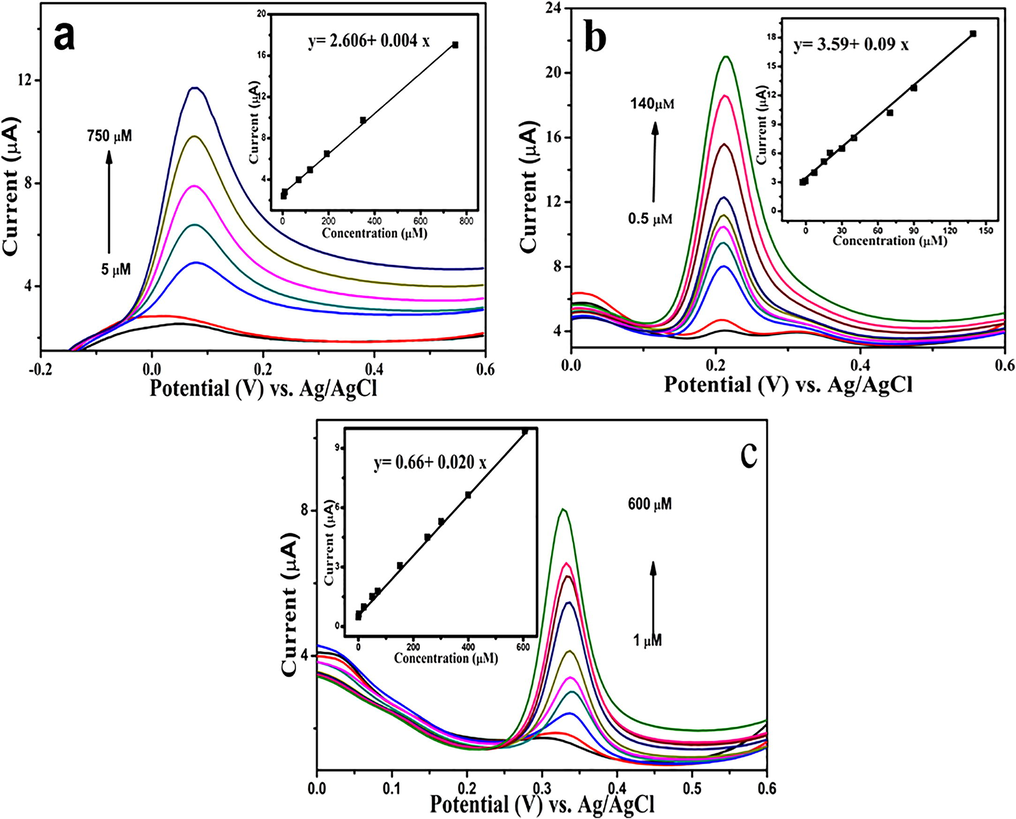
- DPVs of GCE/ERGO-pEBT/AuNPs in 0.1 M PBS (pH 6.0) (a) 5–750 µM AA, (b) 0.5–140 µM DA, and (c) 1–600 µM UA. Inset: Calibration curves of Ip vs. concentration.
To further demonstrate the viability of the ERGO-pEBT/AuNPs modified GCE, the simultaneous determination of AA, DA, and UA, the electrooxidation of each species in the mixture was examined by altering the concentration of a species, while the two concentrations remained constant. Fig. 9(a) shows the DPV of ERGO-pEBT/AuNPs modified GCE at various concentrations of AA at a constant concentration of DA and UA. The peak current of AA increased linearly when the concentration of AA is changed from 5 to 1000 μM with the following equation Ip, AA (µA) = 0.139 + 0.005 AA (μM) (R2 = 0.997). Fig. 9(b) shows the DPV of ERGO-pEBT/AuNPs modified GCE at different DA concentrations with a constant concentration of 90 μM AA and 90 μM UA. The linear relationship between peak current and concentration of DA is achieved in the range of 0.6–150 μM, with two linear functions Ip, DA (µA) = 0.595 + 0.178 DA (µM) (R2 = 0.993) and Ip, DA (µA) = 7.11 + 0.040 DA (µM) (R2 = 0.993). The two slopes observed could be due to the accumulation of DA oxidation product on the surface of the electrode, which slows down the electron transfer (Gupta and Ganesan, 2015). Fig. 9(c) shows the UA curves at different concentrations in the presence of 50 μM AA, 10 μM DA. The linear response range is 2–300 μM with linear function, Ip, UA (µA) = 0.117 + 0.023 UA (μM) (R2 = 0.963). To verify the effect of each analyte in the presence of the other two species, the concentrations of AA, DA, and UA were increased simultaneously. As depicted in Fig. 9(d), separated oxidation peaks and a linear relationship between peak current and the concentration are observed. The linear ranges are found to be Ip, AA (µA) = 1.127 + 0.003 AA (μM) (R2 = 0.997), Ip, DA (µA) = 1.247 + 0.164 DA (μM) (R2 = 0.990), and Ip, UA (µA) = 1.90 + 0.034 UA (μM) (R2 = 0.984). The detection limits are 0.530, 0.009, and 0.046 µM (S/N = 3) for AA, DA, and UA, respectively. These results indicate that ERGO-PEBT/AuNPs modified electrode is applicable for the simultaneous detection of AA, DA, and UA in the routine lab analysis.
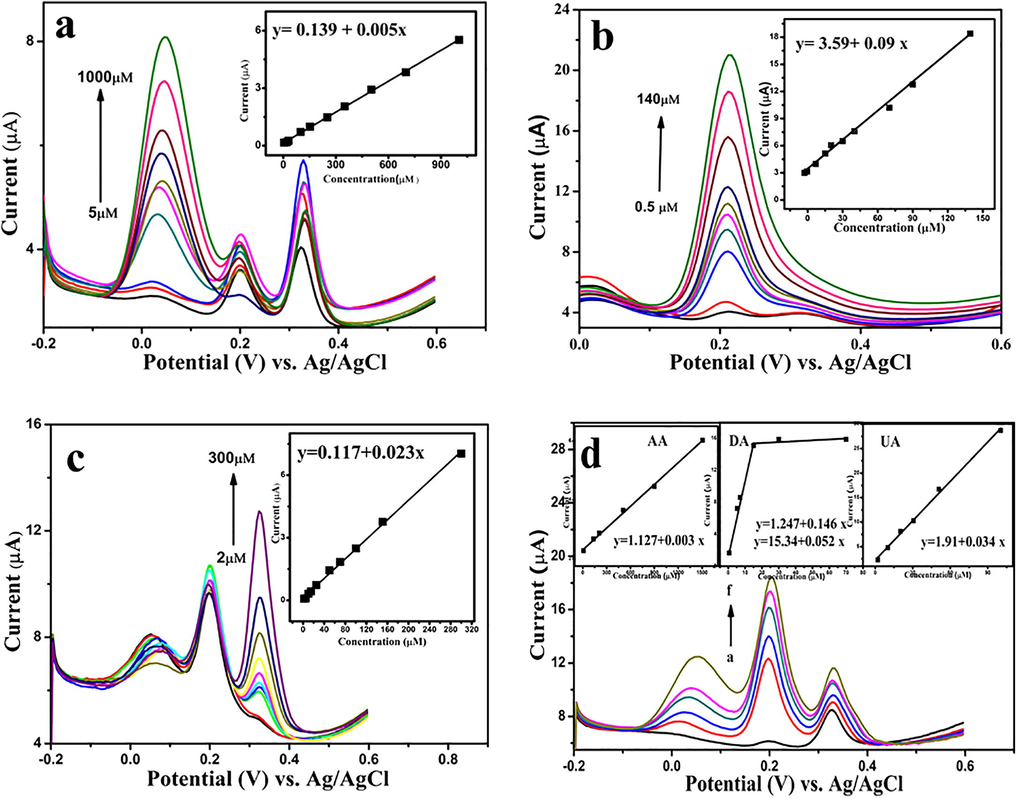
- DPVs of GCE/ERGO-pEBT/AuNPs in 0.1 M PBS (pH 6.0) containing: (a) 5 µM UA, 2 µM DA and different concentrations of AA (5, 20, 30, 50, 100, 120, 250, 350, 700, 1000 µM), (b) 90 µM AA, 90 µM UA and different concentrations of DA (0.6, 2, 5, 10, 20, 50, 70, 100, 120 and 150 µM), (c) 50 µM AA, 10 µM DA and different concentration of UA (2, 5, 10, 20, 50, 70, 100, 150, 300 µM), and (d) different concentrations (a-d) AA (10, 50, 200, 500, 900 µM) DA (0.5, 2, 7, 15, 20 µM) and UA (2, 10, 20, 50, 70 µM). Inset: plots of Ip vs. concentration. DPV conditions: pulse amplitude: 50 mV, pulse width: 50 ms, scan rate: 20 mV/s.
The results obtained for ERGO-pEBT/AuNPs/GCE are comparable with the reported literature (Table 1). It is found that DA, UA, and AA do not interfere with the oxidation of the signals, indicating ERGO-pEBT/AuNPs/GCE can be utilised for the simultaneous and quantitative determination of AA, DA and UA.
| Electrode | Linear range(µM) | Detection limit(µM) | Ref. | ||||
|---|---|---|---|---|---|---|---|
| AA | DA | UA | AA | DA | UA | ||
| PGCE | – | 0.2–9 × 10⁴ | – | – | 0.06 | – | Gu et al. (2004) |
| pEBT/GCE | 0.15–1000 | 0.1–200 | 10–130 | 10 | 0.02 | 1.0 | Yao et al. (2007a) |
| PdNPs/GR/CS | 100–400 | 0.5–200 | 0.5–200 | 20 | 0.10 | Wang et al. (2013) | |
| Graphene/Pt-GCE | 0.15–34.4 | 0.03–8.13 | 0.05–11.85 | 0.15 | 0.03 | 0.05 | Sun et al. (2011) |
| Au/Gr-AuAg | – | 0.3–300 | – | – | 0.21 | – | Pruneanu et al. (2015) |
| GE/Au/GE | – | 0.59–43.9 | 12.6–413 | – | 0.59 | 12.6 | Du et al. (2013) |
| ERGO/GCE | 500–2000 | 0.5–60 | 0.5–60 | 250 | 0.5 | 0.5 | Yang et al. (2014) |
| Nafion/AuNPs/AzA/MWCNTs | 300–10000 | 0.5–50 | 0.5–50 | 16 | 0.014 | 0.023 | Filik et al. (2016) |
| Chitosan-graphene/GCE | 50–1200 | 1.0–24 | 2.0–45 | 50 | 2.0 | 1.0 | Han et al. (2010) |
| ERGO-pEBT/AuNPs | 10–900 | 0.5–20 | 2–70 | 0.53 | 0.009 | 0.046 | This work |
3.8 Effect of foreign ions
In order to evaluate the selectivity of the simultaneous determination of DA, AA, and UA with ERGO-pEBT/AuNPs/GCE, the effect of possible coexisting elements that could interfere with the determination of analytes were studied. Tolerance is described as the highest possible concentration of foreign substances, with a relative error of less than 5%. Interference studies were carried out by exposing the modified ERGO-pEBT/AuNPs to a solution containing 100 μM AA, 10 μM DA and 10 μM UA, in the presence of the interfering species at pH 6.0. The results indicate that the interfering species i.e. Ca2+, Fe3+, l-cystine 100 times, Na+ and K+ 2000 times, glucose, glycine, and Cu2+ 1000 times would not affect the detection as presented in Table 2.
| Foreign substance | Tolerance level(µM) | % Tolerance | ||
|---|---|---|---|---|
| AA | DA | UA | ||
| Na+ | 2000 | +0.98 | +3.83 | +2.19 |
| K+ | 2000 | +1.22 | −0.67 | +3.21 |
| Glucose | 1000 | +0.23 | −0.70 | +2.58 |
| Glycine | 1000 | +0.25 | +1.77 | −3.45 |
| Cu2+ | 1000 | +4.25 | +4.90 | −2.20 |
| Ca2+ | 100 | +0.64 | +0.67 | +3.06 |
| Fe3+ | 100 | +4.65 | +1.01 | −0.39 |
| L-cystine | 100 | +3.72 | +5.20 | +3.20 |
3.9 Sample analysis
To assess the validity and reliability of the proposed sensor in practice, the analytical determinations of UA, DA, and AA in the human urine sample and vitamin C were carried out employing the standard addition method. The human urine samples were diluted 50 times using 0.1 M PBS (pH 6.0) and DPV was recorded. In order to establish the accuracy of the results, specific amounts of AA, DA, and UA were added to the diluted sample followed by detecting the analytes. Ten tablets of vitamin C (250 mg/tablet) were weighted and crushed. 100 µl of this solution was diluted to 5 ml with PBS (pH 6.0), then transferred into an electrochemical cell for detection. The standard addition method was applied, whereby a known amount of AA, DA, and UA in PBS (pH 6.0) was added to the test solution. The results of the analysis are summarized in Table 3. The recoveries between 100.17% and 111.2% for vitamin C and urine are obtained, suggesting the successful implementation of ERGO-pEBT/AuNPs to determine UA, AA, and DA in real samples.
| Sample | Detected (µM) | Added (µM) | Found (µM) | Recovery (%) | |
|---|---|---|---|---|---|
| Vit. C | AA | 11.36 | 200.0 | 210.70 | 100.2 |
| DA | – | 10.00 | 9.44 | 94.4 | |
| UA | – | 10.00 | 10.53 | 105.3 | |
| Vit. C | AA | 11.36 | 800.0 | 808.50 | 99.6 |
| DA | – | 20.00 | 20.96 | 104.8 | |
| UA | – | 20.00 | 20.64 | 103.2 | |
| Urine | AA | – | 1000 | 1022 | 102.2 |
| DA | – | 5.00 | 5.56 | 111.2 | |
| UA | 1.2 | 10.00 | 11.23 | 100.2 | |
3.10 Stability and reproducibility
The ERGO-pEBT/AuNPs electrode was stored in 0.1 M PBS (pH 6.0) at room temperature and its stability was tested for one month. The intensities of peak currents are maintained at 86.05%, 96.80%, and 72.09% of its original signal for the determination of AA, DA, and UA, respectively. Five different electrodes of ERGO-pEBT/AuNPs were prepared under the same conditions to examine the reproducibility of the modified electrode. The relative standard deviations (RSDs) of these electrodes are 2.8%, 3.5% and 4.8% for DA, UA, and AA, respectively. These results indicate that the ERGO-pEBT/AuNPs/GCE is stable and has high reproducibility that is suitable for practical applications.
4 Conclusion
In this work, simultaneous detection of coexisting, AA, UA and DA in 0.1 M PBS (pH 6.0) using ERGO-pEBT/AuNPs/GCE was successfully achieved. The ERGO-pEBT/AuNPs/GCE manifested excellent electrocatalytic activity towards AA, DA and UA oxidation. The results showed significantly higher current as a result of larger electroactive surface and rapid heterogeneous electron transfer. The ERGO-pEBT/AuNPs/GCE was able to separate the voltammetric signals of AA, DA and UA with peak potential separation of 183 and 150 mV between AA–DA and DA–UA, respectively. The ERGO-pEBT/AuNPs/GCE also revealed high stability and satisfactory results in the recovery of urine and vitamin C samples.
Acknowledgement
This work was financially supported by the Universiti Putra Malaysia Research Grant (GP-IPS/2016/9512900). Thanks to Organization for Women in Science for the Developing World (OWSD) and Swedish International Development Cooperation Agency (SIDA) for the scholarship awarded to Nusiba Mohammed Modawe Alshik Edris.
References
- Simultaneous determination of ascorbic acid, dopamine, uric acid and folic acid based on activated graphene/MWCNT nanocomposite loaded Au nanoclusters. Sens. Actuators, B. 2015;221:659-665.
- [Google Scholar]
- Poly(3,4-ethylenedioxythiophene-co-(5-amino-2-naphthalenesulfonic acid)) (PEDOT-PANS) film modified glassy carbon electrode for selective detection of dopamine in the presence of ascorbic acid and uric acid. Anal. Chim. Acta. 2007;596:92-98.
- [Google Scholar]
- Exciton-plasmon interaction between AuNPs/graphene nanohybrids and CdS quantum Dots/TiO2 for photoelectrochemical aptasensing of prostate-specific antigen. ACS Sensors. 2018;3:632-639.
- [Google Scholar]
- Electrochemical studies of eriochrome black T at carbon paste electrode and immobilized by SDS surfactant: a cyclic voltammetric study. Int. J. Electrochem. Sci.. 2008;3:1044-1054.
- [Google Scholar]
- Improved voltammetric peak separation and sensitivity of uric acid and ascorbic acid at nanoplatelets of graphitic oxide. Electrochem. Commun.. 2010;12:596-599.
- [Google Scholar]
- Simultaneous electrochemical determination of dopamine and paracetamol on multiwalled carbon nanotubes/graphene oxide nanocomposite-modified glassy carbon electrode. Talanta. 2013;117:297-304.
- [Google Scholar]
- Direct application of gold nanoparticles to one-pot electrochemical biosensors. Anal. Chim. Acta. 2014;849:1-6.
- [Google Scholar]
- Direct electrodeposition of reduced graphene oxide on glassy carbon electrode and its electrochemical application. Electrochem. Commun.. 2011;13:133-137.
- [Google Scholar]
- Dave, P.N., Kaur, S., Khosla, E., 2011, Removal of eriochrome black-T by adsorption on to eucalyptus bark using green technology.
- Electrodeposition of gold nanoparticles on a pectin scaffold and its electrocatalytic application in the selective determination of dopamine. RSC Adv.. 2014;4:55900-55907.
- [Google Scholar]
- Simultaneous determination of uric acid and dopamine using a carbon fiber electrode modified by layer-by-layer assembly of graphene and gold nanoparticles. Gold Bull.. 2013;46:137-144.
- [Google Scholar]
- Simultaneous detection of ascorbic acid, dopamine, uric acid and tryptophan with Azure A-interlinked multi-walled carbon nanotube/gold nanoparticles composite modified electrode. Arabian J. Chem.. 2016;9:471-480.
- [Google Scholar]
- In situ electrogenerated poly (eriochrome black T) film and its application in nitric oxide sensor. React. Funct. Polym.. 2008;68:1253-1259.
- [Google Scholar]
- ZnO–Cu x O/polypyrrole nanocomposite modified electrode for simultaneous determination of ascorbic acid, dopamine, and uric acid. Anal. Biochem.. 2015;473:53-62.
- [Google Scholar]
- ZnO–CuxO/polypyrrole nanocomposite modified electrode for simultaneous determination of ascorbic acid, dopamine, and uric acid. Anal. Biochem.. 2015;473:53-62.
- [Google Scholar]
- Electrochemical determination of tryptophan, uric acid and ascorbic acid at a gold nanoparticles modified carbon paste electrode. Anal. Methods. 2012;4:2447-2453.
- [Google Scholar]
- Electrocatalytic oxidation of dopamine and ascorbic acid at poly (eriochrome Black-T) modified carbon paste electrode. Int. J. Electrochem. Sci.. 2009;4:582-591.
- [Google Scholar]
- A novel method for separating the anodic voltammetric peaks of dopamine and ascorbic acid. Microchimica Acta. 2004;146:223-227.
- [Google Scholar]
- Gold nanoparticles impregnated mesoporous silica spheres for simultaneous and selective determination of uric acid and ascorbic acid. Sens. Actuators, B. 2015;219:139-145.
- [Google Scholar]
- Simultaneous determination of ascorbic acid, dopamine and uric acid with chitosan-graphene modified electrode. Electroanalysis. 2010;22:2001-2008.
- [Google Scholar]
- Label-free photoelectrochemical aptasensor for tetracycline detection based on cerium doped CdS sensitized BiYWO6. Biosens. Bioelectron.. 2018;106:7-13.
- [Google Scholar]
- Experimental study on synthesis and microstructure of poly (p-phenylenediamine)/graphene oxide/Au and its performance in supercapacitor. J. Alloy. Compd.. 2012;543:200-205.
- [Google Scholar]
- Sensitive electrochemical sensor for simultaneous determination of uric acid and xanthine in human biological fluids based on the nano-boron doped ceria modified glassy carbon paste electrode. J. Electroanal. Chem.. 2016;780:176-186.
- [Google Scholar]
- Simultaneous determination of ascorbic acid, dopamine, uric acid and xanthine using a nanostructured polymer film modified electrode. Talanta. 2010;80:1686-1691.
- [Google Scholar]
- Electrochemical determination of uric acid in the presence of ascorbic acid on electrochemically reduced graphene oxide modified electrode. J. Electroanal. Chem.. 2013;700:54-59.
- [Google Scholar]
- Controllable synthesis of nitrogen-doped graphene and its effect on the simultaneous electrochemical determination of ascorbic acid, dopamine, and uric acid. Carbon. 2013;59:418-429.
- [Google Scholar]
- Study of the interaction between graphene oxide and surface-confined biomolecules to develop new kind of biosensors. Curr. Nanosci.. 2014;10:801-806.
- [Google Scholar]
- Simultaneous determination of ascorbic acid, dopamine and uric acid based on tryptophan functionalized graphene. Anal. Chim. Acta. 2014;823:32-39.
- [Google Scholar]
- Electrochemical biosensor based on nanogold-modified poly-eriochrome black T film for BCR/ABL fusion gene assay by using hairpin LNA probe. Talanta. 2010;80:2113-2119.
- [Google Scholar]
- Magnetic graphene nanosheet-based microfluidic device for homogeneous real-time electronic monitoring of pyrophosphatase activity using enzymatic hydrolysate-induced release of copper ion. Anal. Chem.. 2015;88:1030-1038.
- [Google Scholar]
- Simultaneous determination of L-cysteine and L-tyrosine using Au-nanoparticles/poly-eriochrome black T film modified glassy carbon electrode. Bioelectrochemistry. 2012;86:38-45.
- [Google Scholar]
- An electrochemical synthesis strategy for composite based ZnO microspheres–Au nanoparticles on reduced graphene oxide for the sensitive detection of hydrazine in water samples. RSC Adv.. 2015;5:54379-54386.
- [Google Scholar]
- Simultaneous determination of ascorbic acid, dopamine and uric acid using high-performance screen-printed graphene electrode. Biosens. Bioelectron.. 2012;34:70-76.
- [Google Scholar]
- Electrochemical detection of dopamine and cytochrome c at a nanostructured gold electrode. Electrochim. Acta. 2010;55:8953-8959.
- [Google Scholar]
- A green approach to the synthesis of eriochrome black-T capped silver nanoparticles and its electrochemical detection of L-tryptophan and L-tyrosine in blood sample and antibacterial activity. J. Adv. Electrochem. 2016:78-84.
- [Google Scholar]
- The influence of uric and ascorbic acid on the electrochemical detection of dopamine using graphene-modified electrodes. Electrochim. Acta. 2015;154:197-204.
- [Google Scholar]
- Sulfur-doped graphene-based immunological biosensing platform for multianalysis of cancer biomarkers. ACS Appl. Mater. Interfaces. 2017;9:37637-37644.
- [Google Scholar]
- Highly sensitive determination of uric acid in the presence of major interferents using a conducting polymer film modified electrode. Bioelectrochemistry. 2012;88:22-29.
- [Google Scholar]
- Facile and controllable electrochemical reduction of graphene oxide and its applications. J. Mater. Chem.. 2010;20:743-748.
- [Google Scholar]
- Electrochemical sensor based on nitrogen doped graphene: Simultaneous determination of ascorbic acid, dopamine and uric acid. Biosens. Bioelectron.. 2012;34:125-131.
- [Google Scholar]
- The simultaneous electrochemical detection of ascorbic acid, dopamine, and uric acid using graphene/size-selected Pt nanocomposites. Biosens. Bioelectron.. 2011;26:3450-3455.
- [Google Scholar]
- Novel electro-polymerized protein-imprinted materials using eriochrome black T: application to BSA sensing. Electrochim. Acta. 2018;262:214-225.
- [Google Scholar]
- Development of a PrGO-modified electrode for uric acid determination in the presence of ascorbic acid by an electrochemical technique. Sensors. 2017;17:1539.
- [Google Scholar]
- Electrochemical detection of uric acid, dopamine and ascorbic acid. J. Electrochem. Soc.. 2018;165:B258-B267.
- [Google Scholar]
- Enhanced direct electrochemistry of glucose oxidase and biosensing for glucose via synergy effect of graphene and CdS nanocrystals. Biosens. Bioelectron.. 2011;26:2252-2257.
- [Google Scholar]
- Simultaneous electrochemical determination of ascorbic acid, dopamine and uric acid using a palladium nanoparticle/graphene/chitosan modified electrode. J. Electroanal. Chem.. 2013;695:10-16.
- [Google Scholar]
- A glassy carbon electrode modified with poly (eriochrome black T) for sensitive determination of adenine and guanine. Microchimica Acta. 2013;180:887-893.
- [Google Scholar]
- Electrochemiluminescence immunosensor based on quenching effect of SiO2@ PDA on SnO2/rGO/Au NPs-luminol for insulin detection. Sens. Actuators, B. 2018;265:403-411.
- [Google Scholar]
- Simultaneous determination of dopamine, ascorbic acid and uric acid at electrochemically reduced graphene oxide modified electrode. Sens. Actuators, B. 2014;193:166-172.
- [Google Scholar]
- Macroporous graphene capped Fe3O4 for amplified electrochemiluminescence immunosensing of carcinoembryonic antigen detection based on CeO2@ TiO2. Biosens. Bioelectron.. 2017;91:842-848.
- [Google Scholar]
- Electrochemical characterization of poly(eriochrome black T) modified glassy carbon electrode and its application to simultaneous determination of dopamine, ascorbic acid and uric acid. Electrochim. Acta. 2007;52:6165-6171.
- [Google Scholar]
- Selective determination of epinephrine in the presence of ascorbic acid and uric acid by electrocatalytic oxidation at poly (eriochrome black T) film-modified glassy carbon electrode. Anal. Sci.. 2007;23:677-682.
- [Google Scholar]
- Selective and sensitive determination of uric acid in the presence of ascorbic acid and dopamine by PDDA functionalized graphene/graphite composite electrode. Talanta. 2013;112:31-36.
- [Google Scholar]
- Fabrication of poly (toluidine blue O)/carbon nanotube composite nanowires and its stable low-potential detection of NADH. J. Electroanal. Chem.. 2006;595:152-160.
- [Google Scholar]
- An easily fabricated electrochemical sensor based on a graphene-modified glassy carbon electrode for determination of octopamine and tyramine. Sensors. 2016;16:535.
- [Google Scholar]
- Graphene quantum dots-based platform for the fabrication of electrochemical biosensors. Electrochem. Commun.. 2011;13:31-33.
- [Google Scholar]


