

Translate this page into:
Electrochemiluminescence biosensor for carcinoembryonic antigen detection based on Au-Ag/g-C3N4 nanocomposites
⁎Corresponding author at: Henan Key Laboratory of Biomolecular Recognition and Sensing, College of Chemistry and Chemical Engineering, Shangqiu Normal University, Shangqiu, Henan 476000, PR China. xumaotian@sqnu.edu.cn (Maotian Xu)
-
Received: ,
Accepted: ,
This article was originally published by Elsevier and was migrated to Scientific Scholar after the change of Publisher.
Peer review under responsibility of King Saud University.
Abstract
Herein, an electrochemiluminescence (ECL) aptasensor for carcinoembryonic antigen (CEA) detection was developed based on Au-Ag/g-C3N4 nanocomposites (NCs), which were synthesized by decorating graphitic carbon nitride (g-C3N4) nanosheets with alloy-structured Au-Ag bimetallic nanoparticles (NPs) via one-step in situ chemical reduction. As ECL sensing platform, Au-Ag/g-C3N4 NCs could significantly improve the ECL intensity of luminol due to the good conductivity of Au-Ag NPs, electrocatalytic activity for oxygen evolution reaction (OER) and the ability to adsorb luminol via π stacking interaction. In addition, it could load the thiol terminated aptamers of CEA via Au-S or Ag-S bonds. In the presence of CEA, the ECL response of the proposed biosensor decreased significantly due to the fact that the assembled protein layers hindered the electron transfer and the diffusion of ECL reactants toward the electrode surface. The proposed ECL sensor exhibited a good linear relationship with CEA in the range of 1.0–1.0 × 10⁻⁶ ng/mL with a detection limit of 8.9 × 10⁻⁷ ng/mL. The satisfactory results were obtained in the detection of CEA in human serum samples.
Keywords
Au-Ag/g-C3N4
Electrochemiluminescence
Carcinoembryonic antigen
Aptasensor

1 Introduction
As is known, the early diagnosis is critical for cancer treatment and control. Carcinoembryonic antigen (CEA) is one of the important markers of various tumors (Jie et al., 2011). Therefore, development of a sensitive, rapid and reliable analytical method for CEA detection is important for early diagnosis and therapy of cancers. Numerous detection techniques have been well developed for CEA detection such as electrochemical (Su et al., 2017; Wei et al., 2018; Luo et al., 2018; Mazloum-Ardakani et al., 2019), photoelectrochemical (Song et al., 2017), fluorescent (Lin et al., 2017), electrochemiluminescent (Wang et al., 2015; Liu et al., 2018), surface-enhanced raman scattering (Wang et al., 2017) and colorimetric (Xiao et al., 2017) methods. Specifically, label-free electrochemiluminescence (ECL) biosensors (Zhang et al., 2013a,b; Chen et al., 2014; Liu et al., 2014; Zhang et al., 2017) have been rapidly developed to determine CEA due to its fast response, simple fabrication and high sensitivity.
Label-free sensors require electrode materials with good conductivity and large specific surface area to accelerate electron transfer and immobilize more analytes. Graphitic carbon nitride (g-C3N4), possesses high nitrogen content with excellent stability (Groenewolt and Antonietti, 2005), low cost, easily tailorable structure and bulk preparation. Recently, g-C3N4 has been used as an electrocatalyst for oxygen evolution reaction (OER) (Tian et al., 2014; Desalegn et al., 2019). However, the electrocatalytic activity of g-C3N4 itself is insufficient due to its low specific surface area and poor electronic conductivity. The pyridinic-N atoms in the g-C3N4 matrix provide rich electron lone pairs, which can capture metal ions in the ligands (Zou et al., 2014). It has been reported that the metal-g-C3N4 complex could act as a high activity electrocatalyst for OER due to the precise M-N2 coordination (Zheng et al., 2017) and dissolved O2 in electrolyte is a key co-reactant for luminol ECL system (Cui et al., 2003; Wei et al., 2013; Wang et al., 2014; Xia et al., 2022). In addition, it was found that the Au-Ag alloy displayed an effective improvement for luminol ECL in our previous work (Wei et al., 2013; Wang et al., 2014). Therefore, g-C3N4 nanosheets loaded with bimetallic Au-Ag is expected to be very effective in enhancing luminol ECL intensity.
In this work, considering that the advantages of ECL sensor such as fast response and high sensitivity, an ECL aptasensor for CEA detection based on Au-Ag/g-C3N4 nanocomposites (NCs) has been constructed. For the ECL sensing platform, the Au-Ag/g-C3N4 NCs were more favorable for loading the aptamer of CEA via Au-S or Ag-S bond due to the large specific surface area. Meanwhile, the Au-Ag/g-C3N4 NCs could significantly improve luminol ECL intensity due to the good conductivity of Au-Ag NPs, electrocatalytic performance for OER and the ability to adsorb luminol via π stacking interaction. After CEA interacted specifically with the aptamer, ECL intensity was significantly decreased. Based on this, the proposed lable-free ECL aptasensor was developed and used to detect CEA in human serum samples with satisfactory results.
2 Experimental section
2.1 Synthesis of Au-Ag/g-C3N4 NCs
g-C3N4 nanosheets were first synthesized by urea pyrolysis according to the process described in the literature (Xu et al., 2013). The detailed synthesis procedure was presented in the Electronic Supplementary Material. Au-Ag/g-C3N4 NCs were prepared according to the method in the literature (Feng et al., 2015) with some modifications. Simply, under stirring, 0.040 mL of 0.1 M AgNO3 and 0.060 mL of 0.1 M HAuCl4 were added to 50 mL of 0.1 mg/mL g-C3N4 suspension, followed by stirring for 30 min at room temperature. Then, a mixed solution of 0.040 mL 0.08 mM NaBH4 and 0.250 mL 0.5 mM sodium citrate was added rapidly into the boiling suspension and stirred for 15 min. After centrifuging and washing with ultrapure water three times, the Au-Ag/g-C3N4 NCs were obtained and dispersed in 50 mL ultrapure water.
2.2 Fabrication of ECL aptasensor
All glassy carbon electrodes (GCE) were polished with 0.3 and 0.05 μm alumina slurries and followed by ultrasonic cleaning with HNO3 (1:1), ethanol and deionized water in succession. Sequentially, the cleaned electrode was dried with nitrogen. The fabrication process of the ECL sensor was demonstrated in Scheme 1. Firstly, 2 µL Au-Ag/g-C3N4 NCs was spread on the cleaned and air-dried. Secondly, the modified electrode was incubated in 1.5 µM aptamer at 4 °C overnight, then immersed into 0.1 mM β-mercaptoethanol (β-ME) for 30 min. After careful rinsing and drying, the electrode was incubated in CEA solution for 90 min at 37 °C. Finally, the modified electrode was washed carefully and stored at 4 °C for later use.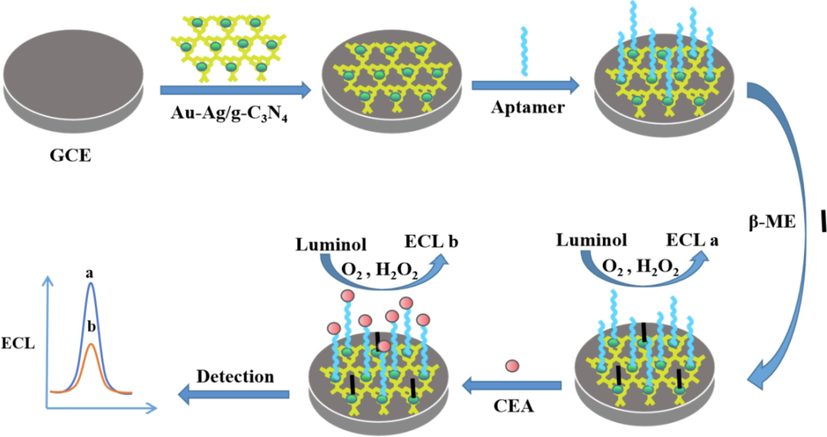
Fabrication process of the ECL aptasensor.
The materials, reagents and apparatus required for the experiments and the ECL measurement procedure were presented in the Electronic Supplementary Material. All ECL measurements were performed in 0.1 M PBS (pH = 7.4) containing 5 × 10⁻⁵ M luminol and 5 × 10⁻⁶ M H2O2.
3 Results and discussion
3.1 Characterization of the Au-Ag/g-C3N4 NCs
SEM image of the as-prepared g-C3N4 nanosheets was shown in Fig. 1A. It's clear that g-C3N4 nanosheets were almost transparent thin layer and had many folds, which could facilitate the loading of Au-Ag NPs. TEM image of the Au-Ag/g-C3N4 NCs was shown in Fig. 1B. The spherical Au-Ag NPs of about 4 nm were dispersed uniformly on the surfaces of g-C3N4 nanosheets without any agglomeration, which could be ascribed to a large number of anchoring sites provided by —NH2 and —NH— groups on g-C3N4 nanosheets surfaces (Wang et al., 2016).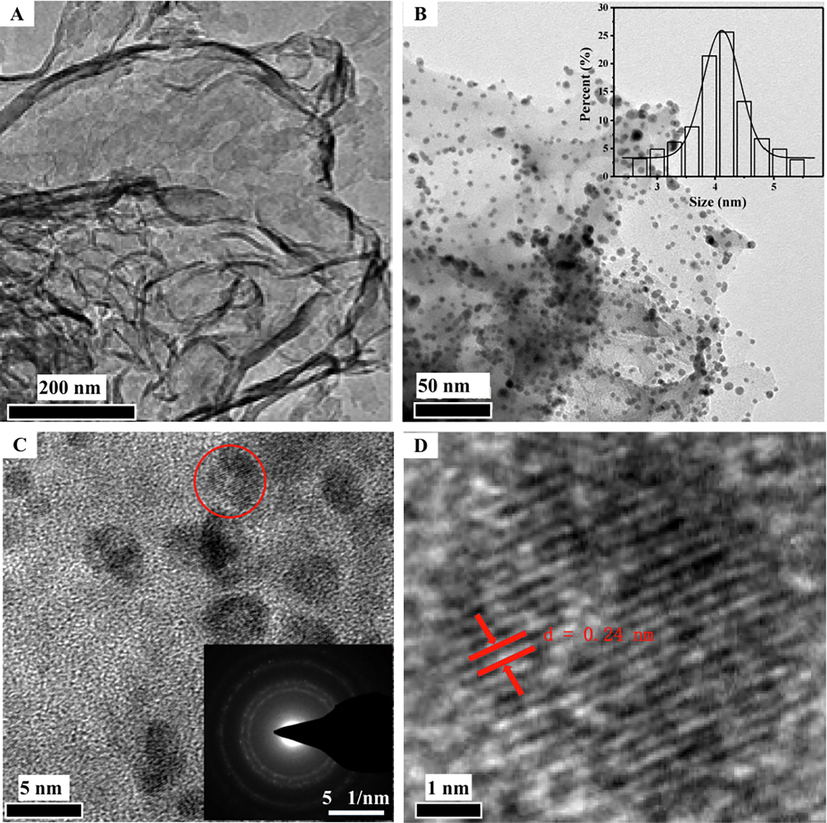
(A) SEM image of g-C3N4 nanosheets. (B) TEM image. Inset: corresponding particle size distribution of the Au-Ag NPs, (C) HRTEM image (inset SAED image) and (D) HRTEM image enlarged from the red circle region in Fig. 1C of the obtained Au-Ag/g-C3N4 NCs.
The high-resolution TEM (HRTEM) image was shown in Fig. 1C, which exhibited a polycrystalline microstructure of the metal NPs (Zhang et al., 2013a,b). As displayed in Fig. 1D (enlarged from the red circle region of Fig. 1C), a high-resolution lattice fringe of 0.24 nm was observed, which ascribed to the (1 1 1) lattice planes of crystalline Au or Ag. The polycrystalline nature was also identified by selected-area electron diffraction (SAED) analysis. As displayed in the inset in Fig. 1C, the four diffraction rings were indexed to the (3 1 1), (2 2 0), (2 0 0) and (1 1 1) Bragg reflections from the face-centered cubic structure of Au or Ag, suggesting the polycrystalline nature of metal NPs (Sun et al., 2018).
Compared with g-C3N4 nanosheets, the obtained Au-Ag/g-C3N4 NCs had a larger specific surface area (Fig. 2A), which was beneficial to the loading of biological molecules. The elemental distribution of Au-Ag/g-C3N4 NCs was investigated by energy dispersive X-ray spectroscopy (EDS). As presented in Fig. 2B–E, C, N, Au and Ag were uniformly distributed throughout the whole materials. The EDS spectrum in Fig. 2F further confirmed that the resulting nanocomposites based on the g-C3N4 nanosheets incorporating with two metals had been successfully assembled. Moreover, the resulting nanocomposites was characterized by XRD. As shown in Fig. 2G, a weak characteristic diffraction peak of g-C3N4 was observed at 27.45°, which is assigned to the (0 0 2) crystal plane and associated with the interlayer stacking of aromatic segments (Chen et al., 2014).
In order to investigate the components of the obtained nanocomposites, XPS measurement was performed. The existence of C, N, Au and Ag elements was further verified by the survey XPS spectrum shown in Fig. 3A, while O element was also detected, indicating the formation of oxygen-containing functional groups. As shown in Fig. 3B, the binding energies of Au 4f7/2 (83.0 eV) and Au 4f5/2 (86.7 eV) were lower than that of bulk Au(0) nanocrystals (83.7 eV for Au 4f7/2 and 87.7 eV for Au 4f5/2) (Luo et al., 2012), suggesting that the Au atoms were negatively charged. As shown in Fig. 3C, the binding energies of Ag 3d5/2 (367.8 eV) and Ag 3d3/2 (373.8 eV) were between that of Ag(1) complexes (366.8 eV and 372.8 eV) and neutral bulk Ag(0) (368.2 eV and 374.2 eV) (Mao et al., 2016), indicating that the Ag atoms were positively charged. In addition, the diffraction peaks for Ag2O (JCPDS 41–1104) were not presented in the XRD pattern (Fig. 2G), suggesting that there was no Ag2O in the Au-Ag/g-C3N4 NCs. The above results indicated that charge transfer occurred from Ag (electronegativity = 1.93) to Au (electronegativity = 2.54). Thus, the positively charged Ag atoms and the negatively charged Au atoms were chemically bonded to form Au-Ag NPs (Negishi et al., 2010).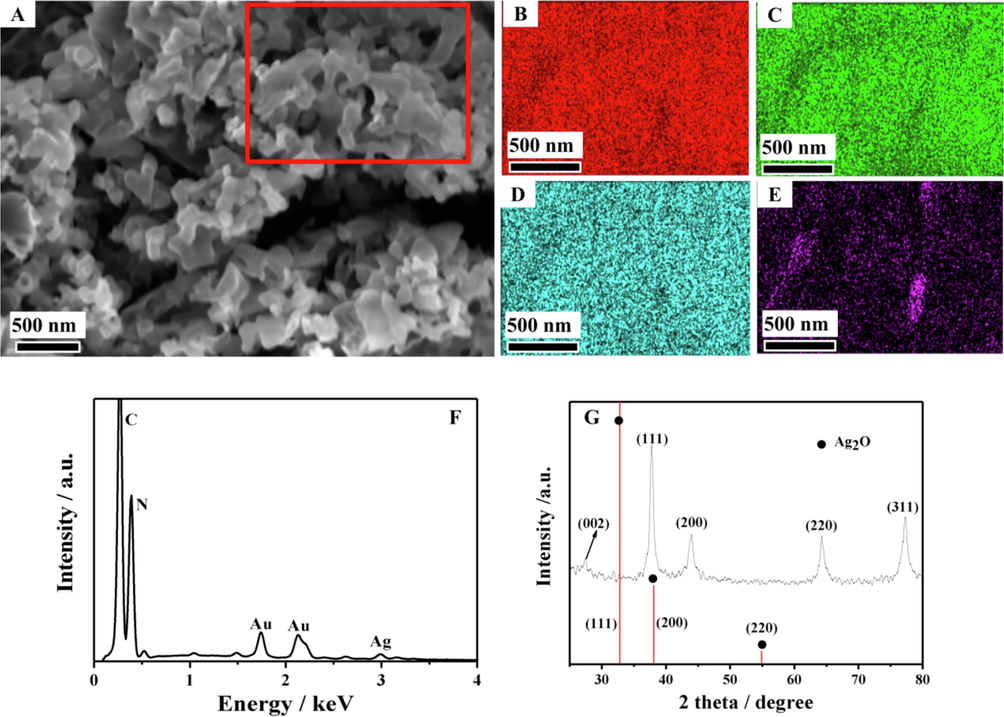
SEM image (A), element mapping images (from the red rectangle region in Fig. 2A) of C, N, Ag, Au (B–E), EDS spectrum (F) and XRD pattern (G) of the obtained Au-Ag/g-C3N4 NCs.
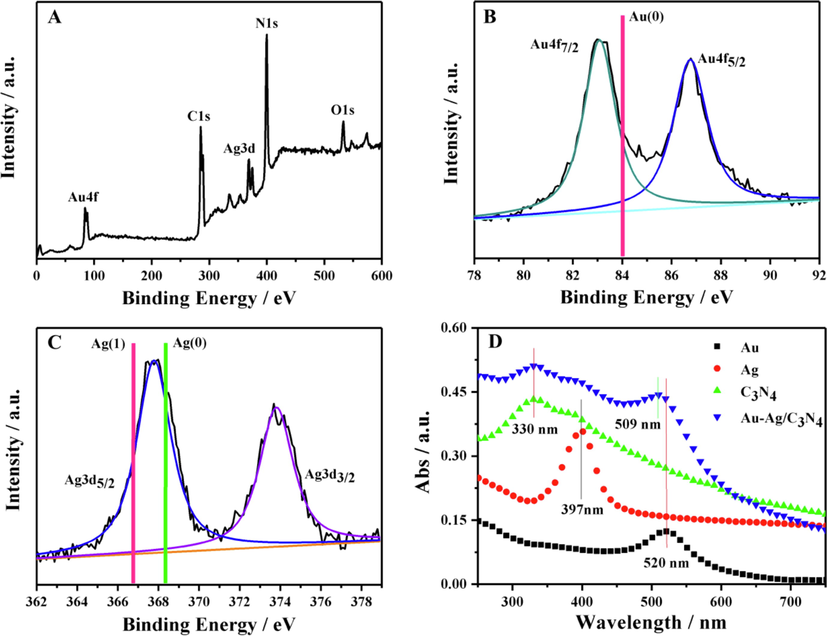
XPS spectra of the obtained Au-Ag/g-C3N4 NCs: (A) survey spectra, (B) Au 4f spectra and (C) Ag 3d spectra. The red line in (B) represents Au 4f7/2 in the Au (0) film, the red line and the green line in (C) represent Ag 3d5/2 in the Ag (1) complexes and Ag (0) film respectively. (D) UV–vis absorption spectra of the as-prepared Au, Ag, g-C3N4, and Au-Ag/g-C3N4 NCs.
As shown in Fig. 3D, the UV–Vis spectra also revealed the bimetallic alloy-structure information. Apart from the characteristic absorption band of g-C3N4 at 330 nm, the UV–vis spectra of Au-Ag/g-C3N4 NCs did not show two independent absorption bands (397 nm for Ag NPs and 520 nm for Au NPs) but a single band of 509 nm attributed to the blue shift of the characteristic peak of Au NPs, further confirming the formation of Au-Ag nanoalloys (Sobczak and Dembowiak, 2015; Sun et al., 2018).
3.2 Construction and characterization of the ECL aptasensor
To investigate the effects of Au-Ag/g-C3N4 NCs on the ECL intensity of luminol, the ECL responses on GCE modified respectively with Au-Ag/g-C3N4 NCs, Au/g-C3N4, Ag/g-C3N4, Au-Ag NPs and g-C3N4 nanosheets were shown in Fig. 4A. The classic mechanism ECL mechanism for luminol-O2 (or H2O2) system at the anode was that luminol anion (LH−) was electrochemically oxidized into luminol anion radical (L•−) at positive potential (Fig. 4B), followed by further oxidation by dissolved O2 or H2O2 into an excited state luminophore (AP2−*) (Xia et al., 2022). Obviously, the dissolved O2 is a key co-reactant for luminol ECL system (Cui et al., 2003; Wei et al., 2013; Wang et al., 2014; Xia et al., 2022). The GCE modified with g-C3N4 nanosheets exhibited stronger ECL intensity than the bare GCE, which could be attributed to the electrocatalytic activity for OER (4OH− − 4e− = 2H2O + O2) (Tian et al., 2014; Desalegn et al., 2019). The previous literature reported that Au, Ag or Au-Ag alloy could significantly improve ECL intensity of luminol due to its excellent electronic conductivity and catalytic performance for luminol ECL reaction (Wei et al., 2013; Wang et al., 2014). The GCE modified with Au/g-C3N4, Ag/g-C3N4 or Au-Ag/g-C3N4 showed stronger ECL intensity than that of the GCE modified with Au-Ag NPs or g-C3N4 nanosheets. Moreover, the GCE modified with Au-Ag/g-C3N4 exhibited the strongest ECL intensity. Thus, there was a synergistic effect between metal NPs and g-C3N4 nanosheets. The good strengthening performance of Au-Ag/g-C3N4 NCs for luminol ECL could be attributed to not only the good conductivity due to Au-Ag NPs but also the good electrocatalytic activity for OER (Fig. 4B). In addition, luminol could be absorbed on the modified electrode surface via π stacking interaction between the aromatic rings of luminol and the conjugated π-systems of g-C3N4, which also favored the ECL reaction of luminol.![(A) Influence of the different nanomaterials on ECL intensity. (B) The possible ECL mechanisms of the proposed aptasensor. (C) ECL responses at the different fabrication stages of the aptasensor (1.0 ng/mL CEA). (D) EIS and (E) CV of the different modified electrodes in 5.0 mM [Fe(CN)6]3−/4− containing 0.1 M KCl.](/content/184/2022/15/10/img/10.1016_j.arabjc.2022.104092-fig5.png)
(A) Influence of the different nanomaterials on ECL intensity. (B) The possible ECL mechanisms of the proposed aptasensor. (C) ECL responses at the different fabrication stages of the aptasensor (1.0 ng/mL CEA). (D) EIS and (E) CV of the different modified electrodes in 5.0 mM [Fe(CN)6]3−/4− containing 0.1 M KCl.
In view of the good strengthening performance for luminol ECL Au-Ag/g-C3N4 NCs were used as the ECL sensing platform for CEA detection. The thiol terminated CEA aptamers were covalently bound to the Au-Ag NPs surface via Au-S or Ag-S bonds. After the nonspecific binding sites were blocked with β-mercaptoethanol, the aptasensor was incubated in CEA-containing solution for CEA detection. The ECL signals at different assembly stages of the proposed aptasensor were recorded to monitor the fabrication processes. As shown in Fig. 4C, after aptamer, β-ME and CEA were assembled onto the GCE modified with Au-Ag/g-C3N4 NCs, the ECL signal decreased sequentially because the assembled protein layers hindered the electron transfer of ECL reaction and the diffusion of ECL reactants toward the electrode surface (Chen et al., 2014). Based on above results, an ECL aptasensor was successfully constructed for CEA detection.
Furthermore, the interface property change of the modified electrode surface was monitored by electrochemical impedance spectroscopy (EIS). Compared to the bare GCE, the lower charge transfer resistance (Rct) of the Au-Ag/g-C3N4/GCE was attributed to the good conductivity of Au-Ag/g-C3N4 NCs. The Rct increased significantly after the assembly of aptamer, β-mercaptoethanol and CEA in sequence (Fig. 4D), which could be attributed to the poor conductivity of the assembled layers. Meanwhile, the cyclic voltammetry (CV) results shown in Fig. 4E was consistent with the EIS results.
3.3 Optimization of experimental conditions
For improving the analytical performance of the aptasensor, the experimental conditions have been optimized in detail. As shown in Fig. 5A, the optimal molar ratio of Au to Ag was 3:2. When the concentration of g-C3N4 was 0.1 mg/mL, the ECL intensity reached the maximum (Fig. 5B). The coated volume of Au-Ag/-g-C3N4 NCs was optimized as approximately 2 μL (Fig. 5C). As shown in Fig. 5D, ΔECL (the decrease in ECL intensity) increased with increasing aptamer concentrations, while became very slow after 1.5 μM. The effects of incubation time and luminol concentration on ΔECL were also investigated. The ΔECL were almost unchanged after 90 min (Fig. 5E) and 5 × 10⁻⁵ M luminol concentration (Fig. 5F). Therefore, 1.5 μM aptamer concentration, incubation time of 90 min and 5 × 10⁻⁵ M luminol concentration were selected for subsequent experiments.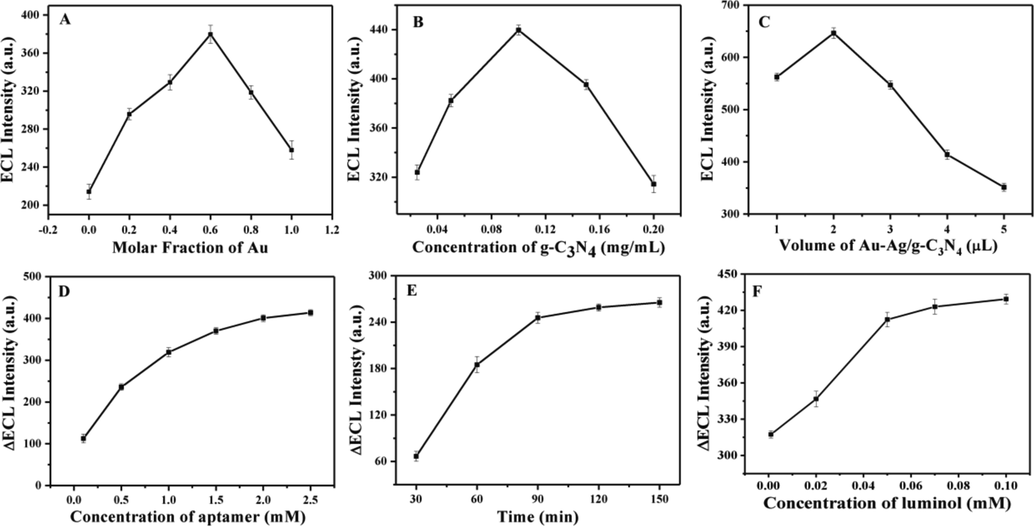
Effects of Au molar fraction in Au-Ag NPs (A), g-C3N4 concentration (B), drip volume of Au-Ag/g-C3N4 NCs (C), aptamer concentration (D), incubation time in 1.0 × 10⁻⁶ ng/mL CEA (E) and luminol concentration (F) on ECL response.
In addition, the selection of H2O2 concentration was based on two aspects. On the one hand, the ECL intensity of luminol in PBS (pH = 7.4) containing dissolved O2 was too weak to be used as background signal for the detection of CEA. Thence, H2O2 was chosen to enhance the ECL intensity of luminol. On the other hand, H2O2 would decompose in PBS (pH = 7.4), the concentration should be kept as low as possible. Considering the above two aspects, the concentration of H2O2 selected in this experiment was 5 × 10⁻⁶ M.
3.4 Analytical performance of the ECL aptasensor
The property of the developed ECL aptasensor was investigated under the optimum conditions. As exhibited in Fig. 6A, with the increase of CEA concentration, the ECL peak intensity weakened. A linear regression of ΔI (ΔI as the decreased ECL peak intensity after incubation with CEA) upon the logCCEA was established in the range of 1.0 × 10⁻⁶ ng/mL to 1.0 ng/mL with a regression equation of ΔI = 816 + 67.6logCCEA (R2 = 0.992). The detection limit of 8.9 × 10⁻⁷ ng/mL (S/N = 3) was lower than that reported in the literatures listed in Table S1. The excellent signal stability of the ECL aptasensor for 1.0 × 10⁻² ng/mL CEA in 600 s was demonstrated in the inset of Fig. 6B.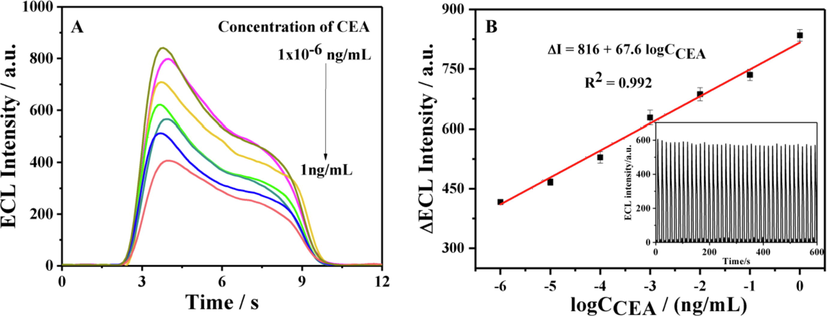
(A) The ECL of the aptasensor from different CEA concentration and (B) Linear relationship of ΔECL with logCCEA (inset: the ECL intensity obtained from 1.0 × 10⁻² ng/mL CEA for 600 s).
3.5 Reproducibility, stability and specificity of the ECL aptasensor
In Fig. 7A, the reproducibility of the developed aptasensor was researched by detecting the CEA (0.1 ng/mL) using the four different prepared aptasensors under the same condition and the RSD (n = 4) was 3.8%, indicating the proposed aptasensor had good reproducibility.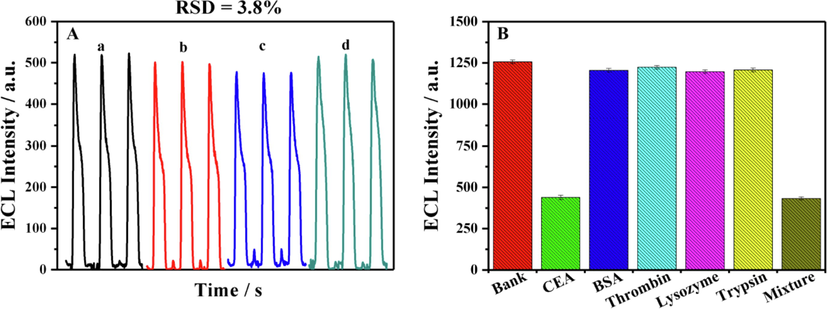
(A) The ECL signals from the four prepared ECL aptasensors for 0.1 ng/mL CEA and (B) the ECL responses of the developed aptasensor after incubating with 1.0 ng/mL CEA, BSA, Thrombin, Trypsin and Lysozyme.
The long-term stability of the prepared ECL aptasensor was also investigated. After the prepared aptasensor was stored at 4 °C for one month, the original signal decreased by 5.5%, indicating the proposed sensor had a good stability.
Moreover, to examine the specificity of the proposed aptasensor, the responses of the proposed aptasensor for other interferences were measured. The concentration of the CEA and the interferences was all 1.0 ng/mL. As displayed in Fig. 7B, the ECL signal of CEA was significantly lower than that of other interfering substances, indicating the proposed aptasensor can specifically recognize CEA with good selectivity, which was expected to be applied to complex biological environments.
3.6 Detection of CEA in real samples
The developed aptasensor was applied to CEA analysis in human serum samples. Considering that the linear range of the aptasensor is lower than the CEA concentration of serum samples, the samples were diluted 1000 times before detected. As presented in Table 1, the recovery rates with the developed aptasensor varied from 96.8% to 105%. In order to verify the accuracy of the developed method, the results determined by the proposed assay had been compared with those obtained by enzyme-linked immunosorbent assay (ELISA) used in hospital (Table 2). The CEA levels detected by the proposed aptasensor were in good agreement with the results detected by ELISA, suggesting the developed ECL aptasensor had great clinical application prospects.
samples
Added (ng/mL)
Detected (ng/mL)
Found (ng/mL)
RSD% (n = 3)
Recovery (%)
0.00
5.06
–
3.1
–
1
5.00
9.90
4.84
2.7
96.8
10.00
14.86
9.80
2.0
98.0
0.00
20.53
–
1.8
–
2
20.00
41.56
21.03
2.6
105
40.00
59.36
38.83
3.5
97.1
samples
ELISA (ng/mL)
aptasensor (ng/mL)
Error value (ng/mL)
1
0.97
1.08
0.11
2
5.31
5.06
−0.25
3
20.06
20.53
0.47
4 Conclusions
The Au-Ag/g-C3N4 NCs was synthesized by decorating g-C3N4 nanosheets with alloy-structured Au-Ag bimetallic NPs via one-step in situ chemical reduction. As ECL sensing platform, Au-Ag/g-C3N4 NCs could increase the ECL intensity of luminol due to the electrocatalytic activity for OER, the good electronic conductivity and the ability to adsorb luminol via π stacking interaction. The proposed aptasensor demonstrated a wide linear range with a low detection limit for CEA detection and displayed the results consistent with ELISA for the detection of CEA in human serum samples. This aptasensor could offer a reliable method for the detection of CEA in clinical application.
Acknowledgments
This research was supported by the National Natural Science Foundation of China (Grant Nos. 22074089 and 21505091) and Henan Province Foundation for University Key Teacher (Grant No. 2018GGJS133).
Declaration of Competing Interest
The authors declare that they have no known competing financial interests or personal relationships that could have appeared to influence the work reported in this paper.
References
- Gold nanoparticle-graphite-like C3N4 nanosheet nanohybrids used for electrochemiluminescent immunosensor. Anal. Chem.. 2014;86:4188-4195.
- [CrossRef] [Google Scholar]
- Electrochemiluminescence of luminol in alkaline solution at a paraffin-impregnated graphite electrode. Anal. Chem.. 2003;75:324-331.
- [CrossRef] [Google Scholar]
- Highly efficient g-C3N4 nanorods with dual active sites as an electrocatalyst for the oxygen evolution reaction. ChemCatChem. 2019;11:2870-2878.
- [CrossRef] [Google Scholar]
- Dual-wavelength electrochemiluminescence ratiometry based on resonance energy transfer between Au nanoparticles functionalized g-C3N4 nanosheet and Ru(bpy)32+ for microRNA detection. Anal. Chem.. 2015;88:937-944.
- [CrossRef] [Google Scholar]
- Synthesis of g-C3N4 nanoparticles in mesoporous silica host matrices. Adv. Mater.. 2005;17:1789-1792.
- [CrossRef] [Google Scholar]
- Magnetic electrochemiluminescent Fe3O4/CdSe–CdS nanoparticle/polyelectrolyte nanocomposite for highly efficient immunosensing of a cancer biomarker. Chem. Eur. J.. 2011;17:641-648.
- [CrossRef] [Google Scholar]
- Optical transformation of a CdTe quantum dot-based paper sensor for a visual fluorescence immunoassay induced by dissolved silver ions. J. Mater. Chem. B. 2017;5:826-833.
- [CrossRef] [Google Scholar]
- A spatial-resolved electrochemiluminescence aptasensor for carcinoembryonic antigen detection in a double-check mode. Sensor. Actuat. B-Chem.. 2018;276:173-179.
- [CrossRef] [Google Scholar]
- Mn2+-doped NaYF4:Yb/Er upconversion nanoparticles with amplified electrogenerated chemiluminescence for tumor biomarker detection. J. Mater. Chem. B. 2014;2:6626-6633.
- [CrossRef] [Google Scholar]
- SWCNTs@GQDs composites as nanocarriers for enzyme-free dual-signal amplification electrochemical immunoassay of cancer biomarker. Anal. Chim. Acta. 2018;1042:44-51.
- [CrossRef] [Google Scholar]
- From aggregation-induced emission of Au(I)-thiolate complexes to ultrabright Au(0)@Au(I)-thiolate core-shell nanoclusters. J. Am. Chem. Soc.. 2012;134:16662-16670.
- [CrossRef] [Google Scholar]
- Fabrication and characterization of hierarchical multipod silver citrate complex microcrystals with excellent SERS properties. RSC Adv.. 2016;6:12311-12314.
- [CrossRef] [Google Scholar]
- Fabrication of an ultrasensitive and selective electrochemical aptasensor to detect carcinoembryonic antigen by using a new nanocomposite. Biosens. Bioelectron.. 2019;129:1-6.
- [CrossRef] [Google Scholar]
- Continuous modulation of electronic structure of stable thiolate-protected Au25 cluster by Ag doping. Chem. Commun.. 2010;46:4713-4715.
- [CrossRef] [Google Scholar]
- The effect of AuAg–MCF and AuAg–NbMCF catalysts pretreatment on the gold–silver alloy formation and the catalytic behavior in selective methanol oxidation with oxygen. J. Mol. Catal. A-Chem.. 2015;409:137-148.
- [CrossRef] [Google Scholar]
- A carboxylated graphene nanodisks/glucose oxidase nanotags and Mn:CdS/TiO2 matrix based dual signal amplification strategy for ultrasensitive photoelectrochemical detection of tumor markers. Analyst. 2017;142:4647-4654.
- [CrossRef] [Google Scholar]
- Facile synthesis of a MoS2–prussian blue nanocube nanohybrid-based electrochemical sensing platform for hydrogen peroxide and carcinoembryonic antigen detection. ACS Appl. Mater. Inter.. 2017;9:12773-12781.
- [CrossRef] [Google Scholar]
- Facile one-pot green synthesis of Au–Ag alloy nanoparticles using sucrose and their composition-dependent photocatalytic activity for the reduction of 4-nitrophenol. Dalton Trans.. 2018;47:4315-4324.
- [CrossRef] [Google Scholar]
- Ultrathin graphitic C3N4 nanosheets/graphene composites: efficient organic electrocatalyst for oxygen evolution reaction. ChemSusChem. 2014;7:2125-2130.
- [CrossRef] [Google Scholar]
- A ratiometric electrochemiluminescence detection for cancer cells using g-C3N4 nanosheets and Ag–PAMAM–luminol nanocomposites. Biosens. Bioelectron.. 2016;77:76-82.
- [CrossRef] [Google Scholar]
- Surface-enhanced electrochemiluminescence of Ru@SiO2 for ultrasensitive detection of carcinoembryonic antigen. Anal. Chem.. 2015;87:5966-5972.
- [CrossRef] [Google Scholar]
- Strong enhancement of the electrochemiluminescence of luminol by AuAg and PtAg alloy nanoclusters, and its sensitization by phenolic artificial oestrogens. Microchim. Acta. 2014;181:1223-1230.
- [CrossRef] [Google Scholar]
- SERS-activated platforms for immunoassay: probes, encoding methods, and applications. Chem. Rev.. 2017;117:7910-7963.
- [CrossRef] [Google Scholar]
- A dual-signaling electrochemical ratiometric method for sensitive detection of carcinoembryonic antigen based on Au-Cu2S-CuS/graphene and Au-CeO2 supported toluidine blue complex. Sensor. Actuat. B-Chem.. 2018;256:504-511.
- [CrossRef] [Google Scholar]
- A nano-TiO2 supported AuAg alloy nanocluster functionalized electrode for sensitizing the electrochemiluminescent analysis. J. Electroanal. Chem.. 2013;702:37-44.
- [CrossRef] [Google Scholar]
- Identifying luminol electrochemiluminescence at the cathode via single-atom catalysts tuned oxygen reduction reaction. J. Am. Chem. Soc.. 2022;144:7741-7749.
- [CrossRef] [Google Scholar]
- Colorimetric biosensor for detection of Cancer biomarker by Au nanoparticle-decorated Bi2Se3 nanosheets. ACS Appl. Mater. Inter.. 2017;9:6931-6940.
- [CrossRef] [Google Scholar]
- Eosin Y-sensitized graphitic carbon nitride fabricated by heating urea for visible light photocatalytic hydrogen evolution: the effect of the pyrolysis temperature of urea. PCCP. 2013;15:7657-7665.
- [CrossRef] [Google Scholar]
- Green synthesis of Au–Ag alloy nanoparticles using cacumen platycladi extract. RSC Adv.. 2013;3:1878-1884.
- [CrossRef] [Google Scholar]
- Electrochemiluminescence immunosensor for sensitive determination of tumor biomarker CEA based on multifunctionalized flower-like Au@BSA nanoparticles. Sensor. Actuat. B-Chem.. 2017;238:24-31.
- [CrossRef] [Google Scholar]
- Multiplexed sandwich immunoassays using flow-injection electrochemiluminescence with designed substrate spatial-resolved technique for detection of tumor markers. Biosens. Bioelectron.. 2013;41:684-690.
- [CrossRef] [Google Scholar]
- Molecule-level g-C3N4 coordinated transition metals as a new class of electrocatalysts for oxygen electrode reactions. J. Am. Chem. Soc.. 2017;139:3336-3339.
- [CrossRef] [Google Scholar]
- Cobalt-embedded nitrogen-rich carbon nanotubes efficiently catalyze hydrogen evolution reaction at all pH values. Angew. Chem. Int. Ed.. 2014;53:4372-4376.
- [CrossRef] [Google Scholar]
Appendix A
Supplementary material
Supplementary data to this article can be found online at https://doi.org/10.1016/j.arabjc.2022.104092.
Appendix A
Supplementary material
The following are the Supplementary data to this article:Supplementary data 1
Supplementary data 1


