

Translate this page into:
Enhancement of adsorption capacity of Methylene blue, Malachite green, and Rhodamine B onto KOH activated carbon derived from oil palm empty fruit bunches
⁎Corresponding author. chayanoot.s@psu.ac.th (Chayanoot Sangwichien)
-
Received: ,
Accepted: ,
This article was originally published by Elsevier and was migrated to Scientific Scholar after the change of Publisher.
Peer review under responsibility of King Saud University.
Abstract
Abstract
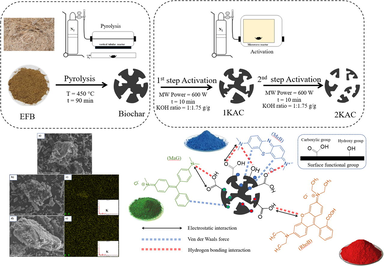
Enhancement adsorption capacity of Methylene blue (MeB), Malachite green (MaG), and Rhodamine B (RhoB) onto activated carbon derived from oil palm empty fruit bunches (Biochar). The activated carbon was produced by pyrolysis with impregnation in KOH solution. To enhance its efficiency, the activation process was performed twice, yielding the adsorbents 1KAC and 2KAC. The adsorption capacity and equilibrium of the three dyes onto the biochar and activated carbon samples were determined by examining the removal efficiency, capacity, kinetics and isotherm models. The pseudo-second-order model performed better than the pseudo-first-order model in terms of adsorption kinetics. The Langmuir model fits well for all three dye molecules with high correlation coefficient values, suggesting that the activated carbon surface is homogeneous and characterized by a finite number of identical sites. The maximum adsorption capacity was 1123.57, 1315.36, and 982.87 mg/g for MeB, MaG, and RhoB, respectively. This founding indicated a high potential adsorbent more than among KOH activated carbon reported in the literature. The study provides valuable insights into the use of activated carbon derived from oil palm empty fruit bunches for the removal of dyes from wastewater.
Keywords
Activated carbon
Adsorption
Heavy metal
Microwave
Oil palm

1 Introduction
Environmental pollution is a major issue in our current era and has been on the rise due to the growth of industries and agriculture. These industries are releasing a large number of pollutants, particularly dyes. Dyes are widely used in various industries, such as the textile industry, food industry, cosmetics industry, paint industry, pMAPEr industry, pharmaceutical industry, printing industry, leather industry, and plastic industry. Even trace amounts of dyes in aquatic environments can have negative effects. Dyes can prevent light from penetrating water systems, disrupting the biological activity of aquatic organisms and leading to serious health problems, diseases, allergies, dermatitis, skin irritation, respiratory toxicity, and even cancer (Pauletto et al., 2020). There are three types of dyes based on their nuclear structures: anionic, nonionic, and cationic. Methylene blue and malachite green are examples of cationic dyes, while Rhodamine B is a water-soluble basic red cationic dye commonly used as a water tracer due to its excellent photophysical properties. Rhodamine B belongs to the xanthene class of dyes and is one of the oldest synthetic dyes (Pang et al., 2020).
Activated carbons are excellent adsorbents in biomass adsorbents due to their high performance, large surface area, and high degree of microporosity. However, the efficiency of activated carbons is largely dependent on the precursor, activators, and production techniques used. The use of expensive and nonrenewable precursors, including traditional long-term heating methods, is a significant challenge for commercial activated carbon production (Gupta et al., 2009; Jagtoyen et al., 1993). Numerous studies have explored alternative sources for adsorbtion and found that using biological materials such as agricultural waste and biomass, is a highly effective option due to their abundance and renewability (Sud et al., 2008). Whether with or without activation treatment, the production process of activated carbon begins with carbonization. This is the most widely used method, a low-cost technique in which organic matter can be transformed into elemental carbons through conventional or microwave-assisted pyrolysis (Rao et al., 2006).
Microwave-assisted pyrolysis is now a popular technique due to its quick and selective heating mechanism (Mahari et al., 2016), which surpasses the limitations encountered in conventional heating methods. The media molecules in this process undergo high-frequency vibrations and frictional collisions, leading to a sharp rise in temperature. This results in a shorter treatment time, owing it to the utilization of microwave energy.
The use of biochar-based activated carbons has been shown to have high efficiency in sorption applications (Gale et al., 2021; Park et al., 2023; Dissanayake et al., 2020). Acid activation is a commonly used and straightforward process, typically done in a single step, to improve the adsorptive properties, functionality, specific surface area, and selectivity of different adsorbates. Research into multi-stage acid activation is relatively rare. This study aimed to evaluate the potential of activated carbons derived from empty palm oil empty fruit bunches through 1-step and 2-step KOH activation. The effects of response parameters such as solution pH, metal ion concentration, and contact time were analyzed. The adsorption capacity of the activated carbon was evaluated for Methylene Blue (MeB), Malachite Green (MaG), and Rhodamine B (RhoB) using two-parameter adsorption isotherms.
2 Theoretical background
2.1 Adsorption kinetic models
There are various kinetic models available for analyzing adsorption kinetics, with the pseudo-first order and pseudo-second order models being the most frequently used. The Lagergren pseudo-first order model (Lagergren 1898) defines the amount of substance adsorbed as follows:
2.2 Adsorption isotherm models
The Langmuir model (Langmuir 1918) is based on the assumptions that adsorption occurs in a single layer (chemical adsorption) and the surface of the adsorbent particles, or the adsorption sites are consistent in nature. The mathematical representation of the Langmuir model is as follows:
3 Material and chemicals
The raw material for this study, oil palm empty fruit bunches, was sourced from Surat Thani in southern Thailand (DMS latitude longitude coordinates for Surat Thani are: 9°8′24.4″N, 99°19′59.2″E.). Only analytical grade substances were used throughout the investigation. The dyes used, Methylene blue (MeB), Malachite green (MaG), and Rhodamine B (RhoB), were obtained from Ajax Finechem and Loba Chemie.
3.1 Adsorbent preparation
The raw material for this study was gathered from Surat Thani in Southern Thailand in the form of oil palm empty fruit bunches. The production of activated carbon was accomplished through several steps, including the crushing and sieving of the raw materials into small pieces of 1.0 to 2.0 mm, pyrolysis in a fixed bed reactor using nitrogen as the flowing gas at a temperature of 450 °C for 1.5 h to produce biochar. This biochar was then impregnated in a KOH solution, with a biochar to KOH ratio of 1:1.75 (wt.%) and subjected to stirring. Activation was completed overnight at room temperature. The resulting activated carbon was then subjected to microwave-induced activation for 10 min at 600 W, followed by washing with deionized water until a pH of 6–7 was achieved. To further enhance its adsorption efficiency, the activation process was performed twice, yielding two samples, 1KAC and 2KAC (Foo and Hameed, 2012; Foo and Hameed, 2012a).
3.2 Batch adsorption
A series of batch experiments were performed to assess the effectiveness of 1KAC and 2 KAC in removing Methylene blue (MeB), Malachite green (MaG), and Rhodamine B (RhoB) from an aqueous solution. The stock solutions were created by dissolving 1.0 g of each dye in 1L of distilled water. Then, standard metal solutions with concentrations ranging from 50 to 800 mg/L were produced by diluting the stock solution. The pH of the metal solutions was adjusted with 0.1 M NaOH or HCl, respectively. The batch adsorption study involved placing 50 mL of the prepared solution in a 250 mL conical flask and adding 0.1 g of adsorbent. The flask was then placed in an incubator under controlled temperature (298 K) and agitated at 150 rpm. The effects of pH, contact time, initial metal concentration and Biochar dose on the adsorption efficiency were carefully studied to determine the optimal conditions and to assess the reusability performance of the adsorbent. The amount of adsorption was calculated by using the following formula:
3.3 Instrumentation
The Methylene blue (MeB), Malachite green (MaG) and Rhodamine B (RhoB) concentrations were measured using a UV/Visible spectrophotometer (UV–Vis) from Perkin-Elmer, located in Norwalk, CT, USA, at 665, 619, and 553 nm, respectively. The biochar EFB and activated carbons were examined using Fourier Transform Infrared Spectrometer (FTIR) from Bruker, Germany. The surface area and porosity of the samples were analyzed with a BET-technique from Micromeritics, USA. The surface elements of the catalyst were determined through X-ray Energy Dispersion Spectroscopy (EDX). The morphological characterization of the catalyst was analyzed through Scanning Electron Microscopy (SEM) pictures captured with the HITACHI S-3400 equipment.
4 Result and discussion
4.1 Characterization of adsorbent
4.1.1 Chemical composition and BET
The BET results revealed that the surface area of 1KAC and 2KAC increased when compared to the biochar EFB, with values of 733.72 m2/g and 779.3 m2/g, respectively. These findings align with previous research studies in the field (Yakout et al., 2016; Valero-Romero et al., 2019). The higher surface area indicates an increase in the number of active sites and an improvement in the mass transfer rate, due to an increase in the pore volume (Valero-Romero et al., 2019). The activation process through KOH reaction enhanced the existing pores and generated new ones, whereas the devolatilization process further developed the basic pore structure in the biochar (Hayashi et al., 2002). However, at a low activation temperature of 600 °C, the increase in the BET was not significant, likely due to the insufficient heat to fully melt the KOH, leading to limited physical pyrolysis on the carbon surface.
4.1.2 FTIR
The surface functional groups of an object can be identified through the study of its Fig. 1. A broad band at 3350 cm−1 typically represents hydroxyl groups, while the band between 2800 and 2950 cm−1 signifies the presence of C–H stretching vibration. The region between 1600 and 1730 cm−1 is related to the axial deformation of carbonyl groups (C = O). The stretching vibration of the molecular plane of C = C bonds in aromatic rings can be observed between 1540 and 1580 cm−1. Alcoholic (C-OH stretching) and ether (R-O-R) groups can be identified by the broad band at 1050–1200 cm−1. The band caused by cyclic groups is located at 650–880 cm−1. The presence of hydroxyl groups, carbonyl groups, ethers, and aromatic compounds supports the notion that the palm shell has a lignocellulosic structure, as similarly observed in materials like Tunisian olive-waste cakes. Previous studies (Baccar et al., 2009) have also reported that palm shell is mainly composed of cellulose, holocellulose, and lignin.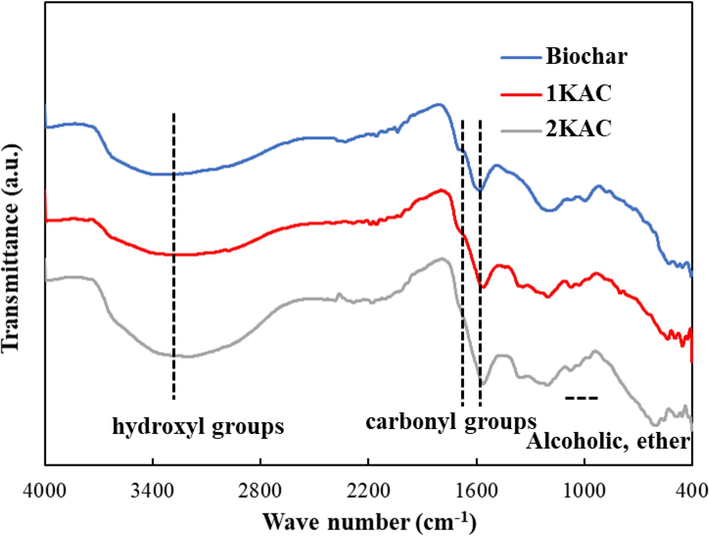
FTIR of untreated biochar, 1KAC and 2KAC.
4.1.3 XRD
Compositional analysis of EFB offers insights into its chemical structure. Fig. 2 shows a comparison of XRD crystallinity analysis between raw EFB and 1KAC, 2KAC. The XRD patterns of raw EFB exhibit peaks at 2θ = 22° and 35°, indicating the presence of carbon and oxygen atoms (Fig. 2a). In Fig. 2b, the peaks at 2θ = 44.6° and 2θ = 35° correspond to zeolite and phosphorus, respectively, attributed to the effect of phosphoric acid in producing activated carbon from EPB. Additional peaks at 2θ = 21°, 27°, 50.1°, 60°, and 68° signify the amorphous nature of the activated carbon, consistent with other research (Imoisili et al., 2019).
XRD of (a) Biochar, (b) 1KAC and 2KAC.
4.1.4 SEM-EDX
The SEM images of biochar, 1KAC, and 2KAC at an activation temperature of 600 °C are presented in Fig. 3. These micrographs reveal that the exterior surface of the activated carbon particles display cracks and crevices as well as a range of crystals in large openings. The EDX results suggest that these crystals in the macropores (Fig. 3 (c) and 3 (e)) are likely potassium compounds, as the EDX analysis indicates a high potassium content in both activated carbons. This is likely the result of activation in the presence of KOH-related compounds that formed during the pyrolysis process (Deng et al., 2020). The BET results also align with this observation, as a large amount of potassium compounds is believed to cover the surface of the activated carbon. The elemental analysis of the residue found that it contained C, N, O, and K (Table 1) (Tseng et al., 2008). The EDX results also support this, as an increase in potassium is associated with a decrease in carbon.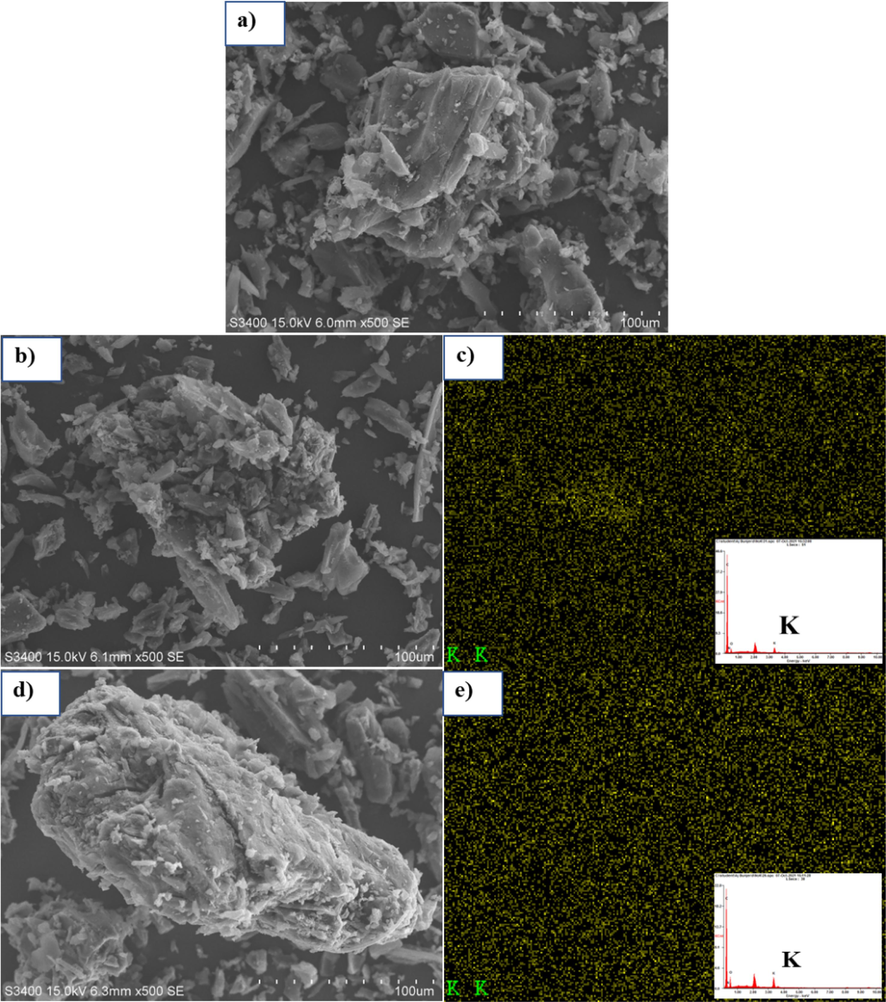
SEM-EDS of (a) Biochar, (b) 1KAC and (c) 2KAC with X-ray mapping of potassium element.
Item
Sample
Biochar
1KAC
2KAC
BET Surface Area (m2/g)
700.65
733.72
779.3
Pore volume (cm3/g)
0.46
0.58
0.62
Pore Size (Å)
32.16
31.92
30.26
Ultimate analysis (wt%)
C
71.44
75.56
64.14
N
2.23
3.04
2.57
O
26.33
13.06
20.58
K
–
8.34
12.73
4.2 Adsorption studies
The adsorption capacity and equilibrium of Methylene blue (MeB), Malachite green (MaG), and Rhodamine B (RhoB) onto biochar, 1KAC and 2KAC were determined. The findings were compiled based on the removal efficiency and capacity, as well as the fitted kinetics and isotherm models.
4.2.1 Effect of pH
The pH of the medium plays a significant role in the adsorption process as it can influence the chemical properties of the activated carbon, including the load on the adsorbent surface and the degree of functional group dissociation. In addition, pH can affect the ionization level of dye molecules. In this study, the adsorption of MeB, MaG, and RhoB onto biochar, 1KAC, and 2KAC was examined at various pH values ranging from 2 to 11. Batch experiments were conducted using an initial concentration of 200 mg/L for each dye, a contact time of 3 h, and an adsorbent dose of 10 mg. The pH of the solution was controlled using 0.1 N HCl and 0.1 N NaOH. The results showed that the adsorption capacity of the dyes increased as the pH of the solution increased, and maximum adsorption was found in the pH range 6–8 shown in Fig. 4, similar to those reported in the literature (Belcaid et al., 2022). This could be explained by the fact that at low pH, the surface of the biochar is positively charged due to the occupation of active sites by hydrogen ions, which compete with the cationic dyes for the same adsorption sites on the adsorbents.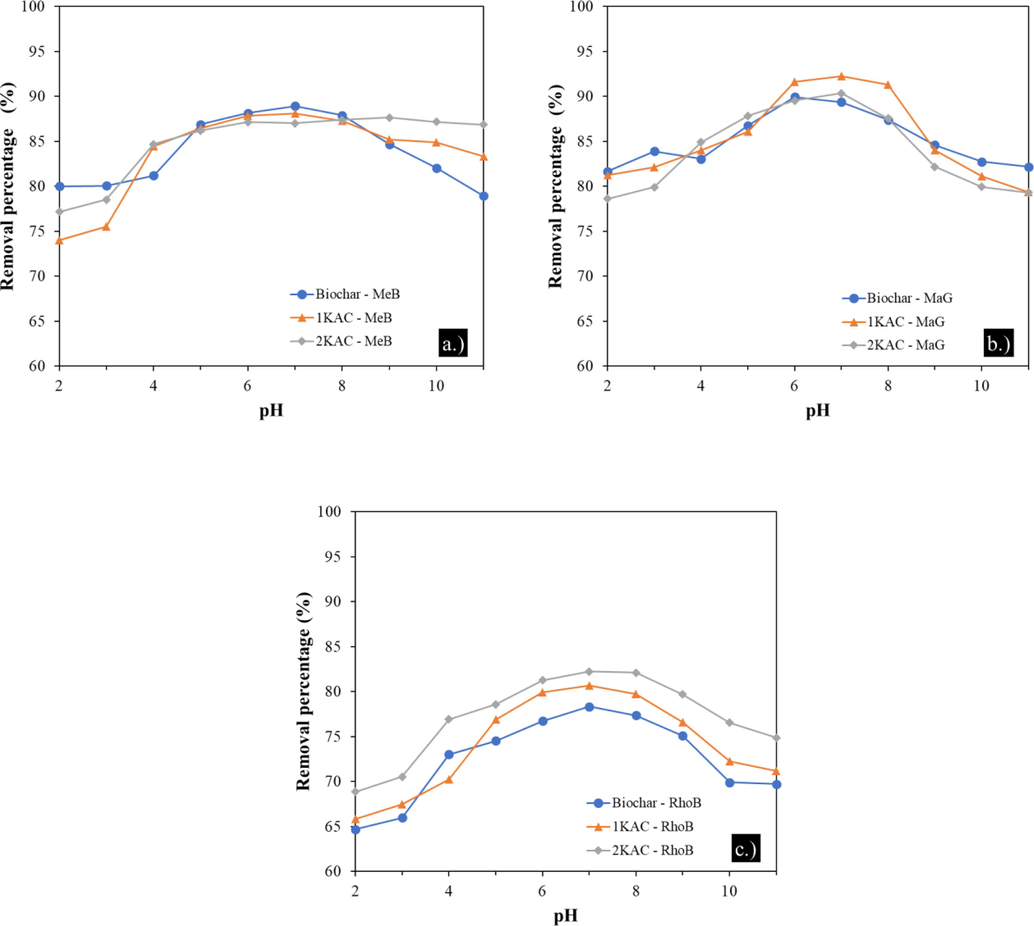
Effects of pH on MeB (a), MaG (b), and RhoB (c) adsorption onto different adsorbents.
4.2.2 Effects of contact time
The adsorption kinetics of MeB, MaG, and RhoB onto biochar were investigated by measuring the adsorption capacity at different time intervals between 5 and 180 min at a constant temperature of 25 °C and a biochar dose of 10 mg. Results presented in Fig. 5 indicate that the adsorption of each dye increased rapidly during the first 20 min, with removal rates of 77.72–80.42% for MeB, 79.06–82.67% for MaG, and 69.10–77.09% for RhoB. This increase was due to the rapid adsorption of the dye molecules onto the active sites on the external surface of the biochar. Subsequently, the adsorption rate of each dye increased slightly after 80 min and then reached equilibrium after 120 min due to the saturation of most of the adsorption sites by the dye ions.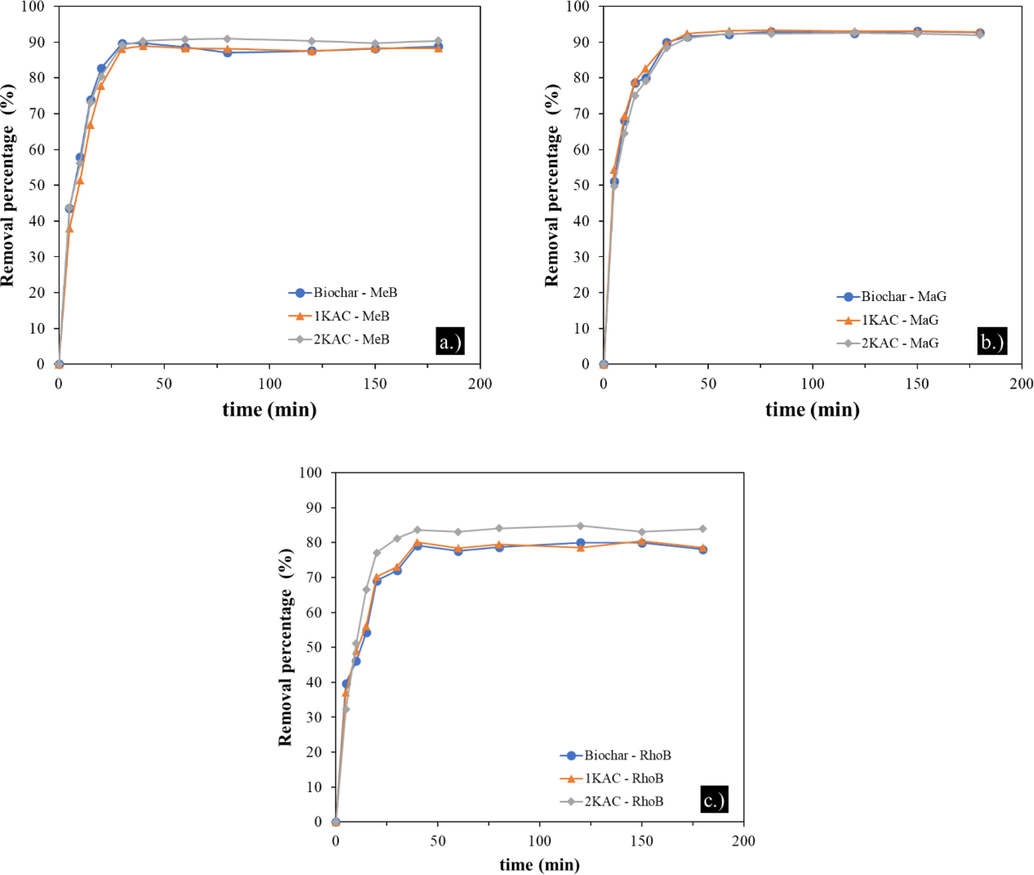
Effect of contact time on MeB (a), MaG (b), and RhoB (c) adsorption onto different adsorbents.
4.2.3 Effect of initial concentration of adsorbate
Two factors that affect the concentration of adsorbates, are incomplete adsorption and aggregation of adsorbent particles at high concentrations. In this study, the removal of MeB, MaG, and RhoB was examined at various initial concentrations ranging from 50 to 800 mg/L at an optimum pH of 6 and 180 min of contact time. Fig. 6 depicts the effects of initial dye concentrations on their removal from the aqueous solution using biochar, 1KAC, and 2KAC. The maximum removal percentages for Biochar, 1KAC, and 2KAC ranged from 84.72% to 93.66%, 85.60% to 94.12%, and 87.18% to 94.68%, respectively. The removal efficiency decreased with increasing initial adsorbate concentration for all adsorbents. However, 2KAC demonstrated much higher removal efficiency. The initial concentration of the metal ion is the main driver of mass transfer from aqueous to solid phase, and a higher initial concentration of dye can increase the adsorption capacity. Nonetheless, the removal of all dyes decreased with higher initial concentration since a given mass of adsorbent has a limited number of adsorption sites, which become saturated as the dye concentration increases (Saravanan et al., 2016).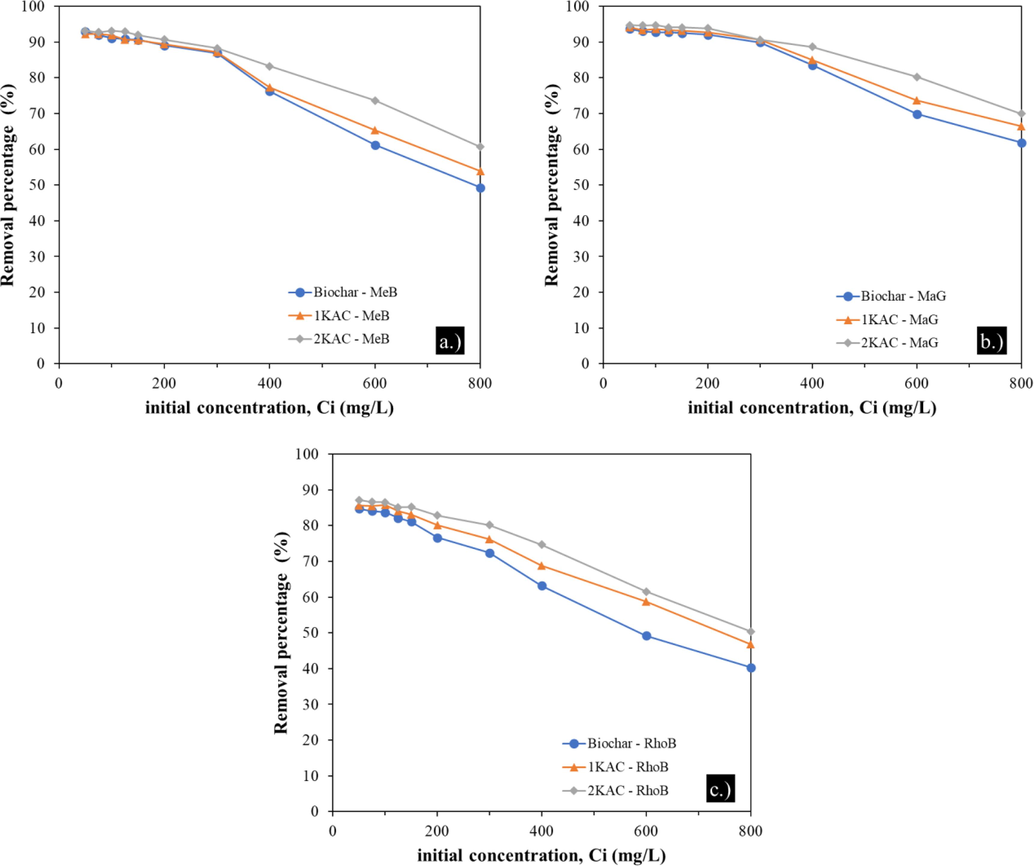
Effect of initial concentration of dyes on the removal of MeB (a), MaG (b), and RhoB (c) by biochar, 1KAC, and 2KAC, adsorbent dosage 10 mg, pH 6 and contact time 180 min.
4.2.4 Effect of adsorbent dosage
The performance of adsorption is significantly influenced by the adsorbent dose. To determine the optimal dose of adsorbent for a variety of MeB, MaG, and RhoB concentrations, the influence of adsorbent dose on adsorption has been studied. (Salleh et al., 2011) As indicated in the graphic below (Fig. 7), the effect of adsorbent dose was investigated using 50 mL of MB concentrations 200 mgL-1, each with a different adsorbent dose (2 – 50 mg).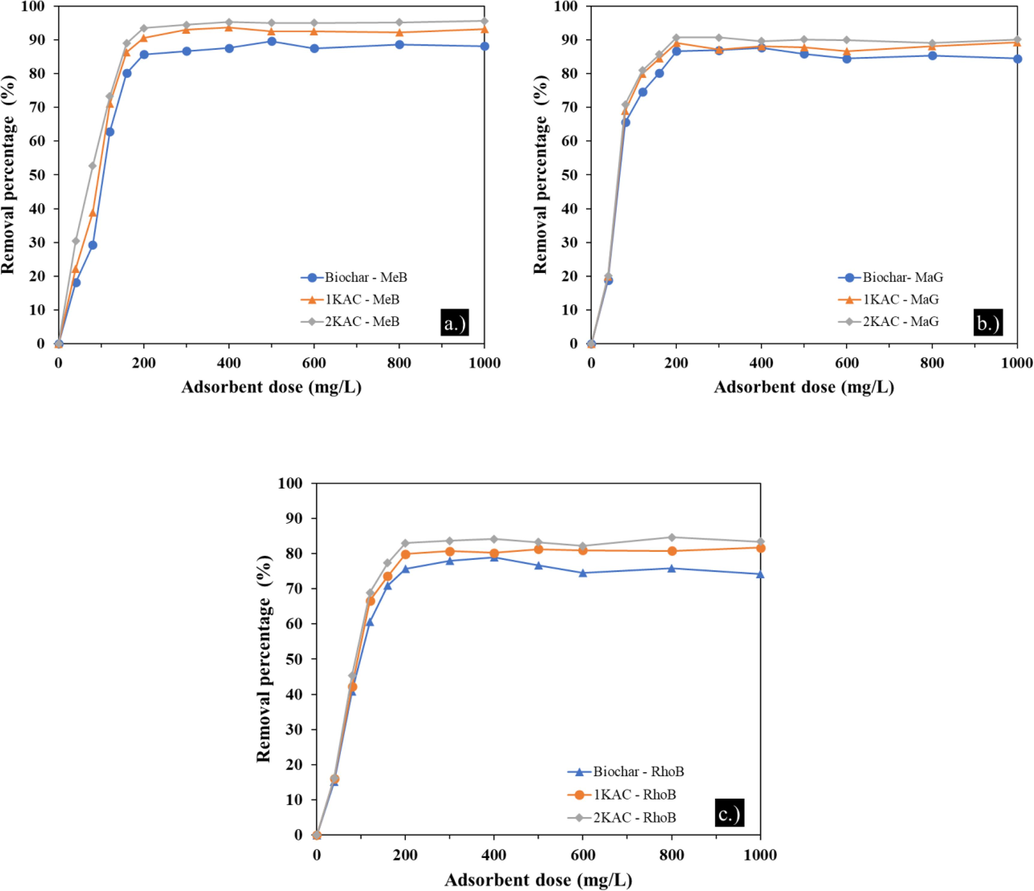
Effect of adsorbent dose on MeB (a.), MaG (b), and RhoB (c) adsorption onto Biochar, 1KAC, and 2EFB. (Ci = 200 mg/L, contact time = 120 min, pH = 5).
The removal rate of MeB, MaG, and RhoB gradually increased as the mass of adsorbents increased as a result of the growth in adsorbent pores and adsorption sites. When the mass of the adsorbent reached a certain level, the adsorption would tend toward equilibrium. At an adsorbent mass of 10 mg, which corresponds to an initial dye concentration of 200 mg/L, the removal rate of dyes reached its saturation value. Adsorption capacity per unit mass of adsorbent decreased at high adsorbent dosages because there weren't enough MB dye molecules in solution to fully bind to all of the material's active adsorption sites. This led to a surface equilibrium state.
4.3 Adsorption kinetics
The adsorption mechanism and rate-controlling steps of MeB, MaG, and RhoB onto EFB biochar were investigated using three kinetic models: pseudo-first order, pseudo-second order, and intraparticle diffusion. The fitting results of these models were presented in Fig. 8 and summarized in Table 2. The results indicated that the pseudo-second order model performed better than the pseudo-first order model. The R2 values obtained from the pseudo-second-order model were close to unity (0.98 for MB, 0.991 for MG, and 0.989 for RB), and the calculated error MAPE was relatively lower compared to the pseudo-first order model. Moreover, the calculated adsorption capacities of the pseudo-second order kinetic model were consistent with the experimental adsorption capacities, indicating that the adsorption rate was controlled by chemisorption involving the exchange and sharing of electrons between the dyes and the functional groups of biochar. Therefore, the pseudo-second order model can describe the adsorption behavior of MeB, MaG, and RhoB onto activated carbon.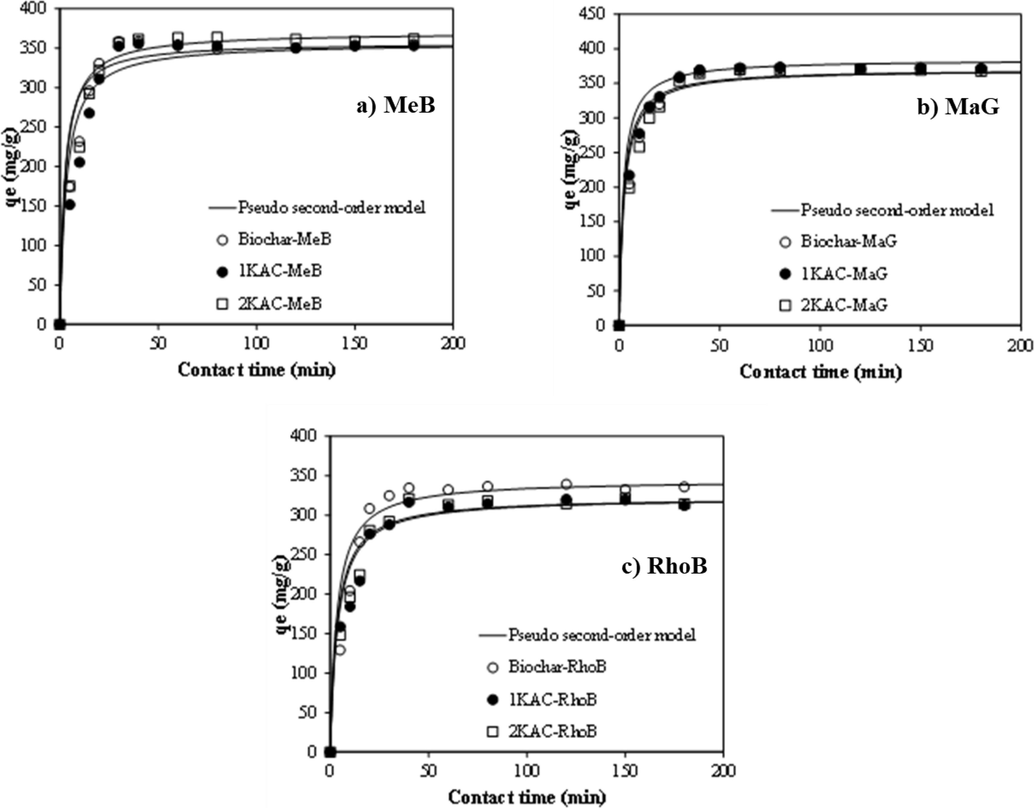
Kinetics of (a) MeB, (b) MaG, and (c) RhoB adsorption onto different adsorbents.
Adsorbents
dyes
Peudo first-order
Peudo second-order
qe
k1
R2
k2
qe
R2
Biochar
MeB
102.07
0.0041
0.720
0.0012
357.14
0.999
MaG
80.37
0.0056
0.725
0.0012
370.37
1.000
RhoB
69.60
0.0040
0.540
0.0009
344.83
0.998
1KAC
MeB
76.67
0.0047
0.590
0.0009
357.14
0.998
MaG
66.63
0.0051
0.654
0.0013
384.62
1.000
RhoB
78.61
0.0037
0.452
0.0008
322.58
0.998
2KAC
MeB
76.81
0.0043
0.593
0.0010
370.37
0.998
MaG
96.07
0.0045
0.646
0.0011
370.37
0.999
RhoB
98.27
0.0039
0.633
0.0009
322.58
0.999
4.4 Adsorption isotherm
Equilibrium isotherm models were utilized to evaluate the adsorption capabilities of biochar, 1KAC, and 2KAC for MeB, MaG, and RhoB. Several isotherm models, such as Langmuir, Freundlich, and Temkin, were employed in the analysis. These models were fitted to the experimental results, and the fit quality was quantitatively compared using the mean absolute percentage error (MMAPE):
Table 3 summarizes the Langmuir and Freundlich model fitting parameter values and correlation coefficients for the adsorption isotherms of MeB, MaG, and RhoB onto biochar from oil palm empty fruit bunches and 1 and 2-step KOH activated carbon at 25 °C, as illustrated in Fig. 9. The sorption isotherm results revealed that the Langmuir model fit well for all three dye molecules with high correlation coefficient (R2) values and low MAPE. This suggests that the CPC surface is homogeneous and characterized by a finite number of identical sites and that the adsorption occurs as a monolayer onto the biochar surface. In contrast, the Freundlich model did not fit well, with a low correlation coefficient and the highest MAPE compared to the Langmuir model (Table 3).
Adsorbents
Metal
Langmuir model
Freundlich model
Temkin model
K
qmax
R2
MAPE (%)
Kf
n
R2
MAPE (%)
bT
kT
R2
MAPE (%)
Biochar
MeB
0.0361
796.17
0.996
3.73
66.11
2.09
0.940
18.86
13.64
0.352
0.975
12.99
MaG
0.0296
1081.20
0.998
3.96
72.18
2.00
0.929
18.16
12.21
0.393
0.992
10.57
RhoB
0.0177
717.29
0.998
2.09
31.85
1.70
0.957
20.90
12.13
0.146
0.981
26.10
1KAC
MeB
0.0284
944.81
0.997
3.29
69.63
2.18
0.955
15.83
14.61
0.389
0.989
7.26
MaG
0.0295
1164.37
0.997
4.38
72.18
1.93
0.939
17.02
11.28
0.392
0.992
11.41
RhoB
0.0150
903.06
0.996
3.19
32.11
1.62
0.953
18.32
10.92
0.150
0.974
23.79
2KAC
MeB
0.0268
1123.57
0.995
3.78
73.25
2.11
0.955
17.32
13.35
0.404
0.984
9.03
MaG
0.0298
1315.36
0.996
4.39
66.11
2.09
0.940
27.65
10.40
0.423
0.991
12.88
RhoB
0.0153
982.87
0.999
2.23
35.31
1.61
0.947
18.38
10.39
0.166
0.984
24.02
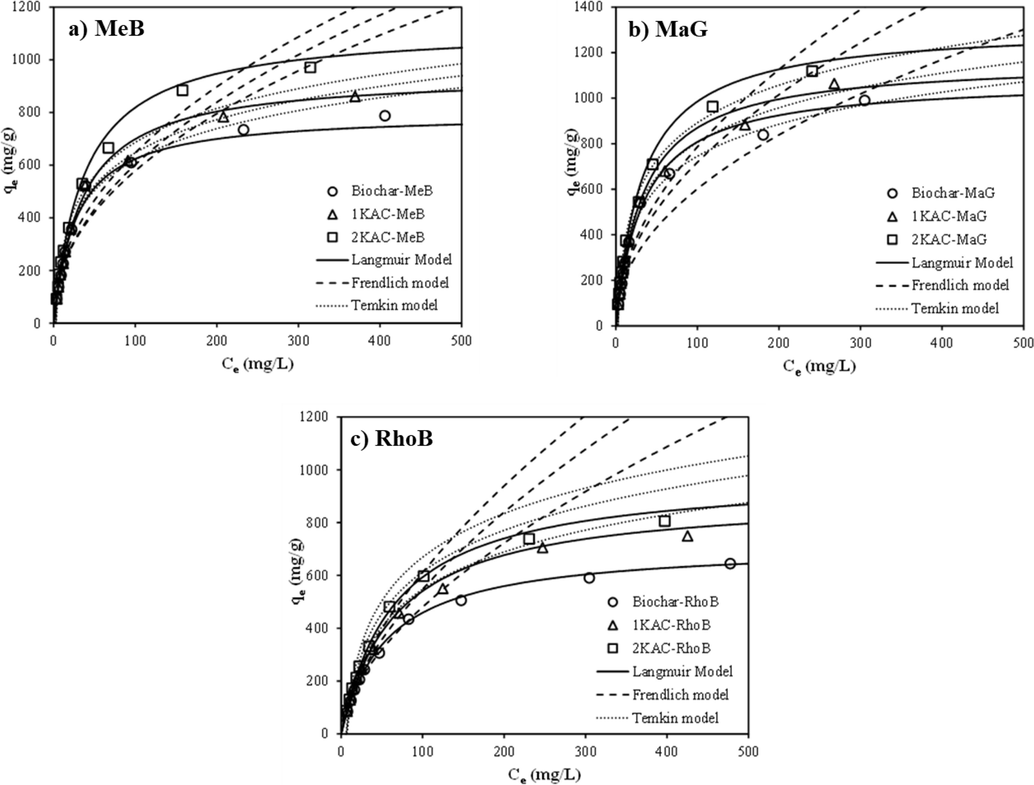
Non-linear curves of various adsorption isotherms with experimental data.
For the Langmuir isotherm, the R2 values were 0.99 for MeB, 0.83 for MaG, and 0.98 for RhoB, whereas for the Freundlich isotherm, the R2 values were 0.98 for MeB, 0.81 for MaG, and 0.94 for RhoB. The presence of a plateau region in Fig. 9 confirmed that the biochar surface is homogeneous and that all sites on the biochar surface have equal energy. The maximum monolayer adsorption capacity (qmax) of biochar for MeB, MaG, and RhoB entrapment in a single system was found to be 796.17, 1081.20, and 850.28 mg/g, respectively. For 1KAC and 2KAC, the adsorption capacities of MeB, MaG, and RhoB improved to 944.81, 1164.37, and 903.06 mg/g for 1KAC and 1123.57, 1315.36, and 982.87 mg/g for 2KAC. This indicated that the activation used in this study can enhance the performance of activated carbon as an alternative adsorbent. The removal of MeB and MaG towards the cassava peel surface in a single system was higher than RhoB, which is because smaller molecules gain easier access to the internal pore of the adsorbent than larger molecules. MeB and MaG have lower molecular weights than RhoB (MeB = 320 g/mol, MaG = 365 g/mol, RhoB = 478 g/mol) (Belcaid et al., 2022).
Table 4 presents a comparison of the maximum adsorption capacities (qmax) estimated from the Langmuir model for 2-step KOH activated carbon with relevant prior studies. The results showed outstanding performance for the adsorption of MeB and MaG, but only middling quality for the adsorption of RhoB. The simple and attractive pre-processing used to prepare and activate the adsorbent was found to be a contributing factor to these results. The comparison clearly indicates that the 2-step KOH activation process enhances the physical and chemical properties of the adsorbent, which effectively improves its capacity as an adsorbent and enhances the adsorption efficiency of dyes.
Dyes
Adsorbent source
Activator
BET m2 g−1
Equilibrium time (min)
qmax (mg/g)
Reference
Methylene blue (MeB)
dragon fruit peels
KOH
756.3
195.2
Jawad et al., 2021
coconut shell
KOH
623.37
Tu et al., 2021
chickpea (Cicer arietinum) peel
KOH
917
120
523.56
Jahan et al., 2021
Bamboo waste
KOH
1621.8
250
454.2
Hameed et al., 2007
Almond shell
KOH
2054
–
833.33
Ahsaine et al., 2018
Bamboo chip
KOH
720.69
–
305.3
Jawad and Abdulhameed, 2020
Coconut leaves
KOH
–
150
151.5
Rashid et al., 2016
Sorghum waste
KOH
948.6
120
98.1
Hou et al., 2020
Calicotome villosa
H3PO4
1051
100
169.78
Ibrahim et al., 2021
cassava peel
H3PO4
618.265
180
286.41
Belcaid et al. 2022
Lignocellulosic -
agriculture wasteswater vapor
K2CO3
1771
21205
5290.69
215.52El‑Bery et al., 2022
Oil palm empty fruit bunches (2KAC)
KOH
779.3
120
1123.57
This study
Malachite green (MaG)
Hevea brasiliensis root
KOH
477.74
259.49
Ahmad et al., 2021
Activated carbon pellet
KOH
979
120
395
Tang and Zaini, 2020
yarn processing sludge
KOH + KI
1037
120
498
Tang and Zaini, 2021
cassava peel
H3PO4
618.265
180
282.64
Belcaid et al. 2022
Oil palm empty fruit bunches (2KAC)
KOH
779.3
120
1315.36
This study
Rhodamine B (RhoB)
WO3/AC
KOH
1666.67
Anfar et al., 2018
Raphia hookerie
0.00351
60
666.67
Inyinbor et al., 2016
Sibipiruna
KOH
1984
–
630.94
Spessato et al., 2021
carnauba palm
CaCl2
430.695
120
34.87
Lacerda et al., 2015
white sugar
–
1144.77
12
123.46
Xiao et al., 2020
cassava peel
H3PO4
618.265
180
265.36
Belcaid et al. 2022
Oil palm empty fruit bunches (2KAC)
KOH
779.3
120
982.87
This study
4.5 Comparison of performance of oil palm empty fruit bunch biochar and activated carbon with reported adsorbents
In this study, the Qmax and equilibrium time were compared to those of other activated carbons derived from raw materials (Table 4). It has been found that Biochar, 1KAC, and 2KAC have a higher adsorption capacity and shorter contact times than most of the literature. Both of these factors indicate that the future looks promising for the use of Biochar, 1KAC, and 2KAC in the process of removing organic dyes from aqueous solutions.
4.6 Adsorption mechanism
Physical and chemical adsorption were involved in MeB, MaG, and RhoB adsorption using oil palm empty fruit bunch biochar and activated carbon. FTIR analysis reveals that there are numerous functional groups, including O–H, C–H, C = C, C–C, and C-O (Fig. 10). In addition, the effect of pH on dye adsorption demonstrates that electrostatic interaction is also a significant contributor to the adsorption of the three organic dyes using Biochar, 1KAC, and 2KAC (Yu et al., 2019). In accordance with BET analysis of Biochar, 1KAC, and 2KAC have a large specific surface area (700.65, 733.72, and 779.3 m2/g, respectively) and an abundant mesoporous structure, which can provide a lot of binding and adsorption sites for organic dyes, as well as lower diffusion resistance and increase dye adsorption rates. Therefore, Biochar, 1KAC, and 2KAC may adsorb dye molecules using physical adsorption methods like surface adsorption and pore diffusion. The three dyes are adsorbing to the Biochar, 1KAC, and 2KAC in a monolayer and chemically, according to the adsorption isotherms and kinetics studies. Additionally, the intraparticle diffusion model demonstrates that there are other mechanisms involved in the adsorption of MeB, MaG, and RhoB onto oil palm empty fruit bunch biochar and activated carbon in addition to diffusion. Finally, the thermodynamic analysis can demonstrate that the endothermic and spontaneous nature of the three-dye adsorption onto the Biochar, 1KAC, and 2KAC adsorbent (Belcaid et al., 2022).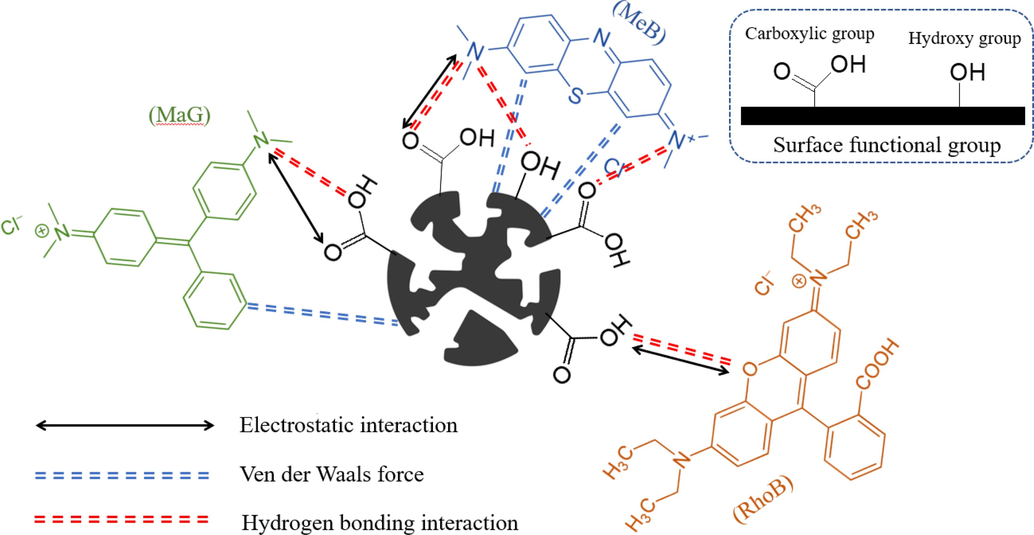
Scheme of adsorption interaction of MeB, MaG, and RhoB onto activated carbon.
4.7 Regeneration of oil palm empty fruit bunch biochar and activated carbon
For the industrial application of any adsorbent, the regeneration and reusability study is an essential step. Indeed, if oil palm empty fruit bunch biochar and activated carbon can be recycled through numerous adsorption–desorption cycles, it may be an economically beneficial adsorbent. With an initial dye concentration of 200 mg/L and a mass of 10 mg of Biochar, 1KAC, and 2KAC at 25 °C for 120 min, five adsorption–desorption cycles were examined in a batch system using HCl as the eluent (Fig. 11). The removal efficiency of MB, MG, and RB dyes is maintained for the first three cycles by Biochar, 1KAC, and 2KAC; however, beginning with the fourth cycle, it gradually decreases from 96.27 to 88.81%, 97.35 to 65.96% and 90.52 to 60.xx for MeB, MaG, and RhoB respectively in case of Biochar, from 77.44 to 68.79%, 68.11 to 63.04% and 62.67 to 62.03 for MeB, MaG, and RhoB respectively in case of 1KAC, and from 81.06 to 71.62%, 74.46 to 73.16% and 64.74 to 47.74 for MeB, MaG, and RhoB respectively in case of 2KAC,.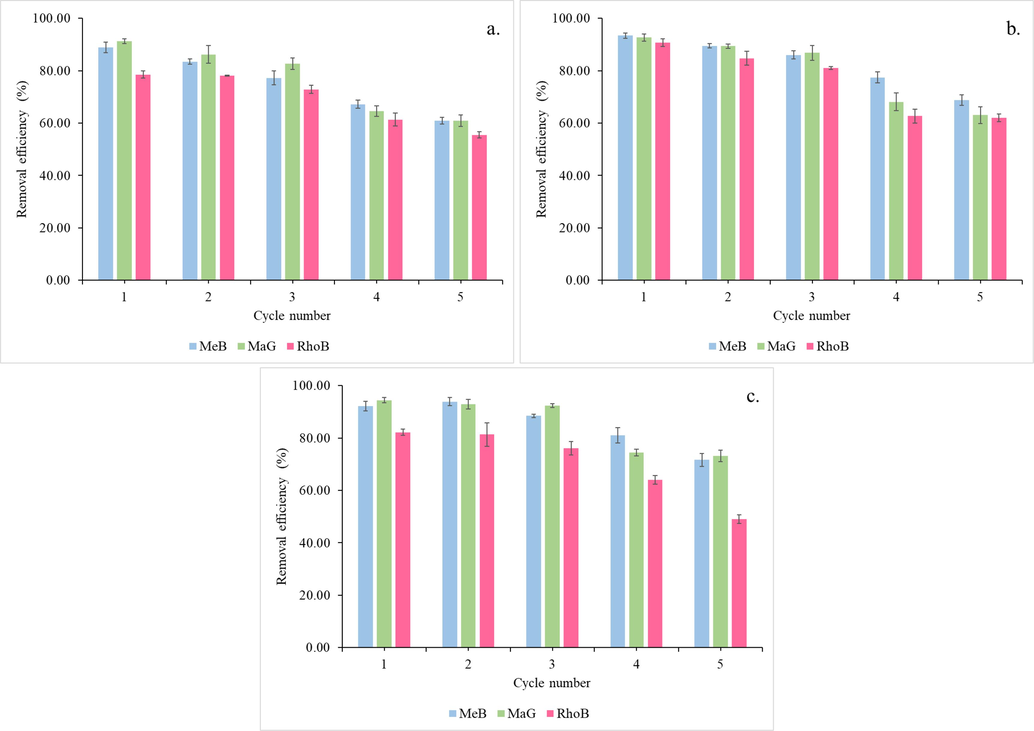
Regeneration of Biochar (a.), 1KAC (b.), and 2KAC (c.) at five consecutive cycles.
This decrease in removal efficiency may be caused by the oil palm empty fruit bunch biochar and activated carbon that was lost during the adsorption–desorption cycles, in addition to the fact that some of the biochar active sites were occupied by HCl and that its surface area decreased. These results indicate that oil palm empty fruit bunch biochar and activated carbon may be an effective adsorbent for the removal of MeB, MaG, and RhoB, in a single dye system that is both cost-effective and efficient (Belcaid et al., 2022).
4.8 Decolorization of MeB, MaG and RhoB in real water samples by Biochar, 1KAC, 2KAC and commercial activated carbon (CAC)
In three different real water samples of tap water, raw water, and waste samples, the adsorption rates of MeB, MaG, and RhoB by Biochar, 1KAC, 2KAC, and commercial activated carbon (CAC) are listed in Table 5. The raw water sample was collected from the Tapi River's back, the industrial wastewater sample was collected from Songkhla Industrial Estate, and the tap water sample was collected from laboratory faucets. Table 5 shows the characteristics of the water samples. Particular amounts of MeB, MaG, and RhoB were prepared at concentrations of 200 mg L-1 in 50.0 mL water samples. After adjusting to a pH of 5.0, all samples were shaken for 120 min. For comparison, distilled water samples were used as the blank water samples. According to the results of the experiment, the adsorption rate of MeB, MaG, and RhoB by Biochar, 1KAC, 2KAC, and CAC in real water samples was slightly higher than it was when dye wastewater was modeled (Kuang et al., 2020).
Dyes
adsorbent
Water sample/ Removal (%)
Distilled water
Tap water
Raw water
industrial wastewater
MeB
Biochar
88.43 ± 1.12
91.22 ± 1.02
91.26 ± 0.37
90.68 ± 0.54
1KAC
90.01 ± 0.32
91.69 ± 0.73
91.34 ± 1.11
90.76 ± 0.58
2KAC
92.46 ± 0.81
91.60 ± 0.69
92.44 ± 0.94
92.06 ± 0.46
CACa
90.38 ± 1.03
91.18 ± 0.98
91.35 ± 1.06
92.13 ± 0.72
MaG
Biochar
91.60 ± 0.83
92.93 ± 0.45
93.06 ± 0.61
92.12 ± 1.00
1KAC
92.73 ± 0.54
92.79 ± 0.60
93.27 ± 0.95
92.91 ± 0.43
2KAC
93.02 ± 0.12
93.19 ± 0.30
92.81 ± 1.49
93.55 ± 0.55
CACa
91.12 ± 0.75
91.63 ± 0.68
91.39 ± 0.82
92.49 ± 0.48
RhoB
Biochar
79.49 ± 0.88
80.13 ± 0.20
81.86 ± 1.31
81.92 ± 1.32
1KAC
80.53 ± 0.95
81.45 ± 0.69
81.73 ± 0.51
83.54 ± 0.64
2KAC
81.32 ± 0.99
81.35 ± 0.82
81.31 ± 0.99
82.66 ± 0.63
CACa
80.62 ± 1.43
79.63 ± 1.02
80.45 ± 0.67
81.19 ± 0.88
5 Conclusions
This study investigated the adsorption of Methylene Blue (MeB), Malachite Green (MaG), and Rhodamine B (RhoB) onto biochar, 1-step KOH activated carbon (1KAC), and 2-step KOH activated carbon (2KAC) derived from oil palm empty fruit bunches. The results showed that the adsorption capacity of the dyes increased with increasing pH, and the adsorption kinetics followed the pseudo-second order model. The Langmuir isotherm was found to be the best fit for all three dye molecules, indicating the presence of homogeneous sites on the adsorbent surface. The maximum monolayer adsorption capacity (Qm) of biochar for MeB, MaG, and RhoB entrapment in a single system were found to be 796.17, 1081.20, and 850.28 mg/g, respectively. Moreover, the adsorption capacities of 1KAC and 2KAC were higher than those of biochar, with 2KAC showing the highest adsorption capacities of 1123.57, 1315.36, and 982.87 mg/g for MeB, MaG, and RhoB, respectively. The study implied that the KOH activation process significantly enhanced the adsorption capacity of the adsorbents, showing outstanding potential for removing cationic dyes from aqueous solutions.
Acknowledgement
The authors would like to acknowledge financial support provided by Prince of Songkla University Graduate School.
Declaration of Competing Interest
The authors declare that they have no known competing financial interests or personal relationships that could have appeared to influence the work reported in this paper.
References
- Adsorption of malachite green by activated carbon derived from gasified Hevea brasiliensis root. Arab. J. Chem.. 2021;14:103104
- [Google Scholar]
- Cationic dyes adsorption onto high surface area ‘almond shell’ activated carbon: kinetics, equilibrium isotherms and surface statistical modeling. Mater. Today Chem.. 2018;8:121-132.
- [Google Scholar]
- Well-designed WO3/Activated carbon composite for Rhodamine B Removal: Synthesis, characterization, and modeling using response surface methodology. Fullerenes, Nanotubes, Carbon Nanostruct.. 2018;28(6):389-397.
- [Google Scholar]
- J. Hazard. Mater.. 2009;162:1522-1529.
- Belcaid, A., Beakou, B.H., Bouhsina, S., Anouar, A, 2022. Insight into adsorptive removal of methylene blue, malachite green, and rhodamine B dyes by cassava peel biochar (Manihot esculenta Crantz) in single, binary, and ternary systems: competitive adsorption study and theoretical calculations. Biomass Conv. Bioref.
- Removal of heavy metals from waters by means of natural zeolites. Water Res.. 1984;18:1501-1507.
- [Google Scholar]
- Preparation of activated carbons fromcotton stalk by microwave assisted KOH and K2CO3 activation. Chem. Eng. J.. 2010;163(3):373-381.
- [Google Scholar]
- Biochar-based adsorbents for carbon dioxide capture: A critical review. Renew. Sustain. Ener. Rev.. 2020;119:109582
- [Google Scholar]
- El‑Bery, H.M., Saleh, M., El‑Gendy, R.A., Mahmoud R. Saleh, M.R, and Thabet, S.M., 2022. High adsorption capacity of phenol and methylene blue using activated carbon derived from lignocellulosic agriculture wastes. Scientific reports. 12,5499.
- Foo and B.H. Hameed, K.Y. (2012). Porous structure and adsorptive properties of pineapple peel based activated carbons prepared via microwave assisted KOH and K2CO3 activation. Microporous and Mesoporous Materials. 148: 191-195.
- Microwave-assisted preparation and adsorption performance of activated carbon from biodiesel industry solid reside: Influence of operational parameters. Bioresour. Technol.. 2012;103:398-404.
- [Google Scholar]
- Physiochemical properties of biochar and activated carbon from biomass residue: influence of process conditions to adsorbent properties. ACS Omega. 2021;6(15):10224-10233.
- [Google Scholar]
- Low-cost adsorbents: growing approach to wastewater treatment. Review. Crit. Rev. Environ. Sci. Technol.. 2009;39:783-842.
- [Google Scholar]
- Adsorption of methylene blue onto bamboo-based activated carbon: kinetics and equilibrium studies. J. Hazard. Mater.. 2007;141:819-825.
- [Google Scholar]
- Micropor. Mesopor. Mat.. 2002;55:63-68.
- Sorghum-waste-derived high surface area KOH-activated porous carbon for highly efcient methylene blue and Pb(II) removal. ACS Omega. 2020;5:13548-13556.
- [Google Scholar]
- Methylene blue dye adsorption onto activated carbon developed from Calicotome villosa via H3PO4 activation. Biomass Convers. Bioref.. 2021;298(6):1-14.
- [Google Scholar]
- Imoisili, P.E., Ukoba, O.K., Jen, T.C., 2019. Green technology extraction and characterisation of silica nanoparticles from palm kernel shell ash via sol-gel. J. Mater. Res. Technol. S2238785419314139 https://doi.org/10.1016/j.jmrt.2019.10.059.
- Kinetics, isotherms and thermodynamic modeling of liquid phase adsorption of Rhodamine B dye onto Raphia hookerie fruit epicarp. Water Resour. Ind.. 2016;15:14-27.
- [Google Scholar]
- Some considerations of the origins of porosity in carbons from chemically activated wood. Carbon. 1993;31:1185-1192.
- [Google Scholar]
- Development of activated carbon from KOH activation of pre–carbonized chickpea peel residue and its performance for removal of synthetic dye from drinking water. Biomass Convers. Bioref.. 2021;430(8):1-11.
- [Google Scholar]
- Statistical modeling of methylene blue dye adsorption by high surface area mesoporous activated carbon from bamboo chip using KOH-assisted thermal activation. Energy Ecol. Environ.. 2020;5:456-469.
- [Google Scholar]
- Jawad A. H., Abdulhameed, A. S., Lee D., Wilson, L. D., Syed-Hassan, S. S. A., ALOthman, Z. A., Khan, M. R., 2021. High surface area and mesoporous activated carbon from KOH-activated dragon fruit peels for methylene blue dye adsorption: Optimization and mechanism study. Chinese Chem. Eng. J. 32,281-290.
- Adsorption of Methylene Blue in water onto activated carbon by surfactant modification. Water.. 2020;12(587):1-19.
- [Google Scholar]
- Rhodamine B removal with activated carbons obtained from lignocellulosic waste. J. Environ. Manage.. 2015;155:67-76.
- [Google Scholar]
- About the theory of so-called adsorption of soluble substances. Kungliga Suensk Vetenskapsakademiens Handlingar.. 1898;241:1-39.
- [Google Scholar]
- The adsorption of gases on plane surfaces of glass mica and platinum. J. Am. Chem. Soc.. 1918;40:1361-1403.
- [Google Scholar]
- Pyrolysis recovery of waste shipping oil using microwave heating. Ener.. 2016;9(10):780.
- [Google Scholar]
- Pang, x., Sellaoui L., Franco, D., Netto, M.s., Georgin, J., Dotto, G.L., Shayeb, M.K.A., Belmabrouk, H., Bonilla-Petriciolet, A., Li, Z., 2020. Preparation and characterization of a novel mountain soursop seeds powder adsorbent and its application for the removal of crystal violet and methylene blue from aqueous solutions. Chem Eng J. 391,123617.
- Activated carbon from biochar: Influence of its physicochemical properties on the sorption characteristics of phenanthrene. Biores. Technol.. 2013;149:383-389.
- [Google Scholar]
- Single and competitive dye adsorption onto chitosan–based hybrid hydrogelsusing artificial neural network modeling. J. Colloid Interface Sci.. 2020;560:722-729.
- [Google Scholar]
- Removal of copper and cadmium from the aqueous solutions by activated carbon derived from Ceiba pentandra hulls. J. Hazard. Mater.. 2006;129:123-129.
- [Google Scholar]
- KOH activated carbon developed from biomass waste: adsorption equilibrium, kinetic and thermodynamic studies for Methylene blue uptake. Desalin. Water Treat.. 2016;57:27226-27236.
- [Google Scholar]
- Cationic and anionic dye adsorption by agricultural solid wastes: A comprehensive review. Desalination. 2011;280:1-13.
- [Google Scholar]
- Optimization of process parameters for the removal of chromium(VI) and nickel(II) from aqueous solutions by mixed biosorbents (custard apple seeds and Aspergillus niger) using response surface methodology. Desalin. Water Treat.. 2016;57(31):14530-14543.
- [Google Scholar]
- Optimization of Sibipiruna activated carbon preparation by simplex-centroid mixture design for simultaneous adsorption of rhodamine B and metformin. J. Hazard. Mater.. 2021;411:125166
- [Google Scholar]
- Agricultural waste material as potential adsorbent for sequestering heavy metal ions from aqueous solutions – A review. Bioresour. Technol.. 2008;99(14):6017-6027.
- [Google Scholar]
- Development of activated carbon pellets using a facile low-cost binder for effective malachite green dye removal. J. Clean. Prod.. 2020;253:119970
- [Google Scholar]
- Microporous activated carbon prepared from yarn processing sludge via composite chemical activation for excellent adsorptive removal of malachite green. Surf. Interfaces. 2021;22:100832
- [Google Scholar]
- Effects of micropore development on the physicochemical properties of KOH-activated carbonsJ. Chin. Inst. Chem. Eng.. 2008;39(1):37-47.
- [Google Scholar]
- Tu, W., Liu, Y., Xie, Z., Chen, M., Maa, L., Zhu, G.D,M., 2021. A novel activation-hydrochar via hydrothermal carbonization and KOH activation of sewage sludge and coconut shell for biomass wastes: Preparation, characterization and adsorption properties. J. Colloid Interface Sci. 593; 390-407.
- Phosphorus-containing mesoporous carbon acid catalyst for methanol dehydration to dimethyl ether. Indust. & Eng. Chem. Res.. 2019;58(10):4042-4053.
- [Google Scholar]
- Preparation and evaluation of an effective activated carbon from white sugar for the adsorption of rhodamine B dye. J. Clean. Prod.. 2020;253:119989
- [Google Scholar]
- Characterization of activated carbon prepared by phosphoric acid activation of olive stones. Arab. J. Chem.. 2016;9:S1155-S1162.
- [Google Scholar]
- Adsorption of malachite green with sodium dodecylbenzene sulfonate modified sepiolite: characterization, adsorption performance and regeneration. Int. J. Environ. Res. Public Health. 2019;16
- [Google Scholar]


