

Translate this page into:
Enhancement of thermal properties of Kevlar 29 coated by SiC and TiO2 nanoparticles and their binding energy analysis
⁎Corresponding author. akib@duet.ac.bd (Md. Akibul Islam),
-
Received: ,
Accepted: ,
This article was originally published by Elsevier and was migrated to Scientific Scholar after the change of Publisher.
Peer review under responsibility of King Saud University.
Abstract
In the fields of military research, aerospace, and vehicle technology, the thermal stability of Kevlar fiber is critical for improving its flame resistance. In this work, the pad mangle machine was used to improve the thermal properties of Kevlar 29 in order to expand the range of applications for thermal aspects. Silicon carbide and titanium oxide nanoparticles provide thermal stability on the fiber surface through intermolecular adhesion. Here, 5 wt% and 10 wt% of nanoparticles with various mass ratios (1:1) have been chosen. Thermogravimetric Analysis (TGA), Differential Scanning Calorimetry (DSC) analysis, and X-ray Photoelectron Spectroscopy (XPS) analysis have all been used to measure different thermal properties. The surface morphology of samples is represented by FESEM analysis, while the active organic groups are represented by FTIR analysis. The greater crystallization of epoxy and nanoparticles is linked to post-heat treatment of the material. The glass transition temperature of the coated samples shifted maximum from 559.13 °C to 580.51 °C, the end set temperature increased by 30.67 °C compared to the uncoated sample, and the residual weight changed from 29.77 percent to 4.06 percent, according to the findings (i.e., lightweight). When compared to the uncoated sample, the coated sample's enthalpy increased significantly (i.e., the samples can absorb more heat). The smaller the positive binding energy, the higher the activation energy, and hence the slower the chemical reaction, which is especially important in high-temperature applications. Finally, this research reveals a 4.5–5.2 percent increase in thermal characteristics.
Keywords
Thermal analysis
Enthalpy
Nanoparticles
Binding energy
Activation energy

1 Introduction
Most material engineers' true objective is to create novel compounds from existing materials. As a result, there are significant research efforts in the field of combinations to improve novel materials, such as those with superior mechanical, electrical, and thermal properties (Chinnasamy et al., 2020). Kevlar is an artificial fiber that belongs to the aromatic polymeric amide family and is an organic fiber with an associate's degree. The extraordinary properties and wonderful chemical composition of absolutely aromatic polyamides (aramids) distinguish them from alternative man-made fibers (Reashad Bin Kabirr and Nasrin Ferdous, 2013). Kevlar fiber has numerous properties that are famous for their lightweight, ability to reduce the thermal expansion (CTE) of excess aircraft coefficient, and consistency with extra-dimensional continuity (Su et al., 2011). It turned into developed for demanding commercial and superior technology applications.
Presently, many forms of Kevlar are currently being produced to fill in the different types of end use (Reashad Bin Kabirr and Nasrin Ferdous, 2013). Among the variety of different Kevlar fibers, Kevlar-99 is best used for inflexibility, light weight, extra strength, and with strong materials and special use strength, damp vibration, and resistance to damage, fatigue, and strain, the main feature of rupture. Kevlar rubber packages, such as tires and extra-high-pressure hose, are appealing as reinforcing fibers. Kevlar-29 has half the modulus of Kevlar-49 and is used in high-strength textiles due to its double-breaks. It is specifically developed for use in places where aircraft deletions, safety damage, and more impact resistance are critical, such as rope, cable, and cover metal for inflatable and architectural materials, and where low resistance is minimized. Depending on the resin system used, aramid compositions can operate at temperatures ranging from −320°F to 400°F (Chatzi and Koenig, 1987).
In determining the combined mechanical and thermal properties, the connectivity of the fiber-protected compound is critical. Interlaminar shear strength (ILSS), isolation barrier, fatigue, thermal conductivity, and corrosion resistance will all benefit from a better fiber/framework interface grip. Due to arbitrary crystallization caused by prolonged dormancy and following the straight surface of the fiber, the stiffness between the filament and most of the extreme networks is currently inadequate. Following that, effective supervision of the interfacial properties is expected to produce the finest composite representation (Lin et al., 2000). To improve the interfacial bonding of fiber-strong compounds, plasma treatment, chemical modification, and the employment of bonding agents are used together to generate a variety of fiber surface compatibilities (Lin et al., 1999). Joining various nanoparticles (Chen et al., 2012) is another effective method for changing the surface of Kevlar fiber. X-ray photoelectron spectroscopy (XPS), Fourier transform infrared spectroscopy (FTIR), atomic force microscopy (AFM), Brunauer-Emmett-Teller (BET) analysis, and water contact angle test show that Kevlar fiber has distinct properties under various changing conditions (Ai et al., 2007). Thermogravimetric Analysis (TGA) and Differential Scanning Calorimetry (DSC) procedures are used to evaluate the thermal properties of Kevlar fiber.
The underlying combinations are gradually becoming subject to the employment of composites in aviation, energy, and foundations across different locations. These structures are frequently depicted as a repository of many variables, such as swinging, shock loading, and temperature fluctuations (Sebastian et al., 2014). Low strain strength, viscosity, warm conductivity, and heat resistance make Kevlar fiber unsuitable for many applications where greater bearing limits are required to avoid deformation during their administration life, vehicle sections, and temperature application. Several solutions have been devised to suit the demands of various application situations, including polymer blends and the growth of nanoparticles or filaments in the framework to recognize functional support (Fu et al., 2015). Micro and nano-scale particles are frequently regarded as ideal components for reinforcing materials in order to develop combinations with improved properties and efficiency (Chinnasamy et al., 2020). In light of this advancement in the field of investigation, the current study aims to investigate the effect of coating nanoparticle content on the thermal behavior of Kevlar fiber with epoxy composites.
The above-mentioned literature, it can be concluded that few researches have been done to observed the all-thermal parameters of the fibers. In most of the cases, mechanical and physical properties are observed. Very few researches are conducted to analyze the fabric in comparison of composite materials but the composite property can be improved whenever the property of the fiber improvement is ensured.
Considering the literature and limitation, the goal of this research is to determine the thermal, morphological, and chemical properties of the material. The novelty of this study is to determine the relationships between enthalpy, activation energy, weight ratio, and binding energy of coated Kevlar fiber for thermal applications in industry. In our best knowledge, the literature addresses that Kevlar fiber is stable up to 545 °C. However, the thermal stability of coated fiber in this work is increased up to 620.56 °C. The composite applications where the thermal parameters are critical issue, this research paper will explore the new insight for further researches. Moreover, it is known that 50 to 55% composite materials are used in the aircraft manufacturing. The leading edge of the wind turbine and automotive vehicles are also constructed by composite materials. During sliding and erosion wear, the increase of temperature adversely affects the property of the composite. The consumption of material due to less thermal property will increase the cost and effects the economic growth and sustainability. This research can be used as a reliable source to mitigate the problems that have been encountered by the advanced industry.
2 Experimental section
For this study, the Kevlar-29 fiber was chosen. The fiber mat's surface was cleaned using acetone and distilled water. To remove the moisture from the fiber mat, it was heated. Epoxy, hardener, SiC, and TiO2 were used to make the coating solution. A pad mangle machine is used to dip-coat the items. The coated samples are baked for a particular amount of time to cure shown in Fig. 1.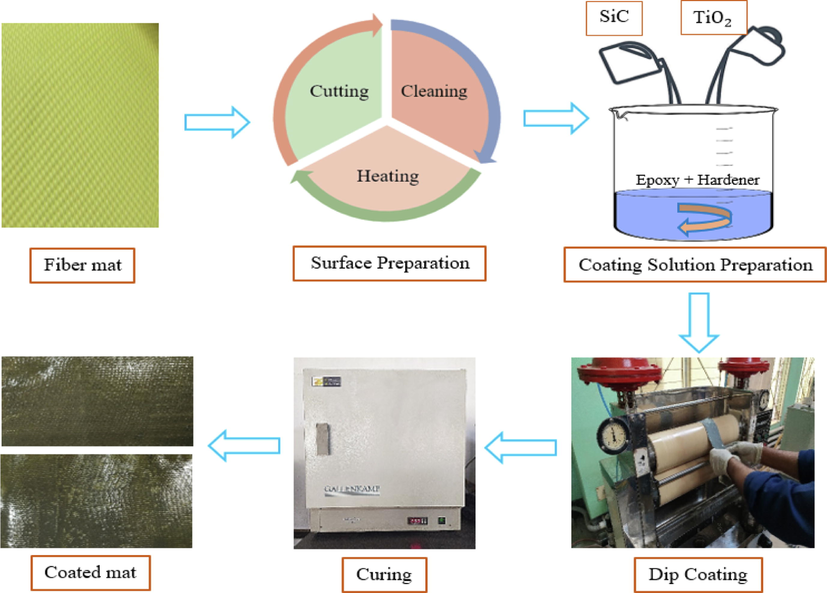
Experimental flowchart.
2.1 Materials
The following materials are used for the preparation of samples. Richest Group Limited, Chemicals, Shanghai, China provided Kevlar 29 (Aramid Fiber, Color: yellow, Break Strength: 22 g/D), Silicon Carbide nano-powder (Model No.: SiC-001, 99.9% Purity, Cubic form, Gray-green Powder, Bulk density: 0.11 gm/cc, particle size: 40 nm), and Titanium Dioxide nanopowder (Model No.: XF102-1, 99Epoxy (Bisphenol-A, Lapox AH-713 HS, Model No.: B-47, 99Epoxy (Bisphenol-A, Lapox AH-713 HS, Model No.: B-47, 99Epoxy (Bisphenol-A, Lapo Atul Ltd., Maharashtra, India, supplied the Viscosity (650 m Pas, Epoxy Value: 5.50 Eq/kg, Density: 1.17 g/cc, Specific Gravity: 1.10 mix mass) and Hardener (Mixing Ratio: 100:10 (w), Viscosity Density: 1.05 to 1.15 g/cc, Hardener Density: 0.90 to 0.96 g/cc, High-Performance Liquid Chromatography (HPLC) Water Aqua Dihydrogen Oxide (CAS No: 7732-18-5, Chemical Formula: H2O, HS Code: 2853 90 10) PT. Smart-Lab, Serpong, Tangerang, Indonesia (Molecular Weight: 18.02 g/mol, Batch No: 107703022001, Product Code: H-1077) imported the product. Acetone (Lot: 0059001, Chemical Formula: CH3.CO.CH3, Molecular weight: 58.08, CAS: 67-64-1, Code: A/0676/20) was imported from Fisher Scientific, UK.
2.2 Preparation of coating surface
Surface preparation is an important factor for coating. Improving the adhesion properties between two surfaces always relies on the material surface. The surface of the Kevlar fiber has been done in three steps. These are; a) cutting the fiber mat, b) cleaning the fiber mat, and c) heating the fiber mat. The samples were taken from a roll of Kevlar fiber mat at a dimension of 4 in. × 12 in.. Two solvents were used to complete the cleaning process. To clean the manufacturing coating on the surface of the fiber mat, first it was washed with acetone (CH3 CO CH3). The samples were dried in an open atmosphere for 10 min. There is a possibility of ionization after the cleaning with acetone. Finally, the surface of the fiber mat was washed with water and dihydrogen oxide (HPLC) to neutralize the ion. The neutralized samples were dried in an open atmosphere for a specific amount of time. Heating is the final step of the surface preparation. At the last stage of the cleaning process, the samples absorb some moisture content for the addition of water aqua dihydrogen oxide (HPLC). Heating is very essential to remove the moisture content of the samples. The water aqua dihydrogen oxide (HPLC) vaporization temperature is 100 °C. Evaporation has occurred after the addition of heat up to 100 °C, and at 100 °C it produces vapor. To remove this moisture from the fiber mat, it was dried out in an oven for 45 min at 110 °C.
2.3 Preparation of coating solution
Epoxy resin, hardener, silicon carbide nanoparticles, and titanium oxide nanoparticles (Fig. 2) were used to make the coating solution. The mixture was agitated for a given amount of time to get a homogenous solution (see Table 1).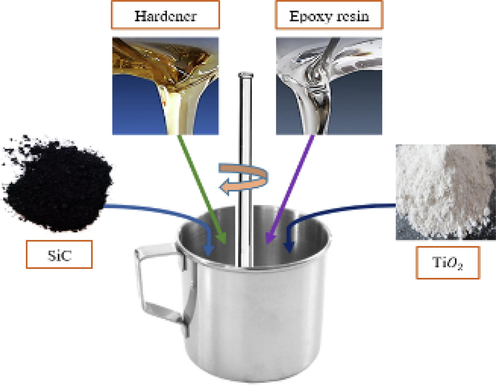
Preparation of coating solution.
Wt. % of nanoparticle
Nanoparticle
Epoxy (gm)
Hardener (gm)
Total (gm)
SiC(gm)
TiO2(gm)
0
S1
0
0
272.7
27.3
300
5
S2
7.50
7.50
259.1
25.9
300
10
S3
15.0
15.0
245.5
24.5
300
2.4 Preparation of coated samples
One of the most popular methods of developing a thin and uniform coating is the dip-coating method. It is also called saturation or impregnation. Although the deep coating is suitable for complex shapes and curved parts, this method is also used for flat and cylindrical surfaces.
In the dip-coating process (Fig. 3) Kevlar fiber mat is dipped into a coating solution bath. Here, step 1 represents the passing of the fiber mat towards the solution bath, and step 2 is the immersion of the mat into the solution so that it can absorb nanoparticles. The coating solution is adhesive. For this, the samples are allowed to stay for 5 min. In step 3, the immersed samples were then allowed to pass through a pad mangle machine to insert the nanoparticles into the fiber portion. The squeezed roller of the machine pressed the sample and straightened it. Curing is an important factor in the polymerization of a polymer matrix. The durability and strength of the composite materials partly depend on the curing method. The ratio of resin to binder affects the curing time. The conditions of the product life cycle, ambient weather, shape, and size of the product, and the specified strength play a crucial part in the curing period. In order to obtain the desired requirements for this work, two-step curing has been done. Firstly, the coated sample is cured in an open atmosphere for 20 min. After the completion of the first step of curing, the samples are placed in an oven. The samples are kept in the oven at 200 °C for two and a half hours, and the samples are also cooled in the oven.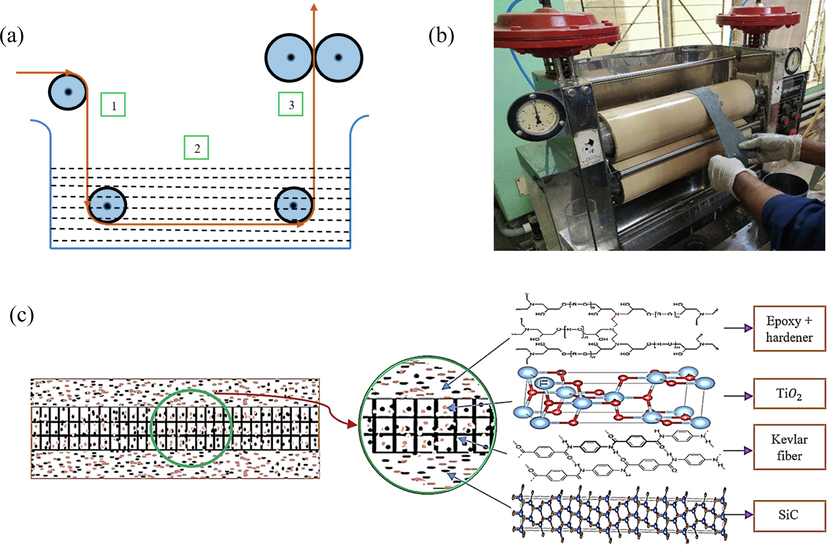
(a) Working flow chart of pad mangle machine (b) Pad mangle machine (c) Interfacial structure of the coated sample.
2.5 Characterization of coated samples
2.5.1 Thermal analysis
Thermogravimetric analysis (TGA) and Differential Scanning Calorimetry (DSC) are thermal analysis methods that include measuring the mass of a sample with time as the temperature varies. The analysis provides data on a variety of physical phenomena, including heat breakdown, absorption, desorption, phase transition, and enthalpy in the way of oxidation or reduction. To analyze the thermal properties of the coated sample, the SDT650 (Simultaneous TGA & DSC) setup was used (Model: SDT650, Serial No.: 0650-0180, Sample Interval: 0.1 s/pt, Gas 1: Nitrogen, Gas 2: Oxygen). Started at 10 °C/min to 1400 °C, pan type: Alumina 90 ul). In this work, a heating rate of 10 °C per minute was provided up to 1000 °C in a nitrogen environment. Trios software of TA Instruments was used to collect and analyze data (TA Instruments, Waters, LLC, USA).
2.5.2 Field Emission Scanning electron Microscope (FESEM) test
Field Emission Scanning Electron Microscope (FESEM) is used to examine topography, morphology (particle size and shape), imperfections, elemental composition, and crystallographic information. To analyse the morphology of the coated sample, a FESEM JSM-7610F instrument was used (Model number: JSM-7610F). Brand: JEOL, 1.0 nm (15 kV), 1.3 nm (1 kV), 3.0 nm (15 kV), Probe current: 5nA, Magnification: 25 X to 1,000,000 X, Accelerating Voltage: 0.1 kV to 30 kV, Eccentric, 5 axes motor control, Specimen stage: Eccentric, 5 axes motor control). In this work, the magnifications were varied from 25X to 50000X.
2.5.3 Fourier transform infrared Spectroscopy (FTIR) test
Fourier Transform Infrared Spectroscopy (FTIR) Analysis is basically used to detect the different functional groups that are present in a certain sample. It shows a lot of bonds that are present in the sample. In this work, to identify the organic–inorganic and polymer compounds of the coated sample, an IR-Prestige 21 instrument was used (IR-Prestige 21 (ATR mounted), Shimadzu Corporation, Japan, Wavenumber range: 400–4000 cm−1, Resolution: 4 cm−1, and an over-all scan of 30). The samples were analyzed with a wavenumber range of 400 cm−1 to 4000 cm−1.
2.5.4 X - ray Photoelectron Spectroscopy (XPS) test
X-ray Photoelectron Spectroscopy (XPS) is used to analysed the sample chemically. It is an analytical technique to identify the electronic structure of atoms and molecules in terms of binding energy. In this work, to identify the binding energy in molecular level a K-Alpha- KAN X-ray Photoelectron Spectrometer (XPS) System apparatus has been used (Sampling Area: 60 × 60 mm, Analyzer Type: 180° double-focusing, hemispherical analyzer with 128-channel detector, Depth Profiling: EX06 Ion Source, X-Ray Source Type: Monochromated, Micro-focused Al K-a, Sample thickness: 20 mm). In this work, 12 × 12 mm sampling area with a thickness of (40 ± 4) mm has been analysed.
2.5.5 Activation energy analysis
The activation energy indicates the energy required to move the reactants from the ground state to the transition state. Activation energy can be determined by various analyses, among this method the here Coats and Redfern method has been carried out with the help of thermo-gram. The following Coats and Redfern (Parimalagandhi and Vairam, 2014) equation was used to evaluate kinetic data from thermo-gravimetric curves.
Further modification of this equation,
3 Results and discussion
3.1 Thermal analysis
Thermogravimetric (TGA) analysis and Differential Scanning Calorimetry (DSC) analysis have been done for analyzing the thermal properties of the uncoated and coated Kevlar fiber samples.
3.1.1 Thermogravimetric (TGA) analysis
Fig. 4 shows the TGA, DSC, and derivative curve of uncoated Kevlar (S1) and coated Kevlar (S2 & S3). To compare the relation of heat flow of the sample, a derivative calculation has been analyzed. Moreover, the derivative TGA (DTg) curve clearly appeared the two step transitions compared with the uncoated Kevlar with epoxy and hardener. At glass transition temperature (Tg), the molecule movement is released (heating) or freezes (cooling). The derivative heat flow of the uncoated sample shows a glass transition temperature of 558.59 °C. The oxidation temperature (Tod) is the temperature at the maximum peak of that material on the derivative weight curve and can be used to determine the material's thermal stability. The oxidation temperature of the uncoated Kevlar is 52.38 °C, whereas the coated samples Tod is 52.43 °C and 53.03 °C respectively. The temperature at which a substance started to decompose chemically is known as its initial decomposition temperature (IDT). The coated sample starts to decompose initially at 348.95 °C and 345.94 °C respectively but the uncoated sample starts to decompose at 342.81 °C. For the uncoated sample DSC thermo-gram shows a peak temperature of 480.01 °C when the sample normalized enthalpy is 770.57 J/g. The normalized enthalpy of samples S2 & S3 are 2404.4 J/g and 3490 J/g with a peak temperatures of 493.69 °C and 605.15 °C i.e., the coated samples can receive more heat compared to the uncoated sample also higher value of enthalpy represents difficulty to breaking hydrogen bonds (Yuan et al., 2015). Due to the higher melting point of coating materials, coated samples receive more heat compared to uncoated sample. The derivative glass transition analysis of the samples exhibits a temperature of 586.59 °C and 612.08 °C which is increased 27.7 °C & 53.49 °C compared to the uncoated samples.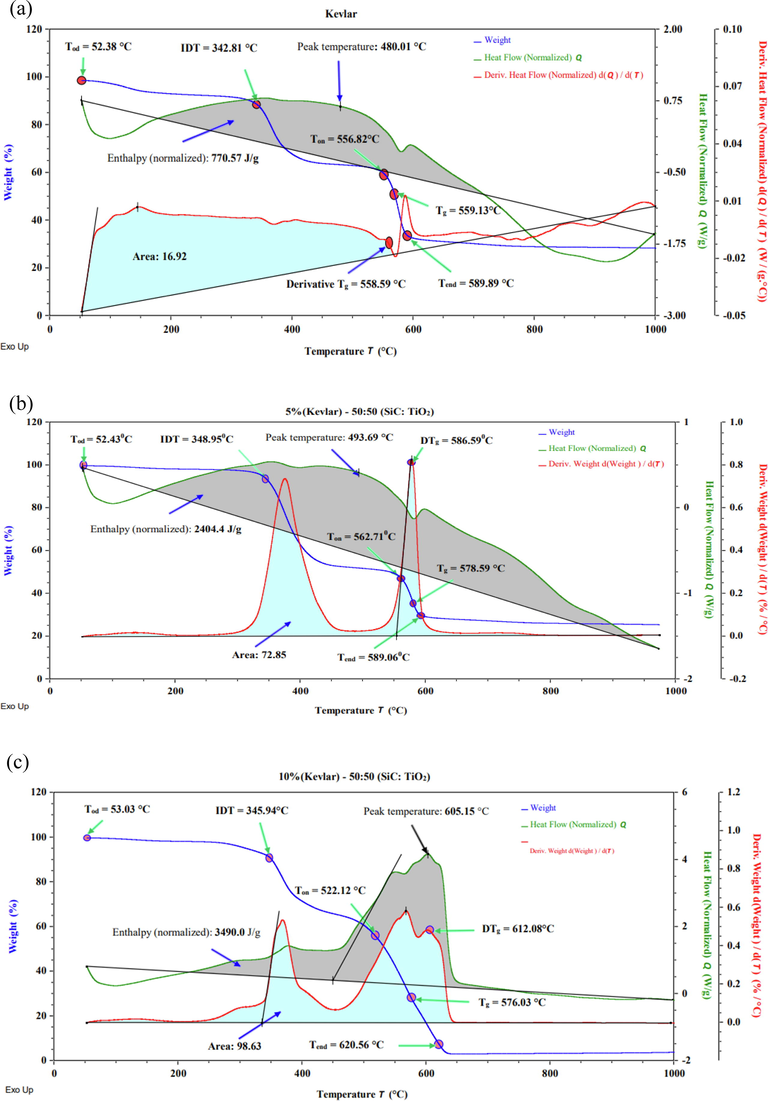
Simultaneous TGA, DSC and Derivative curve of (a) uncoated Kevlar with epoxy and hardener (S1), (b) coated Kevlar, Epoxy, and Hardener with 5% (1:1) nanoparticles (S2), and (c) coated Kevlar, Epoxy, and Hardener with 10% (1:1) nanoparticles (S3).
Sample S3 exhibits the maximum enthalpy and the peak temperature is based on the enthalpy shows for sample S1. Sample S3 shows a maximum end set temperature, derivative glass transition temperature, and covers the maximum % of the area under the derivative curve. For cured coatings, the Tg also is an indicator of flexibility or lack of it. Coatings with high Tg values may be brittle and prone to cracking or chipping. Those with low Tg values may be soft and easily marred and scratched and/or prone to dirt pick-up.
Fig. 5 represents the statistical analysis of the TGA and DSC graphs of samples S1, S2 & S3 with weight (%) and weight (mg). The 4.691 mg mass is considered as a residue equal to 98.52% weight of the S1. The uncoated sample (S1) losses 3.344 mg weight and a weight percentage of 70.23 i.e., the sample shows a residue of 29.77% mass of the uncoated sample at 1000 °C. Whereas the coated samples S2 and S3 at 1000 °C losses 74.24% and 95.94% weight loss respectively, that represents the coated samples are light weight. The results of mean, variance and standard deviation corresponding to different axis represents 2nd step transition rely very closely.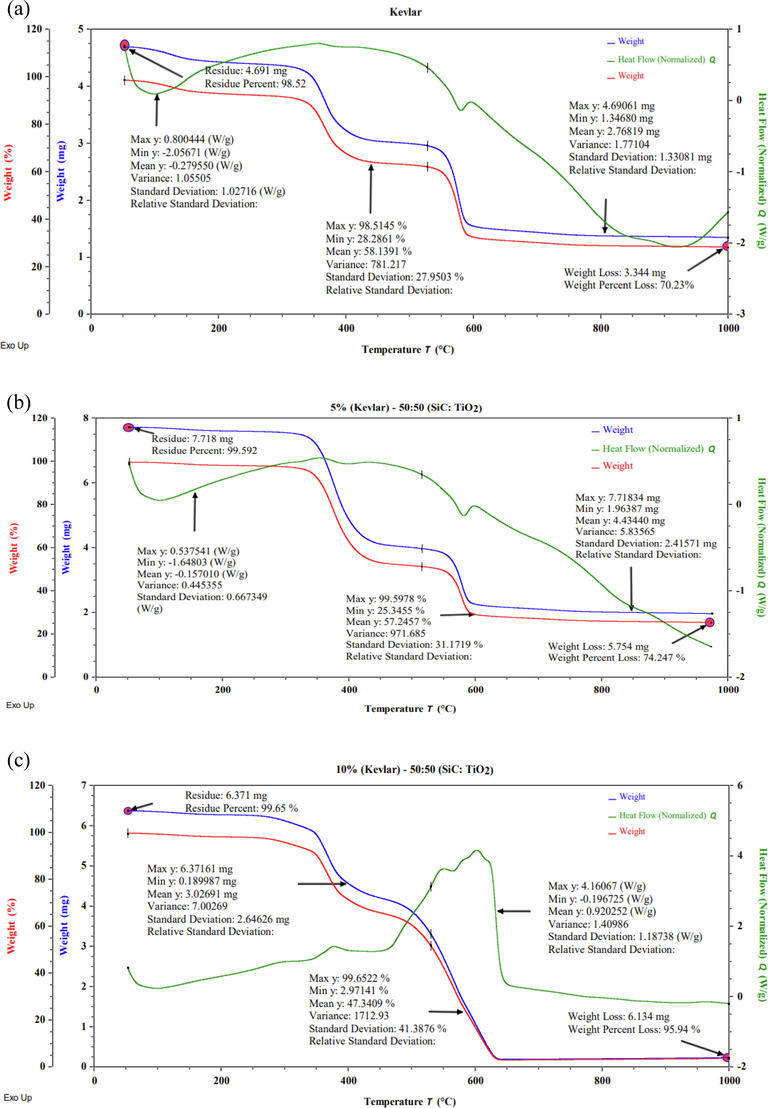
Statistical analysis of TGA and DSC curve of (a) sample (S1), (b) sample (S2), and (c) sample (S3).
The crucial matter of the determination of mean, variance, standard deviation, and relative standard deviation strongly depends on the weight of the sample, so that comparison cannot be drawn corresponding to mean because of different sample mass but comparison can be drawn by standard deviation, variance, and relative standard deviation. The higher value of standard deviation and variance represents the better dispersion of data (i.e., higher magnitude covers the maximum data under the bell shape curve). Relative standard deviation is the ratio of standard deviation and mean of the samples data. Coated samples represent the better statistical data compared to the uncoated samples based on the magnitude of relative standard deviation.
Fig. 6 represents the mass loss at various temperatures of uncoated and coated samples. At a temperature of 300 °C for uncoated samples 8.38 wt% that depicts the entire degradation, which was primarily owing to the composites' low boiling additive and moisture content loss. These types of proof were observed by Jawaid et al. (2018). At 500 °C the sample S2 shows higher mass loss and sample S1 shows a lower mass loss, at 700 °C & 900 °C the sample S3 shows higher mass loss and sample S1 shows a lower mass loss, and at 1000 °C the sample S3 shows a higher mass loss, i.e., lower residual mass. Sathishkumar et al. (2021) mentioned less material degradation for lower activation energy.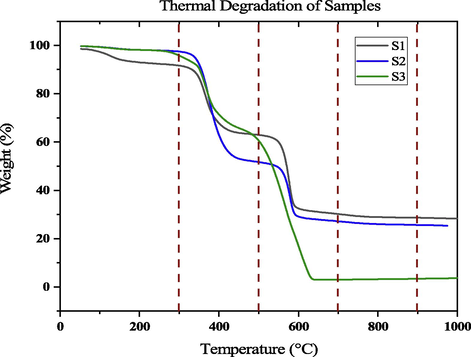
Mass loss at various temperature.
3.1.2 DSC analysis
DSC is well renowned for its ability to expose the thermal characteristics of solid materials, specifically polymers and plastics (Lakatos et al., 2022). Fig. 7 shows the DSC comparison of all samples. In DSC thermo-gram the 1st step transition shows a lower amount of peak compared to the 2nd step transition. Here also shown a magnification from 400 °C to 700 °C for 2nd step transition. In the DSC curve, sample S3 represents a higher heat flow of 4.169 W/g compared to all samples, whereas the uncoated samples heat flow −0.06 W/g and the maximum heat flow withstood up to 605 °C for samples S3. Sample S1 and S2 exhibits exothermic peaks, but sample S3 show an endothermic peak. The endothermic peak indicates the higher activation energy. All the sample provides heat to the system whereas the sample S3 takes heat from the system i.e., the sample S3 indicates it can be used at high temperature compared to the other samples.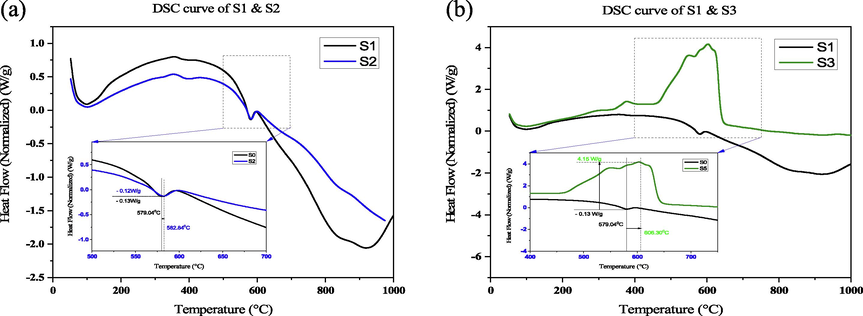
(a) DSC Comparison of S2 with respect to sample (S1), (b) DSC Comparison of S3 with respect to sample (S1).
3.2 FTIR analysis
Fig. 8 (a), (b), and (c) shows the FTIR analysis of all samples. In FTIR analysis, the uncoated sample represents the wavelength of 889, 1244, 1510, and 2928 cm−1, a lower change of wavelength due to the presence of nanoparticles in coated samples but appeared same functional group which represents there is no unreacted bond of the polymer (Guo et al., 2018). The analysis of Fig. 8, exhibits a range of functional group of strong alkanes (C—H, stretching vibration) range 2850–2970 cm−1 (Noobut and Koenig, 1999; Ngono et al., 1999) due to the presence of epoxies, medium aromatic (C—H, benzene) range 675–995 cm−1 (Ngono et al., 1999), strong alcohols, ethers and carboxylic acid (Symmetric stretching, C—O) range 1050–1300 cm−1 (Chike et al., 1993), and aromatic ring (C⚌C, aromatic nucleus) range 1500–1600 cm−1 (Yang et al., 2015) by ignoring the lower peak. Fig. 8 (d) represent the comparison of FTIR analysis to show the variation of the peak, strong alkanes and aromatic ring absorbance peaks appear broadly in cases of coating samples because the coating materials absorbs the infrared ray. In FTIR figures it has been clearly observed that when the sample is uncoated the peak length are small whereas coating is considered broader peak length is observed. The frequency absorbent level is high in case of coated materials as compared to uncoated material. The higher the frequency absorbent level, the higher the quality of the materials is confirmed; however, the quality of the material depends on the type of coated material and percentage of nanoparticle inclusion.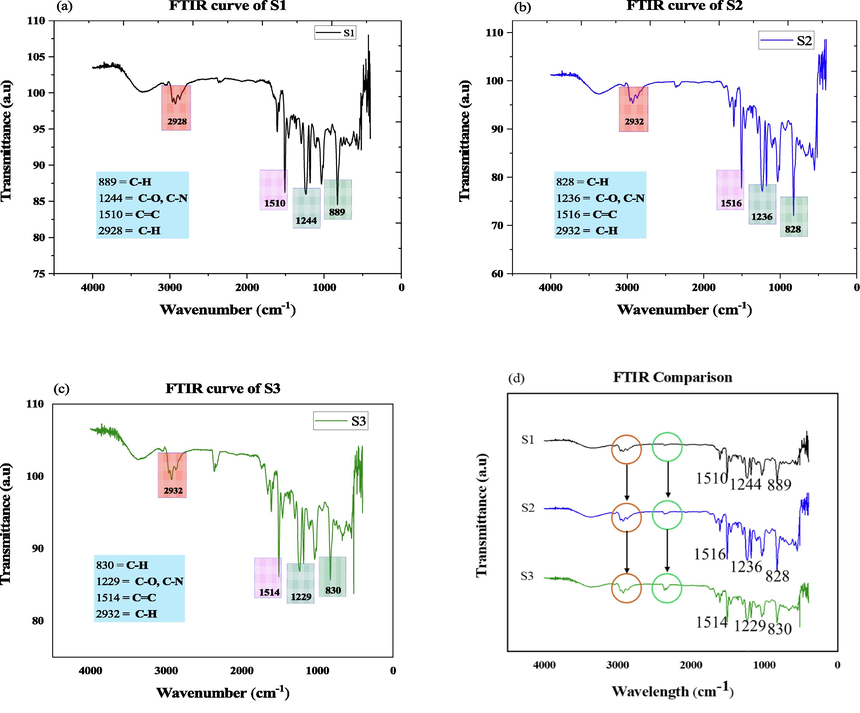
(a) FTIR analysis of S1, (b) FTIR analysis of S2, (c) FTIR analysis of S3, (d) FTIR comparison of all sample.
3.3 FESEM analysis
Morphology of the sample S1-S3 with different scales (100
, 10
, 1
, and100nm) and magnifications (25X to 3000X) as shown in Fig. 9. 10% nanoparticles exhibit a better nanoparticles distribution compared to 5% nanoparticles. In morphology analysis here the shape, texture, and distribution of materials have been analyzed. It is clear that the nanoparticles show the inhomogeneity’s for the particle distribution. Among these, sample S5 shows a better homogeneity of the particles. Homogeneity of the particle distribution represents better surface morphology (Alyami et al., 2017; Zhao et al., 2021). The titanium oxide nanoparticles appeared less compared to the silicon carbide nanoparticles.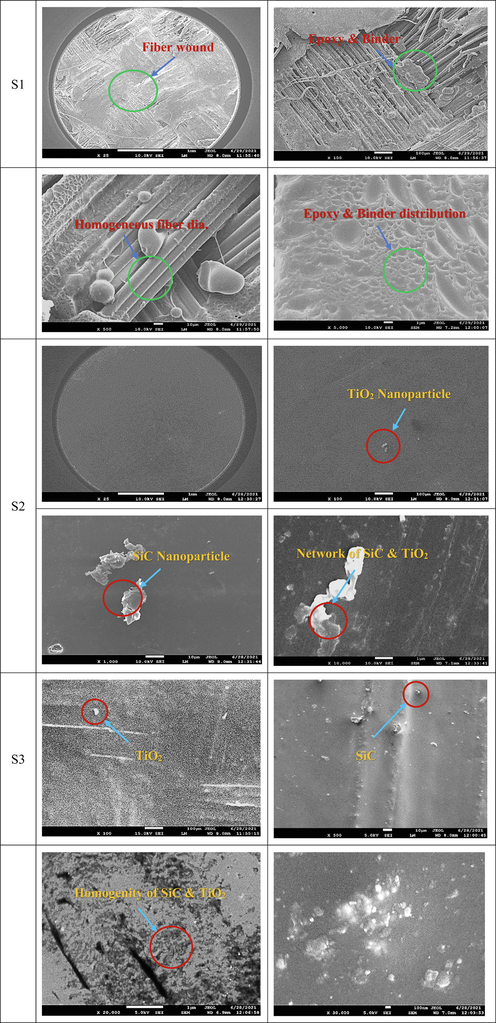
Morphology of samples.
3.4 X-ray Photoelectron Spectroscopy (XPS)
XPS is a powerful measurement approach because it not only indicates what elements are present but also what other factors they may be bound to i.e., chemical state, density, electronic shape, and state (Rahmayeni et al. 2019). Fig. 10, and Table 2 shows the X-ray Photoelectron Spectroscopy survey of binding energy before and after etching of samples S1, S2, and S3. Without etching, the specific structural properties cannot be identifying in the polish state. To assess the quantitative and qualitative elemental composition of coating etching has done. After etching XPS analysis of the uncoated sample shows Si 2p (102.73ev), S 2p (169.15ev), C 1s (285.31ev), N 1s (399.76ev), O 1s (532.78ev), and Na 1s (1072.09ev). In cases of sample S2; C 1s (285.12ev), N 1s (399.87ev), O 1s (533.01ev), Na 1s (1072.52ev) appeared after etching but 0.56% Si 2p appeared before etching. Sample S3 shows Si 2p (102.78ev), Cl 2p (199.4ev), C 1s (285.16ev), N 1s (399.93ev), O 1s (532.92ev), and Na 1s (1072.28ev) after etching. The carbon leads the maximum percent of element because the Kevlar fiber contains carbon a lot. Here Sulphur represents the impurity of the coated sample. From the C 1s spectrum shows the 298.0 to 280.45 eV after etching which assigned the presence of alkanes (C—H), medium aromatic (C—H), and aromatic ring (C⚌C), also O 1s spectrum ranges are 542.08–526.29 eV ensured the presence of strong alcohols, ethers and carboxylic acid (C—O) group respectively (Li et al., 2017). These results are consistent with the FTIR analysis shown in earlier (Fig. 8). The elemental analysis may vary in different methods. In XPS analysis only the upper portion of the coating are investigated, whereas the EDS analysis can represent a better elemental analysis due to higher penetration of electron (Mashtalyar et al., 2022).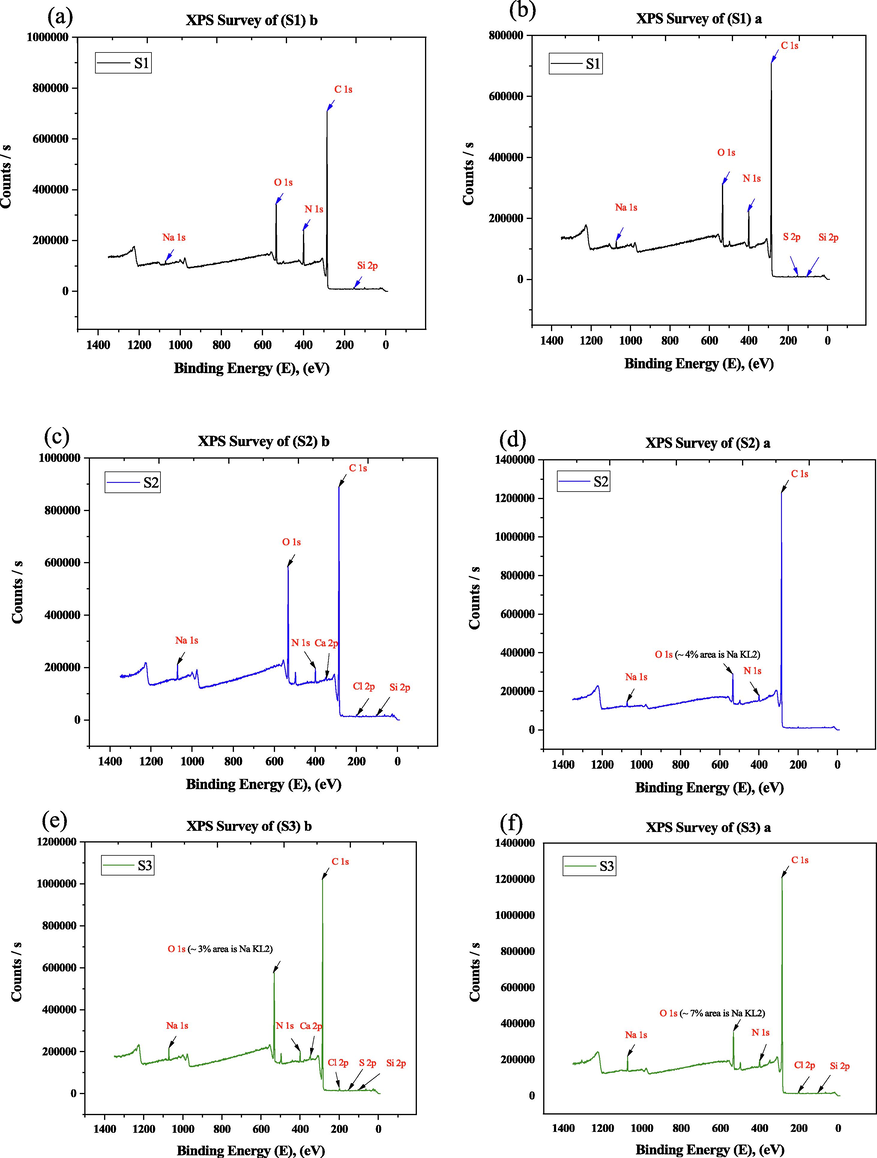
XPS survey of before and after etching (a) S1 (b) S2, and (c) S3.
Samples
Si 2p (eV)
S 2p (eV)
C 1s (eV)
N 1s (eV)
O 1s (eV)
Na 1s (eV)
S1
Before etching
110.0–95.0
–
293.07–285.50
406.69–394.09
541.68–526.24
1078.21–1066.41
After etching
110.0–96.83
175.0–163.28
298.0–280.71
406.99–392.39
542.08–526.29
1078.46–1065.66
S2
Before etching
108.27–96.07
–
295.75–280.35
406.02–393.62
541.88–526.04
1078.4–1064.0
After etching
–
–
298.0–281.10
410.0–393.92
540.28–528.33
1079.0–1063.68
S3
Before etching
110.0–97.13
175.0–157.0
295.31–280.51
405.89–393.89
539.28–528.75
1076.99–1065.79
After etching
108.68–96.48
–
298.0–280.45
407.49–392.29
540.28–528.42
1079.0–1064.57
Fig. 11 shows the peak analysis of all samples before and after etching. Before etching uncoated sample gives five visible peaks but after etching gives six peaks, for coated sample (S2) seven and four visible peaks. Here carbon and oxygen elements show the organic O-C⚌O, C—O, C—C, C—H, and C—O-H compounds. The sodium element shows a higher binding energy because it can emit the last electron which is very close from the nucleus (Chiara et al., 2018). Less oxidation after the etching affects the C constituent a lot. The elemental composition of the carbon constituent increases whereas the oxygen constituent decreases (Table 3). It seems clear, the peak fitting attributes visible peak after the etching condition for sample S3 (see Table 4).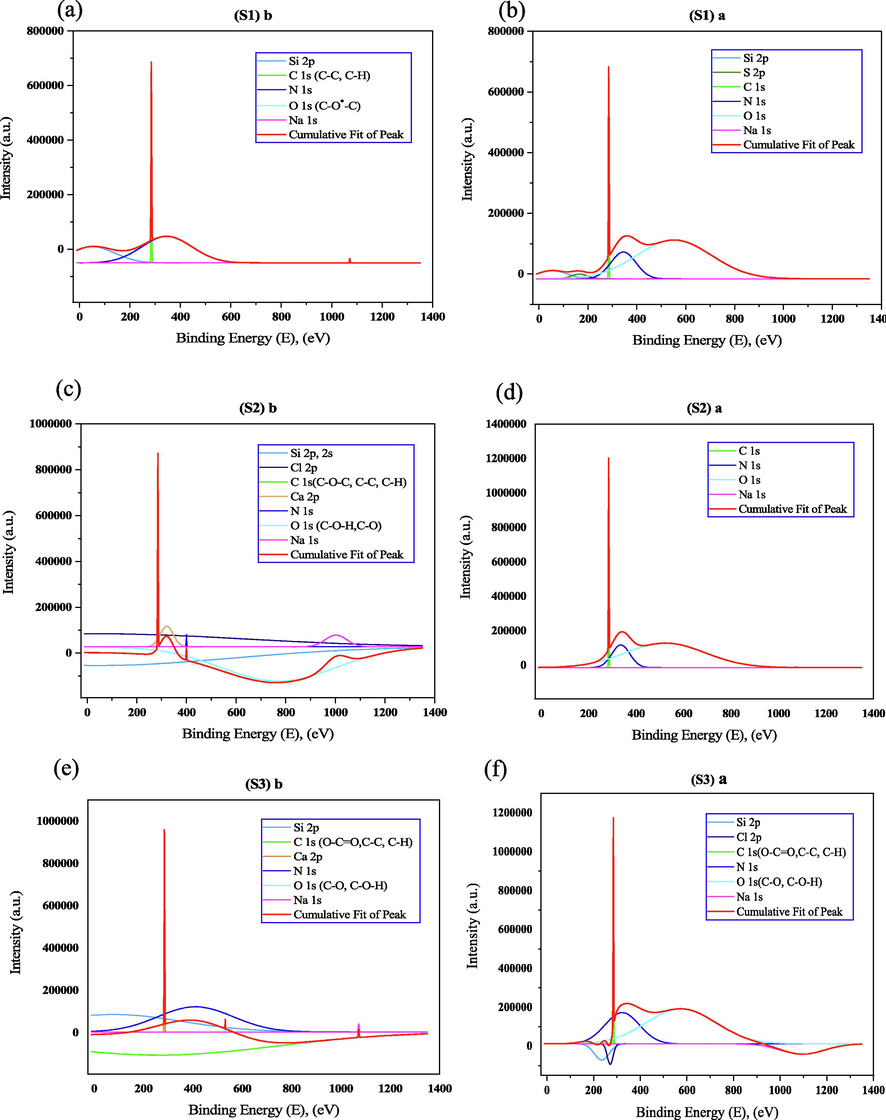
XPS peak of (a) S1 before etching, (b) S1 after etching, (c) S2 before etching, (d) S2 after etching (e) S3 before etching, and (f) S3 after etching.
Samples
Si 2p (%)
S 2p (%)
C 1s (%)
N 1s (%)
O 1s (%)
Na 1s (%)
Other (%)
S1
Before etching
0.78
–
77.72
9.41
11.78
0.29
0.02
After etching
0.70
0.11
79.32
9.02
10.26
0.49
0.10
S2
Before etching
0.56
–
77.05
3.00
17.67
0.90
0.82
After etching
–
–
91.41
2.30
5.75
0.53
0.01
S3
Before etching
0.57
0.25
79.92
2.83
14.61
0.92
0.90
After etching
0.52
–
87.17
2.63
7.99
1.26
0.43
Sample
Gas Constant R (J/mol. K)
Temperature T (K)
Slope
Activation Energy (KJ/mole)
S1
8.3144
466.35
−0.57772
11.06
S2
8.3144
469.00
−0.57772
11.06
S3
8.3144
483.25
−0.57820
11.08
3.5 Activation energy
From equation (2), Activation energy of S0,
Fig. 12 shows the relationship of
and
to determine the slope and Table 2 represents the activation energy of all samples. The slope of the linear fitting multiplied with the universal gas constant provides the activation energy of composites. The coefficient of correlation (R2) for all fitting curves ranges from 0.96356 to 0.96386, indicating high dependability. The lower activation energy of the samples indicates a shorter diffusion barrier, better water absorption and less material degradation for the composite (Sathishkumar et al., 2021; Carra and Carvelli, 2015). The results of the activation energy completely satisfy the statistical analysis of the samples. In this works, sample S3 represents a higher mass loss i.e., higher degradation of materials with higher activation energy.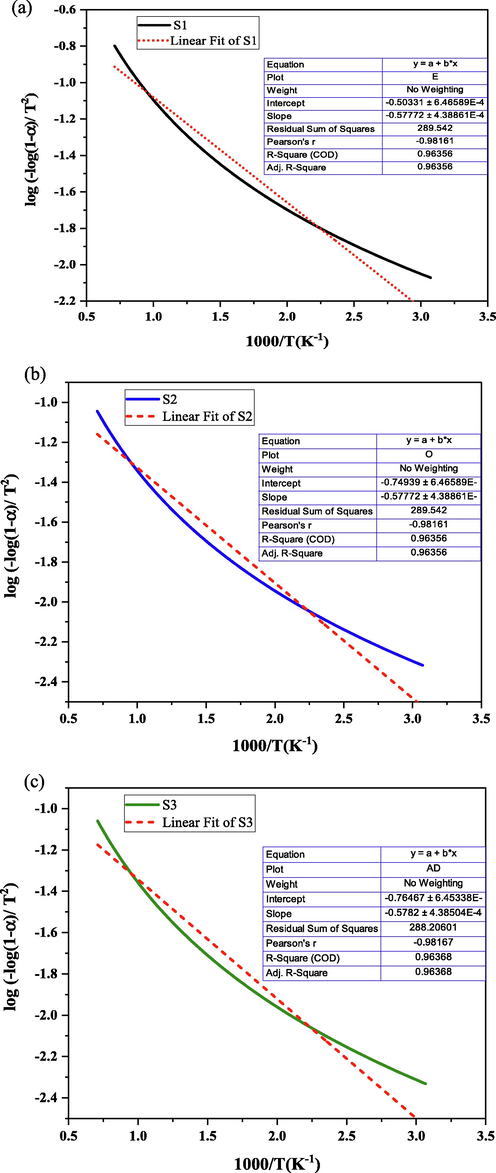
Slope calculation of (a) S1, (b) S2, and (c) S3.
3.6 Comparison of present and previous studies
The comparison showed that the glass transition temperature of the coated samples shifted maximum from 559.13 °C to 580.51 °C, whereas the previous study showed a glass transition temperature of 560.27 °C. In the case of the end set temperature, the coated samples increased by 30.67 °C compared to the uncoated sample, whereas the previous study showed an end set temperature of 590 °C. The derivative Tg shifted from 558.89 °C to 612.08 °C, while the previous study showed the derivative Tg at 599.5 °C. The range of binding energy increased from 450 eV to 970 eV compared with the previous study as shown in Table 5.
Property
Sample
Present Study
Previous Study
Glass transition Temperature
S1
559.13 °C
560 °C (Brown and Ennis, 1977)
S2
578.59 °C
S3
576.03 °C
End Set Temperature
S1
589.89 °C
590 °C (Brown and Ennis, 1977)
S2
589.06 °C
S3
620.56 °C
Derivative Tg
S1
558.89 °C
599.5 °C (Zhao et al., 2014)
S2
586.59 °C
S3
612.08 °C
FTIR
S1-S3
Presence of alkanes (C—H), medium aromatic (C—H), strong alcohols, ethers and carboxylic acid (C—O) range and aromatic ring (C⚌C) range.
(C—H) of alkane and medium aromatic ring, C⚌O stretching band of strong alcohols and aromatic ring (C⚌C) (Almaroof et al., 2019).
XPS
S1-S3
The range of binding energy between 95 eV and 1065 eV.
The range of binding energy between 100 eV and 550 eV for grafting (Ou et al., 2010).
4 Conclusions
The goal of this research was to characterize and investigate the thermal characteristics of Kevlar fiber for high-temperature applications. Thermogravimetric analysis (TGA), differential scanning calorimetry (DSC) analysis, and X-ray Photoelectron Spectroscopy (XPS) analysis were employed to determine various thermal properties. FESEM analysis is used to assess the surface morphology of samples, whereas FTIR analysis is used to reveal the active chemical groups. The thermal characteristics for high-temperature applications have been thoroughly detailed here. In conclusion, the following findings may be drawn from this research:
-
1st and 2nd step transition shown approximately 55% and (30 ± 3) % mass loss for all coated samples but uncoated sample shown 30% and 36% mass loss respectively. Oxidation temperature, initial decomposition temperature, and onset temperature of the samples appeared (52.70 ± 0.30)°C, (346.5 ± 4)°C, and (560 ± 4)°C respectively.
-
Coated sample S3 represents the highest glass transition temperature, end set temperature, enthalpy, higher mass loss (i.e., lightweight materials with higher enthalpy), and maximum activation energy.
-
In XPS analysis, the range of binding energy between 95 eV and 1065 eV. The atomic percentage of uncoated Kevlar fiber represents C-79.42%, O-10.26%, N- 9.02%, Si- 0.7%, S- 0.11%, and Na – 0.49%, but coated Kevlar fiber represents C- (87.17–91.41) %, O- (5.77–7.99) %, N- (2.3–2.63) %, and Si- 0.52 %, Na - (0.53–1.26) %.
-
Sample S3 exhibits a maximum activation energy of 11.08 KJ/mole, but the uncoated sample shown the activation energy of 11.06 KJ/mole. The lower activation energy of the samples indicates a shorter diffusion barrier, better water absorption and less material degradation for the composite.
The chemical reaction for coated samples grows slower due to enhanced thermal enthalpy, thermal stability, lower positive binding energy, and higher activation energy, which is highly significant for high thermal applications. These characteristics can be used instead of VM12 alloy 617, fiberglass for insulation, and titanium super alloy for temperature control.
Acknowledgment
The authors express special thanks to Department of Mechanical Engineering, Dhaka University of Engineering & Technology, Gazipur- 1707, Bangladesh for providing the lab facilities during this study.
Funding: This research did not receive any specific grant from funding agencies in the public, commercial, or not-for-profit sectors.
Data availability
The corresponding author will provide the experimental data in the case of a reasonable request.
Declaration of Competing Interest
The authors declare that they have no known competing financial interests or personal relationships that could have appeared to influence the work reported in this paper.
References
- Effect of grafting alkoxysilane on the surface properties of Kevlar fiber. Polym. Compos.. 2007;28(3):412-416.
- [CrossRef] [Google Scholar]
- Semi-interpenetrating network composites reinforced with Kevlar fibers for dental post fabrication. Dent Mater J. 2019;38(4):511-521.
- [CrossRef] [Google Scholar]
- An investigation into the effects of excipient particle size, blending techniques and processing parameters on the homogeneity and content uniformity of a blend containing low-dose model drug. PLoS ONE. 2017;12(6):e0178772.
- [Google Scholar]
- Long-term bending performance and service life prediction of pultruded Glass Fibre Reinforced Polymer composites. Compos. Struct.. 2015;127:308-315.
- [Google Scholar]
- Morphology and Structure of Kevlar Fibers: A Review. Polymer-Plastics Technol. Eng.. 1987;26(3–4):229-270.
- [CrossRef] [Google Scholar]
- Surface modification of Kevlar by grafting carbon nanotubes. J. Appl. Polym. Sci.. 2012;123(4):1983-1990.
- [CrossRef] [Google Scholar]
- Isomer depletion as experimental evidence of nuclear excitation by electron capture. Nature. 2018;554(7691):216-218.
- [Google Scholar]
- Raman and near-infrared studies of an epoxy resin. Appl. Spectrosc.. 1993;47(10):1631-1635.
- [Google Scholar]
- Characterization on thermal properties of glass fiber and kevlar fiber with modified epoxy hybrid composites. J. Mater. Res. Technol.. 2020;9(3):3158-3167.
- [CrossRef] [Google Scholar]
- Combined effect of interfacial strength and fiber orientation on mechanical performance of short Kevlar fiber reinforced olefin block copolymer. Compos. Sci. Technol.. 2015;108:23-31.
- [CrossRef] [Google Scholar]
- Durability of fiber reinforced polymer (FRP) in simulated seawater sea sand concrete (SWSSC) environment. Corros. Sci.. 2018;141:1-13.
- [Google Scholar]
- Jawaid, M., Thariq, M., Saba, N., 2018. Structural health monitoring of biocomposites, fibre-reinforced composites and hybrid composites.
- Multiscale thermal investigations of graphite doped polystyrene thermal insulation. Polymers. 2022;14(8):1606.
- [Google Scholar]
- Facilitation of the visible light-induced Fenton-like excitation of H2O2 via heterojunction of g-C3N4/NH2-Iron terephthalate metal-organic framework for MB degradation. Appl. Catal. B. 2017;202:653-663.
- [Google Scholar]
- Improvement of the adhesion of Kevlar fiber to bismaleimide resin by surface chemical modification. J. Adhes. Sci. Technol.. 1999;13(5):545-560.
- [CrossRef] [Google Scholar]
- The effect of chemical treatment on reinforcement/matrix interaction in Kevlar-fiber/bismaleimide composites. Compos. Sci. Technol.. 2000;60(9):1873-1878.
- [Google Scholar]
- Influence of ZrO2/SiO2 nanomaterial incorporation on the properties of PEO layers on Mg-Mn-Ce alloy. J. Magnesium Alloys. 2022;10(2):513-526.
- [Google Scholar]
- Epoxy− Amine Reticulates Observed by Infrared Spectrometry. I: Hydration Process and Interaction Configurations of Embedded H2O Molecules. J. Phys. Chem. B. 1999;103(24):4979-4985.
- [Google Scholar]
- Interfacial behavior of epoxy/E-glass fiber composites under wet-dry cycles by fourier transform infrared microspectroscopy. Polym. Compos.. 1999;20(1):38-47.
- [Google Scholar]
- Reinforcing effects of Kevlar fiber on the mechanical properties of wood-flour/high-density-polyethylene composites. Compos. A Appl. Sci. Manuf.. 2010;41(9):1272-1278.
- [CrossRef] [Google Scholar]
- Kinetics and thermal decomposition of Tetrahydrazine lanthanum 2-hydroxy-1- naphthoate. Orient. J. Chem.. 2014;30(4):1957-1963.
- [CrossRef] [Google Scholar]
- Green synthesis and Characterization of ZnO-CoFe2O4 Semiconductor Photocatalysts Prepared Using Rambutan (Nephelium lappaceum L.) Peel Extract. Mater. Res... 2019;22(5)
- [CrossRef] [Google Scholar]
- Kevlar-The Super Tough Fiber. International Journal of Textile. Science. 2013;1(6):78-83.
- [CrossRef] [Google Scholar]
- Mechanical strength retention and service life of Kevlar fiber woven mat reinforced epoxy laminated composites for structural applications. Polym. Compos.. 2021;42(4):1855-1866.
- [Google Scholar]
- Health monitoring of structural composites with embedded carbon nanotube coated glass fiber sensors. Carbon. 2014;66:191-200.
- [CrossRef] [Google Scholar]
- The effect of oxygen-plasma treatment on Kevlar fibers and the properties of Kevlar fibers/bismaleimide composites. Appl. Surf. Sci.. 2011;257(8):3158-3167.
- [CrossRef] [Google Scholar]
- Thermal aging of an anhydride-cured epoxy resin. Polym. Degrad. Stab.. 2015;118:111-119.
- [Google Scholar]
- Hydrogen bond breaking of TPU upon heating: understanding from the viewpoints of molecular movements and enthalpy. RSC Adv.. 2015;5(39):31153-31165.
- [Google Scholar]
- Nitrile butadiene rubber-based heat-shielding insulations for solid rocket motors. High Perform. Polym.. 2014;27(2):153-160.
- [CrossRef] [Google Scholar]
- Quantitative homogeneity assessment of particle reinforced magnesium-lithium composite ingot by homogeneity factors. Compos. A Appl. Sci. Manuf.. 2021;142:106268.
- [Google Scholar]


