

Translate this page into:
Enhancing sorption capacity of methylene blue dye using solid waste of lemongrass biosorbent by modification method
⁎Corresponding author. rzein@sci.unand.ac.id (Rahmiana Zein)
-
Received: ,
Accepted: ,
This article was originally published by Elsevier and was migrated to Scientific Scholar after the change of Publisher.
Peer review under responsibility of King Saud University.
Abstract
Modification of lemongrass leaves biowaste (LLB) with citric acid to remove methylene blue (MB) from aqueous solutions. A maximum adsorption capacity of 121.1211 mg g−1 was achieved. Overall adsorption process of MB was best fit to the Langmuir and pseudo-second-order models. The process was spontaneous, exothermic, and less of disorderness.
Abstract
Textile dye waste, such as methylene blue, has become an ecological and environmental problem. Lemongrass leaves bio-waste (LLB) has emerged as a promising alternative adsorbent for wastewater treatment. This study concerns the modification of LLB by citric acid through an esterification reaction (called as CA-LLB) to increase its adsorption capacity to remove methylene blue dye. The optimum condition for adsorption of methylene blue by LLB was achieved at pH 9, concentration 600 mg/L, contact time 45 min, and biosorbent temperature 25 °C. Whereas for CA-LLB, the optimum adsorption conditions were achieved at pH 10, concentration 1400 mg/L, contact time 75 min, and biosorbent temperature 75 °C. The methylene blue adsorption process followed the Langmuir isotherm model for LLB and CA-LLB (R2 > 0.99), which indicated the formation of a monolayer. The adsorption kinetics data for both biosorbents followed a pseudo-second-order model. Adsorption thermodynamic studies showed that the adsorption of methylene blue was spontaneous and exothermic. Boehm's titration analysis showed an increase in the hydroxyl, carboxyl, and lactone functional groups of LLB after being modified with citric acid. FTIR and SEM-EDX analysis indicated electrostatic interactions, cation exchange, and the occurrence of pore filling by methylene blue molecules. TGA analysis indicated that LLB and CA-LLB were heat stable and decomposed in three cycles. LLB and CA-LLB have good reusability using 30 % acetic acid as a desorption agent. The optimum adsorption conditions were applied to Laboratorywastewater with methylene blue removal efficiency at 95.79 % while using CA-LLB. Biosorbent modification using citric acid was proven to increase the adsorption capacity of MB from 43.1556 mg g−1 to 122.1211 mg g−1. Thus, LLB and CA-LLB have the potential to be applicative and environmentally friendly biosorbents to remove methylene blue dye in wastewater.
Keywords
Adsorption
Citric acid
Lemongrass leaves biowaste
Methylene blue
Modification

1 Introduction
Advancements in industrial technology to provide human needs can also generate environmental issues, one of which is water pollution. The textile industry is an industry that is currently developing and has the potential to cause water pollution caused by the excessive use of textile dyes. About 700.000 tons of synthetic dyes are extensively produced and there are more than 100.000 types of dyes on the market used in the textile industry (Değermenci et al., 2019). Most textile dyes are synthetic dyes considered toxic to aquatic life, stable to light, and difficult to degrade, resulting in water pollution (Patawat et al., 2020). In addition, water pollution caused by these dyes reduces light penetration into rivers. It affects the photosynthetic activity of aquatic plants, reducing the availability of oxygen and nutrients for aquatic organisms (Lebron et al., 2019).
Methylene blue (MB) is a cationic dye from the azo group commonly used to color cotton, wool, fabric, and silk. Humans are adversely affected by MB dye in various ways, including accelerated heart rate, vomiting, cyanosis, jaundice, quadriplegia, and tissue necrosis. Synthetic dye disposal without prior treatment results in high chemical oxygen demand (COD) concentrations and increased toxicity in water systems (Mohammed et al., 2014). Therefore, an effort is needed to remove MB dye from wastewater to maintain aquatic ecosystems and ensure the availability of clean water for humans (Patawat et al., 2020).
Several methods have been used to remove textile dyes from wastewater, including membrane filtration (Djenouhat et al., 2018), flocculation (Xia et al., 2018), catalytic oxidation–reduction (Putri et al., 2020b), photocatalytic degradation (Subaihi and Naglah, 2022) and ion exchange (Yousef et al., 2016). This method can remove dye pollutants but requires complicated equipment and is expensive. One alternative method that has the potential to remove methylene blue pollutants in wastewater is biosorption. Biosorption is a wastewater treatment method that uses non-living cell biomass as an adsorbent. This method does not require high costs, and the process is not complicated (Fauzia et al., 2021). One of the advantages of the biosorption method is that the biosorbent used was obtained from nature, such as agricultural waste or fishery waste (biowaste), so it is expected to overcome environmental pollution due to solid waste (Zein et al., 2020). The waste still contains several functional groups such as carbonyl, carboxyl, and hydroxyl, which are the active sites to remove harmful pollutants.
Lemongrass (Cymbopogon nardus) is a plant frequently utilized to produce essential oils and their derivatives. The widespread use of lemongrass plants will result in uneconomical biowastes. As a result, lemongrass leave biowaste (LLB) accumulates, compromising environmental aesthetics. LLB can be utilized as a biosorbent since it still contains functional groups such as carbonyl, carboxyl, and hydroxyl that can adsorb hazardous pollutants such as MB (M. Wifek et al., 2016; Zein et al., 2022).
A preliminary study has been carried out on the adsorption of methylene blue using unmodified LLB, where the adsorption capacity was achieved at 43.1556 mg/g (Zein et al., 2022). However, the adsorption capacity of LLB needs to be increased so that the biosorbent needs to be modified. The biosorbent was modified to increase the active site in the form of a functional group for adsorption by adding a modifier (Kavci et al., 2021). One of the modifiers that have the potential to be used in this research is citric acid. In addition to readily available raw materials, the citric acid-modified biomass process does not produce hazardous waste. Modifying LLB with citric acid (CA-LLB) can activate hydroxyl groups from cellulose and carboxylic groups in citric acid through esterification reactions (Hoang et al., 2021). Relevant studies reported that brown algae modified with citric acid produced a high adsorption capacity of crystal violet dye of 279 mg g−1 (Hoang et al., 2021). In addition, Fathy et al. found an increase in the maximum adsorption capacity of rice straw from 32.6 to 135.1 mg g−1 after being modified with citric acid (Fathy et al., 2013).
Based on the explanation above, this research was conducted to study the adsorption performance of MB dye in CA-LLB by considering several optimum parameters such as pH, initial MB concentration, contact time, and adsorbent heating temperature. The isotherm, kinetics, adsorption thermodynamics and physicochemical characterization were studied to determine the adsorption mechanism of MB on CA-LLB. Then, CA-LLB reusability was examined to determine the adsorbent resistance during the adsorption cycle.
2 Material and methods
2.1 Materials
LLB was collected from the lemongrass oil distillation industry in Padang City, Indonesia. Methylene blue dye (96 %, Merck), aquadest, HNO3 pa (65 %, Merck), NaOH (99.8 %, Merck), buffer solutions, KCl (99.9 % Merck), HCl p.a (Merck), Citric acid (C6H8O7) (Merck), Sodium dihydrogen phosphate (NaH2PO4) (Merck), Acetic acid (CH3COOH) (Merck), Sodium carbonate (Na2CO3), Sodium bicarbonate (NaHCO3), Potassium chloride (KCl), methyl orange indicator and filter paper.
2.2 CA-LLB preparation
LLB was dried before being cut and separated from the stems. LLB was then crushed in a grinder and sieved to a particle size of 36 µm, resulting in a powder. The LLB powder was immersed in a 0.01 M HNO3 solution with a S/L ratio 1:3 for 3 h. After that, the mixture was filtered and air-dried after being rinsed with distilled water until the pH was neutral (Hevira et al., 2021).
Referring to the procedure obtained by Zhou et al. (2015), 2.00 g of LLB was weighed and then mixed with 0.30 g of citric acid and 0.25 g of sodium dihydrogen phosphate. Furthermore, as much as 30 mL of distilled water was added to the mixture in a 100 mL Erlenmeyer flask. Then the mixture was homogenized using an ultrasonicator for 15 min. Then the mixture was heated in a water bath for 1 h. Next, the mixture was heated at 140 °C for 4 h. After heating, the mixture was cooled and rinsed using 500 mL of distilled water to remove residual CA and sodium dihydrogen phosphate. The sample was filtered by a vacuum pump and dried at 60 °C until constant weight, then stored and labeled CA-LLB (Zhou et al., 2015).
2.3 CA-LLB characterization
The point of zero charges (pHpzc) of CA-LLB was determined using the solid-addition method (Moghazy, 2019). The functional groups on the biosorbent were examined using Attenuated Total Reflectance-Infrared (IRTracer-100 Shimadzu) before and after MB uptake. For infrared scanning from 500 to 4000 cm−1, a small amount of CA-LLB was placed on the sample holder. The surface functional groups were quantitatively analyzed using the Boehm titration method before and after modification (Vifttaria et al., 2019). The surface morphology of CA-LLB before and after MB uptake was characterized using a Hitachi FLEXSEM 1000 Scanning Electron Microscopy with Energy-dispersive X-ray Spectroscopy. TGA (Shimadzu, DTG-60) was used to examine the thermal stability of the CA-LLB for a 10 mg sample at a flow rate of 50 mL min−1 N2.
2.4 Batch adsorption studies
The batch adsorption system was carried out using a mechanical shaker (150 rpm). Batch adsorption tests were performed to analyze how pH (5–11), initial MB concentration (300–1500 mg/L), contact time (5–120 min), and adsorbent heating temperature (25–200 °C) affected adsorption. The pH of the solution was first adjusted by adding 0.1 M HNO3 or 0.1 M NaOH. The pH was then adjusted using a buffer based on the pH of each solution. Furthermore, 0.10 g of CA-LLB was added to the MB solution and shaken based on contact time. The mixture was then filtered, and the absorbance of the filtrates was determined using a Spectrophotometer UV–vis (Genesys 20 Thermo Scientific) at 664 nm. The quantity of MB adsorbed on CA-LLB can be determined by calculating the adsorption capacity (q) and removal efficiency (%R) from Eqs. (1) and (2) (Ramadhani et al., 2022).
2.5 Thermodynamics study
In an Erlenmeyer flask, 0.10 g of CA-LLB was added to a 10 mL solution of 10–50 mg/L of MB. The optimum pH and contact time conditions had already been established previously. Temperatures of 298, 308, and 318 K were varied, and the mixture was then agitated at 150 rpm. A UV–vis spectrophotometer was used to measure the absorbance of the filtrate at 664 nm (Hevira et al., 2020; Zein et al., 2020).
2.6 Desorption cycle and reusability study
0.1 g of CA-LLB were added into MB solution at the optimum pH, contact time, and CA-LLB heating temperature. A mechanical shaker was used to agitate the mixture at 150 rpm, and then filtered. The filtrate was analyzed by UV–vis spectrophotometer (Cads). Next, the residue was dried at room temperature. After drying, the CA-LLB were contacted with 10 mL of 30 % acetic acid solution for the optimum time, then filtered. The filtrate was examine using UV–vis spectrophotometer (Cdes). The CA-LLB was then repeatedly contacted with the MB solution (cycles). The percentage of MB desorbed in CA-LLB was calculated using the Equation. (3) (Dotto et al., 2015).
Cads (mg L-1) represents the amount of MB adsorbed on the CA-LLB, and Cdes (mg L-1) represents the amount of MB desorbed from the MB-loaded sample (Dotto et al., 2015; Hevira et al., 2021).
3 Results and discussion
3.1 Modification process
In efforts to increase the ability of dye adsorption in biosorbents, a modification process were carried out using a suitable modifier. In this study, activated Lemongrass leaves bio-waste (LLB) was modified using citric acid through an esterification reaction. Citric acid was used as a modifier because it is non-toxic, inexpensive, and easy to obtain (Liu et al., 2019).
Citric acid can be used as a modifier of the surface of biosorbents because it can increase additional carboxyl groups to its surface, increasing dyes' adsorption capacity (Xu et al., 2016). Sajab et al. (2011) used kenaf core fiber modified with citric acid through esterification, showing a higher MB adsorption capacity (131.6 mg/g) than untreated kenaf core fiber (Sajab et al., 2011). Zou et al. (2013) also reported that pine sawdust modified with citric acid could be used as an effective adsorbent, where the adsorption capacity of MB reaches 111.46 mg/g (Zou et al., 2013).
This modification requires ultrasonication, which aims to break up the fibril structure, thereby increasing the surface area of the biosorbent (Giraldo et al., 2021). The esterification of citric acid with the hydroxyl group (–OH) in the biosorbent is thought to occur in two steps. In the first step, citric acid is dehydrated to form a cyclic anhydride. In the second step, the intermediate product combines citric acid's ring-opening reaction with a hydroxyl group to form an ester product (Nguyen and Pham, 2020). The modification process of lemongrass leaves bio-waste with citric acid was proven by the FTIR spectrum (Fig. 2) and the results of the Boehm titration (Table 3). Based on these exposures, the mechanism of LLB modification by citric acid is shown in Fig. 1.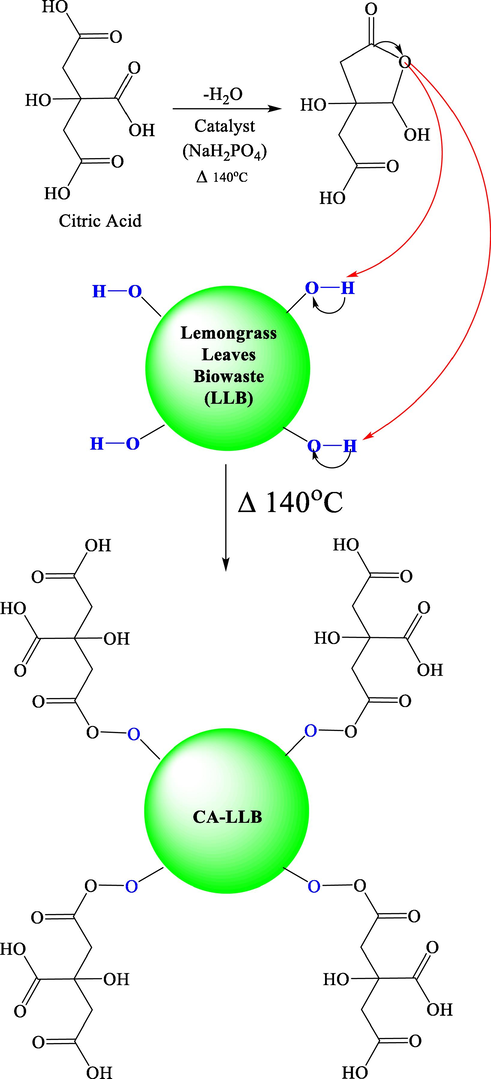
Mechanism of LLB modification with citric acid.
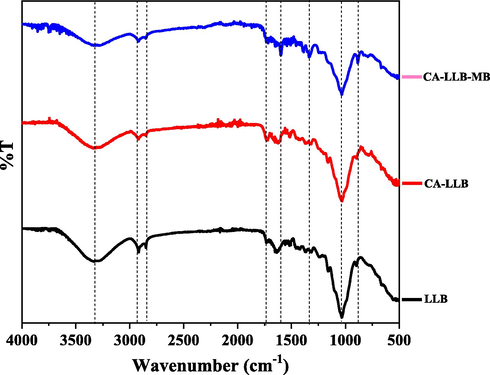
The FTIR spectrum of LLB and CA-LLB before and after MB dye adsorption.
3.2 CA-LLB characterization
3.2.1 Surface functional groups
The surface characterization of LLB and CA-LLB using FTIR aims to evaluate the functional groups that play a role during adsorption, indicated by the shift in wavenumber in each FTIR spectrum (Soldatkina and Yanar, 2021). The occurrence of LLB modification by citric acid was obtained from this analysis. Fig. 2 shows the wavenumber shifting in the LLB and CA-LLB spectra before and after adsorption at 500–4000 cm−1.
Fig. 2 shows the presence of several peaks formed in the LLB and CA-LLB spectra. The spectrum showed peaks about 3330.16 and 3321.48 cm−1 in LLB and CA-LLB spectra due to hydroxyl groups (O—H) stretching vibrations of macromolecules such as cellulose, hemicellulose, and lignin. The presence of peaks at 2917.38 and 2921.24 cm−1 in LLB and CA-LLB, represents the C—H stretching and stretching vibrations of the methyl (–CH3) and methylene (—CH2—) groups in the molecular structure of cellulose and hemicellulose (Dinh et al., 2019). In addition, the FTIR spectrum also shows the presence of other functional groups on the surface of the two biosorbents, such as the O—H group of carboxylic acid, C⚌C alkene, C—O cyclic ether group, and other groups that support the adsorption process of MB dye on the LLB and CA-LLB surfaces. After LLB was modified with citric acid, a new peak appeared at 1729.21 cm−1, which indicated the C⚌O stretching vibration of,β-unsaturated ester in the CA-LLB surfaces. It proves the modification of LLB by citric acid through the esterification reaction (Giraldo et al., 2021). Table 2 shows that there has been a wavenumber shifting in the FTIR spectrum of LLB after adsorbing MB dye.
The wavenumber shift occurs at the peaks of the functional groups O—H alcohol, O—H carboxylic acid, C—O cyclic ether, and C⚌C in the conjugated alkene. MB dye can interact with functional groups containing oxygen, such as alcohols and carboxylic acids (Sahu et al., 2020). It denotes the functional group's participation in adsorbing positive charges from MB dye molecules via electrostatic interactions, ion–dipole interactions, hydrogen bonds, and Van der Waals bonds (Zein et al., 2022). Moreover, the presence of peaks at wave numbers 1246.04 and 1332.81 cm−1 after absorbing MB dye reported the existence of aromatic amine C—N group vibrations on both biosorbents. It means that the MB molecule was entirely adsorbing on the CA-LLB surface (Sahu et al., 2020).
Although the qualitative characterization of FTIR can indicate the occurrence of modification with citric acid through esterification, quantitative evidence is needed. Through Boehm's titration, the content of carboxyl (—COOH), lactone (—COOR), and hydroxyl (—OH) groups on the solid surface can be examined quantitatively. The carboxyl and hydroxyl groups are acidic according to the Brønsted theory, while the lactone groups are acidic according to the Lewis theory, so neutralization reactions with alkaline solutions can analyze these three groups (Vifttaria et al., 2019). The results of the Boehm titration can be seen in Table 3.
Based on Table 3, there was an increase in the concentration of carboxyl, lactone, and hydroxyl groups after LLB modification using citric acid. It is a fact that the LLB surface has been modified with citric acid. The functional group content increased due to the binding of citric acid, which has carboxylic and hydroxyl groups on the LLB surface after modification (CA-LLB) through an esterification reaction. The increase in the concentration of carboxyl and hydroxyl groups also increased the number of active sites of the biosorbent (Leyva-Ramos et al., 2012). Thus, it would increase the adsorption capacity of the MB dye.
3.2.2 Morphology and structural properties
The surface morphology of the biosorbent was evaluated using SEM-EDS, which included roughness, porosity, and the abundance of components available on the surface. By evaluating changes in the surface of the biosorbent before and after the adsorption process, the adsorption mechanism may be predicted (Emam et al., 2020; Zein et al., 2022). Fig. 3 (a)-(b) shows the surface morphology of CA-LLB before and after MB adsorption at 8000x magnification, respectively.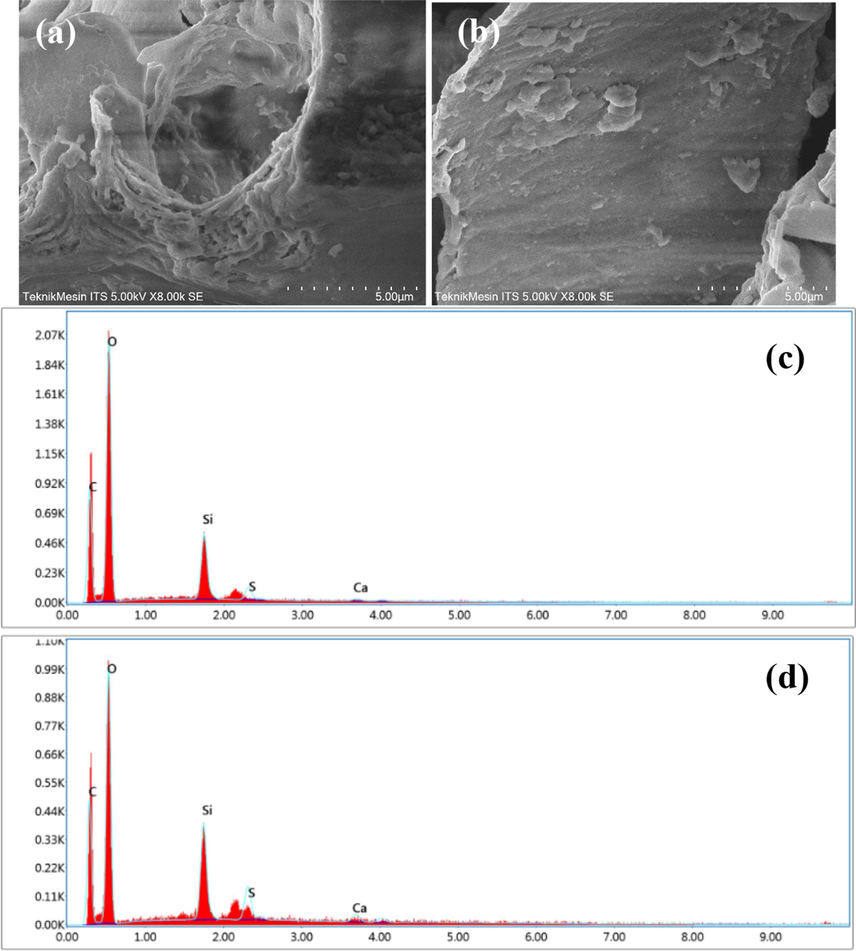
SEM images of CA-LLB before (a) and after adsorption (b). EDX graph before (c) and after adsorption (d).
CA-LLB surface morphology after MB dye adsorption is shown in Fig. 3(a) and (b). These findings show morphological changes during adsorption, including a smooth and even surface formation. This was owing to the porous and hollow nature of CA-LLB being covered with MB dye after the adsorption procedure. These findings led to the formation of a monolayer due to the homogenous binding of MB molecules on the adsorbent surface, as evidenced by the adsorption isotherm analysis (Zein et al., 2022).
The SEM-EDS equipment can assess the number of elements on the surface of the biosorbent using EDS analysis and qualitatively analyze the surface morphology of the biosorbent using SEM pictures. Table 4 shows the results of examining the quantity of these elements. Table 4 indicates the presence of several components on the surface of CA-LLB prior to MB dye adsorption, including C, O, Si, and Ca. The concentration of O, Si, and Ca on the surface of CA-LLB decreased after the adsorption process because they were involved in the adsorption process. Ca decreases due to cation exchange between MB molecules and calcium ions. The increase in the percentage of C on the surface of CA-LLB after the adsorption process was due to the binding of the MB molecular framework, which is rich in carbon elements. The increasing percentage of elemental S after adsorption demonstrated that the MB dye had been adsorbed on the CA-LLB surface (Zein et al., 2022).
3.2.3 Point of zero charge (pHpzc)
The pH value of the point of zero charges (pHpzc) is assumed to be the pH at which the surface charge of the adsorbent is zero. At this pH, the amount of positive charge is equivalent to the negative charge on the surface of the adsorbent. Knowledge of pHpzc can formulate hypotheses regarding the ionization of functional groups and their interactions with adsorbates in solution. The pHpzc value can also predict the pH range with a high adsorption capacity (Karna et al., 2018). At a solution pH higher than pHpzc, the surface of the adsorbent is negatively charged and can interact with the positively charged adsorbate. However, at a pH lower than pHpzc, the surface of the adsorbent is positively charged and can interact with the negatively charged adsorbate (Al-Maliky et al., 2021). The pHpzc CA-LLB graph can be seen in Fig. 4.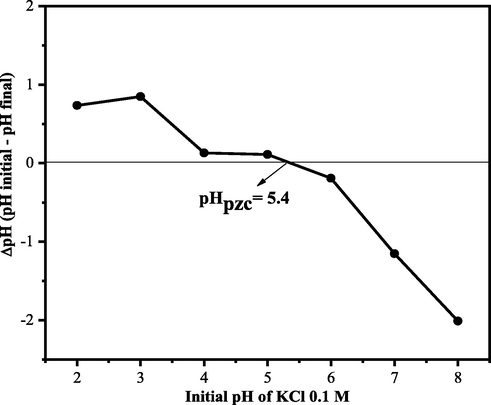
pHpzc for CA-LLB.
Based on Fig. 4, it can be seen that the pHpzc CA-LLB is 5.4. At this pH, the number of positive and negative charges on the surface of the biosorbent is the same, which means the surface of the biosorbent has no charge. The adsorption process of MB by CA-LLB was predicted to reach maximum adsorption capacity if pH > pHpzc, where the surface of the biosorbent will be negatively charged and able to interact with MB through electrostatic interactions. However, if pH < pHpzc, then the surface of the biosorbent will be positively charged, resulting in electrostatic repulsion between the MB molecule and the surface charge of the biosorbent (Rahman-Setayesh et al., 2020). Therefore, the adsorption of MB by CA-LLB was predicted to be optimal if pH > 5.4.
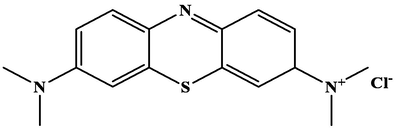
MB dye, methylthioninium chloride, is one of the azo group cationic dyes which will form methylthioninium ions (cations) and chloride ions (anions) when dissolved in water. Methylthioninium ion is a cation that has an azo group so that it becomes a target adsorbate that the biosorbent will absorb. When pH > pHpzc, the positively charged methylthioninium ion is certainly able to be absorbed by the biosorbent, which has a negative charge through electrostatic interactions (Uddin et al., 2017).
There were changes in pHpzc LLB before and after modification with citric acid. The pHpzc CA-LLB value is smaller than the pHpzc LLB. This phenomenon was caused by the modification process with citric acid that will increase the acidity on the CA-LLB surface, caused decreasing the pHpzc value (Wibowo et al., 2006). The same result was reported by Tehrim et al. (2021) that there was a decrease in the pHpzc value of cigarette waste modified with citric acid, from 6 to 5.5 (Tehrim et al., 2021).
3.3 Batch adsorption studies
3.3.1 Effect on pH of adsorption
The effect of solution pH is an important factor because pH affects the interaction between the adsorbate and the functional groups on the surface of the biosorbent. The addition of H + ions or OH– ions during the pH adjustment of the solution affected the ionization process of functional groups on the surface of the biosorbent. The functional groups would be protonated or deprotonated by the change of pH, which will generate the formation of charge on the surface of the biosorbent. In addition, pH also affects the dye ionization process and regulates its interaction with the active site of the biosorbent (Kassimi et al., 2021). Based on the CA-LLB pHpzc analysis results, the effect of the pH of the MB dye solution was studied in the pH range of 5–11, which can be seen in Fig. 5.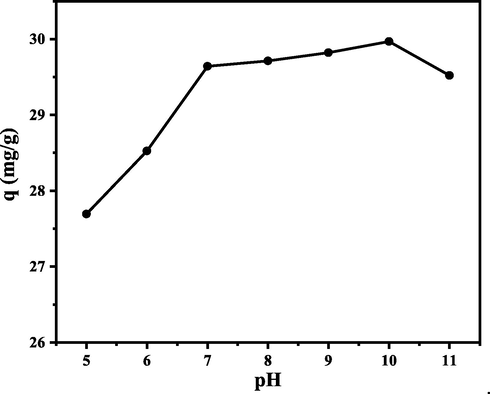
Effect of pH on MB adsorption capacity. (Experimental conditions: C0 = 300 mg/L; biosorbent mass = 0.1 g; contact time = 60 min; adsorption temperature = 25 °C; volume MB = 10 mL; particle size = 36 µm; and agitation speed = 150 rpm).
Fig. 5 indicates that the maximum adsorption capacity was achieved at pH 10 (q = 29.9692 mg g−1). The graph also illustrates the increase in adsorption capacity along with increasing pH. The OH– ion added during pH adjustment will cause ionization of the functional group on the surface of the biosorbent so that the functional group is deprotonated. As the pH increases, the deprotonated functional group will be negatively charged and able to interact with MB molecules electrostatically to achieve maximum adsorption capacity (Jin et al., 2019).
In addition, pH also affects the ionization of MB molecules. MB is a cationic dye (pKa = 5.85). According to Jiaqi et al. (2019), methylene blue will ionize and form a positive charge at alkaline pH (pH > pKa) and the MB molecule will be deprotonated and stable to form a positive charge (cation). Consequently, electrostatic attraction between the negative charge on the biosorbent and the positive charge on the methylene blue dye increases (Jiaqi et al., 2019).
On the other hand, a low adsorption capacity was obtained when the adsorption pH was low. This is because the functional group on the surface of the biosorbent will experience protonation, which causes the formation of a positive charge in the functional group. The positively charged functional group experienced electrostatic repulsion with MB molecules, inhibiting the adsorption process. In addition, H+ ions in the solution will compete with MB molecules, causing low adsorption capacity (Labaran et al., 2019; Mousavi et al., 2017).
The analysis of the influence of pH has proven that the maximum adsorption process was obtained at pH > pHpzc. The adsorption of MB has dominantly occurred in an alkaline environment because of the electrostatic interaction between the negative charge in CA-LLB and MB cation. A similar result was reported by Mpatani et al. (2020) that the adsorption of MB by citric acid-modified bagasse is maximal at pH 10 (Mpatani et al., 2020).
3.3.2 Effect of initial dye concentration and analysis of adsorption isotherm models
The concentration of adsorbate plays an essential role in determining the mechanism of an adsorption process. In addition, the effect of adsorbate concentration in solution also provides information in the form of adsorption capacity. The effect of adsorbate concentration can be utilized to estimate the adsorption isotherm model. the model can determine the feasibility and efficiency of the adsorption process (Mushtaq et al., 2016). The effect of initial MB concentration on adsorption capacity was studied in the concentration range of 300–1500 mg/L at pH 10 for CA-LLB. The graph of the effect of the initial concentration can be seen in Fig. 6. The graph shows that the maximum adsorption capacity of CA-LLB is 120.6886 mg g−1 at a concentration of 1400 mg/L.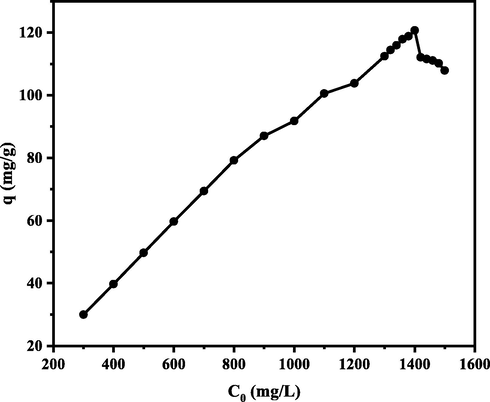
Effect of initial MB concentration on adsorption capacity. (Experimental conditions: pH = 10; biosorbent mass = 0.1 g; contact time = 60 min; adsorption temperature = 25 °C; volume MB = 10 mL; particle size = 36 µm; and agitation speed = 150 rpm).
Fig. 6 shows that the increase in the initial concentration of MB will also increase the adsorption capacity significantly. This phenomenon caused by the increasing concentration will also increase the mobility of the dye molecules, causing a strong driving force to support the movement of dye molecules from the solution to the surface of the biosorbent (Tehrim et al., 2021). In addition, in the early phase of adsorption, there are still many active sites available on the surface of the biosorbent, where MB dye molecules interact more easily with the active sites so that the adsorption capacity increases (Kavci et al., 2021).
Meanwhile, the adsorption capacity tends to decrease after equilibrium is reached because the active site on the surface of the biosorbent was completely filled, thus inhibiting all interactions of MB molecules with the surface of the biosorbent (Jin et al., 2019; Uddin et al., 2017).
Fig. 6 also shows the different trends of CA-LLB adsorption. The increase in adsorption capacity after modification proved that LLB modification using citric acid (CA-LLB) increased adsorption capacity by adding carboxyl and hydroxyl functional groups as active sites. This functional group is deprotonated at alkaline pH, forming a negative charge so that there is an electrostatic interaction between the MB molecule and the functional group on the surface of the biosorbent (Mpatani et al., 2020). This result is related to the shift in the wavenumber of the functional groups in the FTIR spectrum.
Essekri et al. (2021) explained that after modifying the biosorbent, the oxygen atom in the hydroxyl and carbonyl groups of citric acid could act as an electron donor. The benzene ring of the dye molecule can act as an electron acceptor. Thus, electron donor–acceptor intermolecular interactions were also involved during adsorption (Essekri et al., 2021) [15]. Research conducted by Tehrim et al. (2021) also reported increased MB adsorption capacity by cigarette butt waste after being modified with citric acid (Tehrim et al., 2021).
Data on the effect of initial concentration on the adsorption capacity value was used to determine the adsorption isotherm model. The adsorption isotherm can be used to evaluate the adsorption capacity of the adsorbent and can also be used to describe the interaction of the adsorbate with the biosorbent (Jiaqi et al., 2019). To better study the adsorption mechanism, several models of adsorption isotherms in this study were analyzed, namely the Langmuir, Freundlich, Dubinin-Radushkevich (D-R) isotherm models.
The linear regression equation and coefficient of determination (R2) for the adsorption isotherm model were obtained from the Ce vs Ce/qe plot for the Langmuir isotherm model, the log Ce vs log qe plot for the Freundlich isotherm model, the ε2 vs ln qe plot for the D-R isotherm model, and the plot of ln Ce vs Qe for the Temkin isotherm model. Furthermore, the isotherm model that represents the adsorption process is selected from the R2 value of the isotherm model, which is close to one. The graph of the Freundlich isotherm model can be seen in Fig. 7.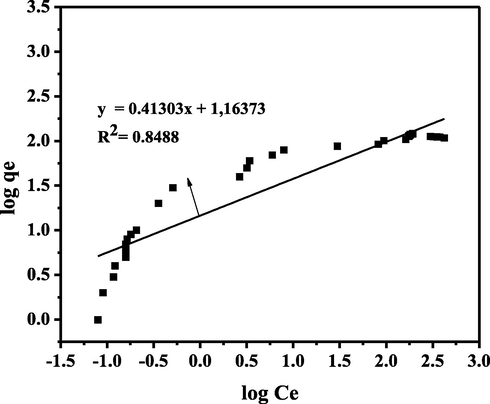
Linear plot of Freundlich Isotherm Model.
Fig. 7 shows the Freundlich isotherm R2 for CA-LLB was 0.8488. Freundlich's isotherm model assumed that during the adsorption process, a multilayer is formed. In addition, the 1/n value obtained from the Freundlich isotherm model provides information on the heterogeneity of an adsorption process. The 1/n value of MB adsorption using CA-LLB were 0.4130, which indicated heterogeneity during the adsorption process (0 < 1/n < 1) (Al-Ghouti and Da’ana, 2020). Furthermore, the graph of the Langmuir isotherm model can be seen in Fig. 8.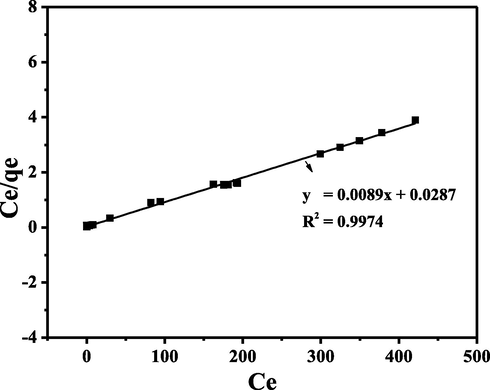
Linear plot of Langmuir Isotherm Model.
Fig. 8 shows the Langmuir isotherm equation R2 for CA-LLB was 0.9974. Langmuir's isotherm model assumed that during the adsorption process, it forms a monolayer (Putri et al., 2020a). In addition, the RL value obtained from the Langmuir isotherm model provides information on the feasibility of an adsorption process. The separation factor (RL) value of MB adsorption using CA-LLB is generally close to zero (see Table 1), where the RL value is in the range of 0 < RL < 1, which indicates that the MB adsorption process was feasible (Essekri et al., 2021). Furthermore, the graph of the D-R isotherm model can be seen in Fig. 9.
Properties
Information
Structure
Molecular formula
C16H18ClN3S·H2O
Molecular weight
319.86 g mol−1 (anhydrous)
λmax
664 nm
Appearance
Dark blue powder, eventually with granular and bright parts.
Melting point
180 °C
Bulk density
400–600 kg m−3
LD50 (oral rat)
1180 mg kg−1
Solubility
Water: 2.5 g/100 mL
Ethanol: 1.5 g/100 mL
Acetone: 0.5 g/100 mL
Biosorbent
Before adsorption (cm−1)
After adsorption (cm−1)
Functional group information
LLB
3330.16
3343.66
O—H alcohol stretching
2917.38
2917.38
C—H alkanes stretching
1635.66
1599.02
C⚌C conjugate alkenes stretching
1430.24
1386.84
O—H carboxylic acid bending
1368.52
1332.83
O—H alcohol bending
–
1246.04
C—N aromatics amine stretching
1032.90
1031.93
C—O cyclic ether stretching
CA-LLB
3321.48
3307.92
O—H alcohol stretching
2921.24
2918.30
C—H alkanes stretching
1729.21
–
C⚌O α,β-unsaturated ester stretching
1623.13
1598.99
C⚌C conjugates alkene stretching
1370.45
1394.53
O—H carboxylic acid bending
–
1332.81
C—N aromatics amine stretching
1031.93
1033.85
C—O cyclic ether stretching
Biosorbent
Functional groups contents (meq g−1)
Carboxyl
Lactone
Hydroxyl
LLB
0,6073
0,5875
0,2012
CA-LLB
0,9398
0,8202
0,5670
Element
Relative abundance of elements (%wt)
Before adsorption
After adsorption
C
32.14
33.22
O
57.85
51.86
Si
7.32
8.65
Ca
1.99
1.91
S
0.70
4.35
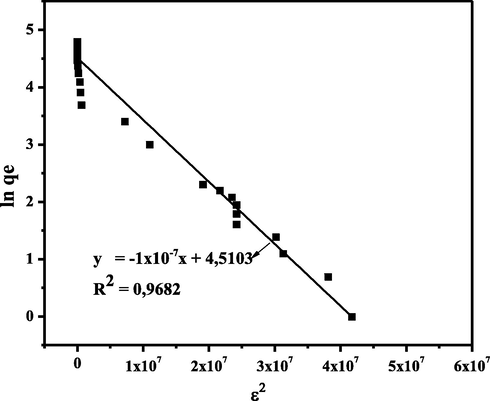
Linear plot of D-R Isotherm Model.
Fig. 9 shows the R2 value of the D-R isotherm equation for CA-LLB was 0.9682. The D-R isotherm model assumed the presence of pore filling of the adsorbent by the adsorbate during the adsorption process (Hu and Zhang, 2019). The free energy of adsorption (EDR) can also be determined using this model, where the value of the adsorption EDR using CA-LLB is 2.2360 kJ mol−1. Furthermore, the graph of the Temkin isotherm model can be seen in Fig. 10.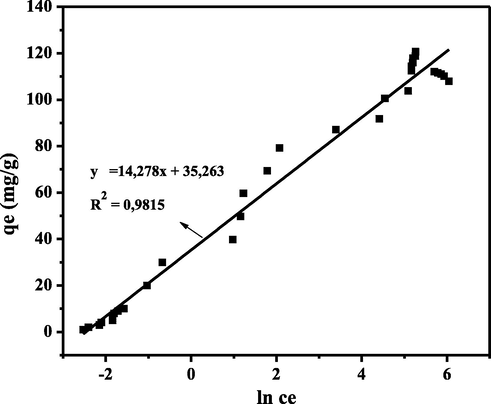
Linear plot of Temkin Isotherm Model.
Fig. 10 shows the R2 of the Temkin isotherm equation for CA-LLB was 0.9815. The D-R isotherm model assumed that heat has involved during adsorption. In addition, this model also assumes the occurrence of chemical adsorption (chemisorption) (Al-Ghouti and Da’ana, 2020). The results of the analysis of the isotherm models are summarized in Table 5.
Isotherm Models
Value
Freundlich
KF ((L mg−1)1/n)
14,5780
1/n
0,4131
R2
0,8488
Langmuir
qm (mg g−1)
112, 3539
KL (L mg−1)
0,3101
RL
0,0021–0,2438
R2
0,9974
Dubinin-Radushkevich
qm (mg g−1)
90,9490
KDR (mol2 /J2)
1 × 10⁻⁷
EDR (kJ mol−1)
2,2360
R2
0,9682
Temkin
β (J mol−1)
173,5230
KT (L g−1)
11,8295
R2
0,9815
Based on Table 5, the R2 value of the methylene blue adsorption isotherm model using CA-LLB can be ordered as follows: Langmuir > Temkin > D-R > Freundlich. The low R2 value for the Freundlich isotherm indicates that the adsorption process is not dominant through the formation of multilayers. The highest R2 value of Langmuir isotherm indicates a single layer is formed on the surface of the biosorbent by MB molecules during adsorption.
3.3.3 Effect of contact time
Contact time is an essential experimental parameter to determine the minimum time required to reach the maximum adsorption capacity. The effect of contact time was also studied to determine the model of dye adsorption kinetics (Zein et al., 2020). The effect of contact time on adsorption capacity was studied in the range of 5–120 min. The graph of the effect of the initial concentration can be seen in Fig. 11.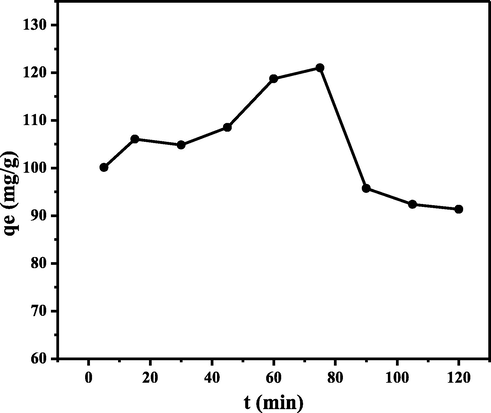
Effect of contact time on MB adsorption capacity (Experimental conditions: pH = 10; initial concentration of MB = 1400 mg/L; biosorbent mass = 0.10 g; adsorption temperature = 25 °C; particle size = 36 µm; volume MB = 10 mL; and agitation speed = 150 rpm).
Fig. 11 shows an increase in adsorption capacity with increasing contact time. The maximum adsorption capacity reached 121.0069 mg g−1 for CA-LLB at a contact time of 75 min. The graph shows that the adsorption capacity tends to increase with increasing contact time due to the number of active sites on the adsorbent still available at an early stage. However, after the optimum contact time, the adsorption capacity decreases due to the accumulation of MB at the active site of the biosorbent (Uddin et al., 2009).
Based on these results, this could be explained that the adsorption process occurs in two stages: the initial adsorption stage, which occurs rapidly, and then the release stage of the slowly desorbed substance. This phenomenon was related to the amount of adsorbed substance that has exceeded the maximum number of compounds that can be absorbed. In other words, the adsorbent is saturated. If a certain amount of adsorbate has saturated the active site on the surface of the adsorbent, adding adsorption time can no longer increase the adsorption capacity and even decreases. In addition, a contact time that is too long causes the bond between the adsorbate and the adsorbent that has been formed to be rereleased so that the adsorption capacity decreases (Kurniawati et al., 2021).
Data on the effect of contact time on the adsorption capacity value was used to determine the adsorption kinetics model. Adsorption kinetics were analyzed to determine the effect of contact time on the adsorption process and to measure the adsorption rate (Jiaqi et al., 2019). Several adsorption kinetics models were analyzed to study the adsorption mechanism: pseudo-first-order, pseudo-second-order, intraparticle diffusion (IPD), and Elovich models.
The linear regression equation and the coefficient of determination (R2) of the kinetic model were obtained from the t vs ln (qe-qt) plot for the first-order pseudo kinetic model, the t vs t/qt plot for the second-order pseudo model, and the t1/2 vs qt plot for the kinetic model IPD, and ln t vs qt plots for the Elovich kinetic model. Furthermore, the kinetic model representing the adsorption process is selected from the R2 value of the kinetic model, which is close to one.
The kinetic model parameters for MB adsorption by both biosorbents were calculated from the kinetic model plots and are summarized in Table 6. The R2 value of the second-order pseudo kinetic model is the highest compared to other kinetic models and is close to one. In addition, the value of MB adsorption capacity on the two biosorbents obtained from the pseudo-second-order model (qe calc) is close to the actual adsorption capacity value (qe exp). The same result was reported by Holliday et al (2022) about the utilization of green pea haulm as an adsorbent for the removal of methylene blue dye following the pseudo-second-order kinetic model (Holliday et al., 2022). Low R2 values were found in the IPD and pseudo-first-order kinetics models, so it could be assumed that the effect of intraparticle diffusion and multilayer formation does not represent the adsorption process.
Kinetics models
CA-LLB
qe (exp) (mg g−1)
121.0069
Pseudo-first-order
k1 (min−1)
0.3340
qe (calc) (mg g−1)
2264.9319
R2
0.0180
Pseudo-second-order
k2 (g/mg.min)
−0.00205
qe (calc) (mg g−1)
91.7431
R2
0.9749
Intrapartikel Difussion
Kdiff (mg/g.min2)
5.2948
C (mg g−1)
59.2490
R2
0.3077
Elovich
β (g mg−1)
0.6225
α (mg.min/g)
7.44 × 10¹⁰
R2
0.5170
Based on Table 6, the R2 values of the MB adsorption kinetics model using CA-LLB can be ordered as follows: pseudo-second-order > Elovich > IPD > pseudo-first-order. Thus, it could be assumed that the adsorption of MB dye occurs through chemical interaction (chemisorption) (Muniyasamy et al., 2020). These results are related to the shift in wave number in the FTIR spectrum and the characterization results with EDX, which assumes the occurrence of electrostatic interactions and cation exchange during adsorption.
3.3.4 Effect of adsorbent heating temperature and stability thermal of CA-LLB
The heating temperature of the biosorbent was investigated to evaluate the relationship between the percentage of mass loss due to heating (% weight loss) and the adsorption capacity of MB. Heating of the biosorbent is carried out to remove the water content and volatile compounds that cover the pores of the biosorbent so that the surface area of the biosorbent increases in absorbing MB (Chaidir et al., 2015).
In addition, the biosorbent heating temperature was studied to evaluate the resistance of the biosorbent to high-temperature heating, which is related to the destruction of the active site in the form of functional groups on the surface of the biosorbent. The heating temperature of the biosorbent was studied in the range of ± 25–200 °C. The graph of the effect of CA-LLB heating temperature on the adsorption capacity of MB can be seen in Fig. 12.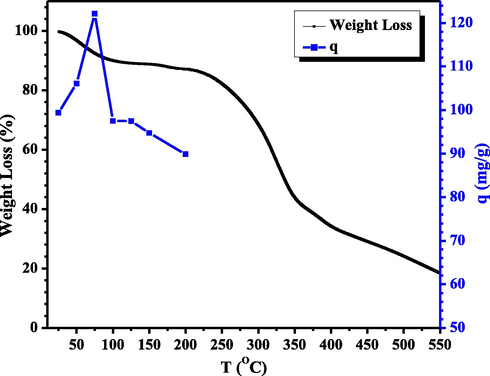
Graph of Relationship between TGA characterization and CA-LLB heating temperature on MB adsorption (pH = 10, MB concentration = 1400 mg/L, contact time = 75 min, biosorbent mass = 0.10 g, particle size = 36 µm, volume = 10 mL, and agitation speed = 150 rpm).
Fig. 12 shows a graph of the effect of CA-LLB heating temperature on MB adsorption. The graph shows that the optimum heating of CA-LLB was carried out at 75 °C to absorb MB with an adsorption capacity of 122.1211 mg g−1. The increase in the adsorption capacity of MB, along with the increase in heating temperature to 75 °C, was due to the evaporation of water molecules and volatile compounds on the surface of CA-LLB so that the pores of CA-LLB were open and ready for entrapped the MB dye maximally. However, the decrease in adsorption capacity after the optimum heating temperature was caused by the destruction of functional groups on the surface of the biosorbent and a reduction in the mass of the biosorbent, which caused the active site on the surface to decrease so that fewer MB molecules were absorbed (Chaidir et al., 2015). These results were correlated with the characterization result of biosorbents with TGA.
TGA analysis showed that CA-LLB had three stages of degradation, as shown in Fig. 12. The first stage was a decrease in initial mass in the temperature range of 25 °C to 100 °C. This shows the loss of water molecules on the surface of the biosorbent so that the pores of the biosorbent are wide open where the maximum adsorption capacity is achieved in this temperature range. Furthermore, in the second stage, CA-LLB begins to decompose at a temperature of 275 °C where decomposition has occurred in the structural units of cellulose, hemicellulose, and lignin to form CO2 gas and water vapor. At this stage, all the functional groups have been damaged, so the adsorption capacity becomes low. In the third stage, above the temperature of 350 °C, the decomposition of the remaining solids in the two biosorbents forms ash (Emam et al., 2020). These results also show that CA-LLB has higher thermal stability than LLB, where a higher temperature is required to break the ester bond between biosorbent and citric acid (Keirudin et al., 2020).
3.4 Adsorption thermodynamics studies
Various textile industry effluents are usually discharged into water bodies with fluctuating temperatures, so the adsorption thermodynamic parameter approach is essential to study. The thermodynamic parameters obtained based on variations in the adsorption temperature provide essential information about the energy changes associated with the adsorption process. In addition, adsorption thermodynamics was studied to predict the mechanism between the adsorbate and the adsorbent during the adsorption process (Nodehi et al., 2021).
Adsorption thermodynamic parameters, which include Gibbs free energy (ΔG°), enthalpy (ΔH°), and entropy (ΔS°), were obtained from the batch adsorption process at various adsorption temperatures of 298 K, 308 K, and 318 K with various concentrations for each. temperature from 10 to 50 mg/L. The effect of concentration and temperature variations for each temperature will produce the value of G° using Equation 19. Furthermore, the values of H° and S° are calculated by plotting the data for the value of G° vs T (K).
Gibbs's free energy (ΔG°) was studied to determine the spontaneity of the adsorption process. The enthalpy (ΔH°) was studied to determine whether the adsorption process was exothermic or endothermic. Entropy (ΔS°) was studied to determine the randomness between adsorbate molecules on the adsorbent surface during adsorption (Ullah et al., 2021). The thermodynamic adsorption parameters for CA-LLB are respectively summarized in Table 7.
Biosorbent
Temperature (K)
ΔG° (kJ mol−1)
ΔH° (kJ mol−1)
ΔS° (kJ/mol.K)
CA-LLB
298
−4,7250
−7,8828
0,0002
308
−4,8105
318
−4,9173
As shown in Table 7, the Gibbs free energy (ΔG°) of CA-LLB was negative, indicating that the MB adsorption process takes place spontaneously. The value of ΔG° CA-LLB decreased in a negative direction indicating the MB adsorption process by CA-LLB took place spontaneously at high temperatures and an increase in adsorption capacity along with the increase in adsorption temperature (Patil et al., 2022). These results have a strong correlation with the enthalpy value (ΔH°). A more negative value of ΔH° on MB adsorption indicates that the adsorption is exothermic. This indicates that adsorption using CA-LLB requires considerable energy to support the adsorption process so that the adsorption process is favorable at higher temperatures (Chen et al., 2019).
The negative ΔS° value on the adsorption of methylene blue dye using CA-LLB indicates that the adsorption process does not form randomness on the surface of the adsorbent with the adsorbate. In addition, there was no significant change in the surface or internal structure of the adsorbent after the adsorption process (Zein et al., 2022). Therefore, it can be summarized that in the thermodynamic study of MB adsorption using CA-LLB, the MB dye adsorption process occurs spontaneously, endothermically, and there is no randomness during the adsorption process.
3.5 Desorption cycle and reusability study
Reusability describes the biosorbent used during the adsorption process capable of regenerating using a desorption agent. It is essential to study reusability to investigate the stability of the adsorbent and validate its resistance for regeneration purposes, resulting in a cost-effective adsorption process and efficient use of the adsorbent. Reusability was studied from the data of the adsorption–desorption cycle using a solution as a desorption agent. The desorption agent selected must be effective, environmentally friendly, and low-cost (Ramadhani et al., 2020; Zein et al., 2022).
The 30 % acetic acid solution is a suitable desorption agent for the desorption of cationic dyes because the acidic nature of acetic acid causes electrostatic repulsion between MB and the biosorbent surface so that MB is released from the adsorbent surface (Zein et al., 2022). In addition, this solution has the best desorption ability compared to other desorption agents (% desorption MB = 84.05 %) (Hevira et al., 2021). Therefore, this study chose 30 % acetic acid solution as the desorbing agent. The MB adsorption–desorption cycle by CA-LLB can be seen in Fig. 13.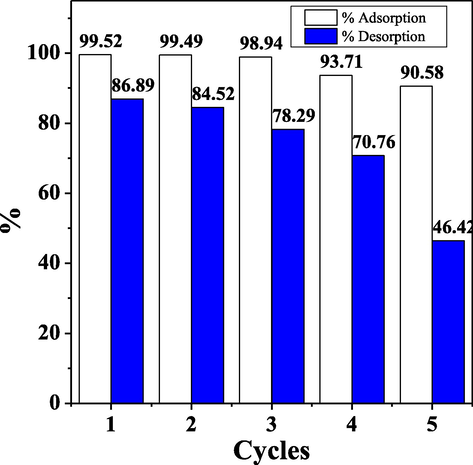
The adsorption–desorption cycle of MB on CA-LLB.
Fig. 13 shows the excellent reusability of biosorbent, where the adsorption–desorption cycle was achieved five times by CA-LLB. The percentage of CA-LLB adsorption decreased from the first cycle (99.52 %) to the fifth cycle (90.58 %). Liu et al. (2018) explained that the decrease in the percentage of adsorption along with the increase in the adsorption–desorption cycle was associated with the dissolution of several organic compounds in the biosorbent, changes in the surface structure of the biosorbent, and subsequently caused the blockage of the pores (Liu et al., 2018).
3.6 Application of biosorbent on real wastewater
The ability of CA-LLB was tested as a biosorbent for wastewater treatment containing MB dye. The wastewater used in this study was obtained from the Chemical Environmental Analysis Laboratory, Department of Chemistry, Andalas University, Indonesia. The application study on this wastewater was studied by comparing the optimum pH with the pH of the original wastewater. In addition, the contact time and heat of the biosorbent are also applied to wastewater treatment. The results of applying optimum conditions for wastewater treatment are summarized in Table 8.
Wastewater condition
pH
Contact time
(min)C0
(mg L-1)Ce
(mg L-1)% R
Optimum
9
45
1.8197
0.1167
93.58
Real
3.353
45
2.2282
0.6154
72.38
Table 8 shows the differences in performance in the wastewater applied to the optimum conditions with the wastewater without applying the optimum conditions for the adsorption of MB dye using CA-LLB. These data indicate low adsorption efficiency in treating the original wastewater with biosorbents. This is caused by interference or other analytes that inhibit adsorption (Sahu et al., 2020).
In addition, the low pH of the wastewater (pH < 7) also affects the adsorption performance. The presence of H+ ions is more dominant in the liquid waste causing protonation of functional groups in the biosorbent resulting in electrostatic repulsion with MB molecules, and the percentage of adsorption is low. On the other hand, under optimum conditions, wastewater with an alkaline pH will cause deprotonation of functional groups in the biosorbent, which supports electrostatic interactions between the biosorbent and MB molecules (Labaran et al., 2019). Therefore, it could be indicated that optimum conditions play an important role during the adsorption process.
3.7 Adsorption mechanism and comparison of CA-LLB adsorption capacity with another biomass
The MB adsorption mechanism by CA-LLB was predicted using the results of the influence of optimum conditions, physicochemical characterization of biosorbents, studies of isotherm and adsorption kinetics, and studies of adsorption thermodynamics. Adsorption isotherm studies indicate that the Langmuir isotherm model represents the adsorption process in both biosorbents. A single layer (monolayer) is formed on CA-LLB by MB molecules after the adsorption process (Putri et al., 2020a). The adsorption kinetics study showed that the adsorption of MB dye by CA-LLB followed a pseudo-second-order model, in which the adsorption process occurred through chemical interaction between MB and the biosorbent surface (chemisorption) (Muniyasamy et al., 2020). This interaction can be explained by the effect of variations in adsorption pH, FTIR analysis, and EDX analysis.
The FTIR spectrum (Fig. 2) showed the presence of hydroxyl (O—H) and carboxyl (—COOH) groups of macromolecules such as cellulose, hemicellulose, and lignin on the surface of CA-LLB. As the pH increases, the functional group will be deprotonated to be negatively charged. The negatively charged group can interact with MB electrostatically (Jin et al., 2019). The FTIR spectrum also showed a shift in the wave number in the spectrum of the conjugated C⚌C group of alkenes before and after adsorption. This indicates the occurrence of π- π bonding interactions between the aromatic framework on MB and aromatic compounds on the surface of the biosorbent (Sahu et al., 2020).
The results of the EDX analysis indicated the cation exchange process during the MB adsorption on the CA-LLB surface, which was characterized by a decrease in calcium levels (%Wt) after the adsorption process occurred. This is due to the exchange of cations between calcium ions and MB molecules (Pandey, 2019). The results of characterization by SEM (Fig. 3) showed a smooth and even surface after adsorption. This is due to the filling of the biosorbent pores by MB molecules (Ramadhani et al., 2020).
Boehm titration analysis showed an increase in the content of —OH and —COOH groups after LLB was modified with citric acid (CA-LLB) and increased the adsorption capacity of MB from 43.1556 mg g−1 to 122.1211 mg g−1. Based on this explanation, the MB uptake mechanism in CA-LLB can be illustrated in Fig. 14.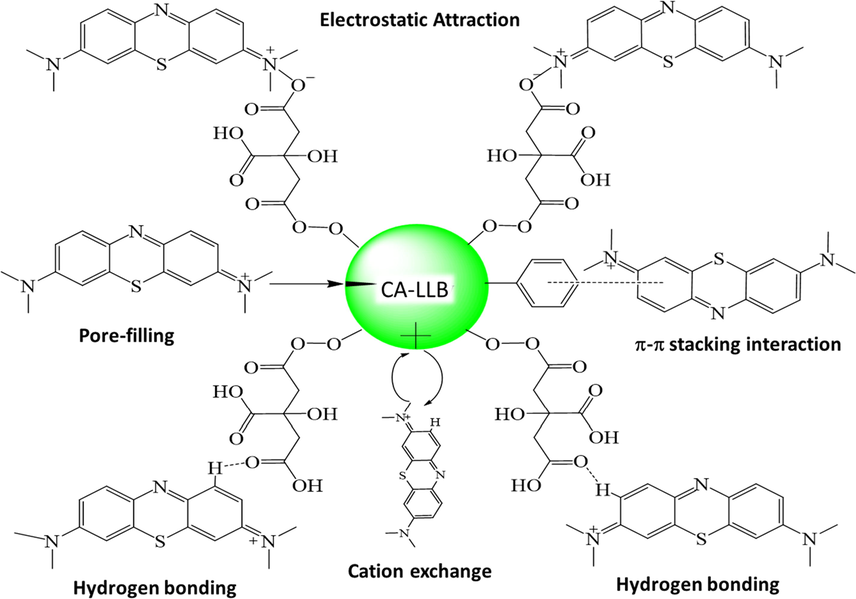
Prediction of MB adsorption mechanism on CA-LLB.
The adsorption ability of MB by CA-LLB is compared with other biomass wastes. Citric acid can improve the performance of LLB to absorb MB, where the adsorption capacity of MB increased from 43.1556 mg g−1 to 122.1211 mg g−1. A comparison of the adsorption capacity of LLB and CA-LLB with other biosorbents can be seen in Table 9.
Adsorbent
qm (mg g−1)
References
5-sulfosalicylic acid modified lignin
83.20
(Jin et al., 2019)
Lemongrass leaves biowaste (LLB)
43.16
(Zein et al., 2022)
CA-LLB
122.1211
This study
Banana peels
20.80
(Annadurai et al., 2002)
H2SO4 crosslinked magnetic chitosan nanocomposite beads
20.40
(Rahmi et al., 2019)
Citrullus colocynthis Seeds
18.83
(Alghamdi and El Mannoubi, 2021)
Citrullus colocynthis Peels
4.48
(Alghamdi and El Mannoubi, 2021)
Rice husk
13.50
(Labaran et al., 2019)
Torrefied rice husk
6.82
(Hummadi et al., 2022)
Acacia wood-based activated carbon (AWAC)
81.20
(Yusop et al., 2021)
Commercial activated carbon
1.23
(Ijagbemi et al., 2012)
Table 9 shows the adsorption capacity of MB in CA-LLB, among other biosorbents. This shows that CA-LLB has a good performance in absorbing MB. LLB modified with citric acid has advantages compared to coconut shell modified with sulfuric acid, which has a low adsorption capacity value. This is due to the use of strong acids as modifiers to encourage hydrolysis of cellulose biomass so that the active site is reduced as a place of adsorption (Jawad et al., 2020). Based on the explanation above, using biomass waste (biowaste) such as modified LLB can increase the economic value of waste and become a solution to the management of agricultural solid waste and textile industry waste so that the concept of zero waste is achieved.
4 Conclusion
Based on the research that has been done, CA-LLB condition in absorbing MB was obtained at pH 10, MB concentration 1400 mg/L, contact time 75 min, and biosorbent heating temperature 75 °C. The CA-LLB adsorption process followed the Langmuir isotherm model and pseudo-second-order kinetics model, where MB molecules formed a single layer on the surface of the biosorbent and chemical interactions occurred during adsorption. Adsorption thermodynamic studies showed that the uptake of MB by CA-LLB was spontaneous and exothermic. Boehm's titration analysis showed an increase in the hydroxyl, carboxyl, and lactone functional groups of LLB after being modified with citric acid. FTIR and SEM-EDX analysis showed the involvement of functional groups and the presence of a pore filling pattern by MB molecules. The characterization results show that the MB adsorption mechanism occurs through electrostatic interactions, cation exchange, stacking interactions, and pore filling on the CA-LLB surface. The TGA thermogram showed that CA-LLB was heat stable and decomposed in three cycles. CA-LLB has good reusability using 30 % acetic acid as a desorption agent. The optimum adsorption condition was implemented in wastewater with 95.79 % MB removal efficiency using CA-LLB. Modifying LLB using citric acid increased the adsorption capacity of MB, where the adsorption capacity increased from 43.1556 mg g−1 to 122.1211 mg g−1. Therefore, CA-LLB has the potential as an applicable and environmentally friendly biosorbent to absorb MB.
Acknowledgements
This research has been funded by Andalas University in accordance with the letter assignment RPBQ Number: T/6/UN.16.17/PT.01.03/IS-RPBQ/2022, the fiscal year 2022.
Declaration of Competing Interest
The authors declare that they have no known competing financial interests or personal relationships that could have appeared to influence the work reported in this paper.
References
- Investigation of seeds and peels of citrullus colocynthis as efficient natural adsorbent for methylene blue dye. Processes. 2021;9:9081279.
- [CrossRef] [Google Scholar]
- Guidelines for the use and interpretation of adsorption isotherm models: a review. J. Hazard. Mater.. 2020;393
- [CrossRef] [Google Scholar]
- Determination of Point of Zero Charge (PZC) of concrete particles adsorbents. IOP Conf. Ser. Mater. Sci. Eng.. 2021;1184:12004.
- [CrossRef] [Google Scholar]
- Use of cellulose-based wastes for adsorption of dyes from aqueous solutions. J. Hazard. Mater.. 2002;92:263-274.
- [CrossRef] [Google Scholar]
- Bioremoval of methyl orange dye using durian fruit (Durio zibethinus) Murr seeds as biosorbent. J. Chem. Pharm. Res.. 2015;7:589-599.
- [Google Scholar]
- Study on the adsorption of dyestuffs with different properties by sludge-rice husk biochar: adsorption capacity, isotherm, kinetic, thermodynamics and mechanism. J. Mol. Liq.. 2019;285:62-74.
- [CrossRef] [Google Scholar]
- Adsorption of reactive dyes on lignocellulosic waste; characterization, equilibrium, kinetic and thermodynamic studies. J. Clean. Prod.. 2019;225:1220-1229.
- [CrossRef] [Google Scholar]
- Insight into the adsorption mechanisms of methylene blue and chromium(III) from aqueous solution onto pomelo fruit peel. RSC Adv.. 2019;9:25847-25860.
- [CrossRef] [Google Scholar]
- Optimization of methylene blue removal by stable emulsified liquid membrane using plackett–burman and box–behnken designs of experiments. R. Soc. Open Sci.. 2018;5:171220
- [CrossRef] [Google Scholar]
- Adsorption of Methylene Blue by ultrasonic surface modified chitin. J. Colloid Interface Sci.. 2015;446:133-140.
- [CrossRef] [Google Scholar]
- Modification and characterization of Nano cellulose crystalline from Eichhornia crassipes using citric acid: an adsorption study. Carbohydr. Polym.. 2020;240:116202
- [CrossRef] [Google Scholar]
- Novel citric acid-functionalized brown algae with a high removal efficiency of crystal violet dye from colored wastewaters: insights into equilibrium, adsorption mechanism, and reusability. Int. J. Phytoremediation. 2021;23:336-346.
- [CrossRef] [Google Scholar]
- Effectiveness of alkali-acid treatment in enhancement the adsorption capacity for rice straw: the removal of methylene blue dye. ISRN Phys. Chem.. 2013;2013:1-15.
- [CrossRef] [Google Scholar]
- Modelling for removal of cr(vi) and pb(ii) using sago bark (metroxylon sagu) by fixed-bed column method. Egypt. J. Chem.. 2021;64:3981-3989.
- [CrossRef] [Google Scholar]
- Surface modification of cellulose from oat hull with citric acid using ultrasonication and reactive extrusion assisted processes. Polysaccharides. 2021;2:218-233.
- [Google Scholar]
- Biosorption of indigo carmine from aqueous solution by Terminalia Catappa shell. J. Environ. Chem. Eng.. 2020;8:104290
- [CrossRef] [Google Scholar]
- Terminalia catappa shell as low-cost biosorbent for the removal of methylene blue from aqueous solutions. J. Ind. Eng. Chem.. 2021;97:188-199.
- [CrossRef] [Google Scholar]
- Esterification of sugarcane bagasse by citric acid for Pb2+ adsorption: effect of different chemical pretreatment methods. Environ. Sci. Pollut. Res.. 2021;28:11869-11881.
- [CrossRef] [Google Scholar]
- Agricultural pea waste as a low-cost pollutant biosorbent for methylene blue removal: adsorption kinetics, isotherm and thermodynamic studies. Biomass Convers. Biorefinery 2022
- [CrossRef] [Google Scholar]
- Application of Dubinin-Radushkevich isotherm model at the solid/solution interface: a theoretical analysis. J. Mol. Liq.. 2019;277:646-648.
- [CrossRef] [Google Scholar]
- Adsorption of methylene blue dye from the aqueous solution via bio-adsorption in the inverse fluidized-bed adsorption column using the torrefied rice husk. Chemosphere. 2022;287:131907
- [CrossRef] [Google Scholar]
- Methylene Blue adsorption from aqueous solution by activated carbon: Effect of acidic and alkaline solution treatments. J. Environ. Sci. Heal. - Part A Toxic/Hazardous Subst. Environ. Eng.. 2012;45:37-41.
- [CrossRef] [Google Scholar]
- Acid-factionalized biomass material for methylene blue dye removal: a comprehensive adsorption and mechanism study. J. Taibah Univ. Sci.. 2020;14:305-313.
- [CrossRef] [Google Scholar]
- Synthesis of carboxyl-functionalized magnetic nanoparticle for the removal of methylene blue. Colloids Surf. A Physicochem. Eng. Asp.. 2019;572:58-66.
- [CrossRef] [Google Scholar]
- Efficient adsorption of methylene blue and lead ions in aqueous solutions by 5-sulfosalicylic acid modified lignin. Int. J. Biol. Macromol.. 2019;123:50-58.
- [CrossRef] [Google Scholar]
- Point of zero charge: Role in pyromorphite formation and bioaccessibility of lead and arsenic in phosphate-amended soils. Soil Syst.. 2018;2:1-19.
- [CrossRef] [Google Scholar]
- High efficiency of natural Safiot Clay to remove industrial dyes from aqueous media: Kinetic, isotherm adsorption and thermodynamic studies. Biointerface Res. Appl. Chem.. 2021;11:12717-12731.
- [CrossRef] [Google Scholar]
- Removal of methylene blue dye from aqueous solution using citric acid modified apricot stone. Chem. Eng. Commun. 2021:2009812.
- [CrossRef] [Google Scholar]
- Crosslinked carboxymethyl sago starch/citric acid hydrogel for sorption of pb2+, cu2+, ni2+ and zn2+ from aqueous solution. Polymers (Basel).. 2020;12:1-21.
- [CrossRef] [Google Scholar]
- Effect of contact time adsorption of rhodamine b, methyl orange and methylene blue colours on langsat shell with batch methods. J. Phys. Conf. Ser.. 2021;1788:12008.
- [CrossRef] [Google Scholar]
- Rice husk as biosorbent for the adsorption of methylene Blue. Sci. World J.. 2019;14:1-13.
- [Google Scholar]
- Studies on dye biosorption enhancement by chemically modified Fucus vesiculosus, Spirulina maxima and Chlorella pyrenoidosa algae. J. Clean. Prod.. 2019;240:118197
- [CrossRef] [Google Scholar]
- Modification of corncob with citric acid to enhance its capacity for adsorbing cadmium(II) from water solution. Chem. Eng. J.. 2012;180:113-120.
- [CrossRef] [Google Scholar]
- Removal behavior of methylene blue from aqueous solution by tea waste: Kinetics, isotherms and mechanism. Int. J. Environ. Res. Public Health. 2018;15:15071321.
- [CrossRef] [Google Scholar]
- A modified method for enhancing adsorption capability of banana pseudostem biochar towards methylene blue at low temperature. Bioresour. Technol.. 2019;282:48-55.
- [CrossRef] [Google Scholar]
- Activated biomass of the green microalga chlamydomonas variabilis as an efficient biosorbent to remove methylene blue dye from aqueous solutions. Water SA. 2019;45:20-28.
- [CrossRef] [Google Scholar]
- Removal of methylene blue using low cost adsorbent: a review. Res. J. Chem. Sci.. 2014;4:91-102.
- [Google Scholar]
- Methylene blue removal from aqueous solutions by activated carbon prepared from N. Microphyllum (AC-NM): RSM analysis, isotherms and kinetic studies. Glob. Nest J.. 2017;19:697-705.
- [CrossRef] [Google Scholar]
- Removal of methylene blue from aqueous medium by citrate modified bagasse: kinetic, Equilibrium and Thermodynamic study. Bioresour. Technol. Rep.. 2020;11:100463
- [CrossRef] [Google Scholar]
- Process development for the degradation of textile azo dyes (mono-, di-, poly-) by advanced oxidation process - Ozonation: Experimental & partial derivative modelling approach. J. Environ. Manage.. 2020;265:110397
- [CrossRef] [Google Scholar]
- Eriobotrya japonica seed biocomposite efficiency for copper adsorption: Isotherms, kinetics, thermodynamic and desorption studies. J. Environ. Manage.. 2016;176:21-33.
- [CrossRef] [Google Scholar]
- A theoretical and experimental study on esterification of citric acid with the primary alcohols and the hydroxyl groups of cellulose chain (n = 1–2) in parched condition. J. Chem.. 2020;2020
- [CrossRef] [Google Scholar]
- Fe3O4@NiO core–shell magnetic nanoparticle for highly efficient removal of Alizarin red S anionic dye. Int. J. Environ. Sci. Technol.. 2021;19:2899-2912.
- [CrossRef] [Google Scholar]
- Enhanced adsorption capacity of designed bentonite and alginate beads for the effective removal of methylene blue. Appl. Clay Sci.. 2019;169:102-111.
- [CrossRef] [Google Scholar]
- Preparation of activated carbon from Dipterocarpus alatus fruit and its application for methylene blue adsorption. RSC Adv.. 2020;10:21082-21091.
- [CrossRef] [Google Scholar]
- Adsorption of toxic crystal violet dye from aqueous solution by using waste sugarcane leaf-based activated carbon: isotherm, kinetic and thermodynamic study. J. Iran. Chem. Soc.. 2022;19:2891-2906.
- [CrossRef] [Google Scholar]
- Novel cellulose-based biosorbent from lemongrass leaf combined with cellulose acetate for adsorption of crystal violet. Int. J. Biol. Macromol.. 2020;156:762-772.
- [CrossRef] [Google Scholar]
- Degradation and mineralization of violet-3B dye using C-N-codoped TiO2 photocatalyst. Environ. Eng. Res.. 2020;25:529-535.
- [CrossRef] [Google Scholar]
- Equilibrium, kinetic, and thermodynamic applications for methylene blue removal using Buxus sempervirens leaf powder as a powerful low-cost adsorbent. JPST. 2020;5:161-170.
- [CrossRef] [Google Scholar]
- Methylene blue removal from water using H2SO4 crosslinked magnetic chitosan nanocomposite beads. Microchem. J.. 2019;144:397-402.
- [CrossRef] [Google Scholar]
- Isolation of chitosan from shrimp shell (Metapenaeus monoceros) as adsorbent for removal of metanil yellow dyes. J. Iran. Chem. Soc.. 2022;19:1369-1383.
- [CrossRef] [Google Scholar]
- Shrimp shell (Metapenaeus monoceros) waste as a low-cost adsorbent for metanil yellow dye removal in aqueous solution. Desalin. Water Treat.. 2020;197:413-423.
- [CrossRef] [Google Scholar]
- Adsorption of methylene blue on chemically modified lychee seed biochar: dynamic, equilibrium, and thermodynamic study. J. Mol. Liq.. 2020;315:113743
- [CrossRef] [Google Scholar]
- Citric acid modified kenaf core fibres for removal of methylene blue from aqueous solution. Bioresour. Technol.. 2011;102:7237-7243.
- [CrossRef] [Google Scholar]
- Equilibrium, kinetic, and thermodynamic studies of cationic dyes adsorption on corn stalks modified by citric acid. Colloids Interfaces. 2021;5
- [CrossRef] [Google Scholar]
- Facile synthesis and characterization of Fe2O3 nanoparticles using L-lysine and L-serine for efficient photocatalytic degradation of methylene blue dye. Arab. J. Chem.. 2022;15:103613
- [CrossRef] [Google Scholar]
- Citric acid modified waste cigarette filters for adsorptive removal of methylene blue dye from aqueous solution. J. Appl. Polym. Sci.. 2021;138:1-12.
- [CrossRef] [Google Scholar]
- Adsorptive removal of methylene blue by tea waste. J. Hazard. Mater.. 2009;164:53-60.
- [CrossRef] [Google Scholar]
- A potential low cost adsorbent for the removal of cationic dyes from aqueous solutions. Appl. Water Sci.. 2017;7:2831-2842.
- [CrossRef] [Google Scholar]
- Adsorption and recovery of hexavalent chromium from tannery wastewater over magnetic max phase composite. Sep. Sci. Technol.. 2021;56:439-452.
- [CrossRef] [Google Scholar]
- Surface acidity of sulfuric acid activated maredan clay catalysts with boehm titration method and pyridine adsorption-FTIR. J. Phys. Conf. Ser.. 2019;1351
- [CrossRef] [Google Scholar]
- Wibowo, D., Setyadhi, L., Ismadji, S., 2006. Modification of The Surface Chemistry of Activated Carbon and Its Influence on Methylene Blue Adsorption, pp. 374 – 384, 2006. J. Tek. Kim. Indones. 374–384.
- Lemongrass: a review on its botany, properties, applications and active components. ijcbs. 2016;9:79-84.
- [Google Scholar]
- Characterization and coagulation-flocculation performance of a composite flocculant in high-turbidity drinking water treatment. Chemosphere. 2018;206:701-708.
- [CrossRef] [Google Scholar]
- Enhanced adsorption of methylene blue by citric acid modification of biochar derived from water hyacinth (Eichornia crassipes) Environ. Sci. Pollut. Res.. 2016;23:23606-23618.
- [CrossRef] [Google Scholar]
- Adsorption kinetics and isotherms for the removal of nickel ions from aqueous solutions by an ion-exchange resin: application of two and three parameter isotherm models. Desalin. Water Treat.. 2016;57:21925-21938.
- [CrossRef] [Google Scholar]
- Adsorption of cationic methylene blue dye using microwave-assisted activated carbon derived from acacia wood: optimization and batch studies. Arab. J. Chem.. 2021;14:103122
- [CrossRef] [Google Scholar]
- Modification of rice husk silica with bovine serum albumin (BSA) for improvement in adsorption of metanil yellow dye. J. Iran. Chem. Soc.. 2020;17:2599-2612.
- [CrossRef] [Google Scholar]
- Lemongrass (Cymbopogon nardus) leaves biowaste as an effective and low-cost adsorbent for methylene blue dyes removal: isotherms, kinetics, and thermodynamics studies. Sep. Sci. Technol.. 2022;57:2341-2357.
- [CrossRef] [Google Scholar]
- Adsorption of divalent heavy metal ions from aqueous solution by citric acid modified Pine Sawdust. Sep. Sci. Technol.. 2015;50:245-252.
- [CrossRef] [Google Scholar]
- Characterization of modified sawdust, kinetic and equilibrium study about methylene blue adsorption in batch mode. Korean J. Chem. Eng.. 2013;30:111-122.
- [CrossRef] [Google Scholar]


