

Translate this page into:
Evaluation of a novel EphA2 targeting peptide for triple negative breast cancer based on radionuclide molecular imaging
⁎Corresponding authors. ghhou@sdu.edu.cn (Guihua Hou), rggaofeng@sdu.edu.cn (Feng Gao)
-
Received: ,
Accepted: ,
This article was originally published by Elsevier and was migrated to Scientific Scholar after the change of Publisher.
Abstract
A new strategy for the early diagnosis of triple-negative breast cancer (TNBC) is urgently needed however specific targets are lacking. EphA2 has been reported to be over-expressed in a variety of tumors, including TNBC, and is closely related to tumor progression. In this study, we designed a novel peptide, SD01, and tested its potential in the diagnosis of TNBC. FITC-SD01 and FITC-YSA were prepared and found to bind to the 4T1 TNBC cell line, the former showing greater affinity. 125I-SD01 and 125I-YSA were obtained with high radiochemical yield and radiochemical purity, and both showed a high binding affinity to 4T1 cells, with a higher Bmax in 125I-SD01. Whole-body phosphoautoradiography showed clearer imaging of tumors in the group of 125I-SD01 than in 125I-YSA. Biodistribution demonstrated higher tumor accumulation in the 125I-SD01 group. In group of 125I-SD01, the tumor to the opposite muscle tissue (T/NT) ratio was 5.998 ± 0.37, in contrast to 4.69 ± 0.18 in 125I-YSA group. Our results indicated that 125I-SD01 could selectively and specifically target 4T1 cells in vitro and in vivo, and showed higher binding affinity and better imaging compared to 125I-YSA. Therefore, SD01 was deemed to be a novel peptide with more favorable properties in terms of targeting EphA2.
Keywords
Peptide
EphA2
TNBC
Radionuclide
Molecular imaging

1 Introduction
Breast cancer is the most common malignant tumor in women; triple negative breast cancer (TNBC) accounts for approximately 15–20 % of breast cancers (Siegel et al., 2022; Jabbarzadeh Kaboli et al., 2022). Compared with non-TNBC, TNBC is associated with high metastasis and recurrence rates, poor prognosis, and lacks an effective targeted therapy (Vagia et al., 2020; Sharma et al., 2020). Chemotherapy is still the mainstay of treatment, limiting treatment options, especially for patients in advanced stages of the disease (Jhan and Andrechek, 2017). Therefore, we urgently need novel targets that can be reliably used as part of the early diagnosis of TNBC.
Eph receptors are the largest family of receptor tyrosine kinases (RTK) (Herath and Boyd, 2010). Among the 14 identified Eph receptors, EphA2 is most closely related to the poor prognosis associated with tumors (O'Malley et al., 2012; Hou et al., 2012; Liu et al., 2020; Huang et al., 2017). EphA2 is upregulated in multiple aggressive cancers, such as lung cancer, breast cancer, ovarian cancer, prostate cancer, etc.; its expression in normal, fully-differentiated tissues is inhibited (Amato et al., 2016; Youngblood et al., 2016; Gambini et al., 2018; Park et al., 2013; Salem et al., 2020). Therefore, EphA2 has emerged as a specific target for tumor imaging and therapy (Zhao et al., 2021). EphA2 is closely related to the proliferation, invasion, and metastasis of TNBC (Salem et al., 2020; Brantley-Sieders et al., 2008; Okuyama et al., 2020; Song et al., 2017; Torres-Adorno et al., 2019).
Molecular imaging may be used to assess targetability. The tracer, which recognizes a corresponding molecule, plays a pivotal role in such imaging. Various targeting-probe of breast cancer have been reported, and include peptides, antibodies, and antibody fragments (Li et al., 2021). Compared with antibodies, peptides show faster uptake and clearance from the blood and can reach the tumor sites rapidly while still retaining low nanomolar binding affinities; moreover, peptides are usually non-immunogenic (Olberg and Hjelstuen, 2010; Richter and Wuest, 2014). At present, the SWL (SWLAYPGAVSYR) and YSA (YSAYPDSVPMMS) peptides have been identified to specifically target EphA2 (Zeng et al., 2021). For example, radiolabeled SWL peptide was developed by labeling SWL peptide with Fluorine-18. However, the cell association experiments did not reveal a specific binding or uptake of the radiolabeled peptide (Pretze et al., 2014). YSA has been reported to deliver chemotherapeutic drugs to EphA2-positive cancer cells (Wang et al., 2012). Cyclic peptides were reported with enhanced conformal rigidity of the backbones with potentially greater activity than linear peptides including higher metabolic stability, stronger affinity, and more binding sites (Konieczny et al., 2021; Wang et al., 2021; Li and Wei, 2017; Gunasekera et al., 2018; Chan et al., 2021). However, no EphA2 targeting cyclic peptide tracer was reported. Compared with SWL, YSA shows higher affinity to EphA2 (Koolpe et al., 2002). Thus far, no YSA peptide has been reported in TNBC molecular imaging. Thus, in this study, we designed the cyclic peptide SD01; with YSA as the control peptide. These two peptides were verified to specifically bind with EphA2 in 4T1 cells in vitro. Then novel peptide-based tracers, 125I-labeled SD01 and 125I-labeled YSA, were developed to allow whole-body phosphoautoradiography imaging in TNBC tumor-bearing mice. Their ability to specifically target EphA2-positive TNBC tumors in vivo was investigated. The in vitro and in vivo results show that compared to YSA, SD01 shows more favorable properties in terms of targeting EphA2.
2 Materials and methods
2.1 Preparation and identification of SD01 and YSA
The SD01 peptide, targeting the membrane protein EphA2 was designed with a sequence of Tyr-Ser-Ala-cyclo (Lys-Tyr-Pro-Asp-Ser-Val-Pro-Met-Met-Ser); the YSA sequence was previously already validated. Peptides SD01 and YSA were prepared with solid-phase peptide synthesis (SPPs) by an automated peptide synthesizer, purified by semi-preparative High-Performance Liquid Chromatography (HPLC) and characterized by Mass Spectrometry (MS). The HPLC column and elution conditions were used as follows:
For SD01. Column: 4.6*250 mm, Diamonsil C18 5 μm; Solvent A: 0.1 % trifluoracetic in 100 % acetonitrile; Solvent B: 0.1 % trifluoracetic in 100 % water;
Gradient:
Time (min)
A (%)
B (%)
Flow rate (ml/min)
0
24
76
1
25
49
51
1
25.1
100
0
1
30
stop
Gradient:
Time (min)
A (%)
B (%)
Flow rate (ml/min)
0
18
82
1
25
43
57
1
25.1
100
0
1
30
stop
2.2 Cell culture
Murine TNBC cell lines 4T1 and EMT6 were purchased from the American Type Culture Collection (ATCC) and preserved by the Research Center for Experimental Nuclear Medicine of Shandong University, China. The cells were cultured in RPMI-1640 medium supplemented with 10 % fetal bovine serum (FBS; Sigma) and 1 % penicillin/ streptomycin (Hyclone) at 37 °C with 5 % CO2 and saturated humidity.
2.3 Determination of EphA2 expression
EphA2 protein was quantified using Western blot. Whole-cell protein extracts from 4T1 and EMT6 cells were prepared using RIPA lysis buffer (Servicebio). Equal amounts of protein (20 μg) were subjected to Western blot. Proteins were resolved and transferred onto nitrocellulose membranes. After blocking nonspecific binding, the membranes were incubated with primary antibodies, followed by secondary antibody (Abways), then ECL western blotting substrate (Servicebio). The primary antibodies used in this study were EphA2 mAb (1:1000) (CST) or β-Actin pAb (1:1000) (Abcam). Finally, the membranes were visualized by a TANON 4200 imaging system and quantitatively analyzed using Image J software.
The expression of EphA2 mRNA was detected by semi-quantitative reverse transcription (RT)-PCR. Total RNA from 4T1 and EMT6 cells was isolated using TRIzol ®reagent (Invitrogen; Thermo Fisher Scientific, Inc.). cDNA templates were synthesized using TransScrip® First-Strand cDNA Synthesis SuperMix Kit (Beijing full Gold Biology Co., ltd.). PCR amplification was performed according to the instructions of an EasyTaq PCR kit (Beijing full Golden Biology Co., ltd.). The following primers were used: EphA2 forward, 5′-GCACAGGAAAGGAAGTTGTT-3′ and reverse, 5′-CATGTAGATAGGCATGTCGTCC-3′. GAPDH forward, 5′-GGAGCGAGATCCCTCCAAAAT-3′ and reverse, 5′-GGCTGTTGTCATACTTCTCTCATGG-3′. PCR products were electrophoresed in agarose gels and then scanned on a UV analyzer. Band density was analyzed and quantified using Image J software.
2.4 Establishment of the tumor-bearing mice model
Female BALB/c mice, aged 6 to 8 weeks, were provided by Beijing Vital River Laboratory Animal Technology Co., ltd. 4T1 or EMT6 cells were obtained using 0.25 % trypsin and suspended in phosphate-buffered saline (PBS, 0.01 M, pH 7.4). Each mouse was subcutaneously injected with 3 × 10⁵ cells in 100 μL over the right scapula. Mice were fed with a routine diet, and the tumor size and body weight were monitored daily. Analyses were conducted when the tumor grew to a diameter of approximately 10 mm.
2.5 H&E and immunohistochemical staining
Tumors were isolated from 4T1 and EMT6 tumor-bearing mice, fixed and preserved with 4 % paraformaldehyde, dehydrated and then embedded in paraffin for sectioning. Hematoxylin-eosin (H&E) staining was performed according to the kit manufacturer’s instructions. Immunohistochemical staining with EphA2 pAb (Bioss) was performed according to the manufacturer’s instructions. The slides were observed at a magnification of 200 × and 400 ×. Corresponding positive areas of sections were analyzed (5 fields per slide) by Image-Pro Plus software, The IOD (integrated optical density) and its corresponding area were quantified. The AOD (average optical density) value was obtained according to the formula AOD = IOD ÷ area and applied to compare the expression of the target protein.
2.6 Cell uptake of FITC-labeled SD01/YSA
Fluorescein-isothiocyanate-conjugated SD01 (FITC-SD01) and FITC-conjugated YSA (FITC-YSA) were obtained by coupling FITC-NHS with SD01 or YSA. FITC-SD01 and FITC-YSA were also characterized by MS. 4T1 cells (6 × 10⁵/well) were seeded in serum-free RPMI-1640 medium in 12-well plates and incubated overnight. Then the plates were incubated with RPMI-1640 medium containing 1 mM of FITC-SD01 or FITC-YSA. After 10 min, the medium was discarded to remove excess FITC-SD01 and FITC-YSA, and 200 μL/well RPMI-1640 containing DAPI (4′-6-Diamidino-2-phenylindole, Servicebio) was added to each well and incubated for 20 min at 37 °C. Following this, the medium was removed, the cell monolayer was washed with PBS 3 times and then bright field and the corresponding fluorescent field were observed under inverted fluorescence microscopy (EX 475, EM 530, Axio Vert.A1, Zeiss). Fluorescence intensity was measured and analyzed by Image-Pro Plus software.
2.7 Labelling SD01 and YSA with Na125I
The iodogen method was used to label peptides. Briefly, 2 μg of SD01 or YSA was added to 100 μL of 0.05 M phosphate buffer (PB, pH 7.4), followed by the addition of 3.7 MBq of Na125I (China Isotope & Radiation Corporation, Specific Activity 629 GBq/mg); the mixture was incubated for 20 min at room temperature, and then the reaction was stopped by adding 150 μL of 0.05 M PB (pH 7.4) and incubated for another 10 min at room temperature. The labeled compounds were purified with a Hyper-sep C18 column (Thermo Fisher Scientific). Radiochemical purity and stability in normal saline (NS) and fetal bovine serum (FBS) were confirmed by paper chromatography, with a mixture of chloroform and ethanol (V/V:9:1) used as the mobile phase. For determination of lipophilicity of radiolabeled peptides, 5–10 μL radiolabeled peptide (0.1–0.2 MBq) was diluted to a 500 μL volume using HEPES buffer (pH 7.4). 500 μL of n-octanol was added to the solution and the mixture was stirred vigorously for 30 min. Subsequently, the mixture was centrifuged. 450 μL of the water and n-octanol phases were retrieved and centrifuged again. Then the activity in 100 μL of both the HEPES buffer phase and octanol phase was measured using a Gamma counter (CII, WIPE TEST COUNTER, CPAINTEC) and the octanol/water partition coefficient (Log Do/w) was calculated.
2.8 Cell uptake of 125I‐SD01 and 125I‐YSA in 4T1 cells
4T1 cells were seeded in a 24‐well plate at 5 × 10⁵ cells per well. 125I‐SD01 in RPMI-1640 medium at a concentration of 10 nM was added to the plates. Following incubation at room temperature for 5, 10, 20, 30, 60, 90, and 120 min the supernatant was discarded. Cells were washed twice with cold 1 × PBS (0.01 M, pH 7.4, containing 0.1 % BSA) and harvested. The radioactivity in the cells was determined with a Gamma counter. For the dissociation group, after 120 min of incubation, the supernatant was removed and cells were washed twice with ice-cold PBS. Then, fresh RPMI-1640 medium was added and the supernatant was collected at 5, 10, 20, 30, 60, 90, and 120 min. Radioactivity in the supernatant was monitored by using a Gamma counter. For 125I‐YSA, cells were incubated at room temperature for 5, 10, 20, 30, 60, and 90 min for the association; for dissociation, the supernatant was replaced with fresh medium after incubation for 90 min. The dissociation half-life, dissociation constant (Koff), and association constant (Kon) were obtained through GraphPad Prism software; the dissociation constant (Kd) value was determined according to the equation Kd = Koff/Kon.
2.9 Binding assay of 125I‐SD01 and 125I‐YSA to 4T1 cells
4T1 cells were seeded in a 24‐well plate at 5 × 10⁵ cells per well. 125I‐SD01 or 125I‐YSA in RPMI-1640 medium (0–300 nM) was added to the plates, then incubated at room temperature for 2 h. The supernatant was discarded, and cells were washed twice with cold PBS, then harvested. The radioactivity in the cells was detected by using a Gamma counter. Non‐specific binding was evaluated by the presence of excess non‐labelled SD01/YSA (75 μM) in the same wells. The maximum binding ability (Bmax) and dissociation constant (Kd) were obtained through GraphPad Prism software.
2.10 Dynamic Whole-Body Phosphor-Autoradiography
One day before the administration of 125I‐labeled peptides, mice were fed with 3.5 % sodium iodide solution to block thyroid gland uptake of iodine. Tumor-bearing or non-tumor-bearing normal (as Control) BALB/c mice were intravenously injected with 0.37 MBq of 125I‐SD01 or 125I‐YSA through the tail vein. Whole-body dynamic phosphor-autoradiography was performed at 1, 3, 6, 12, and 24 h after the injection. Mice were anesthetized by intraperitoneal injection with 0.6 % pentobarbital sodium (0.1 ml/10 g body weight). Anesthetized mice were placed with their back on the storage phosphor screen plate. After 20 min in the dark, the plate was transferred to the Cyclone Plus scanner (PerkinElmer Life Sciences) for scanning. Semi-quantitative analysis was performed by manually drawing rectangular regions of interest within the target area. Digital light units per square millimeter (DLU/mm2) were obtained using OptiQuant™ Image Analysis Software (PerkinElmer Life Sciences). The tumor was isolated after imaging, and ex vivo tumor phosphor-autoradiography imaging was then performed.
2.11 Ex vivo biodistribution studies
For model or control mice injected with 125I-SD01 or 125I-YSA, biodistribution study was performed at 6 and 12 h post-injection. After the mice were euthanized, tumors, blood, and major tissues/organs of interest (bone, muscle, thyroid, liver, spleen, kidney, stomach, small intestine, lung, and heart) were obtained, weighed, and radioactivity was measured with a Gamma counter. Tissue activity is expressed as the percent injected dose per gram of tissue (%ID/g). The T/NT ratio (target to non-target) was defined as the ratio of radioactivity in the tumor to that in the opposite muscle tissue.
2.12 Statistical analysis
All experiments were repeated three times at least, and the data are expressed as mean ± standard deviation. Means were compared using Student’s t-test. p < 0.05 was considered to indicate a statistically significant difference.
3 Results
3.1 Identification of synthesized SD01 and YSA
The structure of SD01 or YSA is shown in Fig. 1 Fig. 1A is the cyclic peptide while Fig. 1B is a linear peptide. Their quality was assessed using HPLC and MS with the results shown in Fig. 2. The purity of SD01 and YSA was over 95 % (Fig. 2A,2C). MS analysis suggested that the correct structure was present (MS cald for SD01: 1457.66 Da (M+H)+ and for YSA: 1346.55 Da (M+H)+; Fig. 2B,2D). The viability of 4T1 cells did not decreased after treated with SD01 or YSA according to the result of CCK-8 assay, SD01 and YSA had no effect on the cell morphology under microscopy (results showed in Supplementary Fig. 1).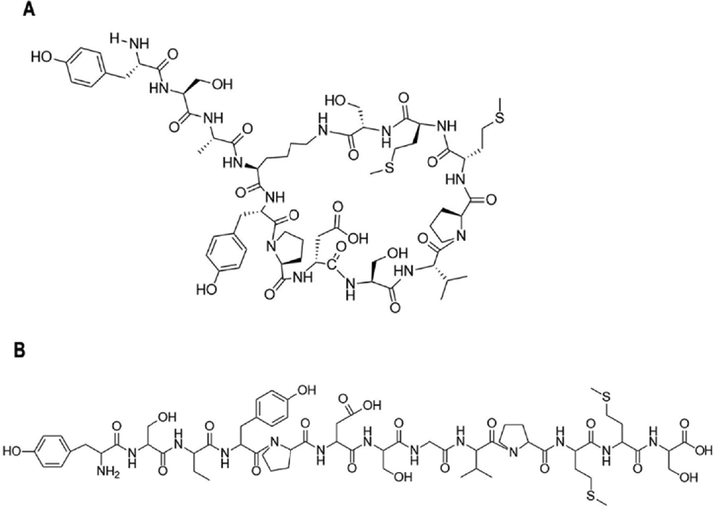
Chemical structure of two kinds of peptides. A. the structure of SD01. B. the structure of YSA.
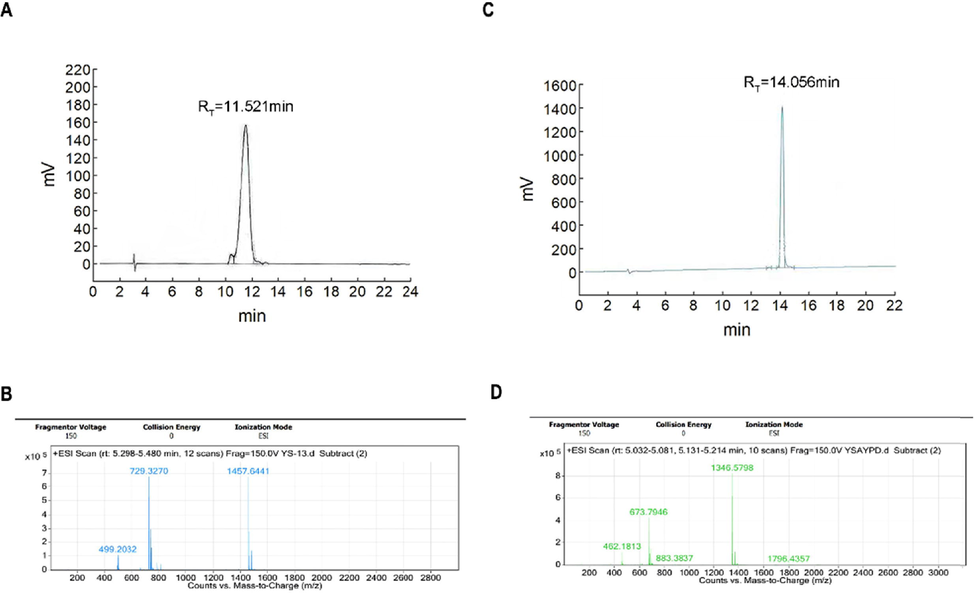
Identification of SD01 and YSA. A. HPLC-UV trace of SD01 at 220 nm channel. B. MS report of SD01. C. HPLC-UV trace of YSA at 220 nm channel. D. MS report of YSA.
3.2 Expression of EphA2 in 4T1 cells
RT-PCR and Western blot were used to confirm the expression of EphA2 in TNBC cells; the results are shown in Fig. 3. Compared with EMT6 cells (also a TNBC cell line), 4T1 cells showed a higher expression of EphA2 mRNA and protein (both p < 0.01).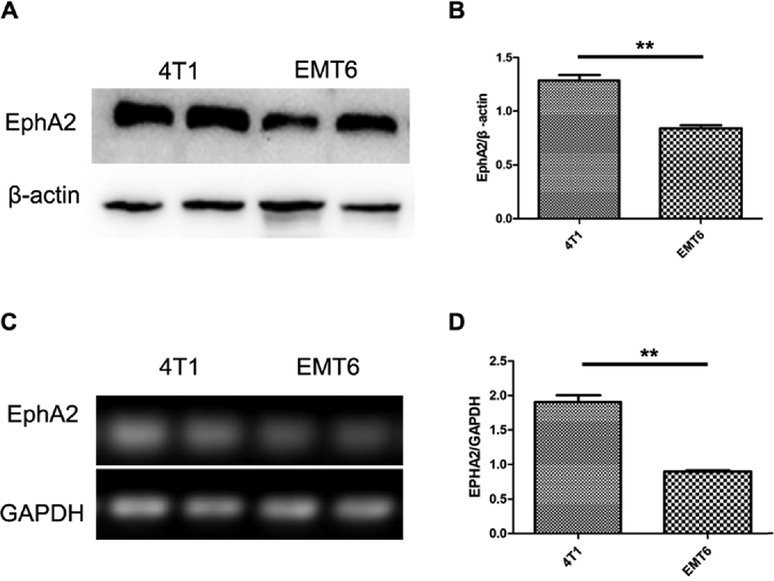
Expression of EphA2 in TNBC cells. A and B. The EphA2 protein expression in 4T1 and EMT6 cells (n = 3). C and D. The EphA2 mRNA expression in 4T1 and EMT6 cells (n = 3). Representative results were from at least three independent experiments, the data were presented as the means ± SD from three independent experiments. **p < 0.01.
3.3 H&E and immunohistochemical staining
To validate the expression of EphA2 in TNBC tumor tissue we performed H&E staining and detected EphA2 with immunohistochemical staining (IHC). The results are shown in Fig. 4. Typical tumor changes were found via H&E staining. IHC staining showed EphA2-positive brown staining on the surface and cytoplasm of tumor cells. The AOD of 4T1 tumors was 0.180 ± 0.006; this was higher than in EMT6 tumors (0.149 ± 0.008; p < 0.05), which suggested the higher expression of EphA2 in 4T1 tumors.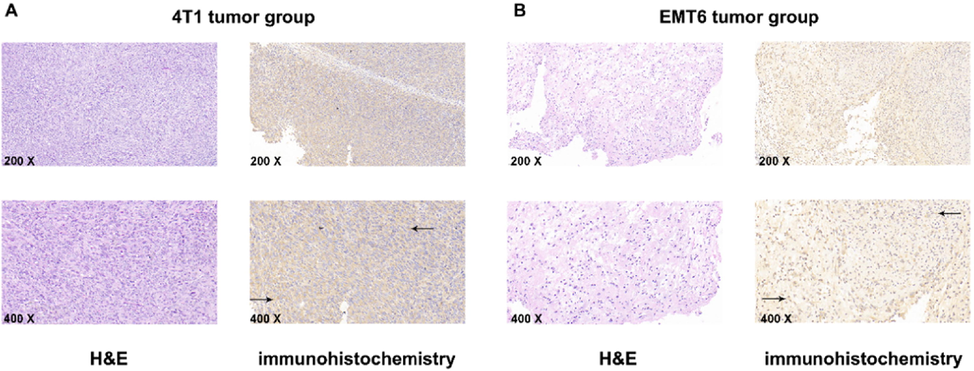
H&E staining and immunohistochemistry staining. A. 4T1 tumors, representative microscopy images (200 × and 400 × ) of H&E and immunohistochemistry staining for EphA2, black arrow refers to the positive area (brown). B. EMT6 tumors, representative microscopy images (200 × and 400 × ) of H&E staining and immunohistochemistry staining for EphA2, black arrow refers to the positive area (brown). Representative result was from five independent experiments.
3.4 Cell uptake of FITC-labeled SD01/YSA
To investigate whether the novel peptide SD01 binds to EphA2 on 4T1 cells, we prepared FITC-labeled SD01 and FITC-YSA. MS analysis suggested the correct structure of FITC-SDO1/YSA (MS cald for FITC-SD01: 1847.09 Da (M+H)+ and for FITC-YSA: 1850.6306 Da (M+TFA+H)+; results showed in Supplementary Fig. 1). As shown in Fig. 5, a strong FITC-SD01 signal was visible to be mainly aggregated on the cell membrane in 4T1 cells. In contrast, a weak signal was observed in 4T1cells with FITC-YSA. The mean fluorescence intensity of FITC-SD01 was 38.01 ± 0.07 and FITC-YSA was 21.45 ± 0.08 (p < 0.01). These results indicated that FITC-SD01 and FITC-YSA bound directly with 4T1 and the binding of FITC-SD01 was better than that of FITC-YSA.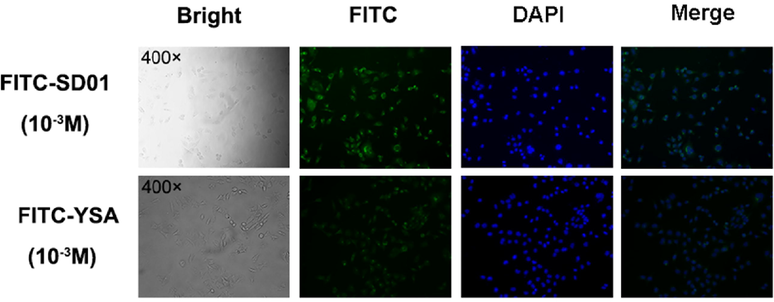
Binding ability of FITC-SD01 and FITC-YSA. Bright field, fluorescence (FITC and DAPI) and corresponding merge images of 4T1 cells. Images of cells under microscope 400 × which were incubated with 10-3 M FITC-SD01 or 10-3 M FITC-YSA. Representative results of three independent experiments were reported.
3.5 In vitro study of 125I-SD01 and 125I-YSA
125I-SD01 and 125I-YSA were successfully prepared with labeling rates over 85 % and radiochemical purity above 95 %. In vitro stability study showed that both tracers were stable over 24 h in fetal bovine serum (FBS) (>95 %) and normal saline (>85 %) (Fig. 6A). Log Do/w was found to be −1.64 ± 0.01 for 125I-SD01 and −1.45 ± 0.01 for 125I-YSA, showing that these two tracers are hydrophilic; 125I-SD01 was slightly more hydrophilic than 125I-YSA (p < 0.01).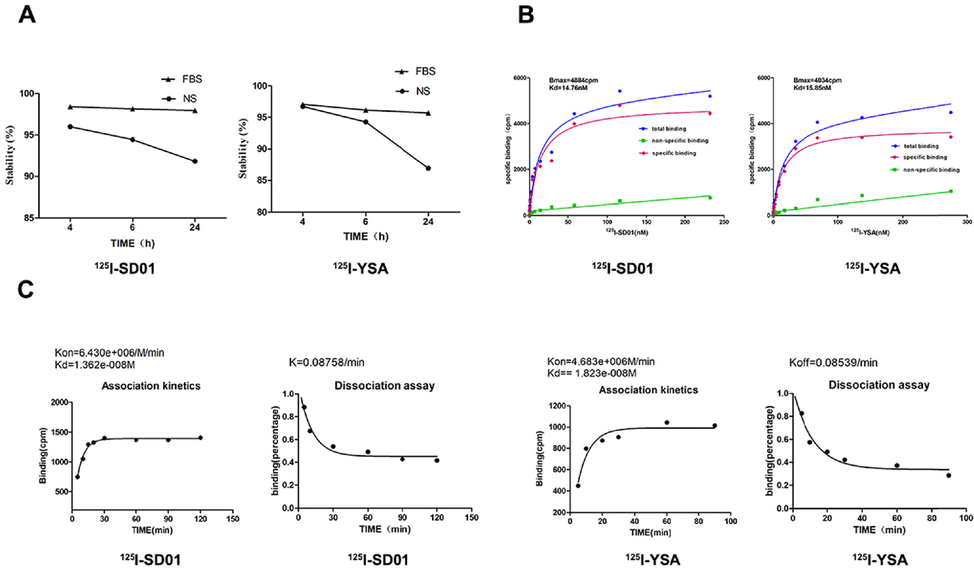
In vitro study of 125I-SD01 and 125I-YSA. A. Stability of 125I-SD01/YSA in FBS and NS changes over time. B and C. In vitro evaluation of prepared radiolabeled tracers. Representative saturation binding curve of 125I-SD01/YSA binding to 4T1 cells (B). Representative association and dissociation kinetics curve of 125I-SD01/YSA binding to 4T1 cells (C). The data were presented as the means ± SD (n = 3) from three independent experiments.
The uptake of 125I-SD01/YSA by 4T1 cells suggested a rapid association and dissociation (Fig. 6C). The maximal 125I-SD01 binding was achieved after 120 min. The dissociation half-life was 7.914 min, with Kon of 6.430 × 10⁶ M−1min−1 and Koff of 0.08758 min−1. While maximal 125I-YSA binding was achieved after 90 min, the dissociation half-life was 8.117 min, with Kon of 4.683 × 10⁶ M−1min−1 and Koff of 0.08539 min−1. Kinetic binding experiments suggested that these two radio-tracers possess similar association and dissociation constants, and both reached equilibrium similarly quickly. The calculated Kd value for 125I-SD01 was 13.62 nM while for 125I-YSA was 18.23 nM.
To evaluate the affinity of 125I-SD01/YSA to their receptor EphA2, saturation binding experiments were performed in the 4T1 cell line. The Kd value of 125I-SD01 was 14.76 nM and the Bmax value was 4884 cpm. The Kd value of 125I-YSA was found to be 15.85 nM and the Bmax value was 4034 cpm. (Fig. 6B). These data indicated that 125I-SD01 and 125I-YSA can specifically bind to EphA2-positive 4T1 cells, and the former showed a higher binding capacity, but with a similar affinity to EphA2.
3.6 Dynamic Whole body phosphorautoradiography
To further understand whether these tracers target EphA2 in vivo, we performed whole body phosphorautoradiography on 4T1 tumor-bearing and control mice (Fig. 7A). The highest radioactivity uptake in the tumor was found at 12 h after tracer injection. For the isolated tumor ex vivo imaging at 6 and 12 h, much higher activity was found in the 125I-SD01 than the 125I-YSA group (Fig. 7B, 7C). Tumors in the 125I-SD01 group exhibited higher uptake at all time points compared with the 125I-YSA group. At 6 and 12 h, radioactivity DLU (digital light units)/mm2 of tumor area reached 1.50 ± 0.05 × 10⁵ and 1.75 ± 0.15 × 10⁵ for the 125I-SD01 group, 1.33 ± 0.05 × 10⁵ and 1.38 ± 0.07 × 10⁵ for the 125I-YSA group (Fig. 7C) (both p < 0.05). The in vivo radioactivity ratio (digit light units per mm2 from tumor to contralateral equivalent area) at 6 and 12 h was observed to be higher in the 125I-SD01 group (1.47 ± 0.04 and 1.84 ± 0.22 for 125I-SD01 group; 1.36 ± 0.03 and 1.39 ± 0.02 for 125I-YSA group), (both p < 0.01), confirming that 125I-SD01 was a better tracer for monitoring EphA2 expression and SD01 offers promise for TNBC.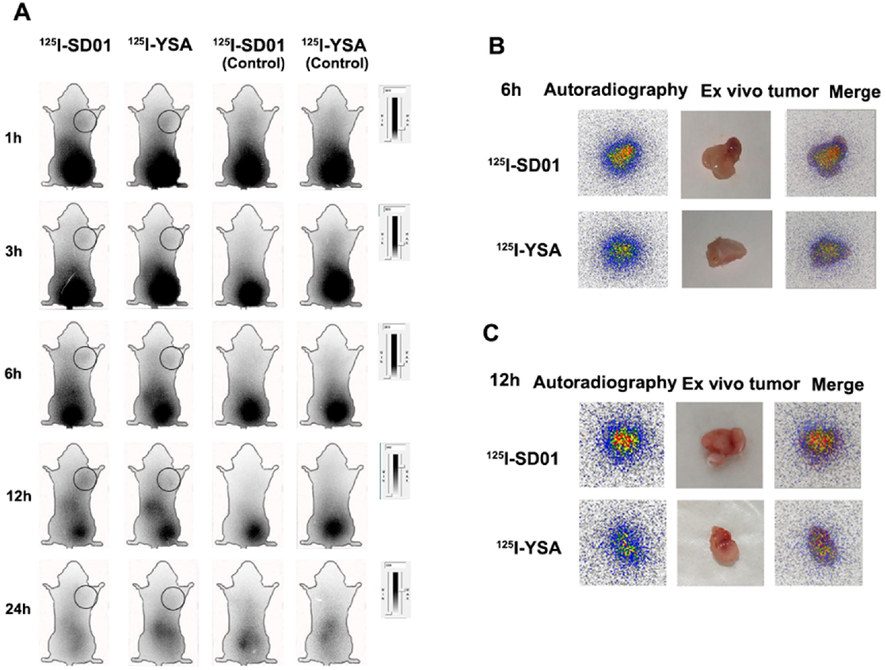
Whole-body /ex vivo phosphor-autoradiography after injection of 125I-SD01/YSA. A. Images at 1, 3, 6,12and 24 h after injection of 125I-SD01/YSA, and black circle refers to the tumor. B. Ex vivo imaging of isolated tumor at 6 h. B. Ex vivo imaging of isolated tumor at 12 h.
3.7 Biodistribution of 125I-SD01 and 125I-YSA.
The tissue radioactivity (%ID/g) for group of 125I-SD01 and 125I-YSA in 4T1 tumor-bearing and control mice at 6 and 12 h post-injection is presented in Table 1. At 12 h post-injection, the tumor uptake for the 125I-SD01 group was 2.43 ± 0. 27 % ID/g and 1.79 ± 0.18 %ID/g for the 125I-YSA group. At this time point, the T/NT ratios were 5.99 ± 0.37 (125I-SD01) and 4.69 ± 0.18 (125I-YSA) (both p < 0.05). 125I-SD01 had high accumulation in the tumor and low accumulation in normal tissues. In short, the tumor uptake of 125I-SD01 was higher compared with 125I-YSA at 12 h post-injection. Radioactivity of 125I-SD01 and 125I-YSA was also detected in the liver, spleen, and kidney; the accumulation of both tracers in the kidney was higher than in the liver and spleen, suggesting that these two radiotracers mainly underwent renal clearance. And in non-tumor bearing mice, no apparent radioactivity accumulation was detected. Our results suggested that 125I-SD01 exhibited stronger targeting ability. These results were also found to be consistent with our phosphor-autoradiography imaging data. #The tissue radioactivity for 125I-SD01 and 125I-YSA of 4T1-bearing or normal mice at 6 and 12 h post-injection. The data were presented as the means ± SD (n = 5) from three independent experiments. *p < 0.05, 125I-SD01 vs 125I-YSA.
Tissues
125I-SD01
6 h
125I-YSA
6 h
125I-SD01
12 h
125I-YSA
12 h
125I-SD01
12 h(Control)
125I-YSA
12 h(Control)
Blood
4.61 ± 0.59
4.59 ± 0.07
2.63 ± 0.42
3.08 ± 0.06
3.55 ± 0.28
3.92 ± 0.34
Muscle
0.43 ± 0.08
0.38 ± 0.05
0.26 ± 0.13
0.24 ± 0.08
0.51 ± 0.33
0.33 ± 0.03
Bone
0.52 ± 0.08
0.43 ± 0.08
0.31 ± 0.04
0.43 ± 0.28
0.79 ± 0.20
1.00 ± 0.07
Kidney
6.92 ± 0.66
6.55 ± 0.09
5.97 ± 0.74
4.24 ± 0.35
6.59 ± 1.04
7.24 ± 0.82
Thyroid
Stomach4.06 ± 0.53
10.6 ± 1.303.57 ± 0.62
13.27 ± 1.912.04 ± 0.39
8.85 ± 0.822.48 ± 0.49
11.67 ± 1.552.47 ± 0.58
12.5 ± 1.834.89 ± 0.44
14.05 ± 1.25
Spleen
Liver
Intestine
Heart
Lung
Tumor
T/NT1.44 ± 0.01
1.79 ± 0.05
0.96 ± 0.30
0.68 ± 0.09
1.98 ± 0.07
3.01 ± 0.27
5.20 ± 0.33*2.34 ± 0.22
1.99 ± 0.13
074 ± 0.05
1.27 ± 0.19
1.62 ± 0.14
1.93 ± 0.44
4.24 ± 0.291.00 ± 0.22
0.59 ± 0.34
0.79 ± 0.46
0.64 ± 0.20
1.47 ± 0.30
2.43 ± 0.27
5.99 ± 0.37*1.20 ± 0.16
1.28 ± 0.18
0.93 ± 0.08
0.64 ± 0.10
0.99 ± 0.10
1.78 ± 0.18
4.69 ± 0.181.47 ± 0.33
1.70 ± 0.16
0.99 ± 0.11
0.84 ± 0.05
1.13 ± 0.052.38 ± 0.27
2.48 ± 0.24
0.93 ± 0.08
1.14 ± 0.11
1.64 ± 0.20
4 Discussion
TNBC is usually defined by its lack of expression of estrogen receptor (ER), progesterone receptor (PR), and human epidermal growth factor receptor 2 (HER-2) (Burande et al., 2020). TNBC is the most aggressive type of breast cancer, associated with a poor prognosis, high recurrence risk, short overall survival, and short disease-free survival. These arise from a lack of validated, actionable molecular therapeutic targets highlighting the urgent need to identify relevant specific targets (Fosu-Mensah et al., 2015; Kutlehria et al., 2018; Stovgaard et al., 2018; Li et al., 2020). A targeted molecule with high specificity would provide a basis for the early diagnosis of TNBC, including via imaging techniques.
Eph proteins belong to the superfamily of transmembrane Tyr kinase receptors (Pasquale, 2010). Eph receptors and their ephrin ligands represent an essential communication system that directs cellular processes such as cell repulsion, cell–cell adhesion, cell proliferation, tissue boundary formation, cell migration, and axon guidance (Kania and Klein, 2016). Of these, EphA2 is one of the most widely overexpressed in tumors; downregulating its expression typically inhibits tumorigenicity, supporting its role in cancer malignancy (Hou et al., 2022). Several studies have suggested that EphA2 is overexpressed in breast cancer and that it correlates with a poor prognosis (Brantley-Sieders et al., 2008; Okuyama et al., 2020; Liu et al., 2018). For example, EphA2 overexpression increases the aggressiveness and metastatic potential in preclinical breast cancer models (Brantley-Sieders et al., 2008; Gao et al., 2021; Lévêque et al., 2019). EphA2 overexpression reduces hormone dependence and sensitivity to tamoxifen in breast cancer (Gokmen-Polar et al., 2011). Furthermore, EphA2 contributes to the tumorigenesis of TNBC cells and EphA2 expression constitutes a potential prognostic factor for TNBC patients (Okuyama et al., 2020; Nikas et al., 2022). Hence, EphA2 may offer a promising target for TNBC. In this study, the expression of EphA2 protein was validated in the TNBC cell line 4T1 and EMT6. The expression of EphA2 in 4T1 was significantly higher than that in EMT6. Therefore, we hypothesized that EphA2-targeting molecules could be used to target 4T1 tumors.
In recent years, peptides have shown potential for modulating Eph/ephrin signaling with high selectivity and binding affinity (Noberini et al., 2012). A series of peptides that selectively target the Eph receptors were identified by phage display (Barquilla and Pasquale, 2015). For instance, three antagonistic peptides (KYL, APY, and VTM) that selectively target EphA4 have been characterized, and preclinical studies have been conducted using the KYL peptide (KYLPYWPVLSSL) to target EphA4 in the nervous system (Lamberto et al., 2012). Moreover, radionuclide-labeled peptide probe was also reported for imaging EphA2-positive tumors. For example, a 99mTc labeled SWL-specific peptide selectively targeted the EphA2 receptor (Liu et al., 2014). However, none were trialed in TNBC molecular imaging.
Most of the identified peptides act as antagonists, except for peptides targeting EphA2, which function as agonists that promote receptor activation and internalization (Wang et al., 2012). Of these, YSA is an Ephrin mimetic peptide that selectively targets the EphA2 receptor; it binds to the ephrin-binding domain of EphA2 but not other Eph receptors (Gomez-Soler et al., 2019). Similar to ephrin-A1, which is the physiological ligand for EphA2, the YSA peptide is an agonist capable of activating EphA2 signaling and inhibiting downstream oncogenic signaling pathways (Mitra et al., 2010). Hence, YSA may be used as a selective targeting agent. For example, YSA-modified Doxorubicin-loaded liposomes have been used to deliver cytotoxic drugs into EphA2 expressing osteosarcoma cells, and YSA anchored TMB (MEK inhibitor trametinib)-loaded PEGylated nanoliposomes have improved higher intracellular uptake of melanoma, sensitizing them to chemotherapy (Haghiralsadat et al., 2017; Fu et al., 2019).
Unsurprisingly, considering the comparatively fragile structure of linear peptides and their relatively inferior stability, affinity, and selectivity (Carlini et al., 2022; Haberman et al., 2021), cyclic peptides have gained significance as diagnostic ligands. Cyclic peptides have several advantages including enhanced binding affinity and metabolic stability, such as the RGD peptide and related multimeric radioligands targeting integrin αvβ3 (Fu et al., 2019; Ogawa et al., 2021; Liolios et al., 2021). In this study, we investigated whether the cyclic peptide SD01 could be used for EphA2-targeting TNBC molecular targeting imaging and whether the cyclic peptide could improve stability and biological activity compared with YSA.
The cyclic peptide SD01 was designed, and SD01 and YSA were successfully synthesized and characterized. We noticed that EphA2 was more highly expressed in the 4T1 TNBC cell line, so in vitro studies were performed using 4T1 cells. The cellular uptake of FITC-labeled SD01 or YSA showed that the two peptides bound to 4T1 cells. We also found that the binding ability of FITC-SD01 to EphA2 was higher than FITC-YSA. 125I-SD01 and 125I-YSA were successfully prepared to specifically target EphA2 and the stability of 125I-SD01 in FBS and normal saline was found to be better than 125I-YSA, showing the robustness and stability of the cyclic SD01. Association assay, dissociation assay, and saturation binding experiments showed that 125I-SD01 and 125I-YSA specifically bound to EphA2 in 4T1 cells with a high affinity. The Bmax value showed that 125I-SD01 exhibits a higher binding capacity than 125I-YSA. There was a discrepancy of the Kd value for YSA (Koolpe et al., 2002); the proper explanation was that peptides could be modified with labels (e.g., fluorescent or radioactive probes) to obtain additional biochemical functionalities (Zheng et al., 2014; Rokugawa et al., 2018). From the imaging and biodistribution studies in vivo; 125I-SD01 and 125I-YSA exhibited relatively low accumulation in most normal tissue and organs; tracer accumulation was observed in the tumors at all time points, which showed the selectiveness and specificity of the peptides to the tumor EphA2. We found that compared to the 125I-YSA group, tumor uptake of the radio-labeled 125I-SD01 peptide was higher and showed better tumor imaging. Notably, the T/NT ratio indicated more specific accumulation of 125I-SD01 in the tumor, compared to 125I-YSA. These data suggest that 125I-SD01 possesses favorable characteristics that make it suitable for in vivo imaging of EphA2-positive tumors. Our in vivo and ex vivo results demonstrate that the SD01 peptide is superior to the YSA peptide in terms of EphA2 targeting.
There are some limitations of our study. The tumor/blood ratios were a bit low in the biodistribution study. To address this, we may focus on the optimization of the peptide such as designing multimer derivatives of the peptide to improve its binding affinity or accelerate its clearance from blood. We can also study EphA2 targeting peptides with different radioisotopes that are suitable for clinical application.
5 Conclusion
In conclusion, SD01 was successfully designed and prepared. In vitro and in vivo experiments showed that SD01 and YSA specifically bound to EphA2 in 4T1 cells with a high affinity. Moreover, SD01 exhibited a higher binding capacity than YSA and possessed more advantages in terms of TNBC noninvasive imaging. Accordingly, SD01 is a promising peptide with superior properties for targeting EphA2.
Ethics statement
The animal study was reviewed and approved by the Animal Care and Use Committee of Shandong University with the corresponding ethical approval code (LL-201602040, 2016–2022).
Funding
This research was funded by grants from Natural Science Foundation of Shandong Province (ZR2019MH019, ZR2019BA015).
Acknowledgments
This work gained great support by Core facilities sharing platform of Shandong University.
References
- EPHA2 Blockade Overcomes Acquired Resistance to EGFR Kinase Inhibitors in Lung Cancer. Cancer Res.. 2016;76(2):305-318.
- [Google Scholar]
- Eph receptors and ephrins: therapeutic opportunities. Annu. Rev. Pharmacol. Toxicol.. 2015;55:465-487.
- [Google Scholar]
- The receptor tyrosine kinase EphA2 promotes mammary adenocarcinoma tumorigenesis and metastatic progression in mice by amplifying ErbB2 signaling. J Clin Invest. 2008;118(1):64-78.
- [Google Scholar]
- EGFR Targeted Paclitaxel and Piperine Co-loaded Liposomes for the Treatment of Triple Negative Breast Cancer. AAPS PharmSciTech. 2020;21(5):151.
- [Google Scholar]
- Insights into the Thermally Activated Cyclization Mechanism in a Linear Phenylalanine-Alanine Dipeptide. J. Phys. Chem. B. 2022;126(16):2968-2978.
- [Google Scholar]
- Tuning the Anti-Angiogenic Effect of the P15 Peptide Using Cyclic Trypsin Inhibitor Scaffolds. ACS Chem. Biol.. 2021;16(5):829-837.
- [Google Scholar]
- Advances in small-molecule drug discovery for triple-negative breast cancer. Future Med. Chem.. 2015;7(15):2019-2039.
- [Google Scholar]
- EphA2-Receptor Targeted PEGylated Nanoliposomes for the Treatment of BRAF(V600E) Mutated Parent- and Vemurafenib-Resistant Melanoma. Pharmaceutics. 2019;11(10)
- [Google Scholar]
- Structure-Based Design of Novel EphA2 Agonistic Agents with Nanomolar Affinity in Vitro and in Cell. ACS Chem. Biol.. 2018;13(9):2633-2644.
- [Google Scholar]
- Drug-resistant cancer cell-derived exosomal EphA2 promotes breast cancer metastasis via the EphA2-Ephrin A1 reverse signaling. Cell Death Dis.. 2021;12(5):414.
- [Google Scholar]
- Dual targeting of EphA2 and ER restores tamoxifen sensitivity in ER/EphA2-positive breast cancer. Breast Cancer Res. Treat.. 2011;127(2):375-384.
- [Google Scholar]
- Engineering nanomolar peptide ligands that differentially modulate EphA2 receptor signaling. The Journal of biological chemistry. 2019;294(22):8791-8805.
- [Google Scholar]
- Stabilized Cyclic Peptides as Scavengers of Autoantibodies: Neutralization of Anticitrullinated Protein/Peptide Antibodies in Rheumatoid Arthritis. ACS Chem. Biol.. 2018;13(6):1525-1535.
- [Google Scholar]
- Discovery and Development of Cyclic Peptide Inhibitors of CIB1. ACS Med. Chem. Lett.. 2021;12(11):1832-1839.
- [Google Scholar]
- EphA2 Targeted Doxorubicin-Nanoliposomes for Osteosarcoma Treatment. Pharm. Res.. 2017;34(12):2891-2900.
- [Google Scholar]
- The role of Eph receptors and ephrin ligands in colorectal cancer. Int. J. Cancer. 2010;126(9):2003-2011.
- [Google Scholar]
- Overexpression of EphA2 correlates with epithelial-mesenchymal transition-related proteins in gastric cancer and their prognostic importance for postoperative patients. Medical oncology (Northwood, London, England). 2012;29(4):2691-2700.
- [Google Scholar]
- Physical & Chemical Microwave Ablation (MWA) Enabled by Nonionic MWA Nanosensitizers Repress Incomplete MWA-Arised Liver Tumor Recurrence. ACS Nano 2022
- [Google Scholar]
- miR-302b inhibits tumorigenesis by targeting EphA2 via Wnt/ β-catenin/EMT signaling cascade in gastric cancer. BMC Cancer. 2017;17(1):886.
- [Google Scholar]
- Shedding light on triple-negative breast cancer with Trop2-targeted antibody-drug conjugates. American journal of cancer research. 2022;12(4):1671-1685.
- [Google Scholar]
- Triple-negative breast cancer and the potential for targeted therapy. Pharmacogenomics. 2017;18(17):1595-1609.
- [Google Scholar]
- Mechanisms of ephrin-Eph signalling in development, physiology and disease. Nat. Rev. Mol. Cell Biol.. 2016;17(4):240-256.
- [Google Scholar]
- N-Terminus to Arginine Side-Chain Cyclization of Linear Peptidic Neuropeptide Y Y(4) Receptor Ligands Results in Picomolar Binding Constants. J. Med. Chem.. 2021;64(22):16746-16769.
- [Google Scholar]
- An ephrin mimetic peptide that selectively targets the EphA2 receptor. J. Biol. Chem.. 2002;277(49):46974-46979.
- [Google Scholar]
- Cholecalciferol-PEG Conjugate Based Nanomicelles of Doxorubicin for Treatment of Triple-Negative Breast Cancer. AAPS PharmSciTech. 2018;19(2):792-802.
- [Google Scholar]
- Distinctive binding of three antagonistic peptides to the ephrin-binding pocket of the EphA4 receptor. Biochem. J.. 2012;445(1):47-56.
- [Google Scholar]
- ProNGF increases breast tumor aggressiveness through functional association of TrkA with EphA2. Cancer Lett.. 2019;449:196-206.
- [Google Scholar]
- Trifluridine selectively inhibits cell growth and induces cell apoptosis of triple-negative breast cancer. American journal of cancer research. 2020;10(2):507-522.
- [Google Scholar]
- Radionuclide-Based Imaging of Breast Cancer: State of the Art. Cancers (Basel). 2021;13(21)
- [Google Scholar]
- Conversion of MIG6 peptide from the nonbinder to binder of lung cancer-related EGFR by phosphorylation and cyclization. Artif. Cells Nanomed. Biotechnol.. 2017;45(5):1023-1028.
- [Google Scholar]
- PET Diagnostic Molecules Utilizing Multimeric Cyclic RGD Peptide Analogs for Imaging Integrin α(v)β(3) Receptors. Molecules (Basel, Switzerland). 2021;26(6)
- [Google Scholar]
- (99m)Tc-labeled SWL specific peptide for targeting EphA2 receptor. Nucl. Med. Biol.. 2014;41(6):450-456.
- [Google Scholar]
- microRNA-451a promoter methylation regulated by DNMT3B expedites bladder cancer development via the EPHA2/PI3K/AKT axis. BMC Cancer. 2020;20(1):1019.
- [Google Scholar]
- YSA-conjugated mesoporous silica nanoparticles effectively target EphA2-overexpressing breast cancer cells. Cancer Chemother. Pharmacol.. 2018;81(4):687-695.
- [Google Scholar]
- Structure-activity relationship analysis of peptides targeting the EphA2 receptor. Biochemistry. 2010;49(31):6687-6695.
- [Google Scholar]
- EPHA2, EPHA4, and EPHA7 Expression in Triple-Negative Breast Cancer. Diagnostics (Basel, Switzerland). 2022;12(2)
- [Google Scholar]
- Targeting Eph receptors with peptides and small molecules: progress and challenges. Semin. Cell Dev. Biol.. 2012;23(1):51-57.
- [Google Scholar]
- (68)Ga- and (211)At-Labeled RGD Peptides for Radiotheranostics with Multiradionuclides. Mol. Pharm.. 2021;18(9):3553-3562.
- [Google Scholar]
- EPHA2 antisense RNA modulates EPHA2 mRNA levels in basal-like/triple-negative breast cancer cells. Biochimie. 2020;179:169-180.
- [Google Scholar]
- Labeling strategies of peptides with 18F for positron emission tomography. Curr. Top. Med. Chem.. 2010;10(16):1669-1679.
- [Google Scholar]
- Invasion in follicular thyroid cancer cell lines is mediated by EphA2 and pAkt. Surgery. 2012;152(6):1218-1224.
- [Google Scholar]
- Eph receptors and ephrins in cancer: bidirectional signalling and beyond. Nat. Rev. Cancer. 2010;10(3):165-180.
- [Google Scholar]
- Radiofluorination and first radiopharmacological characterization of a SWLAY peptide-based ligand targeting EphA2. J Labelled Comp Radiopharm. 2014;57(11):660-665.
- [Google Scholar]
- 18F-Labeled Peptides: The Future Is Bright. Molecules (Basel, Switzerland). 2014;19(12):20536-20556.
- [Google Scholar]
- Evaluation of hepatic integrin αvβ3 expression in non-alcoholic steatohepatitis (NASH) model mouse by (18)F-FPP-RGD(2) PET. EJNMMI research. 2018;8(1):40.
- [Google Scholar]
- Prostate Cancer Metastases Are Strongly Inhibited by Agonistic Epha2 Ligands in an Orthotopic Mouse Model. Cancers (Basel). 2020;12(10)
- [Google Scholar]
- Folate-Targeted Cholesterol-Grafted Lipo-Polymeric Nanoparticles for Chemotherapeutic Agent Delivery. AAPS PharmSciTech. 2020;21(7):280.
- [Google Scholar]
- Targeting EphA2 impairs cell cycle progression and growth of basal-like/triple-negative breast cancers. Oncogene. 2017;36(40):5620-5630.
- [Google Scholar]
- Triple negative breast cancer - prognostic role of immune-related factors: a systematic review. Acta oncologica (Stockholm, Sweden). 2018;57(1):74-82.
- [Google Scholar]
- Eicosapentaenoic acid in combination with EPHA2 inhibition shows efficacy in preclinical models of triple-negative breast cancer by disrupting cellular cholesterol efflux. Oncogene. 2019;38(12):2135-2150.
- [Google Scholar]
- Novel targeted system to deliver chemotherapeutic drugs to EphA2-expressing cancer cells. J. Med. Chem.. 2012;55(5):2427-2436.
- [Google Scholar]
- Effect of Flexibility, Lipophilicity, and the Location of Polar Residues on the Passive Membrane Permeability of a Series of Cyclic Decapeptides. J. Med. Chem.. 2021;64(17):12761-12773.
- [Google Scholar]
- The Ephrin-A1/EPHA2 Signaling Axis Regulates Glutamine Metabolism in HER2-Positive Breast Cancer. Cancer Res.. 2016;76(7):1825-1836.
- [Google Scholar]
- HCPT-peptide prodrug with tumor microenvironment -responsive morphology transformable characteristic for boosted bladder tumor chemotherapy. J. Control. Release. 2021;330:715-725.
- [Google Scholar]
- EphA2: A promising therapeutic target in breast cancer. J Genet Genomics. 2021;48(4):261-267.
- [Google Scholar]
- FITC-conjugated cyclic RGD peptides as fluorescent probes for staining integrin αvβ3/αvβ5 in tumor tissues. Bioconjug. Chem.. 2014;25(11):1925-1941.
- [Google Scholar]
Appendix A
Supplementary data
Supplementary data to this article can be found online at https://doi.org/10.1016/j.arabjc.2022.104211.
Appendix A
Supplementary data
The following are the Supplementary data to this article:Supplementary data 1
Supplementary data 1


