

Translate this page into:
Evaluation of corrosion inhibition effect of glycerol stearate on aluminium metal by electrochemical techniques
⁎Corresponding author. thabopesha@yahoo.co.uk (Thabo Pesha)
-
Received: ,
Accepted: ,
This article was originally published by Elsevier and was migrated to Scientific Scholar after the change of Publisher.
Peer review under responsibility of King Saud University.
Abstract
Glycerol stearate (GS) is an effective organic “corrosion inhibitor for the aluminium metal in 1 M hydrochloric acid.” Polarization (PDP) and impedance (EIS) “methods are in proper agreement.” GS adsorption mechanism is well defined by Langmuir isotherm.” Fourier-transform infrared spectroscopy elucidated on the active sites of GS which binds on an aluminium surface.
Abstract
The inhibitory effect of glycerol stearate (GS) on aluminium (Al) metal was examined utilizing weight loss, potentiodynamic polarization (PDP), and electrochemical impedance spectroscopy (EIS) in hydrochloric acid (HCl) solution. Gravimetric analysis, PDP, and impedance spectroscopy were used to calculate the rate of corrosion (EIS). Gravimetric measurement and electrochemical methods both demonstrated that when the inhibitor concentration increased, the corrosion rate decreased. PDP and EIS inhibition effectiveness was best at 50 × 10-5 mol. L-1 glycerol stearate concentration,with 81.1% and 86.1%, respectively. The differences in corrosion potential (Ecorr) values between the blank and inhibitor (GS) concentrations revealed that glycerol stearate acted as a mixed type of corrosion inhibitor. The inhibitors' adsorption on the aluminium surface followed the Langmuir isotherm model. Fourier transform infrared spectroscopy (FTIR) indicated the existence of an adsorption coating on the surface of the aluminium metal. SEM pictures of aluminium demonstrated decreased inhomogeneities in the presence of glycerol stearate.
Keywords
Aluminium metal
Corrosion
Glycerol stearate
Inhibition efficiency
Potentiodynamic study

1 Introduction
Corrosion is defined as the decay of materials by interaction with their environment chemically (Zehra et al., 2022; Xhanari and Finšgar, 2019). Although corrosion is mainly referring to metals, is sometimes implemented in the deterioration of wood, plastics, and concrete. Corrosion costs can be direct (due to the replacement of corroded structures, the implementation and maintenance of corrosion protection, and so on) or indirect (due to the shutdown of production facilities, product and efficiency losses, and so on) (Xhanari and Finšgar, 2019). Corrosion costs have been found in previous research to reach up to 3–5% of the Gross National Product in most developed countries (Xhanari and Finšgar, 2019). The economic factor, in conjunction with security and environmental concerns, has given ongoing impetus for the scientific community to explore novel strategies to lessen the impact of corrosion. In addition, all corrosion reactions are virtually electrochemical (Zehra et al., 2022; Xhanari and Finšgar, 2019; Martin et al., 2013; Soriano and Alfantazi, 2016). At the anodic area, aluminium propagates as an ion into a solution through an anodic reaction. In addition, through oxidation aluminium discharges electrons formed on the metal through a negative charge and avert metal dissolution (Zehra et al., 2022; Xhanari and Finšgar, 2019; Martin et al., 2013; Soriano and Alfantazi, 2016). The aluminium metal nonetheless cannot withstand corrosion continuously (Zehra et al., 2022; Xhanari and Finšgar, 2019). Furthermore, at the highest pH levels, the aluminium defence oxide layer may slowly deteriorate with time subjecting Al metal to corrosion (Martin et al., 2013). The extensive utility of acids for various purposes such as pickling, descaling, acid cleaning, and so forth is done in industrial processes. Although the oxide layer generated on the surface of aluminium protects it in some conditions when exposed to various acidic and alkaline solutions, particularly chloride-containing solutions, the oxide layer is damaged, and the metal corrodes. A variety of ways and combinations of procedures have been used to decrease the corrosion of aluminium and its alloys in various settings. Among the most often investigated protective technologies are anodizing, coatings (conversion, inorganic, organic, or organic–inorganic varieties), and inhibitors (inorganic and organic) (Xhanari and Finšgar, 2019).
Due to aluminium being susceptible to corrosion in a more acidic solution, the inhibition method by a chemical substance is the most effective (Soriano and Alfantazi, 2016). Inhibitors are chemical substances applied in corrosive media to combat metal corrosion by a chemical or physical adsorption mechanism. It is revealed that both molecule's electronic structure and morphology determine the adsorption mechanism type (Soriano and Alfantazi, 2016). Minimum requirements for an effective inhibitor are studied such as the presence of atoms with high electron density (nitrogen, phosphorus, oxygen, and sulfur) and multiple bonds (Arellanes-Lozada et al., 2014; Trdan et al., 2018; Zheng et al., 2013).
Most organic inhibitors are exorbitant and toxic to the ecosystem (Muniandy et al., 2011), thus in this study, a nontoxic and cost-effective glycerol stearate was used as a corrosion inhibitor on aluminium. In addition, research indicates that there are a variety of strategies that can be conducted for metal corrosion prevention such as production fluid blending, material upgrades, process control, and chemical inhibition (Soriano and Alfantazi, 2016; Arellanes-Lozada et al., 2014; Trdan et al., 2018). Chemical inhibition has been the best method among the strategies mentioned above in preventing metal surface deterioration due to economic and practical usage (Zheng et al., 2013; Muniandy et al., 2011; Dibetsoe et al., 2015). Subsequently, metal corrosion can be alleviated using organic compounds (Babu et al., 2021; Cao et al., 2014; Zaferani et al., 2013). Chemical inhibitors adsorb on the surface of a metal by covering vital sites on the surface, thus minimizing the corrosion process (Zheng et al., 2013; Muniandy et al., 2011; Dibetsoe et al., 2015; Babu et al., 2021; Cao et al., 2014; Zaferani et al., 2013). Furthermore, metal corrosion is hindered through inhibitor adsorption, aggressive anions, or the formation of a resistance oxide layer on the metal surface (Zheng et al., 2013; Muniandy et al., 2011; Dibetsoe et al., 2015; Babu et al., 2021; Cao et al., 2014; Zaferani et al., 2013). Studies on different inhibitor compounds have been carried out.
Chi-Ucán et al (Chi-Ucán et al., 2014) observed that inhibition efficiencies increase as glycerol concentration is increased and decreases with an increase in temperature. Higher percentage inhibition efficiencies are obtained when highly soluble and large surface coverage chemical inhibitors are used (Liu et al., 2006; Arslanoğlu et al., 2012; Abdallah et al., 2013; Özdemir et al., 2011). Glycerol stearate has not been reported as a corrosion inhibitor and its analysis with weight loss measurements, polarization techniques, adsorption film studies, quantum chemical parameters, and several others have not been studied hence this project has been conducted.
The reason glycerol stearate was used is due to its larger molecular weight, the presence of oxygen atoms that adsorb on a metal surface via lone pairs, and GS eco-friendliness. Furthermore, when comparing inhibition efficiencies of glycerol stearate against efficiencies for glycerol by Chi-Ucán et al (Chi-Ucán et al., 2014) and stearic acid by Liu et al (Liu et al., 2006), glycerol stearate was observed to be the most effective due to synergism (esterification process of glycerol and stearic acid forms glycerol stearate). The formation of a physically or chemically adsorbed film explained the mechanism of GS corrosion inhibition (Arslanoğlu et al., 2012; Abdallah et al., 2013; Özdemir et al., 2011; Gümrükçü et al., 2014; Baygu and Gök, 2018). This study uses GS (Fig. 1) as a corrosion inhibitor.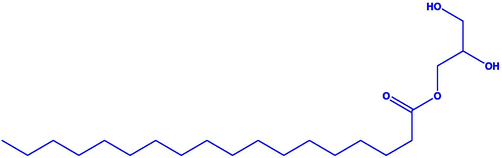
Glycerol stearate structure.
2 Materials and methods
2.1 Materials
Glycerol stearate (GS) was purchased from Prestige laboratory supplies, South Africa. Aluminium metal sheets [grade: 8xxx and % composition: Al (94.4%), Cu (4.3%), Mn (0.7%) and Fe (0.6%)] were prepared and purchased from North West University, South Africa, and 32 % Hydrochloric acid (HCl) was purchased at Rochelle chemicals, South Africa. All reagents were used as obtained.
2.2 Gravimetric method
The blank solution prepared was 1. 0 M of hydrochloric acid. The specimen used was aluminium with 3 cm × 4 cm dimensions, prepared from emery papers of grades ranging from 800 to 1200. The gravimetric experiments were conducted in 100 ml of the solution containing various concentrations of glycerol stearate (10 × 10-5 M, 30 × 10-5 M, and 50 × 10-5 M). Three thermostats at different temperatures were used 318 K, 328 K, and 338 K. Initial masses of aluminium were recorded before corrosion testing. The immersion time for the corrosion testing was 3 h, both in the absence of the inhibitor and in the presence of the inhibitor. After the corrosion testing, the metal was washed with distilled water and then left to dry. After drying the metal, final masses were recorded, and mass loss, corrosion rate, percentage inhibition efficiency, and surface coverage were calculated based on mass loss. The experiment was conducted in triplicates for each concentration, and the average weight loss (W =
in grams) was recorded. The corrosion rate (ρ in g. cm−2· h−1), percentage inhibition efficiency (%I), and surface coverage (θ) were calculated from the weight loss using the equations below (Arslanoğlu et al., 2012; Suh et al., 2012; Lupi et al., 2017; Tavernier et al., 2016; Foucher and López-Martínez, 2014; Boudalia et al., 2023; Daoud et al., 2014; Peme et al., 2015):
Where ΔW denoted aluminium average weight loss, S denoted total surface area of the Al specimen (cm2), and t denoted immersion time (h), while ρ1 and ρ2 were corrosion rates with and without inhibitors respectively.
2.3 Characterization technique
The inhibitor was confirmed by the Spectrum II FTIR spectrometer (PerkinElmer). The spectrum was within 500 and 4000 cm−1 at a resolution of 4 cm−1. Scanning electron microscopy (SEM) was used to perform morphological analysis on the samples. SEM was used on a TESCAN Vega TC using TESCAN software, together with energy dispersive X-ray spectroscopy (EDXS) to determine the elemental composition of the samples (at 20 kV). The samples were gold-coated to enhance imaging by forming a conductive layer on the analytes' surfaces, which prevented charging and elemental composition interference.
2.4 Adsorption studies
During the corrosion testing in the presence of the inhibitor compound, an adsorptive film was formed on a metal surface, and an oxide layer was further characterized using the FTIR technique, which was essential in studying the protective layer formed on the metal surface. This technique allows for the analysis of both liquid and solid samples. In the FTIR technique, the infrared absorption spectrum was measured, and another advantage was that the technique is fast in processing data. Furthermore, the functional groups of the chemical inhibitor molecule were investigated using FTIR qualitative analysis.
2.5 Electrochemical measurement
Electrochemical parameters were obtained with the aid of the Bio-Logic SP150 potentiostat working station, which consisted of a three-electrode cell, namely, saturated calomel electrode (SCE), reference electrode (RE), platinum counter electrode (CE) and an Al metal (1 cm2) working electrode (WE) without and with corrosion inhibitor concentrations. Potentiodynamic polarization studies were conducted between −0.250 and + 0.250 mV scanning range at a 1.0 mV/s constant sweep rate on the open circuit potential (OCP). Both anodic and cathodic polarization graphs were achieved when stabilization was attained after the working electrode was immersed for 30 min in the test solution. Electrochemical impedance (EIS) measurements were conducted by employing a 100 kHz to 10 Hz frequency range with a 10 mV peak-to-peak voltage, using an alternating current (AC) signal at corrosion potential.
2.6 Electrochemical impedance spectroscopy
Electrochemical impedance spectroscopy was utilized for studying charge transfer resistance occurring during the corrosion of aluminium metal in a corrosive environment. This technique was used to evaluate electrochemical measurements including solution resistance (Rs), charge transfer resistance (Rct) with the inhibitor and charge transfer resistance (Rct0) without the inhibitor, double layer capacitance (dll), the constant phase element (CPE), and exponents, which were further investigated by employing EIS. Furthermore, according to Eq. (4) below, Rctand Rct0were used to calculate the inhibition efficiency (Çakır et al., 2013; Guo et al., 2020; Kumar et al., 2013; Liu et al., 2006):
2.7 Computational studies
The computational methodology adopted in this study was based on density functional theory dispersion corrected (DFT-D) (Burke, 2012), which was essential for the accurate description of the organic molecules within the DMol3 (Delley, 2010) code embedded in the Materials Studio 2020 version. Geometry optimizations of the inhibitor were performed to calculate the energies of the highest occupied molecular orbital (HOMO) and the lowest unoccupied molecular orbital (LUMO). These were performed using the generalized gradient approximation (GGA) (Perdew et al., 2014) of Perdew-Wang 91 exchange–correlation functional (Enkovaara et al., 2020; Kannemann and Becke, 2010) (GGA-PW91). The Tkatchenko and Scheffler (TS) (Zarrouk et al., 2010) dispersion correction to the PW91 was adopted. The convergence tolerances for energy, force, and displacement were 2.0 × 10⁻⁵ Ha, 0.004 Ha.Å−1, and 0.005 Å, respectively. The double numerical plus polarization (DNP) basis set with 4.4 Basis files was set using DFT semi-core pseudopotentials. Koopmans theorem defines these parameters (Tsuneda et al., 2010):
Electronegativity (χ) was defined as the measure of the power of an electron or group of atoms to attract electrons towards itself and it was estimated using Eq. (5):
Global hardness (ᶯ) measured the resistance of an atom to a charge transfer and was estimated using Eq. (6):
The global electrophilicity index (
) was estimated using a relationship between electronegativity and chemical hardness parameters in Eq. (7):
Studies showed that a high electrophilicity value showed a good electrophile and a small value showed a good nucleophile.
Global softness (σ), which showed the capacity of an atom or group of atoms to receive electrons (Tsuneda et al., 2010), was estimated through Eq. (8):
Electron affinity (A) was defined as the energy released when an electron was added to a neutral molecule. It is related to ELUMO through Eq. (9):
Ionization potential (I) was defined as the amount of energy required to remove an electron from a molecule. It is related to EHOMO through Eq. (10):
3 Results and discussion
3.1 Structural characterization
The Fourier transform (FTIR) spectra of glycerol stearate and adsorption film were displayed in Fig. 2. The region of interest was from 3000 to 4000 cm−1 high energy region (Suh et al., 2012; Lupi et al., 2017; Tavernier et al., 2016). This region highly corresponds to the OH-stretching vibrations (Tsuneda et al., 2010; Hammouti et al., 2011). The spectrum of glycerol stearate showed a broad peak at around 3296–3233 cm−1, which was attributed to the hydroxyl groups (–OH) presence in the glycerol stearate structure. Two additional notable peaks appeared in the low-energy region, at 2934 and 2865 cm−1, suggested the typical CH2 stretch of alkyl carbon chains. The characteristic peak at 1727 cm−1 was attributed to the –C = O stretching vibrations. The symmetric and asymmetric stretching vibration of the –CH2 and –CH3 were observed at the regions of 1470 cm−1. The CO bending of the glycerol stearate was observed at 1170 cm−1 and the long-chain band was noticed at 720 cm−1. On the other hand, the adsorption film showed the newly formed adsorption bands for Al-O and Al-OH at 1100 cm−1 and 1250 cm−1 respectively, which attest to the fact that the inhibitor had successfully attached to the empty d-orbital of the metal. Furthermore, glycerol stearate binds to the metal through its active sites such as lone pairs located on the oxygen atoms.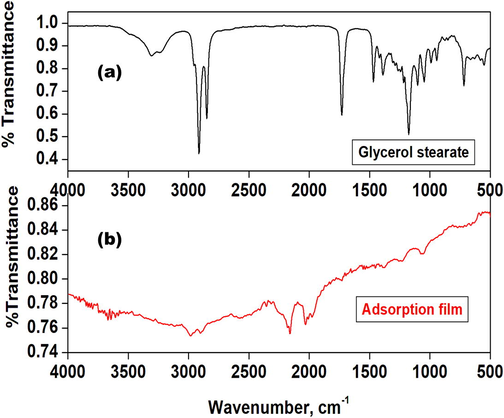
The FTIR spectra of (a) Glycerol stearate and (b) Adsorption film.
3.2 Gravimetric analysis
3.2.1 Glycerol stearate concentration and temperature effects on corrosion rate
The results for the rate of corrosion through weight loss measurements for Al in 1 mol. L-1 HCl at various GS concentrations from 10 × 10-5- 50 × 10-5 M and at 318 K, 328 K, and 338 K are shown in Fig. 3 (a), and the data were summarized in Table 1. In addition, when 10 x10-5 M of inhibitor was added the rate of corrosion decreased as compared to that for the uninhibited solution at three various temperatures, and there was a decrease in the rate of corrosion when 30 x10-5 M and 50 × 10-5 M of the inhibitor were added as noticed in Table 1. The rate of corrosion decreased as GS concentration increased since surface coverage (θ) of GS increased on the Al metal surface [39]. It was also noticed that the rate of corrosion, ρ was high for GS at 338 K as compared to 318 K and 328 K. In addition, the corrosion rate decreased as GS concentration increased as shown in Table 1.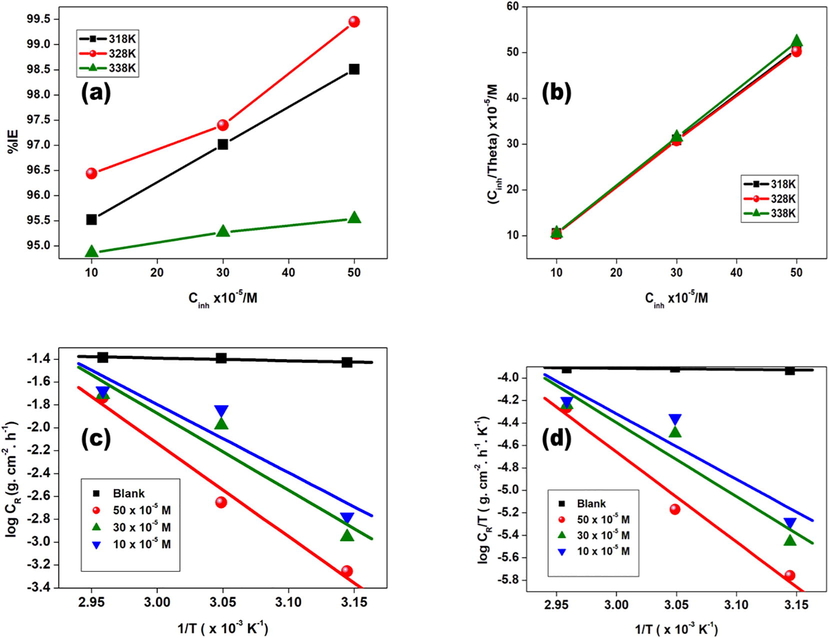
(a) Efficiency (%I) versus GS concentration plot for GS, (b) Langmuir isotherm of adsorption GS inhibitor on Al metal sheet at 318 K, 328 K, and 338 K, (c) Arrhenius graphs for Al metal in 1 M HCl with and without GS, and (d) Transition state graphs at differing GS.
Inhibitor
Temperature (K)
Concentration (x 10-5 M)
Weight loss (g)
Corrosion rate (x 10-3 g. cm−2. hr-1)
The inhibition efficiency (I)
Surface coverage (ϴ)
C/ϴ
GS
318
0
0.67
37.22
_
_
_
10
0.03
1.67
95.52
0.96
10.47
30
0.02
1.11
97.01
0.97
30.92
50
0.01
0.56
98.51
0.99
50.76
328
0
0.73
40.56
_
_
_
10
0.26
1.44
96.44
0.96
10.37
30
0.19
1.06
97.40
0.97
30.80
50
0.04
0.22
99.45
0.99
50.28
338
0
0.74
41.11
_
_
_
10
0.38
2.11
94.86
0.95
10.54
30
0.35
1.94
95.27
0.95
31.49
50
0.33
1.83
95.54
0.955
52.334
Fig. 3 (a) showed the percentage efficiency of inhibition against GS concentrations at 318 K, 328 K, and 338 K. At 50 × 10-5 M, the highest inhibition efficiency values were obtained. In addition, the %I of GS increased with increasing inhibitor concentration. Moreover, it was observed that the percentage inhibition efficiency at 50 × 10-5 M from 318 K to 328 K increased, this behaviour was due to the wax-like nature of the glycerol stearate and its solubility effect in different conditions and medium. The donation of lone pairs from the O atoms into the unfilled orbit of the Al metal formed a coordinate bond. Also, Cl- ions were adsorbed on Al/solution interface (Daoud et al., 2014; Peme et al., 2015). The rate of corrosion (ρ in g. cm−2· h−1), the efficiency of inhibition (%I), and surface coverage (θ) were determined from the weight loss data (Boudalia et al., 2023; Daoud et al., 2014) using Eqs. (1–3).
At 50 x10-5 M percentage inhibition efficiency of GS ranged between 96 and 99%. At 30 × 10-5 M, percentage inhibition efficiency was between 95 and 97%. Finally, at 10 × 10-5 M percentage inhibition efficiency of GS ranged from 95 to 96%. The adsorption isotherm results were shown in Fig. 3 (b). Langmuir adsorption isotherm and inhibitor surface coverage (θ) on Al surface related to GS concentration (Cin) according to Eq. (11):
The linear form is given by:
Where Cin denoted GS concentration, θ denoted surface coverage degree, and Kads denoted constant of equilibrium. Fig. 3 (b), the plot of Cin/θ against Cin showed a linear graph with a positive slope. In Table 2, Kads values were presented and there was no regularity from obtained values of Kads at 318 K, 328 K, and 338 K (Peme et al., 2015). In this project, larger values of Kads for GS indicated the process of adsorption which was favoured by larger values of Kads (Kumar et al., 2013).
Inhibitor
T (K)
Kads (x105 L.mol−1)
R2
-ΔGoads (kJ.mol−1)
GS
318
2.00
0.99
42.89
328
1.81
0.99
43.97
338
9.04
1
49.83
In Fig. 3 (b), Langmuir adsorption isotherm was followed by GS observed from data given by R2 values closer to and at unity in Table 2. Furthermore, from slope values, monolayer adsorption was obtained (Arslanoğlu et al., 2012; Peme et al., 2015; Kumar et al., 2013). From Kads values obtained, the free energy of adsorption (ΔG°ads) was determined using Eq. (12):
ΔG°ads denoted adsorption Gibbs energy, 55.5 value represented the molar concentration of water in the solution, denoted absolute temperature was denoted by T, and the constant of equilibrium for the adsorption process was denoted by Kads. In Table 2 it was observed that ΔG°ads values for GS inhibitor were above −40 kJ. mol−1, which indicated a chemisorption mechanism of adsorption (Arslanoğlu et al., 2012; Çakır et al., 2013; Guo et al., 2020; Kumar et al., 2013; Peme et al., 2015). Furthermore, the Kads values were observed to decrease from 318 K to 328 K and increase from 328 K to 338 K, this trend owes to the wax-like nature of the inhibitor and its solubility was more enhanced at increased temperature. It was noticed that the solubility of the inhibitor enhanced inhibition efficiencies and introduced consistency in the corrosion kinetics (Guo et al., 2020).
3.2.2 Thermodynamic and activation parameters
The Arrhenius equation was used to evaluate the temperature effect on the behavior of the adsorption process and activation energy (Ea) parameters of the corrosion process according to (Liu et al., 2006; Peme et al., 2015):
ρ denoted rate of corrosion, Ea denoted energy of activation, R denoted molar gas constant (8.314 JK-1mol−1), T denoted absolute temperature, and A denoted frequency factor. The plot of log (ρ) against 1/T for aluminium in 1 mol. L-1 HCl with and without GS was presented in Fig. 3 (c). From slopes, values of the activation energy were obtained. Furthermore, from intercepts of regression lines frequency factor was obtained. Slope = -Ea/2.303R and c = log A where c indicated regression line intercept. The adsorption process that occurred at the metal surface/inhibitor interface could either be an exothermic process where heat was given off or an endothermic process where heat was absorbed. Table 3 showed that values of Ea in the inhibited solution were generally higher than that of the blank solution in all inhibitor concentrations. It was studied that physical adsorption was determined by higher Ea values while chemical adsorption was determined by lower Ea values (Peme et al., 2015).
Temperature effect on inhibition efficiency for Al was used to obtain entropy (ΔS°) and enthalpy values (ΔHa°) presented in Table 3. Positive values of ΔHa° indicated that Al dissolution and GS undergo endothermic processes (Dibetsoe et al., 2015; Babu et al., 2021). Enthalpies up to 41.86 kJ.mol−1 signify a physisorption mechanism (Peme et al., 2015) reported. Values of ΔHa° for GS were high signifying the chemisorption mechanism (Dibetsoe et al., 2015; Babu et al., 2021; Cao et al., 2014; Zaferani et al., 2013; Chi-Ucán et al., 2014; Liu et al., 2006). Positive values of ΔSo in GS-containing solution indicated that activated complex formation was dissociative rather than associative at the rate-determining step (Babu et al., 2021; Peme et al., 2015).
Inhibitor
Concentration (x 10-5 M)
Ea (kJ. mol−1)
ΔHoads (kJ. mol−1)
ΔSo (JK−1. mol−1)
GS
0
4.47
1.75
−267.27
10
114.22
111.50
54.23
30
128.60
125.88
95.87
50
155.86
153.13
172.62
Measurements for ΔS° and ΔHa° were determined using Eq. (14):
ρ indicated the rate of corrosion, h denoted Plank’s constant and N denoted Avogadro’s constant (6.023 × 10²³ mol−1).
Fig. 3 (d) showed log (ρ /T) versus 1/T graph for GS, showing linear graphs with [log ( as an intercept. In addition, -ΔH°/R values were calculated from slopes. Furthermore, it was noticed that the blank solution showed high ρ values as compared to the GS inhibitor. Lower ρ values indicated that Al metal dissolution was minimized.
3.3 Potentiodynamic polarization
Aluminium potentiodynamic polarization curves in 1 M HCl in uninhibited and inhibited systems were presented in Fig. 4. In Table 4, shown are values of inhibitor concentrations, Ecorr, Icorr, Tafel slopes (ba and bc) anodic and cathodic respectively, and percentage inhibition efficiencies (%IPDP). Obtained current densities by extrapolating curves of tafel slopes to corrosion potential.
Potentiodynamic polarization plot for aluminium in 1 M HCl in the uninhibited and inhibited solutions of GS different concentrations.
Inhibitor
Conc × 10-5 (M)
-Ecorr
(mV)
Icorr
(mA. cm−2)
ba (mV)
bc (mV)
%IPDP
Blank
813.2
109.9
290.9
396.8
–
GS
10
784.1
53.4
134.8
594.4
51.4
30
737.5
23.3
38.4
198.5
78.8
50
793.7
20.8
52.1
145.4
81.1
Table 4 revealed that inhibition efficiency increased as inhibitor concentration increased and as corrosion current densities decreased. This was a result of the adsorption of GS on the aluminium surface. The potentiodynamic polarization study showed that GS inhibition efficiencies increased in the order: of 10 × 10-5 M (51.37%), 30 × 10-5 M (78.80%), and 50 × 10-5 M (81.06%). The corrosion potential value of inhibited solutions against the blank played an essential role in the sense that if Ecorr was greater than 85 mV was given to either anodic or cathodic type inhibitors and if Ecorr was less than 85 mV was accredited to a mixed type inhibitor mechanism (Liu et al., 2006). Furthermore, Table 4 showed that Ecorr values were less than 85 mV with the cathodic inhibitor mechanism dominating inferring from the tafel slopes.
3.4 Electrochemical impedance spectroscopy
The corrosion behavior of aluminium in 1 M HCl and the presence of 10 × 10-5 M, 30 × 10-5 M, and 50 x10-5 M GS concentrations was studied with the aid of the EIS. The Nyquist plot of aluminium without and with GS concentrations was presented in Fig. 5. Table 5 showed that Rct values increased in inhibited solutions and a decrease in Cdl values was observed as the inhibitor concentration increased due to the formation of a barrier at the metal-solution interface. Similar behavior showed by Chi-Ucán et al (Chi-Ucán et al., 2014).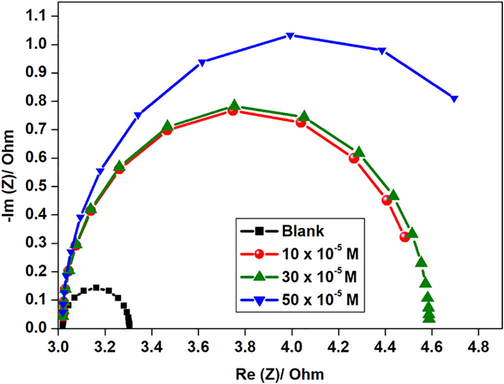
Nyquist plot for aluminium in 1 M HCl in the uninhibited and inhibited solution with different GS concentrations.
Inhibitor
Concentration × 10-5 (M)
Rs (Ω)
Rct (Ω)
Cdl (x10-6F)
%IEIS
Blank
3.019
0.286
451.2
–
GS
10
2.208
1.536
60.2
81.4
30
2.262
1.570
59.7
81.8
50
1.913
2.070
45.1
86.1
The increase in Rct values was due to the adsorption of GS molecules on aluminium metal thus retarding metal dissolution and hydrogen evolution which are oxidation and cathodic processes occurring at the metal solution interface (Chi-Ucán et al., 2014). Furthermore, Nyquist plots in Fig. 5 showed a single depressed capacitive arc or semicircle due to metal surface roughness and this revealed that aluminium dissolution was by a single transfer process (Solmaz, 2014). The impedance nature of GS was studied with the use of an electrical circuit comprising Rs, Rct, and Cdl shown in Fig. 7. In addition, corresponding Bode plots in Fig. 6 showed that the high-frequency limit corresponded to the solution resistance Rs represented on the electric circuit shown in Fig. 6. Furthermore, it was observed that in Bode plots the low-frequency limit (Rs + Rct) from Nyquist and Bode plots were in good agreement. Bode absolute impedance plot (Fig. 6a) showed that the impedance value increased greatly over the whole frequency range with the incremental concentration of GS, and a larger log |Z| represented a better protection performance. In the corresponding Bode phase plot (Fig. 6b), large values of the phase angle indicated that superior inhibition behavior is obtained by increasing the concentration of GS (Zheng et al., 2015).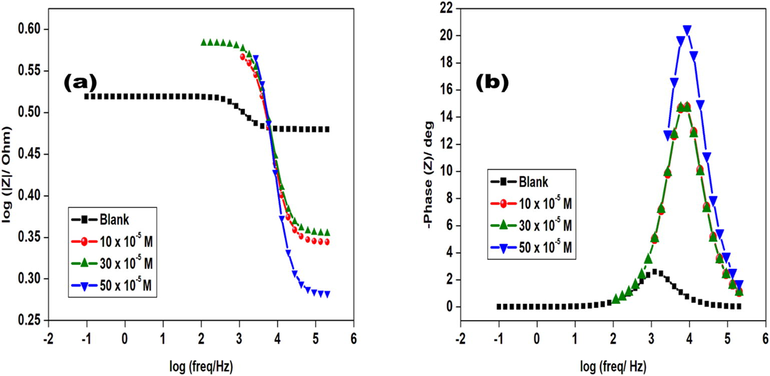
Bode plots of aluminium in 1. 0 M HCl with and without glycerol stearate.
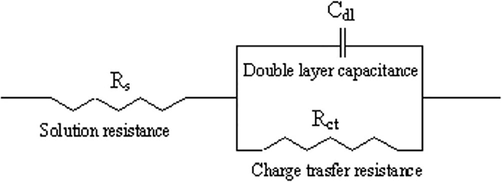
The suggested electrical circuit for studied GS.
3.5 Scanning electron microscopy
Fig. 8 (a), showed the smooth surface of aluminium before corrosion testing, any inhomogeneity revealed was due to abrasion with emery papers. Nonetheless in Fig. 8 (c), after immersion in 1 M HCl aluminium surface showed a rougher nature. These observations were substantiated by corresponding EDS spectra revealing the absence and presence of Cl- which led to aluminium surface roughness (Zheng et al., 2015).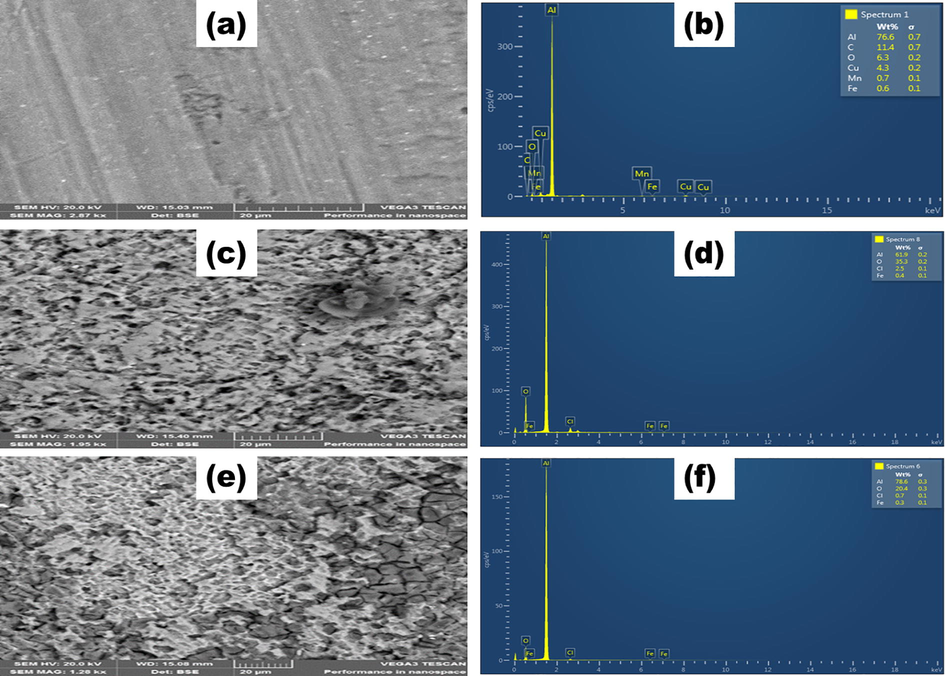
(a) SEM image, (b) EDS spectrum of pristine aluminium metal; (c) SEM micrograph, (d) EDS spectrum of aluminium in 1 M HCl solution; (e) SEM micrograph, and (f) EDS spectrum of aluminium in 1 M HCl and glycerol stearate inhibitor.
However, introducing glycerol stearate inhibitor minimized more surface roughness when SEM micrographs in the absence and presence of inhibitor in 1 M HCl solution were compared. In Fig. 8 (e). Fig. 8 (b), (d) and (f) illustrated were the EDS spectrums of pristine aluminium, aluminium in the presence of HCl and aluminium in the presence of HCl/ GS, respectively. It was observed that the compositions for aluminium, copper, manganese, and iron elements were identified in a pristine material signifying that the material was an alloy. Fig. 8 (d) showed a decrease in aluminium composition as a result of the presence of chloride ion from the corrosive medium. However, Fig. 8 (f) showed a restored aluminium composition due to the presence of the inhibitor which in turn reduced the chloride ion composition.
3.6 Computational studies
The data collected from weight loss measurements and electrochemical techniques were further substantiated with chemical quantum calculations which played an essential role in studying the reactivity and selectivity parameters of glycerol stearate as the inhibitor molecule in this study (Tsuneda et al., 2010; Hammouti et al., 2011; Hegazy et al., 2013). The need to study the inhibitor's reactivity and selectivity emanated due to different regions within the inhibitor which interacted with the metal surface. There were ample electronic properties on which the reactivity of the inhibitor depended, such as dipole moment, partial charges, and electronic density to mention a few. In addition, the nature of functional groups within the inhibitor influenced the electronic properties. In Fig. 9 (a), displayed was the optimized geometry of glycerol stearate with the atom numbering used in this study. The reason why the geometry of the inhibitor was of utmost importance was due to the dependence of the inhibition efficiency on the geometry of the inhibitor molecule. Among many, inhibitor compounds with planar geometry were most preferred due to their inhibition efficiencies as compared to non-planar geometries (Zheng et al., 2015). This was due to the high possibility of a planar inhibitor molecule which resulted in a larger surface coverage on the metal surface through the inhibitor's most reactive atomic sites.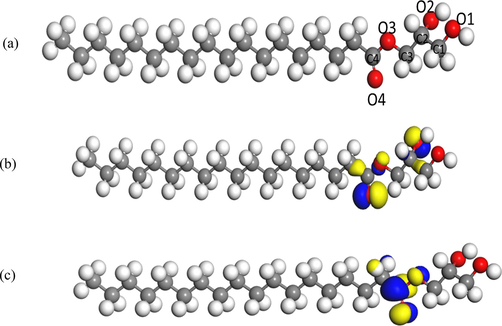
(a) The optimized geometry and the atom numbering of the studied glycerol stearate, (b) Relaxed geometries and HOMO (isosurface generation iso value = 0.05) of glycerol stearate, (c) Relaxed geometries and LUMO (isosurface generation iso value = 0.05) isosurfaces of glycerol stearate.
Through the analysis of the Highest Occupied Molecular Orbital (HOMO) and the Lowest Unoccupied Molecular Orbital (LUMO), the reactive sites of glycerol stearate could be studied. Furthermore, the study of reactivity parameters such as the HOMO energy (EHOMO), the LUMO energy (ELUMO), global softness (σ), global hardness (η), electron affinity (EA), ionization potential (IP), and electronegativity (χ) was essential. In Fig. 9 (b) and 9(c), shown are the HOMO and LUMO of the studied glycerol stearate respectively. The area where an electrophilic attack mostly emanated at the HOMO while the area where the nucleophilic attack likely occurred from the LUMO (Solmaz, 2014). From this study, the highest HOMO densities of glycerol stearate occur at carbon atoms on C1, C2, C3, and C4, on hydroxide oxygen atoms (O1 and O2), on the ether functional group O3 and lastly on the carbonyl O4. Since the LUMO densities entailed information concerning the nucleophilic attack, however, this was mainly applicable provided the metal surface back donated electrons to glycerol stearate.
Table 6 showed the molecular quantum chemical parameters which relate to the reactivity of glycerol stearate used in this study. The parameters included are EHOMO, ELUMO, and the energy gap (ΔE), among others. The interaction between the HOMO and LUMO of reacting glycerol stearate was responsible for electron transition between the metal-inhibitor interfaces and was informed by Frontier Molecular Orbital Theory (FMO) (Tsuneda et al., 2010; Hammouti et al., 2011; Hegazy et al., 2013; Solmaz, 2014; Zheng et al., 2015). In addition, at the EHOMO glycerol stearate donated electrons to the empty d-orbital of the metal, thus higher EHOMO values were appreciated since they catered to the electron-deficient species according to studies (Obot et al., 2015). Furthermore, a chemical compound possessing higher EHOMO values showed appreciable inhibition efficiencies and enhanced an effective adsorption process at the metal-inhibitor interface (Zarrouk et al., 2013). The degree to which a chemical compound could receive electrons was shown by ELUMO values. Lower ELUMO values showed a high probability to a compound could have accepted electrons from some electron-rich chemical species (Zarrouk et al., 2013).
Molecular Property
Inhibitor Compound
GS
EHOMO (eV)
−5.470
ELUMO (eV)
−0.067
ΔE (eV)
5.403
ɳ
2.702
σ
0.370
I (eV)
5.470
An (eV)
0.067
ω
1.419
χ
2.769
Further information with regards to glycerol stearate reactivity, was through the study of the energy gap. From ΔE, the stability and reactivity of the inhibitor molecule could be studied. Thus, a higher ΔE value was associated with high stability and less reactivity, meanwhile lower ΔE value was associated with low stability and more reactive to other species (Zarrouk et al., 2013). Regarding the polarity of the molecule, a dipole moment was studied. In addition, from other projects dipole moments were reported to increase with increasing inhibition efficiencies meanwhile in other reports a different trend was observed (Tsuneda et al., 2010; Hammouti et al., 2011; Hegazy et al., 2013; Solmaz, 2014; Zheng et al., 2015; Obot et al., 2015; Zarrouk et al., 2013). The other crucial reactivity parameter shown in Table 6 was electronegativity (x) which gave information regarding the electron density and the ability of an electron or atom to attract more electrons to itself (Tsuneda et al., 2010; Hammouti et al., 2011; Hegazy et al., 2013; Solmaz, 2014; Zheng et al., 2015; Obot et al., 2015; Zarrouk et al., 2013). The complementing parameter to electronegativity was the global electrophilicity index (ω), chemical inhibitors with higher ω value were named good electrophiles meanwhile those with lower ω value were named good nucleophiles (Tsuneda et al., 2010; Hammouti et al., 2011; Hegazy et al., 2013; Solmaz, 2014; Zheng et al., 2015; Obot et al., 2015; Zarrouk et al., 2013; Murulana et al., 2012).
Furthermore, information regarding the resistance of an atom to charge transfer was given by global hardness (ɳ) and higher ɳ values signified a higher resistance for the inhibitor to transfer charge to the metal surface. Thus, inhibitors with a lower ɳ value were most appreciated as this enhanced a better adsorption process at the metal-inhibitor interface. Global softness (σ) relates to the softness of the inhibitor compound and at the highest σ inhibitor region an enhanced inhibitor-metal adsorption was observed (Tsuneda et al., 2010; Hammouti et al., 2011; Hegazy et al., 2013; Solmaz, 2014; Zheng et al., 2015; Obot et al., 2015; Zarrouk et al., 2013). Electron affinity (A) revealed an electron deficiency region hence it associated with the ELUMO. Moreover, another crucial molecular reactivity parameter was ionization potential (I) which revealed the amount of energy required to remove an electron from the molecule (Tsuneda et al., 2010; Hammouti et al., 2011; Hegazy et al., 2013; Solmaz, 2014; Zheng et al., 2015; Obot et al., 2015; Zarrouk et al., 2013) and this helped investigate the amount of energy it took reactive atoms within glycerol stearate to transfer electrons to the metal's empty orbital.
4 Conclusions
The percentage inhibition efficiency results showed that glycerol stearate had excellent inhibition properties against aluminium metal corrosion in hydrochloric acid solution and its maximum inhibition efficiency was obtained at 50 x10-5 M for potentiodynamic polarization and electrochemical impedance spectroscopy. Adsorption studies showed that the inhibitor followed Langmuir isotherm. Values of Gibbs free energy indicated that the adsorption process was spontaneous.
Glycerol stearate was chemically adsorbed on a metal surface via chemisorption which resulted in the formation of a thin protective oxide layer. Positive enthalpy values indicated endothermic process occurred during metal corrosion testing. Potentiodynamic polarization showed that introducing glycerol stearate in an acidic solution reduced corrosion current density significantly. Corrosion potential values showed glycerol stearate inhibits via mixed type inhibition mechanism predominantly with cathodic inhibition mechanism over anodic inhibition mechanism. FTIR revealed that when comparing glycerol stearate spectrum and spectrum for an adsorptive film there was a disappearance of glycerol stearate functional groups for the adsorptive film formed on the metal and this implied that indeed reactive heteroatoms found in GS coordinated well on the surface of the aluminium. Inhibitors were chemically adsorbed on the metal surface via chemisorption which resulted in the formation of a thin protective oxide layer. SEM results revealed that the adsorptive layer formed by glycerol stearate indeed inhibited corrosion of aluminium metal by depriving the metal acidic solution interface of sufficient direct contact. Finally, variation in inhibitive efficiencies at 50 × 10-5M for gravimetric method at 318 K − 98.5%, PDP- 81.1% and EIS- 86.1% the difference was significantly high for gravimetric compared to PDP and EIS due to gravimetric not applying the potential for the corrosion process to occur, however, in PDP and EIS the potential was applied leading to the higher metal polarization. Thus, higher inhibition efficiencies were observed for gravimetric as compared to PDP and EIS.
Acknowledgments
This work was financially supported by the National Research Foundation (NRF) and the Sasol foundation. University of Limpopo, South Africa. Mr. T Pesha would also love to acknowledge Mintek, Dr. A. N. Jijana, and Mr. T.G. Tsoeunyane at the University of Johannesburg (Doornfontein) for helping with electrochemical experiments.
Declaration of competing interest
The authors declare that they have no known competing financial interests or personal relationships that could have appeared to influence the work reported in this paper.
References
- Synergistic effect of some halide ions on the inhibition of zinc corrosion in hydrochloric acid by tetrahydro carbazole derivatives compounds. Int J Electrochem Sci.. 2013;8:10001-10021.
- [Google Scholar]
- The inhibition of aluminium corrosion in sulphuric acid by poly (1-vinyl-3-alkyl-imidazolium hexafluorophosphate) Materials.. 2014;7:5711-5734.
- [Google Scholar]
- Synthesis and photophysical properties of peripherally and non-peripherally mercaptopyridine substituted metal free, Mg (II) and Al (III) phthalocyanines. Spectrochim. Acta A Mol. Biomol. Spectrosc. 2012;95:407-413.
- [Google Scholar]
- On the corrosion of a high solute Al-Zn-Mg alloy produced by laser powder bed fusion. Corros. Sci. 2021;189:109626
- [Google Scholar]
- A highly water-soluble zinc (II) phthalocyanines as potential for PDT studies: Synthesis and characterization. Inorg. Chem. Commun.. 2018;96:133-138.
- [Google Scholar]
- Phosphate glass doped with niobium and bismuth oxides as an eco-friendly corrosion protection matrix of iron steel in HCl medium: Experimental and theoretical insights. J. Alloys Compd.. 2023;938:168570
- [Google Scholar]
- Synthesis, characterization, electrochemical and spectroelectrochemical properties of metal-free and metallophthalocyanines bearing electropolymerizable dimethylamine groups. Dyes Pigm.. 2013;98:414-421.
- [Google Scholar]
- Novel benzimidazole derivatives as corrosion inhibitors of mild steel in the acidic media. Part II: Theoretical studies. Corros. Sci.. 2014;83:292-298.
- [Google Scholar]
- Inhibition effect of glycerol on the corrosion of copper in NaCl solutions at different pH values. J chem. 2014
- [Google Scholar]
- Adsorption and corrosion inhibition of new synthesized thiophene Schiff base on mild steel X52 in HCl and H2SO4 solutions. Corros. Sci.. 2014;79:50-58.
- [Google Scholar]
- Time dependent density functional theory with DMol3. J. Phys. Condens. Matter.. 2010;22:384208
- [Google Scholar]
- Some phthalocyanine and naphthalocyanine derivatives as corrosion inhibitors for aluminium in acidic medium: Experimental, quantum chemical calculations, QSAR studies and synergistic Effect of iodide ions. Molecules.. 2015;20:15701-15734.
- [Google Scholar]
- Electronic structure calculations with GPAW: a real-space implementation of the projector augmented-wave method. J. Phys. Condens. Matter.. 2020;22:253202
- [Google Scholar]
- Analysis, evaluation, and comparison of polarimetric SAR speckle filtering techniques. IEEE Trans. Image Process.. 2014;23:1751-1764.
- [Google Scholar]
- Photophysical, photochemical, and BQ quenching properties of zinc phthalocyanines with fused or interrupted extended conjugation. J. Chem. 2014
- [Google Scholar]
- Multidimensional insights into the corrosion inhibition of 3, 3-dithiodipropionic acid on Q235 steel in H2SO4 medium: a combined experimental and in silico investigation. J. Colloid Interface Sci.. 2020;570:116-124.
- [Google Scholar]
- Temperature Effect, Activation Energies and Thermodynamics of Adsorption of ethyl 2-(4-(2-ethoxy-2-oxoethyl)-2-p-Tolylquinoxalin-1 (4H)-yl) Acetate on Cu in HNO3. Orient. J. Chem.. 2011;27:23-31.
- [Google Scholar]
- Corrosion inhibition of carbon steel using novel N-(2-(2-mercaptoacetoxy) ethyl)-N, N-dimethyl dodecan-1-aminium bromide during acid pickling. Corros. Sci.. 2013;69:110-122.
- [Google Scholar]
- van der Waals interactions in density-functional theory: intermolecular complexes. J. Chem. Theory Comput. 2010;6:1081-1088.
- [Google Scholar]
- Experimental and quantum chemical studies on corrosion inhibition effect of synthesized organic compounds on N80 steel in hydrochloric acid. In. Eng. Chem. Res.. 2013;52:14019-14029.
- [Google Scholar]
- Protection of iron corrosion by stearic acid and stearic imidazoline self-assembled monolayers. Appl. Surf. Sci.. 2006;253:814-820.
- [Google Scholar]
- Organogelation of extra virgin olive oil with fatty alcohols, glyceryl stearate and their mixture. LWT.. 2017;77:422-429.
- [Google Scholar]
- Effects of electrical parameters on plasma electrolytic oxidation of aluminium. Surf. Coat. Technol.. 2013;221:70-76.
- [Google Scholar]
- Investigation of some schiff bases as corrosion inhibitors for aluminium alloy in 0.5 M hydrochloric acid solutions. Surf. Rev. Lett.. 2011;18:127-133.
- [Google Scholar]
- Experimental and quantum chemical studies of some bis (trifluoromethyl-sulfonyl) imide imidazolium-based ionic liquids as corrosion inhibitors for mild steel in hydrochloric acid solution. In. Eng. Chem. Res.. 2012;51:13282-13299.
- [Google Scholar]
- Theoretical prediction and electrochemical evaluation of vinylimidazole and allylimidazole as corrosion inhibitors for mild steel in 1 M HCl. J. Ind. Eng. Chem.. 2015;21:1328-1339.
- [Google Scholar]
- Corrosion inhibition of aluminium by novel phthalocyanines in hydrochloric acid solution. J. Mater. Sci.. 2011;46:752-758.
- [Google Scholar]
- Adsorption and corrosion inhibition studies of some selected dyes as corrosion inhibitors for mild steel in acidic medium: gravimetric, electrochemical, quantum chemical studies and synergistic effect with iodide ions. Molecules.. 2015;20:16004-16029.
- [Google Scholar]
- Gedanken densities and exact constraints in density functional theory. J. Chem. Phys. 2014;140:18A533.
- [Google Scholar]
- Investigation of adsorption and corrosion inhibition of mild steel in hydrochloric acid solution by 5-(4-Dimethylaminobenzylidene) rhodanine. Corros. Sci.. 2014;79:169-176.
- [Google Scholar]
- Corrosion behavior of galvanized steel due to typical soil organics. Constr. Build. Mater.. 2016;102:904-912.
- [Google Scholar]
- Synthesis of nonspherical superparamagnetic particles: in situ coprecipitation of magnetic nanoparticles in microgels prepared by stop-flow lithography. J. Am. Chem. Soc.. 2012;134(2012):7337-7343.
- [Google Scholar]
- Food-grade particles for emulsion stabilization. Trends Food Sci Technol.. 2016;50:159-174.
- [Google Scholar]
- Improvement of corrosion resistance of AA2024-T3 using femtosecond laser peening without protective and confining medium. Corros. Sci.. 2018;143:46-55.
- [Google Scholar]
- Organic corrosion inhibitors for aluminium and its alloys in chloride and alkaline solutions: A review, Arabian Journal of Chemistry. Arab. J. Chem.. 2019;12:4646-4663.
- [Google Scholar]
- Application of eco-friendly products as corrosion inhibitors for metals in acid pickling processes–A review. J. Environ. Chem. Eng.. 2013;1:652-657.
- [Google Scholar]
- The effect of temperature on the corrosion of Cu/HNO3 in the presence of organic inhibitor: part-2. Int. J. Electrochem. Sci.. 2010;5:1516-1526.
- [Google Scholar]
- Evaluation of N-containing organic compound as corrosion inhibitor for carbon steel in phosphoric acid. J. Mater. Environ. Sci.. 2013;4:177-192.
- [Google Scholar]
- Mechanism of (Mg, Al, Ca)-oxide inclusion-induced pitting corrosion in 316L stainless steel exposed to sulphur environments containing chloride ion. Corros. Sci.. 2013;67:20-31.
- [Google Scholar]
- Experimental and theoretical studies of two imidazolium-based ionic liquids as inhibitors for mild steel in sulfuric acid solution. Corros. Sci.. 2015;95:168e179.
- [Google Scholar]


