

Translate this page into:
Evaluation of nickel toxicity and potential health implications of agriculturally diversely irrigated wheat crop varieties
⁎Corresponding author. ilker.ugulu@usak.edu.tr (Ilker Ugulu)
-
Received: ,
Accepted: ,
This article was originally published by Elsevier and was migrated to Scientific Scholar after the change of Publisher.
Peer review under responsibility of King Saud University. Production and hosting by Elsevier.
Abstract
Nickel (Ni) is essential for plant metabolism but is dangerous to most plants and other organisms when present in large concentrations. In this study, nickel (Ni) was chosen as an important environmental pollutant and toxic substance due to its widespread availability, and high persistence, causing soil pollution and serious environmental problems. The main aim of the study is to determine the Ni content in various wheat varieties and soil grown in various water regimes (sewage water, groundwater and industrial water) in Punjab, Pakistan. The Ni concentrations were determined via the ecological environment (water, soils) and below (roots) and above-ground plant organs (shoots and wheat grains) and phytostabilization potential assessment using various pollution indices. The results showed that the mean Ni concentration in different wheat varieties varied from 1.35 to 2.45 mg/kg, 1.17 to 2.42 mg/kg, 1.09 to 2.10 mg/kg and 0.99 to 1.54 mg/kg in soil, root, shoot, and grains, respectively. Research findings also revealed that the nickel concentration in soil and grains is within the safe limits and all the indices for Ni are less than 1. As a result, the studied wheat cultivars appear to be safe for consumption. However, it can be said that the continuous use of wastewater for irrigation may pose health risks for living things in the food chain.
Keywords
Irrigation sources
Nickel soil toxicity
Seasonal variation
Wheat crop

1 Introduction
The use of various water resources for agricultural purposes has caused a serious problem in developing countries (Ugulu et al., 2021). Pakistan is one of the countries that have problems in this respect because it has limited clean water resources and agriculture is the country's most important economic input. While the total water use for agriculture is considered to be around 70% all over the world, Pakistan is an agricultural country and the use of water for irrigation reaches 95% (Government of Pakistan, 2008).
In the 20th century, countries experiencing water shortages, especially Pakistan, started an important period of using various water resources for irrigation purposes. In this process, a large amount of wastewater containing harmful compounds appeared due to the rapid development in the municipality and production areas (Khan et al., 2023). Since these wastewaters contain nutrients and organic matter together with irrigation water, they are used for irrigation purposes. However, wastewater has abundant toxic substances (Ping et al., 2011). One of the most important groups of these toxic substances is heavy metals (Chen et al., 2021). Various studies have concluded that the presence of heavy metals in plants may pose a health risk in humans (Balkhair and Ashraf, 2016). In studies conducted in this direction, many indexes such as daily metal intake (DIM), transfer factor (TF) and health risk index (HRI) are used to determine the health risks posed by heavy metals (Tariq et al., 2021; Ugulu et al., 2022).
Nickel (Ni) is essential for plant metabolism but is dangerous to most plants when present in large concentrations (Ahmad et al., 2023). Ni affects various enzymes involved in many metabolic reactions, and some of these enzymes affect how seeds digest and mobilize their nutrient stores. On the other hand, Ni deficiency creates negative effects on plant growth and development in many ways. It also disrupts nitrogen metabolism and causes plant ageing (Alloway, 1995). The capacity to germinate seeds of many crops is significantly hindered by high Ni concentrations in the growing medium. High Ni concentrations during vegetative periods slow down the growth of shoots and roots, affect the development of branches, and disrupt plant parts, shapes and some other physiological functions (Rothenberg et al., 1994).
Contact with nickel can have several negative health impacts on people, including allergies, kidney and heart problems, lung fibrosis, and lung and nasal cancer. Although the exact molecular mechanisms causing nickel toxicity are not yet known, it is believed that mitochondrial malfunction and oxidative stress play a fundamental and essential part in this metal's toxicity (Ugulu, 2015a). The essentiality and dietary intake levels of Ni are not suggested for humans. Nickel indirectly poses genotoxic effects by interacting with the repair system of DNA. Therefore, it is suggested that due to the inhibition of the DNA repair system, the Ni accumulates in the breast tissues and might be the cause of malignant tumors (Rothenberg et al., 1994).
Recent studies have shown that soil micro- and macronutrient concentrations increase with continuous application of wastewater to farmland (Zeng et al., 2015; Munir et al., 2019; Ugulu et al., 2019a, b; Wajid et al., 2020). At low concentrations, plants need micronutrients for their growth and metabolic rate, but at high concentrations these nutrients become toxic (Dogan et al., 2011). Industrial discharge, metal mining, misuse of chemical fertilizers and pesticides, and accumulation of heavy metals in the atmosphere are the main sources of heavy metals in water resources (Khan et al., 2019). In this study, nickel (Ni) was chosen as an important environmental pollutant and toxic substance due to its widespread availability, and high persistence, causing soil pollution and serious environmental problems. The main aim of the study is to determine the Ni content in various wheat varieties and soil grown in various water regimes (sewage water, groundwater and industrial water) in Punjab, Pakistan. For this purpose, the bioconcentration of Ni from soil to wheat varieties (Seher-2006, Faislabad-2008, Watan, Galaxy-2013, Punjab-2011) and the movement of Ni from root to shoot were analyzed. In addition, the enrichment factor was evaluated and the risk to human health of consuming infected wheat grains daily was calculated.
2 Material and methods
2.1 Research area
In this study, which was carried out in 7 districts of Punjab Pakistan (Bhakkar, Chiniot, Faisalabad, Gujranwala, Gujrat, Kasur and Sargodha), wheat fields irrigated with three water sources, namely groundwater, sewage water and industrial wastewater from each district, were selected as the research area (Fig. 1). This study was carried out to determine nickel accumulation in five wheat cultivars (Seher-2006, Faislabad-2008, Watan, Galaxy-2013, Punjab-2011) and to evaluate its risks to human health during the two growing seasons (2017 and 2018) (Fig. 2).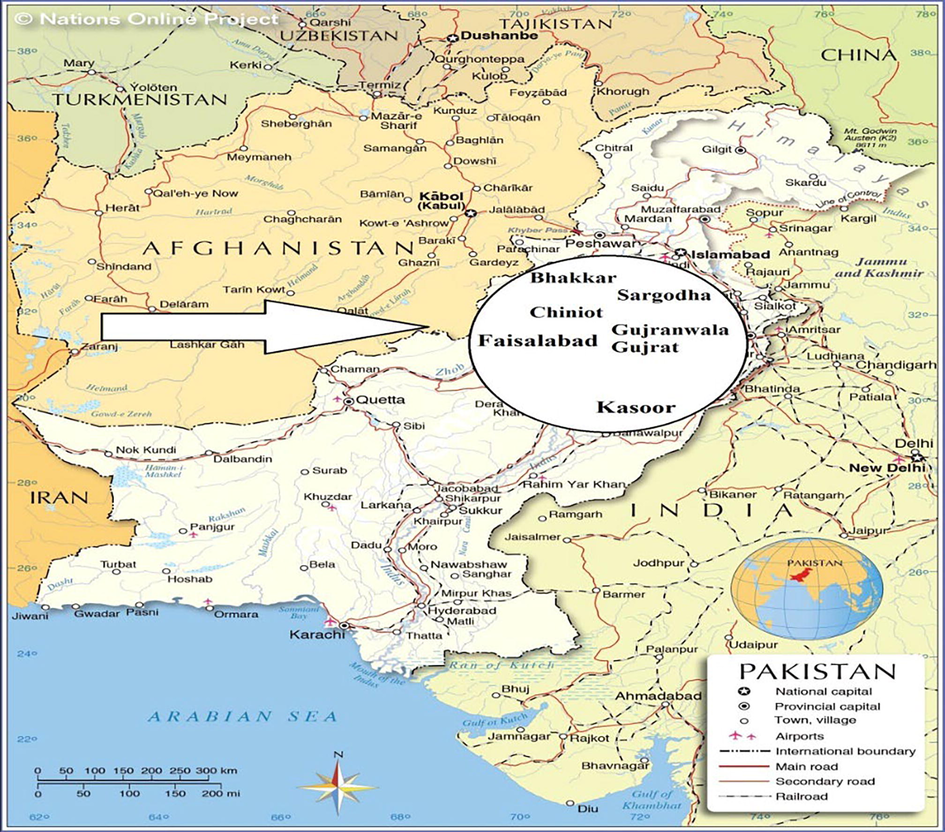
The map of the study area.
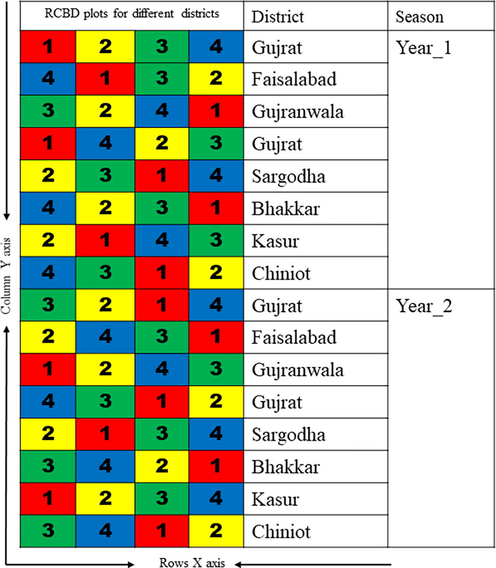
Study design for sample collection for seven districts.
2.2 Research design and sampling procedure
Randomized Whole Block Design (RCBD) was used for sampling in this study, which was carried out as field experiments in 7 different districts of Pakistan's Punjab province during two harvest seasons. In RCBD, one variable is constantly dependent on the other (Khan et al., 2023). Soil, root, shoot and grain samples were collected for each wheat variety irrigated with each different water source from each plot in each region. Four replicate soil/grain/shoot/root samples were prepared for each water source and each wheat variety. Multiple replications were created using samples from various geographic areas. Four replicates of each type of water source were made.
2.3 Irrigation sources and sampling
Through seven districts of Punjab, 100 ml of water samples were collected from three types of water i.e., groundwater (GW), sewage water (SW) and industrial wastewater (IW). Samples collected in polypropylene bottles pre-treated with nitric acid (1%) were transported to Labs and maintained at 4 °C until analyzed (Yang et al., 2020).
2.4 Sampling of soil and wheat varieties
The targeted points to take soil samples were drilled to a depth of 10–15 cm with a stainless-steel drill and all soil layers were partially cleaned. After the soil samples were dried in the open air, they were placed in a forced-air oven at 72 °C for 47 h. Dried samples were placed in polyethylene bags, labelled and sealed. Samples were stored in an incubator at 70 °C for 5 days (Rhue and Kidder, 1983). Wheat samples (shoots, roots and grains) were cleaned and washed with deionized water to remove foreign particles on them. After the wheat samples were dried in the open air, they were placed in a forced-air oven at 72 °C for 48 h. After the moisture was removed, the samples were ground into a fine powder with the help of an electric grinder. The powdered samples were also passed through a 2 mm sieve (Ugulu et al., 2009).
2.5 Digestion procedure
All water samples collected from seven districts were digested using the APHA technique (2005). With 10 ml of HNO3 water, samples were digested in their intense form at 80 °C until the solution turned colourless. The solutions were subsequently filtered through filter paper (0.22 ml, Maidstone Whatman filters) and distilled water was added to bring the level up to 50 ml. Each dried soil and the wheat samples were digested with H2SO4, HClO4, and HNO3, solution (15 ml) in a ratio of (1:1:5) at 80 °C the solution become obvious liquid. After filtration amount of each digested sample was adjusted (50 ml) for further examination.
2.6 Preparation of standard solution
After performing the necessary calculations, the stock solution of 1000 ppm of nickel bromide (Ni) was created and used to generate the standard curve for the nickel. Then, a 100 ml flask was filled with 90 ml of distilled water and 10 ml of the necessary stock solution to create a 100-ppm solution of the metal. The desired volume of the second stock solution was transferred into a volumetric flask with a capacity of 100 ml, and the remaining volume was increased to 100 ml by adding distilled water to provide the necessary concentration of metal.
2.7 Analytical method to determine metal
After completing digestion, wet digestion samples were diluted and all specimens were subjected to metal investigation through an atomic absorption spectrophotometer (AAS). Perkin-Elmer (AAS-5000) was used to calculate the nickel level.
2.8 Pollution indices
2.8.1 Bioaccumulation factor (BAF)
The nickel BAF was determined as the following formula (Li et al., 2007).
2.8.2 Translocation factor (TF)
The TF, which is the ability of a plant to transport stored minerals from one part to another, was calculated with the following formula in this study (Cui et al., 2007).
2.8.3 Bioconcentration factor (BCF)
The BCF represents the link between trace metal concentrations in soil and the amount of heavy metals safe to eat in a portion of cereal crops. In this study, BCF was evaluated using the following formula (Cui et al., 2004). BCF = Nickel in grains / Nickel in soil
2.8.4 Enrichment factor (EF)
The EF is related to the effect of anthropogenic activity on the heavy metal content of the soil. The EF was analyzed using the following formula (Buat-Menard and Chesselet, 1979).
In this study, standard reference concentrations of Ni for soil were applied as 1.5 mg/kg, respectively (Singh et al., 2010). For the wheat grains, standard metal values were applied as 9.06 mg/kg, respectively (FAO/WHO, 2001).
2.8.5 Daily intake of metals (DIM)
The DIM is determined by the regular consumption of the metal concentration in the crops and food products studied. The DIM was calculated with the following formula (Singh et al., 2010).
Cmetal is the nickel content in wheat grains (mg/kg), Dfood intake represents the daily consumption of wheat grain (mg/kg), Baverage weight is the normal weight of the body (kg). 0.242 kg/person is the daily wheat intake, and the average weight of the body that is used is 55.9 kg (Wang et al., 2007).
2.8.6 Health risk index (HRI)
The HRI was created to assess the risks to human health associated with the ingestion of wheat grains contaminated with heavy metals. The HRI was calculated with the following formula (Sajjad et al., 2009).
The RfD (Oral reference dose) value of Ni used in this study is 9.06 mg/kg/day (USEPA, 2010).
2.8.7 Pollution load index (PLI)
The PLI was used to calculate the overall pollution level in the soil. This indicator helps assess the quality of the soil after Ni deposition (Siddique et al., 2019). The PLI was examined using the following formula (Liu et al., 2005). PLI = Ni content in soil/ Reference value of Ni in soil
The reference value of Ni in the soil is 67 mg/kg (USEPA, 2010).
2.9 Statistical analysis
For all data gathered from the heavy metal analysis, Analysis of Variance (ANOVA) was used utilising the Minitab 16 program. Tuckey's HSD test in addition to 3-way ANOVA was applied (Ugulu, 2015b). All of the pairwise comparisons were subjected to Tuckey's HSD test. In Tukey's HSD test, the averages of each application are compared to the averages of all other applications, and the letters represent the difference between the averages (Ugulu et al., 2008).
2.10 Quality control analysis
To evade infection, values were meticulously created. Wheat and soil samples were weighed to determine their dry weight. The experiment was repeated thrice.
3 Results and discussion
3.1 Nickel accumulation in ecological indicators
3.1.1 Water
The statistical analysis showed that the water source and crop year exhibited a significant effect on Ni concentration (p > 0.05) while the interaction of water source and crop year had no influence on Ni concentration in irrigation water from various sources (p > 0.05) (Table 1). The Ni concentration in various water forms of irrigation samples fluctuated between 1.69 and 2.36 mg/L according to findings (Fig. 3). The higher Ni content was discovered in manufacturing water for one season, whereas low was found in groundwater in year two, according to data for mean Ni concentration in three water irrigation sources. ns = non-significant, *, ***= Significant at 0.05 and 0.001 levels.
Source
Df
Mean square
Water source
02
0.54***
Year
01
0.16***
Water source × Year
02
0.008 ns
Error
18
0.008
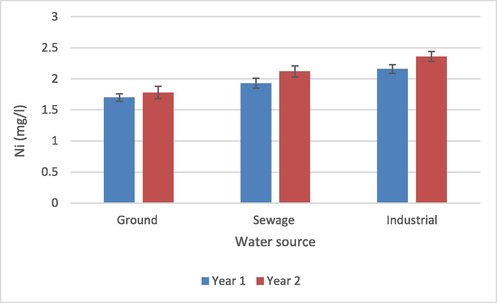
Nickel content in water from various sources.
WWF (2007) suggested the safe limit for Ni in water as 0.20 mg/L; in the present research, all the water samples exceed this limit. In addition, all water samples contained a higher Ni concentration (1.71 mg/L) than the water used for wheat cultivation in the study by Khan et al. (2017). However, Ahmet et al. (2018) found lower Ni values (0.95, 0.89 mg/L) for groundwater and wastewater, respectively. Industrial and municipal discharge without any primary treatment is the main source of higher Ni concentration in water which also pollutes the natural reservoir of water (Alloway, 1995). The continuous use of these untreated water resources for agricultural irrigation can be considered as the reason for the high Ni contents determined in this study.
3.1.2 Soil
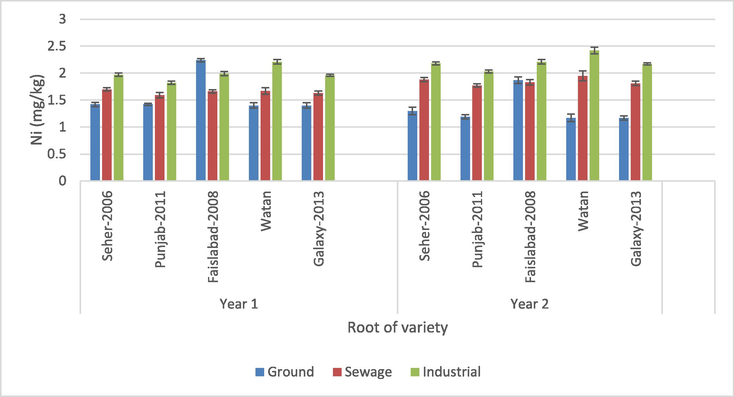
The present results highlight that water source, crop year and wheat variety had a significant effect on the Ni concentration in soil (p > 0.05) (Table 2). Also, the interactions of wheat variety × water source, water source × crop year and wheat variety × water source × crop year exhibited a significant effect on Ni concentration (p > 0.05). For soil samples concentration of Ni ranges between 1.35 and 2.45 mg/kg in different types of soil (Fig. 4). Ni was discovered in all soil specimens planted with varied wheat cultivars and flourished through three different waterways. However, in the second year, the maximum concentration of Ni was discovered in the variety Galaxy-2013 of soil watered with industrial water, whereas the lowest results were discovered in the soil of variety Watan. ns = non-significant, *, ***= Significant at 0.05 and 0.001 levels.
Source
df
Mean square
Variety
04
1.47***
Water source
02
0.22***
Year
01
1.03***
Variety × Water source
08
0.96***
Variety × Year
04
0.03 ns
Water source × Year
02
0.10*
Variety × Water source × Year
08
0.81***
Error
90
1.22
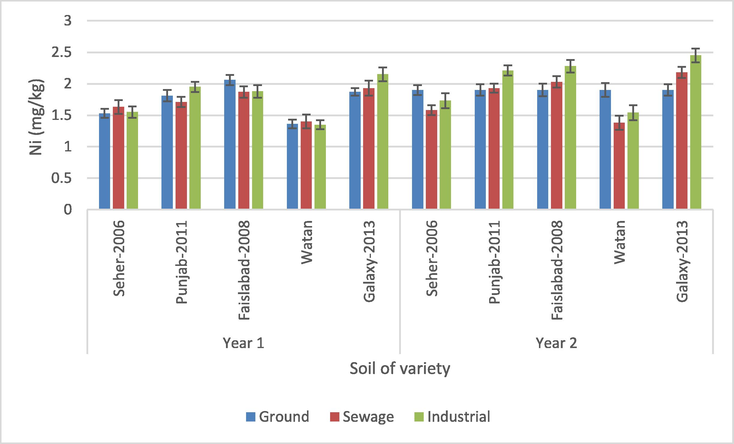
Nickel content in soil flourishes with wheat varieties for three water sources during two seasons.
Nickel (Ni), the 22nd most abundant element in the earth's crust, is found in trace concentrations in natural soils (Hussain et al., 2013). Nickel, a potentially toxic metal, is found in all soils at an average concentration of 20 to 30 mg/kg (Echevarria et al., 2006). The Ni values determined in this study are below these average values. Nickel contents for the soil irrigated with fresh and municipal water (1.36 and 1.61 mg/kg, respectively) given by Khan et al. (2017) were between ranges of the current findings. Yu et al. (2016) and Xiao-Rui (2016) reported the higher Ni concentration (32.08 and 36.33 mg/kg, respectively) in soil samples irrigated with wastewater in different areas of China. However, the Ni values determined in the present study exceed the values (1.30, 1.51 mg/kg) given by Khan et al. (2019) for the canal and sewage water specimens in Pakistan.
3.1.3 Root
The findings specify that the water source and wheat variety had a significant effect on the Ni concentration in the root samples (p > 0.05) (Table 3). Also, the interactions of wheat variety × water source and water source × crop year exhibited a significant effect on Ni concentration (p > 0.05). The maximum quantity of Ni (2.42 mg/kg) was defined in the Watan variety that flourished from urban water during year 2 while the minimum amount of Ni (1.17 mg/kg) was defined in varieties Watan and Galaxy-2013, both grown using groundwater for the second year (Fig. 5). The variety Galaxy-2013, which was cultivated through groundwater in year 2, had a minimum yield, whereas the variety of Watan, which was irrigated via industrial water in year 2, had a greater yield. In year 2, the Galaxy-2013 variety watered with groundwater exhibited the lesser transfer of Ni from soil to root, whereas the variety Watan irrigated with industrial water showed the greatest. ns = non-significant, *, ***= Significant at 0.05 and 0.001 levels.
Source
df
roots
shoots
grains
Variety
04
0.39***
0.33***
0.03***
Water source
02
4.11***
4.43***
1.25***
Year
01
0.10 ns
0.50***
0.48***
Variety × Water source
08
0.34***
0.14***
0.02***
Variety × Year
04
0.01 ns
0.002 ns
0.0001 ns
Water source × Year
02
0.66***
0.23***
0.16***
Variety × Water source × Year
08
0.01 ns
0.002 ns
0.0001 ns
Error
90
0.05
0.003
0.001
Nickel content in roots of wheat crops.
Nickel (Ni) becomes a toxic pollutant in agricultural environments. Studying Ni bioavailability in plants is essential because of its various uses, from many common household items to industrial applications (Khan et al., 2020a, b; Rasheed et al., 2020). Nafees and Amin (2014) performed a study to evaluate heavy metal contents, their uptake and accumulation in different parts of the wheat plant in Peshawar, Pakistan and defined a lower quantity of Ni (0.60 mg/kg) in wheat roots than the present research. In a recent study, the concentrations of Ni for wheat roots sampled from the Yangtze River Delta, China were much lower than those (9.11 mg/kg) reported by Xiao-Rui et al. (2016). In addition, Yu et al. (2016) presented a higher Ni concentration (5.54 mg/kg) in wheat roots. The capability of plants to trace minerals use from soil depends on the genetic characteristics and concentration of metals inside the soil (Ye et al., 2013).
3.1.4 Shoot
Except for the interactions of wheat variety × crop year and wheat variety × water source × crop year, all the parameters showed a significant effect of Ni accumulation in wheat shoots (p > 0.05) (Table 3). Nickel concentrations in samples of shoot of wheat ranged from 1.09 to 2.10 mg/kg for different wheat varieties (Fig. 6). Variety Faislabad-2008 irrigated with industrial water had the greatest Ni concentration of 2.10 mg/kg in year 2, whereas variety Galaxy-2013 crop with canal water had a lower 1.09 mg/kg in year 1. Varieties Watan irrigated with industrial water in the first year and 2011 Punjab irrigated through built-up water in the second year had the highest and lowest Ni transfer, respectively.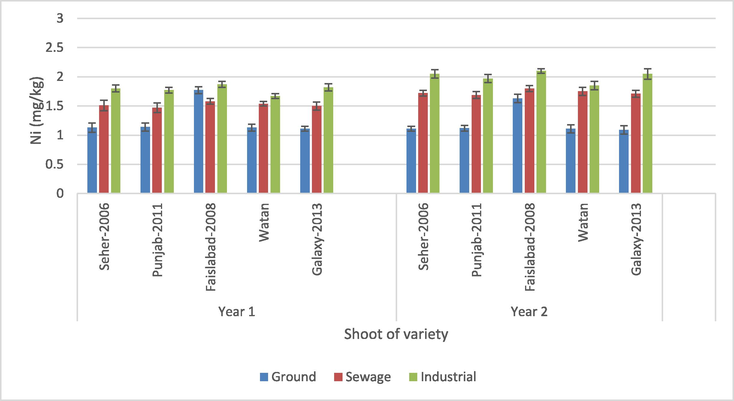
Nickel content in the shoot.
In the present study, all the shoot samples contained higher Ni concentrations than the value (0.80 mg/kg) in wheat samples grown in sewage irrigation reported by Yu et al. (2016). Neeratanaphan et al. (2017) and Nafees and Amin (2014) also documented lower Ni contents in shoot samples (0.53 and 0.06 mg/kg, respectively). Nickel concentration (1.44 mg/kg) in the wheat shoots sampled from the Yangtze River Delta, China as suggested by Xiao-Rui et al. (2016) was similar to the recent studies. The mechanism through which the heavy metals are transported to the different parts of the plants is directly related to the increase of heavy metals in these parts. It is also reliant on plant variety and concentration of metal in the soil. This might be the possible reason for the highest Ni concentration in shoot samples (Ye et al., 2013; Ma et al., 2014).
3.1.5 Grain
According to the statistical analysis of the Ni values for the wheat grain samples, except for the interactions of wheat variety × crop year and wheat variety × water source × crop year, all the parameters showed a significant effect of Ni accumulation in wheat grains (p > 0.05) (Table 3). The Ni concentration in different wheat cultivars fluctuated from 0.99 to 1.54 mg/kg, according to the findings. The maximum amount of Ni was identified in variety Faislabad-2008 cropped by manufacturing water in year 2 and the minimum amount found in variety Galaxy-2013 irrigated with groundwater during year 2 among every variety irrigated with various sources of water in two cropping years (Table 3). In year 1, the highest transfer was reported for the variety Watan irrigated with groundwater, lowest for the variety Faisalabad-2008 irrigated with groundwater (see Fig. 7).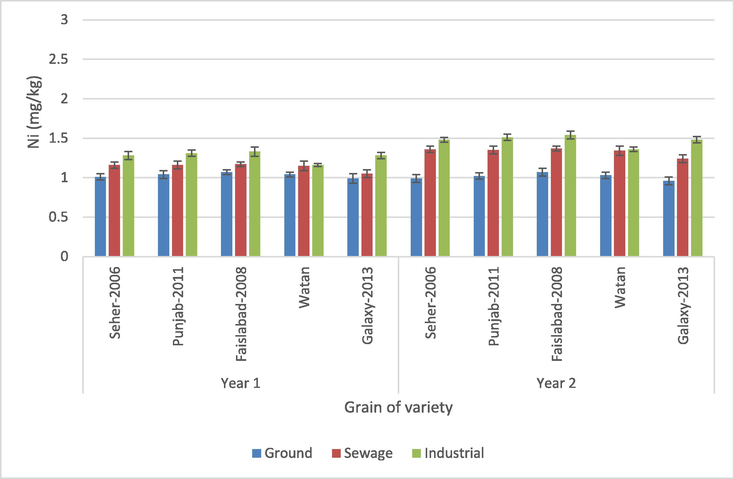
Nickel content in grains of different wheat varieties.
For the current study, the Ni values for wheat varieties were found lower than the values (1.69, 1.93 mg/kg) given by Khan et al. (2017) of ground and sludge water irrigated grains, respectively. The Ni range of wheat grains in the present study was found higher than the wheat grains (0.28 mg/kg) grown in the Tianjin sewage irrigation area reported by Zeng et al. (2015). Different industries like metal finishing, electroplating, circuit board production and many others are the main source of the heavy metal discharge as a pollutant to the environment, which may increase the concentration of Ni in grains (Khan et al., 2019a, b; Ugulu et al., 2021a, b). Rattan et al. (2005) reported higher values (19.07, 20.0 mg/kg) of Ni in grains irrigated with ground and sewage water. The concentrations of Ni in every specimen were within acceptable limits (67 mg/kg) (FAO/WHO, 2001). The present Ni values in grains were within the safe limits and did not show any toxic effect.
3.2 Pollution indices
3.2.1 Pollution load index
The PLI range of Ni was between 0.15 and 0.27 (Table 4). All the soil samples showed PLI for Ni less than 1. The soil of variety Galaxy-2013 watered by way of industrial water in year 2 had the lowest PLI value for Ni, while Watan irrigated with the ground, sewage, and industrial water in year 1 and manure water in year 2 were the highest pollution load index for Ni (Table 4). PLI levels>1 indicate soil contamination, while PLI values less than 1 indicate that the soil is toxically safe (Ugulu et al., 2022a, b). The fact that the PLI values in the current findings are less than 1 indicates that the soil in the study area is not contaminated. The PLI values for Ni (0.34, 0.40) reported by Bibi et al. (2014) at two different sites (irrigated with groundwater and domestic sewage water) were found higher than all those values which were investigated in the current study. The higher PLI value for Ni (1.62) in soil samples irrigated with wastewater in Sargodha, Pakistan was also given by Ahmad et al. (2014). Khan et al. (2017) determined the PLI values for Ni (0.34, 0.40) in two types of soil irrigated with canal water and sewage water, respectively, which is found in an array of the current study. Lucho-Contantino et al. (2005) found a direct relationship between irrigation time and metal accrual in soil. The determination of various PLI values for different studies can be explained by soil–plant relationships as well as the duration of irrigation of the soil with wastewater.
Cropping year
Irrigation sources
Wheat varieties
Seher-2006
Punjab-2011
Faislabad-2008
Watan
Galaxy-2013
Year 1
GW
0.17
0.20
0.23
0.15
0.21
SW
0.18
0.19
0.21
0.15
0.21
IW
0.17
0.22
0.21
0.15
0.24
Year 2
GW
0.21
0.21
0.21
0.21
0.21
SW
0.17
0.21
0.22
0.15
0.24
IW
0.19
0.24
0.25
0.17
0.27
3.2.2 Bioaccumulation factor for shoot-wheat
In all types of samples, the BAF values for Ni varied from 0.57 to 1.27 (Table 5). The lowest BAF value for Ni was found in variety Galaxy-2013 irrigated with groundwater in year 2, while the highest was found in variety Watan irrigated with the sewage water. Nickel BAF values in the current study were found higher than the values (0.07–0.08) reported by Khan et al. (2016). Alghobar and Suresha (2016) documented the BAF values between 0.20 and 0.32 for wastewater-irrigated rice crops and Khan et al. (2013) reported lower BAF values of 0.05–0.08 for various food crops in Pakistan. In this study, the BAF value was found to be higher than 1 for Variety Saher 2006. It has been observed that some plant species have the ability to remove heavy metals from soil and groundwater by absorbing and accumulating through their roots, adsorption at the top of the roots or precipitation at the root zone (Prasad and Freitas, 2003; Sahin et al., 2016). Differences in BAF values among the findings may be due to differences in plant species.
Cropping year
Irrigation sources
Wheat varieties
Seher-2006
Punjab-2011
Faislabad-2008
Watan
Galaxy-2013
Year 1
GW
0.74
0.63
0.86
0.83
0.59
SW
0.93
0.86
0.84
1.1
0.78
IW
1.16
0.91
0.99
1.24
0.85
Year 2
GW
0.58
0.59
0.86
0.58
0.57
SW
1.09
0.88
0.89
1.27
0.78
IW
1.18
0.89
0.92
1.20
0.84
3.2.3 Translocation factor
The TF for Ni in various samples was lower than 1 according to the findings. The TF of Ni for diverse kinds of samples ranged from 0.76 to 0.97 (Table 6). The maximum TF for Ni was found in the variety Watan, which was grown using built-up water in year 2, while the low TF for Ni originated within the varieties Punjab-2011, which was irrigated with industrial water in cropping years 1 and 2 and Galaxy-2013, which was irrigated with groundwater in year 1. The TF values for Ni in all samples showed values below 1. These values indicate that Ni is not stored in the shoots. The TF values for Ni in Momordica charantia grown in soil irrigated with domestic sewage water in Sargodha given by Bibi et al. (2014) were found between 1.53 and 1.55 and higher than the present values. However, the Ni TF value range in Oryza sativa samples grown in a paddy field reported by Hadif et al. (2015) was between 0.3 and 0.4 and found lower compared to the current conclusion. Neeratanaphan et al. (2017) also reported a lower TF value (0.25) in rice (Oryza sativa) near electronic waste dumps.
Cropping year
Irrigation sources
Wheat varieties
Seher-2006
Punjab-2011
Faislabad-2008
Watan
Galaxy-2013
Year 1
GW
0.80
0.80
0.79
0.81
0.97
SW
0.89
0.92
0.95
0.92
0.92
IW
0.91
0.97
0.94
0.76
0.93
Year 2
GW
0.85
0.94
0.87
0.95
0.93
SW
0.91
0.95
0.98
0.90
0.94
IW
0.94
0.97
0.95
0.76
0.94
3.2.4 Bioconcentration factor for wheat-grain
The BCF for Ni fluctuated from 0.51 to 0.88 (Table 7). The minimum concentration concluded for the variety Galaxy-2013 grown in groundwater for the second year while the maximum value was observed in the Watan variety of industrial water in the second year. The BCF values for Ni in the present research were found parallel to the values for the wheat samples irrigated with canal water and sewage water (0.62–2.60, respectively) reported by Khan et al. (2017) and the values for the wheat variety “Chagi-2” under short-term wastewater irrigation (0.45–0.73) by Ahmad et al. (2018). In all samples, the Ni range for BCF was greater than the value (0.01) reported by Sakizadeh and Ghorbani (2017). Jamali et al. (2009) also reported lower BCF values for Ni (0.11–0.17) in different varieties of wheat amended with domestic sewage sludge. The weathering process is the main reason for Ni mobilization. However, it is observed that soil pH had an inverse linkage with Ni mobility (Ugulu et al., 2020). In the present research, soil pH was high, which might be the possible reason for the lesser uptake of Ni.
Cropping year
Irrigation sources
Wheat varieties
Seher-2006
Punjab-2011
Faislabad-2008
Watan
Galaxy-2013
Year 1
GW
0.66
0.57
0.52
0.76
0.53
SW
0.71
0.68
0.63
0.82
0.54
IW
0.83
0.67
0.71
0.86
0.60
Year 2
GW
0.52
0.54
0.56
0.54
0.51
SW
0.86
0.70
0.67
0.97
0.57
IW
0.86
0.68
0.68
0.88
0.60
3.2.5 Enrichment factor
Analysis revealed EF of Ni was less than 1 for diverse samples. The range of EF for Ni was 0.07 to 0.13 (Table 8). The results showed that varieties Punjab-2011 and Seher-2006 were cultivated in groundwater, variety Faisalabad-2008 in groundwater for the first year, and variety Watan for groundwater while Galaxy variety-2013 growing in groundwater and sludge water for both years had the lowest EF of Ni. The peak EF was examined in the variety of Watan of the second season. The EF values for Ni in the current study for all samples were lower than the values (5.0–6.53) given by Ololade (2014). Singh et al. (2010) also suggested a higher EF value (15.26) for Ni in rice plants grown at different sewage sludge amendments. Variations in the data size for all the metals in the soil and the exclusion speed of all the metals from the soil may be the possible reason for the difference in the EF of metals and metalloids (Ugulu et al., 2020; Khan et al., 2021).
Cropping year
Irrigation sources
Wheat varieties
Seher-2006
Punjab-2011
Faislabad-2008
Watan
Galaxy-2013
Year 1
GW
0.09
0.08
0.07
0.10
0.07
SW
0.10
0.09
0.08
0.11
0.07
IW
0.11
0.09
0.10
0.12
0.08
Year 2
GW
0.07
0.07
0.08
0.07
0.07
SW
0.12
0.09
0.09
0.13
0.07
IW
0.12
0.09
0.09
0.12
0.08
3.2.6 Daily intake of metal
The DIM values for Ni varied from 0.004 to 0.007 (Table 9). The DIM values for wheat varieties were not greatly affected by water irrigation sources. The cropping year also did not affect the regular consumption of Ni in various wheat varieties. The maximum daily intake for Ni was observed in varieties Punjab-2011 and Faislabad-2008. The lower DIM values were recorded in varieties of Seher-2006 and Galaxy-2013 irrigated with groundwater for the second year. All the samples in the present study had a daily intake of Ni below the estimated daily tolerable intake value for Ni (1.400 mg/kg/day) (USEPA, 2010). Khan et al. (2013) investigated the human health risk from Ni via food crops consumption with wastewater irrigation practices in Pakistan and determined a lower DIM value (0.003 mg/kg/day) for Ni. Zeng et al. (2015) also researched the health risk of heavy metals via dietary intake of wheat grown in the Tianjin sewage irrigation area, China and reported a low DIM value (0.0006 mg/kg/day) of Ni.
Cropping year
Irrigation sources
Wheat varieties
Seher-2006
Punjab-2011
Faislabad-2008
Watan
Galaxy-2013
Year 1
GW
0.004
0.005
0.005
0.005
0.004
SW
0.005
0.005
0.005
0.005
0.005
IW
0.006
0.006
0.006
0.005
0.006
Year 2
GW
0.004
0.004
0.005
0.004
0.004
SW
0.006
0.006
0.006
0.006
0.005
IW
0.006
0.007
0.007
0.006
0.006
3.2.7 Health risk index
The HRI values of Ni for different wheat varieties irrigated with diverse water sources ranged from 0.21 to 0.33 (Table 10). The maximum value for Ni was noticed for Punjab-2011 and Faislabad-2008 varieties irrigated with industrial wastewater in the second year while the minimum was in Seher-2006. The HRI values of wheat samples for Ni revealed less than 1. This indicated the consumption of these kinds of wheat caused no Ni toxicity to human beings. The HRI values of Ni recorded in the present research were higher than the values (0.002) recorded by Neeratanaphan et al. (2017). The HRI value (0.31) of Ni for wheat growing in groundwater-irrigated soil recorded by Khan et al. (2017) was found similar to the current findings but the HRI value (0.39) of Ni given for sewage water-grown sample was found to higher than the present results. Pollutants affect human beings in various ways but one of the important possible pathways to heavy metal exposure is the food chain (Khan et al., 2018a, b; Huma et al., 2019; Ugulu et al., 2021c, d).
Cropping year
Irrigation sources
Wheat varieties
Seher-2006
Punjab-2011
Faislabad-2008
Watan
Galaxy-2013
Year 1
GW
0.22
0.23
0.23
0.23
0.21
SW
0.25
0.25
0.25
0.25
0.23
IW
0.28
0.28
0.29
0.25
0.28
Year 2
GW
0.21
0.22
0.23
0.22
0.21
SW
0.29
0.29
0.30
0.29
0.27
IW
0.32
0.33
0.33
0.29
0.23
4 Conclusion
Research findings reveal that nickel concentration in soil and grains is within the safe limits and all the indices for Ni are lower than 1. However, continuous sewage and industrial wastewater irrigation having a significant concentration of Ni may further contaminate soil as well as wheat cultivars across the Punjab region and may pose serious threats to the health of the human and herbivore population. Therefore, actions such as bioremediation to reduce trace metal contamination in soil and water regimes may be beneficial in areas where wastewater irrigation is heavily irrigated.
Acknowledgements
We extend our appreciation to the Researchers Supporting Project (no. RSP2023R218), King Saud University, Riyadh, Saudi Arabia.
Author contributions
TA and AA were responsible for writing the manuscript. IU and AFA proposed the idea and designed the study. ZIK and KA supervised the study. AZ, SA and SM were responsible for conducting the experiments and the data was analyzed by IU. NM and ZIK reviewed and revised the manuscript. All authors read and approved the final manuscript.
Conflict of interest
The authors declare that they have no conflict of interest.
Funding
No funds were received.
References
- Assessment of heavy metal and metalloid levels in spinach (Spinacia oleracea.) grown in wastewater irrigated agricultural soil of Sargodha, Pakistan. Pak. J. Bot.. 2014;46(5):1805-1810.
- [Google Scholar]
- Assessment of heavy metals in wheat variety ‘‘Chagi-2’’ under short-term wastewater irrigation. Biologia (Pakistan). 2018;64(1):15-25.
- [Google Scholar]
- Effects of fertilizers on copper and nickel accumulation and human health risk assessment of vegetables and food crops. J. Biores. Manag.. 2023;10(1):84-96.
- [Google Scholar]
- Effect of wastewater irrigation on growth and yield of rice crop and uptake and accumulation of nutrient and heavy metals in soil. Appl. Ecol. Environ. Sci.. 2016;4(3):53-60.
- [Google Scholar]
- Heavy Metals in Soils. London: Blackie Academic and Professional; 1995. p. :7-39.
- APHA (American Public Health Association) 2005. Standard methods for the examination of Water and Wastewater, American Public Health Association, Washington, DC. USA.
- Field accumulation risks of heavy metals in soil and vegetable crop irrigated with sewage water in western region of Saudi Arabia. Saudi J. Biol. Sci.. 2016;23:32-44.
- [Google Scholar]
- Vegetables as a potential source of metals and metalloids for human nutrition: a case study of momordica charantia grown in soil irrigated with domestic sewage water in Sargodha. Pakistan. Pak. J. Zool.. 2014;46(3):633-641.
- [Google Scholar]
- Variable influence of the atmospheric flux on the trace metal chemistry of oceanic suspended matter. Earth Planet Sci. Lett.. 1979;42:398-411.
- [Google Scholar]
- Evaluation of toxicity potential of cobalt in wheat irrigated with wastewater: health risk implications for public. Environ. Sci. Pollut. Res.. 2021;28(17):21119-21131.
- [CrossRef] [Google Scholar]
- Potential hyper-accumulation of Pb, Zn, Cu and Cd in endurant plants distributed in an old smeltery, northeast China. Environ. Geology.. 2007;51:1043-1048.
- [Google Scholar]
- Transfer of metals from near a smelter in Nanjing. China. Environ. Int.. 2004;30:785-791.
- [Google Scholar]
- Determination of some ecological characteristics and economical importance of Vitex agnus-castus. Eurasia. J. Biosci.. 2011;5:10-18.
- [CrossRef] [Google Scholar]
- Assessment and control of the bioavailability of nickel in soils. Environ. Toxicol. Chem.. 2006;25(3):643-651.
- [Google Scholar]
- FAO/WHO. 2001. Codex Alimentarius Commission. Food additive and contaminants. Joint FAO/ WHO Food Standards Programme, ALINORM 01/ 12A, pp: 1- 289.
- Govt. of Pakistan. 2008. Agricultural Statistics of Pakistan 2006-2007, Ministry of Food Agric. and Livestock (Econ. Wing) Islamabad.
- Hadif, W.M., Rahim, S.A., Shahid, I., Bhuiyan, A.R., Ibrahim, I., 2015. Heavy metal accumulation in parts of paddy Oryza sativa L. grown in paddy field adjacent to ultrabasic soil, AIP Conference Proceedings. pp. 1-11.
- Biotransfer of cobalt along a soil-plant-chicken food chain: Implication for public health. Pure Appl. Biol.. 2019;8(3):2015-2027.
- [Google Scholar]
- Morphological, physiological and biochemical responses of plants to nickel stress: a review. Afr. J. Agr. Res.. 2013;8:1596-1602.
- [Google Scholar]
- Heavy metal accumulation in different varieties of wheat (T. aestivum L.) grown in soil amended with domestic sewage sludge. J. Hazard. Mater.. 2009;164:1386-1391.
- [Google Scholar]
- Risk assessment of heavy metal toxicity through contaminated vegetable from sewage water: Implications for populace health. Human Ecol. Risk. Assess.. 2016;22(2):302-311.
- [Google Scholar]
- Manganese bioaccumulation and translocation of in forages grown in soil irrigated with city effluent: An evaluation on health risk. Research Journal of Pharmaceutical, Biological and Chemical Sciences. 2018;9(5):759-770.
- [Google Scholar]
- Human health risk from heavy metal via food crops consumption with wastewater irrigation practices in Pakistan. Chemosphere. 2013;93:2230-2238.
- [Google Scholar]
- Evaluation of heavy metals uptake by wheat growing in sewage irrigated soil: relationship with heavy metal in soil and wheat grains. Fresenius Environ. Bull.. 2017;26(12):7838-7848.
- [Google Scholar]
- Assessment of Trace Metal and Metalloid Accumulation and Human Health Risk from Vegetables Consumption through Spinach and Coriander Specimens Irrigated with Wastewater. Bull Environ Contam Toxicol. 2018;101:787-795.
- [CrossRef] [Google Scholar]
- Toxicological potential of cobalt in forage for ruminants grown in polluted soil: a health risk assessment from trace metal pollution for livestock. Environ. Sci. Pollut. Res.. 2019;26:15381-15389.
- [Google Scholar]
- Determination of cadmium concentrations of vegetables grown in soil irrigated with wastewater: Evaluation of health risk to the public. Egypt. J. Bot.. 2019;59(3):753-762.
- [Google Scholar]
- Efficacy of transfer of heavy metals in wheat grown in municipal solid waste amended soil. Catrina-The International Journal of Environmental Sciences. 2019;20(1):31-38.
- [Google Scholar]
- Copper bioaccumulation and translocation in forages grown in soil irrigated with sewage water. Pak. J. Bot.. 2020;52(1):111-119.
- [Google Scholar]
- Human health risk assessment through the comparative analysis of diverse irrigation regimes for Luffa (Luffa cylindrica (L.) Roem.) Journal of Water, Sanitation and Hygiene for Development. 2020;10(2):249-261.
- [CrossRef] [Google Scholar]
- Biomonitoring of heavy metals accumulation in wild plants growing at soon valley, Khushab. Pakistan. Pak. J. Bot.. 2021;53(1):247-252.
- [Google Scholar]
- Cobalt availability in the soil plant and animal food chain: a study under a peri-urban environment. Brazilian J. Biol.. 2023;83:e270256.
- [Google Scholar]
- Heavy metal concentrations in soils and plant accumulation in a restored manganese mineland in Guangxi, South China. Environ. Poll.. 2007;147:168-175.
- [Google Scholar]
- Impacts of sewage irrigation on heavy metals distribution and contamination in Beijing. China. Environ. Int.. 2005;31:805-812.
- [Google Scholar]
- A multivariate analysis of the accumulation and fractionation of major and trace elements in agricultural soils in Hidalgo State, Mexico irrigated with wastewater. Environ. Int.. 2005;31:313-323.
- [Google Scholar]
- Migration and accumulation of heavy metals in soil-crop-hair system in a sewage irrigation area, Henan. China. Acta Sci. Circumst.. 2014;34:1517-1526.
- [Google Scholar]
- Transfer of heavy metals from different sources of fertilizers in wheat variety (Galaxy-13) Asian J. Biol. Sci.. 2019;12(4):832-841.
- [CrossRef] [Google Scholar]
- Evaluation of heavy metals accumulation in different parts of wheat plant grown on soil amended with sediment collected from kabul river canal, evaluation of heavy metals accumulation in wheat plant. J. Agric. Res.. 2014;52(3):383-394.
- [Google Scholar]
- Heavy metal accumulation in rice (Oryza sativa) near electronic waste dumps and related human health risk assessment. Human Ecol. Risk. Assess.. 2017;23(5):1086-1098.
- [Google Scholar]
- An assessment of heavy-metal contamination in soils within auto-mechanic workshops using enrichment and contamination factors with geoaccumulation indexes. J. Environ. Protect.. 2014;5:970-982.
- [Google Scholar]
- Analysis of heavy metal sources for vegetable soils from Shandong Province. China. Agric. Sci. China.. 2011;10:109-119.
- [Google Scholar]
- Metal hyperaccumulation in plants-biodiversity prospecting for phytoremediation technology. Electron. J. Biotechnol.. 2003;6(3):110-146.
- [Google Scholar]
- Assessment of trace metal contents of indigenous and improved pastures and their implications for livestock in terms of seasonal variations. Rev. Chim.. 2020;71(7):347-364.
- [Google Scholar]
- Long-term impact of irrigation with sewage effluents on heavy metal content in soils, crops and groundwater—a case study. Agric. Ecosyst. Environ.. 2005;109(3–4):310-322.
- [Google Scholar]
- Rhue, R.D., Kidder, G., 1983. Analytical procedures used by the IFAS extension soil laboratory and the interpretation of results. Soil Sci. Dept., Univ. Florida, Gainesville.
- Change in serial blood lead levels during pregnancy. Environ. Health. Perspect.. 1994;102(10):876-880.
- [Google Scholar]
- Sahin, I., Akcicek, E., Guner, O., Dogan, Y., Ugulu, I. 2016. An investigation on determining heavy metal accumulation in plants growing at Kumalar Mountain in Turkey. EurAsian J. BioSci., 10, 22–29. https://doi.org/0.5053/ejobios.2016.10.0.3.
- Health risk assessment of heavy metals for population via consumption of vegetables. World. Appl. Sci. J.. 2009;6:1602-1606.
- [Google Scholar]
- Concentration of heavy metals in soil and staple crops and the associated health risk. Arch. Hyg. Sci.. 2017;6(4):303-313.
- [Google Scholar]
- Sodium status of soil, forages, and small ruminants of Punjab. Pakistan. Pure Appl. Biol.. 2019;8(3):1950-1961.
- [Google Scholar]
- Health risk assessment of heavy metals via dietary intake of foodstuffs from the wastewater irrigated site of a dry tropical area of India. Food Chem. Toxicol.. 2010;48:611-619.
- [Google Scholar]
- Risk Assessment of Heavy Metals in Basmati Rice: Implications for Public Health. Sustainability. 2021;13:8513.
- [CrossRef] [Google Scholar]
- Determination of heavy metal accumulation in plant samples by spectrometric techniques in Turkey. Appl. Spectros. Rev.. 2015;50(2):113-151.
- [CrossRef] [Google Scholar]
- A quantitative investigation on recycling attitudes of gifted/talented students. Biotech. Biotechnol. Equip.. 2015;29:20-26.
- [CrossRef] [Google Scholar]
- The impact of endemism concept on environmental attitudes of secondary school students. Natura Montenegrina. 2008;7(3):165-173.
- [Google Scholar]
- The determination of colour intensity of Rubia tinctorum and Chrozophora tinctoria distributed in Western Anatolia. Biotech. Biotechnol. Equip.. 2009;23(SE):410-413.
- [CrossRef] [Google Scholar]
- Trace metal accumulation in pepper (Capsicum annuum L.) grown using organic fertilizers and health risk assessment from consumption. Food Res. Int.. 2021;140:109992
- [CrossRef] [Google Scholar]
- Effects of organic and chemical fertilizers on the growth, heavy metal/metalloid accumulation, and human health risk of wheat (Triticum aestivum L.) Environ. Sci. Pollut. Res.. 2021;28:12533-12545.
- [CrossRef] [Google Scholar]
- Potentially Toxic Metal Accumulation in Spinach (Spinacia oleracea L.) Irrigated with Industrial Wastewater and Health Risk Assessment from Consumption. Bull. Environ. Contam. Toxicol.. 2022;109:1117-1125.
- [CrossRef] [Google Scholar]
- Ugulu, I., Khan, Z.I., Rehman, S., Ahmad, K., Munir, M., Bashir, H., 2020. Effect of wastewater ırrigation on trace metal accumulation in spinach (Spinacia oleracea L.) and human health risk. Pak. J. Anal. Environ. Chem., 21(1),92-101. http://doi.org/10.21743/pjaec/2020.06.11.
- Potentially toxic metal accumulation and human health risk from consuming wild Urtica urens sold on the open markets of Izmir. Euro-Mediterr. J. Environ. Integr.. 2019;4:36.
- [CrossRef] [Google Scholar]
- Trace metal accumulation in Trigonella foenum-graecum irrigated with wastewater and human health risk of metal access through the consumption. Bull. Environ. Contam. Toxicol.. 2019;103:468-475.
- [CrossRef] [Google Scholar]
- Effect of wastewater irrigation as an alternative irrigation resource on heavy metal accumulation in ginger (Zingiber officinale Rosc.) and human health risk from consumption. Arabian Journal of Geosciences. 2021;14(702)
- [CrossRef] [Google Scholar]
- Chromium Bioaccumulation by Plants and Grazing Livestock as Affected by the Application of Sewage Irrigation Water: Implications to the Food Chain and Health Risk. Int. J. Environ. Res.. 2021;15:261-274.
- [CrossRef] [Google Scholar]
- Potentially toxic metal accumulation in grains of wheat variety Galaxy-2013 irrigated with sugar industry wastewater and human health risk assessment. Euro-Mediterr. J. Environ. Integr.. 2021;6:38.
- [CrossRef] [Google Scholar]
- Heavy Metal Accumulation in Goosefoot (Chenopodium album L.) Irrigated with Wastewater. Pak. J. Anal. Environ. Chem.. 2022;23(2):225-236.
- [Google Scholar]
- Determination of heavy metal accumulation in wastewater irrigated pumpkin (Cucurbita maxima Duch.) by spectroscopic method. Arabian. J. Geosci.. 2022;15:1238.
- [CrossRef] [Google Scholar]
- USEPA 2010. Exposure Factors Handbook – General Factors. EPA/600/P-95/002Fa, vol. I. Office of Research and Development. National Center for Environmental Assessment. US Environmental Protection Agency, Wahington, DC.
- Effect of organic manure and mineral fertilizers on bioaccumulation and translocation of trace metals in maize. Bull. Environ. Contam. Toxicol.. 2020;104:649-657.
- [CrossRef] [Google Scholar]
- Investigation on dietary of urban residents in Tianjin from 2000–2004. China J. Public. Health.. 2007;23:1245.
- [Google Scholar]
- WWF 2007. Report on National Surface Water Classification Criteria. Irrigation Water Quality Guidelines for Pakistan. February, 2007. Wastewater Forum Pakistan.
- Accumulation of heavy metals in different parts of wheat plant from the Yangtze River Delta. China. Int. J. Agric. Biol.. 2016;18:1242-1248.
- [Google Scholar]
- Assessing Health Risk in Livestock through Quantification of Iron in Forages, Soil and Buffalo Blood from Sargodha. Pakistan. Rev. Chim.. 2020;71(9):221-229.
- [Google Scholar]
- Heavy metal pollution and migration in soil-wheat system of different livestock manures agricultural areas. Geograph. Res.. 2013;32:645-652.
- [Google Scholar]
- Heavy metals in wheat grown in sewage irrigation: a distribution and prediction model. Polish J. Environ. Stud.. 2016;25(1):413-418.
- [Google Scholar]
- Health risk assessment of heavy metals via dietary intake of wheat grown in Tianjin sewage irrigation area. Ecotoxicol.. 2015;24:2115-2124.
- [Google Scholar]


