

Translate this page into:
Evaluation of water quality via determination of trihalomethanes in water distribution networks of Riyadh city in Kingdom of Saudi Arabia
⁎Corresponding author. almoiqli@kacst.edu.sa (Mohammed S. Almoiqli)
-
Received: ,
Accepted: ,
This article was originally published by Elsevier and was migrated to Scientific Scholar after the change of Publisher.
Peer review under responsibility of King Saud University. Production and hosting by Elsevier.
Abstract
Trihalomethane (THM) has been classified as a possible human carcinogen by the International Agency for Research on Cancer (IARC). This study was conducted to assess the levels of trihalomethane compounds in the Riyadh city water network in two different years (2015 and 2020) and to understand the factors affecting the formation of these compounds. The study covered 15 sites in Riyadh city, distributed between the north, south, east, west and middle of the city. The results of the study indicated that the sum of the ratio of the concentration of each THM compound to its respective World Health Organization (WHO) guideline value not exceed 1 (unitless) where the combined toxicity of all total trihalomethanes THMs concentrations did not exceed the permissible limits, with values ranging between 0.01 and 0.24 at all study sites. These results were less than the recommended guide values form WHO for individual maximum concentrations of each of the THM in water for human consumption. In addition, the average concentration of free chlorine was 0.04 ppm and 0.09 ppm in 2015 and 2020, respectively, indicating that the disinfection had evolved in 2020 compared to 2015. Moreover, there was a weak relationship between trihalomethane formation and the presence of bromide ions and organic carbon, whereas a positive correlation was observed with free chlorine and pH values. The concentration of heavy metals such as cadmium, arsenic, cobalt and chromium were analysed by inductively coupled plasma-optical emission spectroscopy. The results indicated that all heavy metals were within the standard limits: the maximum values were 123 ppb in 2015 and 70.39 ppb in 2020, with lead having the lowest concentration and aluminium having the highest concentration in both years. Furthermore, the ion chromatography results of the cations (sodium Na±, potassium K±, calcium Ca2+and magnesium Mg2+) and the anions (fluoride F-, bromide Br-, chloride Cl-, sulphate SO42- and nitrate NO3–) indicated that the water in this study was suitable for human consumption based on the WHO regulation and the Ministry of Environment, Water and Agriculture (MEWA) standards for drinking water.
Keywords
Trihalomethane
Water quality
Riyadh region
Free chlorine
Total organic carbon
Ion Chromatography

1 Introduction
The Kingdom of Saudi Arabia is situated in an extremely hot and arid area and suffers from a shortage of water, with an annual rainfall of between 50 and 150 mm (Mujathel et al., 2022). The water demand in the Kingdom of Saudi Arabia is satisfied by renewable and non-renewable groundwater, surface water, desalinated water and treated wastewater (Chowdhury and Al-Zahrani, 2013).Fig. 1.
Map displaying Riyadh city and the locations under investigation.
The capital of Saudi Arabia is Riyadh, which is in the centre of the Kingdom. Riyadh is considered an arid region, and its rainfall rates are low compared to other regions of the Kingdom. In addition to accelerated urbanisation and population growth, the region faces a significant challenge in its water supply (El Alfy et al., Sep. 2016). The total water source in Riyadh city is 954 million cubic meters (m3), which is made up of 62.78 % desalinated water and 37.21 % ground water, and the per capita consumption rate of water is 348 L per person per day (W. and A. Ministry of Environment, 2021). One of the treatment techniques most used to eliminate microorganisms is chlorination; however, when the water contains natural organic matter, the chlorination process may generate disinfection by-products (DBPs), especially trihalomethanes (THMs) (Doederer et al., 2014).
The widespread distribution of DBPs, particularly THMs in surface water, has prompted health concerns due to their genotoxic and carcinogenic effects on humans. According to the World Health Organization (WHO), four THMs make up the majority of the chlorinated by-products (CBPs), chloroform (CHCl3), dibromochloromethane (CHClBr2), bromodichloromethane (CHCl2Br) and bromoform (CHBr3) (Amy et al., 2004). Concerns have been raised about the potential effects of CBPs, also known as “halogenated genotoxic compounds”, following the long-term intake of chlorinated water.
Although considerable amounts of THMs quickly form after the addition of chlorine, an extended reaction time can also contribute to higher levels of THMs in water, with the rate of formation decreasing after the rapid reaction phase. The majority of THMs are formed within the first eight hours of the reaction (Ramavandi et al., 2015; Ye et al., 2009).
According to research published in the journal Chemosphere (Chang et al., 2001), THM levels do not appear to significantly rise after 48 h following chlorination. To safely preserve drinking water from bacterial contamination, water distribution systems have to provide sufficient residual chlorine, and the maintenance of free chlorine residuals may increase the amount of THMs in drinking water. In general, as long as disinfectant residuals and precursors are present, DBPs continue to accumulate in water; however, it should be noted that some DBPs, including those initially created, such as HANSs and haloketones, may degrade over time due to hydrolysis and interactions with leftover chlorine. In regions of the distribution system where disinfection residuals are exhausted, relatively low THM and HAA concentrations may result, but the treatment plant will have higher THM and HAA concentrations than the distribution system (Priya et al., 2020; Zhou, Jun. 2021).
During disinfection, chlorine is produced either as an acid (HOCl) or as an anion (OCl2), both of which have a tendency to interact with the aromatic moieties of NOM to produce THMs. However, stronger nucleophiles like hydroxyl and amino groups, which catalyse the second order reaction between chlorine and NOM, are present. Chlorine is hydrolysed during chlorination to produce hypochlorous acid, which then dissociates to produce hydrogen and hypochlorite ions (Priya et al., 2020).
When chlorine is added to water, whether in the form of molecules or hypochlorite, it undergoes hydrolysis and produces free chlorine, hypochlorous acid, and hypochlorite ions. The latter substances are both antibacterial, although HOCl is far more effective than OCl-. Even at concentrations suitable for water, free chlorine is less efficient against protozoa than it is against a variety of bacteria and viruses linked to contaminated water (Zhang, 2023; Nielsen, 2022).
Since the 1970 s, when THMs were first discovered, several research projects have been carried out in countries all over the world. A global evaluation of current THM regulations and drinking water concentrations in 120 targeted counties has generated information on the drinking water quality regulations for 116 countries (97 %). The MCL (maximum contamination level) of total THMs ranged from 25 μg/L in Denmark and the Netherlands to 1000 μg/L in Botswana. Another 15 countries, including Saudi Arabia, set the MCL of total THMs as 1 for the sum of the ratios of the concentration of each individual THM (chloroform, bromodichloromethane, dibromochloromethane and bromoform) to its respective maximum prescribed quantity (Villanueva, 2022). One previous study investigated the concentration of THMs within the distribution systems of the Buyukcekmece water treatment plant in Istanbul City during seasonal variations, with samples taken during the spring, summer and autumn. The THM concentrations varied significantly between the finished waters and the water in the distribution network. When the water temperature exceeded 24 °C in the summer, the THM levels were 1.2–1.8 times higher than the finished water (Toroz and Uyak, Jun. 2005). In 1991, a research study was undertaken during the summer season across eight major cities in Saudi Arabia to assess the concentration levels of trihalomethane (THM) species in drinking water. The findings results indicated that the THM concentrations in all samples fell within the permissible limits established by the Saudi Arabian Standards Organization (SASO 1984) (Fayad and Tawabini, 1991). Additionally, in 2010, a research study was undertaken to assess the indoor water quality in Kuwait. The analysis of trihalomethanes (THMs) revealed noteworthy variations among Kuwait's governorates, although the majority of sites remained within permissible limits (Al-Mudhaf et al., 2010). More recently, in 2022, a study was conducted in the Asir region in the Kingdom of Saudi Arabia to assess the levels of THMs in sources of chlorinated drinking water over the four seasons (summer, autumn, winter and spring). The results showed that THM compounds exceeded the permissible concentration at conventional filtration surface water treatment plants (Mujathel et al., 2022).
The significance of this research is as follows:
-
Evaluating water quality in the Riyadh’s water network by analyzing and determine THMs concentrations, due to its impact on human health.
-
Assessing the efficacy of tap water treatment in Riyadh's network.
-
Assessing the progress and water quality in Riyadh's network throughout five years.
-
Assess the influence of physical and chemical factors on water quality.
2 Materials and methods
This study was carried out to investigate the occurrence of THM precursors and the factors that influence them. Forty-eight reservoirs were chosen for investigation, and the following sections describe the methodologies used.
2.1 Study sites
Riyadh city is in the middle of the Arabian Peninsula and in the middle of the Kingdom of Saudi Arabia, at a latitude of 38–34 degrees north, a longitude of 43–46 degrees east, and a height of about 600 m above sea level. The area of Riyadh city is about 1,973 km2.
2.2 Sample collection
Riyadh is characterised by a hot and dry climate in summer, and recent studies have shown that THM formation increases at higher temperatures during the summer (Ramavandi et al., 2015). Our study therefore focused on collecting and studying samples during the summer months only. The summer season in Riyadh typically lasts from May to September, with the peak of the heat occurring in June, July and August. Samples were chosen from 15 sites that are indicative of the primary water sources within Riyadh city. These samples were included in the present study, conducted over a three-month period spanning from May to July 2015. The same study was replicated in 2020 during the corresponding timeframe. When conducting the sampling and subsequent analyses, duplicates were obtained from each sampling point. These duplicate samples underwent testing multiple times to obtain an average measurement. In total, 90 samples were gathered. The process of sampling involved the use of securely sealed glass vials to contain the samples.
2.3 Analytical methods
The formation of THMs is a complex process influenced by various factors, including the presence of chlorine and organic precursors. The formation process is illustrated briefly in Fig. 2. The analyses of THM compounds and THM precursors (free chlorine, total organic carbon (TOC), total dissolved solids (TDS) and pH) were performed in accordance with the Standard Method for the Examination of Water, 22nd edition.
Schematic representation of the trihalomethane (THM) formation process.
2.3.1 Analysis of trihalomethanes (THMs)
The analysis was performed on samples obtained from treated water placed into a glass vial with no light or leftover air present when sealed. The vials included sodium thiosulphate (Na2S2O3) to prevent further formation of THM compounds from reactions involving leftover free chlorine.
The THM levels were determined using EPA method 501.3, employing gas chromatography (GC) instrument coupled with a mass spectrometer (MS) as a detector, along with a purge and trap device. The detection limits of each THM species by EPA 501.3 method are (chloroform is 0.06 µg/L, bromodichloromethane is 0.07 µg/L, chlorodibromomethane is 0.05 µg/L and Bromoform is 0.04 µg/L). Helium served as the carrier gas. The flow rate was set at 32.8 cm/min linear velocity at 230 °C. Furthermore, a calibration curve with a known standard solution ensures the accuracy and reliability of the obtained results.
2.3.2 Analysis of free chlorine
Chlorine is not stable in water, and it rapidly depletes when exposed to sunshine or other sources of intense light, in particular. Chlorine determinations are therefore performed as soon as a sample is taken, utilising a portable testing device and avoiding too much light and agitation (Mujathel et al., 2022).
Using a YSI 900 Chlorine Colorimeter, samples were measured using the DPD (di-methyl phenylene diamine) colorimetric technique, which is the USEPA and APHA Standard Method (4500-Cl G) for drinking water.
2.3.3 pH
pH is a measure of the activity of hydrogen ions in a solution, as defined by the International Union of Pure and Applied Chemistry (IUPAC) (Buck, 2010). A portable meter from Myron Company Parameters was used to measure the pH using an electrometric method (APHA4500-H + B) (Buck, 2010).
2.3.4 Analysis of total organic carbon (TOC)
The TOC was measured using a Shimadzu TOC-VCPH analyser. There were two types of device calibration: 1) device calibration for total carbon, where standard solutions with different concentrations (50–10-50–100 ppm) were prepared from a standard stock solution with a concentration of 1000 ppm. The stock solution was prepared by drying 2.123 g of potassium hydrogen phthalate at 120 °C for an hour, cooling in a desiccator and then placing in a 1 L volumetric flask, which was then filled with distilled water; 2) calibration of the device for inorganic carbon, where many standard solutions of different concentrations (0–10-20–30-40–50 ppm) were prepared from a stock solution with a concentration of 1000 ppm. The stock solution was prepared by weighing 3.5 g of sodium bicarbonate and 4.41 g of sodium carbonate and drying them separately for two hours in an oven set to 250–290 °C. The two substances were then combined in a 1 L volumetric flask, which was then filled with distilled water. Each of the calibrations was then connected to the total carbon and inorganic carbon, and the TOC was obtained by subtracting the inorganic carbon from the total carbon (Lehtola et al., Dec. 2004).
2.3.5 Total dissolved solids (TDS)
When mixing water from sources with an organic content, such as well water, it is possible to create dissolved solid salts. As the organic content rises, the creation of these compounds increases. The addition of salts will also raise the concentration of bromide ions in the water that need to be sterilised, which raises the levels of compounds that include bromine, such as dibromochloromethane, bromodichloromethane and bromoform (Kawamoto and Makihata, 2004).
2.3.6 Ion chromatography (IC)
Ion chromatography (IC) is an analysis technique in which separation is based mainly on differences in the ion-exchange affinities of the sample components (IUPAC). This method separates and analyses both anions and cations (Ettre, 1993). The sample was filtered with a 45 µm filter and then injected into the Dionex ICS-5000 device using two columns (Dionex Ionpac CS12A and Dionex Ionpac AS19) to measure the ions.
2.3.7 Inductively coupled plasma-optical emission spectroscopy (ICP-OES)
Inductively coupled plasma-optical emission spectroscopy (ICP-OES) is an elemental analysis technique used to measure the elements in a liquid sample at very low concentrations and has high sensitivity and precision (Bulska and Wagner, 2016). First of all, 100 mL of the sample was filtered by syringe filter and then 2 mL of 69 % nitric acid was added. The sample was measured in a PerkinElmer Optima 2000 DV ICP-OES spectrometer.
3 Results and discussion
3.1 Incidence and quantification of THMs
The THM chemical concentrations (bromoform, dibromochloromethane, bromodichloromethane and chloroform) were calculated at the final chlorine treated product points of the water. From all of the assessments performed, Table 1 shows the average values of THMs and Total THM (TTHM) at the 15 investigated drinking water sources, based on 90 samples collected during the two different years 2015 and 2020. * Total THM (TTHM) = {CHCl3+ + CHBrCl2 + CHClBr2 + CHBr3}. ** ratio of the concentration of each THM compound to its respective WHO guideline value following equation (1).
Years
S1
S2
S3
S4
S5
S6
S7
S8
S9
S10
S11
S12
S13
S14
S15
Average
Percentage %
CHCl3 (ppb)
2015
0.01
0.02
0.06
0.01
0.01
0.02
0.02
0.03
0.02
0.06
0.03
0.1
0.02
0.02
0.01
0.02933333333
0.2957
2020
0.02
0.01
0.01
0.01
0.02
0
0.01
0.02
0
0
0
0.01
0
0.02
0
0.008666666667
0.0771
CHBrCl2 (ppb)
2015
0.04
0.06
0.16
0.03
0.06
0.06
0.07
0.09
0.06
0.19
0.09
0.36
0.05
0.04
0.04
0.09333333333
0.941
2020
3
0.03
0.03
0.03
0.02
0.04
0.04
0.03
0.03
0.07
0.03
0.08
0.02
0
0.02
0.2313333333
2.0578
CHClBr2 (ppb)
2015
0.13
0.41
0.25
0.26
0.41
0.44
0.38
0.61
0.47
0.88
0.46
1.27
0.42
0.22
0.34
0.4633333333
4.6713
2020
0.37
0.72
0.19
0.14
0.22
0.48
0.47
0.3
0.37
1.14
0.58
1.12
0.37
0.05
0.4
0.4613333333
4.1037
CHBr3 (ppb)
2015
0.26
0.17
3.02
6.99
9.79
14.91
11.07
13.17
10.54
15.51
10.22
16
9.78
6.19
12.37
9.332666667
94.0919
2020
7.06
25.85
3.29
3.16
5.38
8.34
11.88
5.86
15.77
17.07
15.36
23.01
7.68
0.88
7.52
10.54066667
93.7615
Total THM * (ppb)
2015
0.44
0.66
3.49
7.29
10.27
15.43
11.54
13.9
11.09
16.64
10.8
17.73
10.27
6.47
12.76
9.918666667
2020
10.45
26.61
3.52
3.34
5.64
8.86
12.4
6.2
16.17
18.28
15.97
24.22
8.07
0.95
7.94
11.24133333
Ratio **
2015
0.02
0.21
0.04
0.05
0.06
0.09
0.12
0.14
0.11
0.17
0.11
0.18
0.1
0.06
0.13
2020
0.07
0.27
0.04
0.03
0.1
0.15
0.12
0.06
0.16
0.18
0.16
0.24
0.08
0.01
0.08
GPS location
46.70397,24.75827
46.66445,24.7138
46.70397,24.75828
46.70397,24.75828
46.70397,24.75829
46.66445,24.7140
46.70397,24.75830
46.66445,24.7141
46.70397,24.75831
46.66445,24.7142
46.70397,24.75832
46.66445,24.7143
46.70397,24.75833
46.66445,24.7144
46.70397,24.75834
The results showed that the sum of the ratio of the concentration of each THM compound to its respective World Health Organization (WHO) guideline value were not exceeded (1.0 unitless), and within allowed limit median of THM values. The THM results were calculated by adding the ratio of the concentration of each THM constituent to its associated guideline value. At 2020, The lowest detected value (0.01 unitless) was found at S14 in the middle of the city, while S12 in the west had the highest THM value (0.24 unitless). These results in Table 1 based on the equation (1), not significant risk to health through lifelong consumption.
It is unitless because it was obtained by the following g equation (1):
Where C is Concentration, GV is Guideline Value, GV of Chloroform: 300 ppb, GV of Bromodichloromethane (BDCM): 60 ppb, GV of Dibromochloromethane (DBCM): 100 ppb and GV of Bromoform: 100 ppb.
The formation of each trihalomethane (THM) compound is a complex process influenced by numerous parameters. Prior research has shown that the ratio of chlorine (Cl) to bromine (Br) is a determining factor in which THM species are more likely to form (Mujathel et al., 2022); (Chowdhury and Al-Zahrani, 2013). Boronated THMs are more likely to form when chlorine concentrations decrease relative to chlorinated species. Based on the chemical analysis, the most abundant compound at the 15 sources was bromoform (CHBr3). Bromoform was predicted to be abundant because numerous prior local investigations in Saudi Arabia had also shown this to be the case (Fayad and Tawabini, 1991; Tawabini et al., 2011). As shown in Fig. 3, the average total amount of bromoform was 9.333 ppb in 2015, representing 94.09 % of THMs at all sources in this study, and 10.541 ppb in 2020, representing 93.76 %, followed by dibromochloromethane with an average of 0.463 ppb in 2015, representing 4.67 % of THMs, and 0.461 ppb in 2020, representing 4.10 %. The average total amount of bromodichloromethane was 0.093 ppb in 2015, representing 0.94 % of THMs, and 0.231 ppb in 2020, representing 2.06 %, while the amount of chloroform (CHCl3) formed was less than the other three THM compounds, with an average total amount of 0.029 ppb in 2015, representing 0.30 % of THMs, and 0.009 ppb in 2020, representing 0.08 %. We must mention to that Riyadh's water supply relies on blended water (desalinated and groundwater), with typically having lower organic content. This accounts for the comparatively lower THM levels in Riyadh's water. On the other hand, Surface water sources, such as those in Aseer (Mujathel et al., 2022), contain a significant amount of organic matter as well as an increase in chlorine sterilization, leading to elevated THM levels.
Different percentage of chemical compounds in 2015 and 2020.
3.2 Effect of free chlorine on total THM values
Free chlorine measurements were taken in Riyadh in 2015 and 2020 to evaluate and compare the quality of disinfection over five years. Results are shown in Table 2. It is noticeable that the quality of water disinfection has improved: the free chlorine concentrations at sites S1 and S2 indicate that the disinfection in 2020 has evolved 16 and 11 times, respectively, compared to the disinfection in 2015. On the other hand, there was no significant improvement at either the S4 or S5 site. Consequently, most THM compounds were formed in 2020. The results of the study revealed that there is a statistically significant positive relationship between the free chlorine values and the total THM values. The positive correlation for the 2015 and 2020 results was equal to R2 = 0.2119 and R2 = 0.1496, respectively, as shown in Figs. 4 and 5. This suggests that chlorine is a significant factor in THM formation in water systems, as proven by other studies.
years
S1
S2
S3
S4
S5
S6
S7
S8
S9
S10
S11
S12
S13
S14
S15
pH
2015
7.74
7.82
1.7
7.77
7.63
7.97
8
7.91
7.85
7.59
7.94
8.03
01.06
7.71
8.03
2020
7.48
7.72
1.7
7.92
7.98
7.93
8.06
7.83
8.55
7.93
7.68
7.89
01.06
7.72
7.68
Free chlorine (ppm)
2015
0.01
0.01
0.05
0.02
0.03
0.03
0.11
0.07
0.03
0.07
0.03
0.04
0.07
0.02
0.03
2020
0.11
0.16
0.13
0.02
0.1
0.06
0.17
0.1
0.18
0.11
0.07
0.05
0.1
0.03
0.03

In Riyadh, free chlorine measurements were performed in 2015 and 2020 to analyse and compare the quality of disinfection over a five-year period.
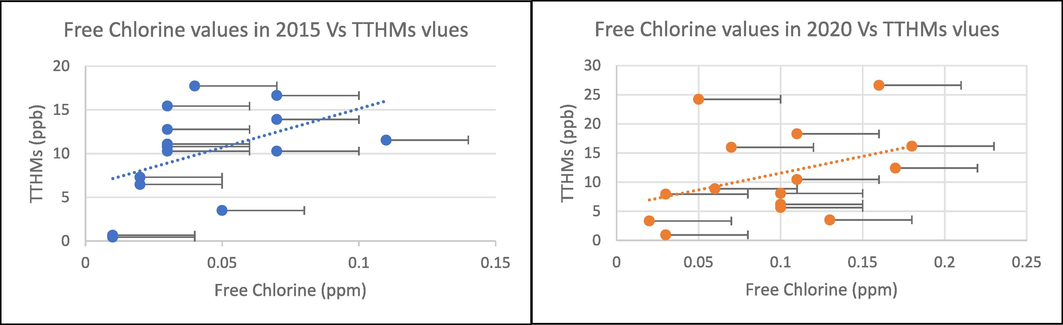
Free chlorine values versus TTHMs values in 2015 and 2020.
3.3 Effect of bromide on total THM values
The bromide (Br-) results in 2015 varied from 0.02 ppm to 0.41 ppm, with an average value of 0.223 ppm, while the 2020 values varied between 0.01 ppm and 0.4 ppm, with an average of 0.21 ppm (see Table 3). In this study, the Br- values showed a weak correlation with the formation of TTHMs, which is consistent with some earlier studies (Al-Tmemy et al., 2018; Brown, 2009). The correlation coefficient between the Br- plotted change 2020 (see Fig. 6).
years
S1
S2
S3
S4
S5
S6
S7
S8
S9
S10
S11
S12
S13
S14
S15
Bromide (Br-) (ppm)
2015
0.165
0.35
0.225
0.2
0.41
0.18
0.2
0.3
0.02
0.305
0.28
0.41
0.05
0.19
0.065
2020
0.3
0.01
0.02
0.4
0.3
0.3
0.3
0.2
0.26
0.3
0.3
0.3
0.1
0.1
0.01
THM (ppm)
2015
2.43
20.67
3.49
10.36
6.47
12.77
7.27
5.64
8.85
11.53
13.9
11.09
16.64
10.8
17.73
2020
7.46
26.61
3.53
8.06
0.95
7.94
3.34
10.27
15.42
12.4
6.2
16.17
18.28
15.97
24.22

Comparison of trihalomethane against Bromide in year 2015 and 2020.
3.4 Effect of pH on total THM values
The pH results are shown in Table 2 and Fig. 7. The pH values ranged between 7.59 and 8.03 in 2015 and between 7.48 and 8.55 in 2020. All samples showed a direct relationship between the pH and the level of THM compounds, whereby an increase in pH led to an increase in the formation of THM compounds. A previous study also reported the increased formation of these compounds as the pH increased (Ye et al., 2009). The acid ionisation resulting from the chlorination process decreases when the pH decreases, and it is therefore assumed that the interaction of chlorine with organic matter in water increases. However, lowering the pH also leads to the non-ionisation of humic acids, which constitute the largest proportion of the organic content of water, and this leads to their accumulation and non-interaction with chlorine compared that observed at an increased pH.
In 2015, pH readings ranged from 7.59 to 8.03, and in 2020, they will be between 7.48 and 8.55.
3.5 Total organic carbon (TOC)
The organic carbon content of the samples obtained during 2015 and 2020 are illustrated in Table 4. The TOC content of most of the 41 samples did not exceed 2 ppm, but the average TOC content was higher than 2 ppm for several samples (S8, S11, S17, S29, S34, S35, S39). Numerous previous studies have shown that many other water sources have an organic carbon content of no more than 3 ppm. These results therefore show that the network water is not contaminated with an organic source, indicating that the likelihood of halomethane compounds being formed is low. It can be seen that, through our study we noticed a low percentage of TOC, which indicates that the bacterial level is low.
years
S1
S2
S3
S4
S5
S6
S7
S8
S9
S10
S11
S12
S13
S14
S15
Concentration TOC (ppm)
2015
1.56
1.85
2.08
1.55
1.711
0.985
1.17
2
0.56
1.71
1.66
2.24
1.69
1.86
1.67
2020
2.17
1.559
1.293
1.732
1.5
1.18
1.02
1.04
0.888
2.024
1.787
1.937
2
1.67
2.169
3.6 Water quality
The physical characteristics of water was studied using conductivity, moreover for chemical characteristics the TDS and total hardness tests were used to determine the water quality at 15 different places throughout the city of Riyadh (see Table 5). The water quality in the years 2015 and 2020 was similar, based on the physical and chemical analyses of the water. The average total hardness was 225.5 and 190.5 ppm in the years 2015 and 2020, respectively, with results ranging from soft to very hard water and falling within the permissible limit according to the WHO (100–500) ppm. The average TDS levels were 470.4 and 395.6 ppm in 2015 and 2020, respectively; these results are also acceptable according to the WHO (600–1000) ppm. MEWA - Ministry of Environment, Water and Agriculture; TDS - total dissolved solids; WHO - World Health Organization.
years
S1
S2
S3
S4
S5
S6
S7
S8
S9
S10
S11
S12
S13
S14
S15
WHO (ppm)
MEWA (ppm)
Conductivity (μs/cm)
2015
849.8
937.5
137.6
917.67
661
183.4
914.43
856.27
789.83
301.07
881.53
228.5
874.9
963.47
882.33
2020
652
575
241
659
819.83
890.83
669
678
651
166
234
160.3
849
691
684
TDS (ppm)
2015
569.5
633.37
86.81
622.63
456.09
126.546
620.8
585.83
542.87
191.87
603
146.73
599.17
661.1
610.3
1000
100–1000
2020
449.88
396.75
166.29
454.71
555.3
610.93
461.61
467.82
449.19
114.54
161.46
110.607
585.81
476.79
471.96
Total hardness (ppm)
2015
284.1
299
77.4
279.3
241.71
27.3532
296.8
225.3
271.1
184
226.6
63.3
290.9
314.5
301.1
500
300
2020
215.43
174.32
46.103
254.17
258.1
320.4
217.49
213.34
211.28
29.351
54.093
28.189
325.576
252.496
256.667
3.7 Ion chromatography (IC)
IC analysis was used to monitor the water quality and determine the presence of inorganic ions. The results are illustrated in Table 6. The sodium Na+ cation concentration of the collected samples was in the range of 99 and 21.9 ppm in 2015 and in the range of 22 to 84.89 ppm in 2020. Accordingly, potassium K+, calcium Ca2+ and magnesium Mg2+ ranged from 0.85 to 9.5, 9.8 to 84.595, and 0.7 to 25.4 ppm in 2015, and from 1.4 to 5.42, 10.3 to 104, and 0.7 to 22.14 ppm in 2020, respectively. Furthermore, the fluoride F-, chloride Cl-, sulphate SO42- and nitrate NO3– anion concentrations were in the ranges 0.01 to 0.365, 15.65 to 186.4, 0.65 to 13.33, and 1.7 to 212.5 ppm in 2015, and 0.01 to 0.32, 35 to 171, 2 to 185, and 1.4 to 199.25 ppm in 2020, respectively. The results indicated that the study area's water is safe for drinking according to WHO standards. MEWA - Ministry of Environment, Water and Agriculture; SFDA – Saudi FDA;WHO - World Health Organization
Elements (ppm)
years
S1
S2
S3
S4
S5
S6
S7
S8
S9
S10
S11
S12
S13
S14
S15
Average
WHO ppm
SFDA ppm
MEWA
ppm
Sodium Na+
2015
66.065
99
54.155
76.8
83.5
76.7
69.2
56
25
84.635
67.9
75.355
21.9
39.635
12.55
60.55967
200
20
200
2020
65
61
28
77
61
60
57
65.7
84.89
71
70
68
23
29
22
56.17267
Potassium K+
2015
3.865
9.5
4.98
5.2
5.4
4.7
3.75
4
2.2
7.005
3.75
5.05
1.25
2.6
0.85
4.273333
12
2020
4.2
5.7
1.8
4.8
4
4
3.7
3.6
5.42
4.6
4.6
4.6
1.4
1.8
1.9
3.741333
Calcium Ca2+
2015
84.595
77.855
61.7
80.4
85.4
84.2
80.35
78
9.8
80.32
61.55
77.33
27.1
48.85
22.86
64.02067
100
30
2020
65
52
14
104
81
83
82
74.5
91.82
65
64
64
10.6
18.2
10.3
58.628
Magnesium Mg2+
2015
17.695
25.4
15.45
21.9
24.6
22.06
19.1
11.4
0.7
23.365
17.4
18.955
3
10.3
1.5
15.52167
50
2020
12.9
10.8
1.1
16
12.2
12
12
17.5
22.14
13.4
13
12.5
0.7
2.1
0.6
10.596
Fluoride F-
2015
0.255
0.365
0.245
0.3
0.44
0.3
0.23
0.2
0.01
0.31
0.15
0.22
0.063
0.09
0.025
0.213533
1.5
0.7–1.5
1.5
2020
0.2
0.2
0.03
0.29
0.2
0.2
0.2
0.2
0.32
0.3
0.3
0.2
0.04
0.01
0.01
0.18
Bromide Br-
2015
0.165
0.35
0.225
0.2
0.41
0.18
0.2
0.3
0.02
0.305
0.28
0.41
0.05
0.19
0.065
0.223333
10
2020
0.3
0.01
0.02
0.4
0.3
0.3
0.3
0.2
0.26
0.3
0.3
0.3
0.1
0.1
0.01
0.213333
Chloride Cl-
2015
128.43
186.4
79.66
138.8
145.1
140.8
75.8
124
40
170.72
138.35
152.06
29.25
70.6
15.65
109.0413
250
250
2020
155
135
45
171
137
133
126
130.1
163.67
164
162
155
37
51
35
119.9847
Sulphate SO42-
2015
4.935
8.685
13.33
8.9
10.3
8.8
7.15
169
2.5
8.235
8.98
10.525
1.05
6.54
0.65
17.972
250
2020
124
135
9.4
130
185
179
155
5.9
7.84
125
126
122
1.98
18.9
2
88.468
Nitrate NO3–
2015
178.665
187.8
144.495
185.8
212.5
190.9
171.15
3.4
1.7
171.57
113.35
125.45
33.4
96.7
17.215
122.273
50
3
2020
10.3
6.1
1.7
4.5
2.4
4.8
3.1
154
199.25
11.3
10.4
10.3
1.6
1.4
1.7
28.19
3.8 Inductively coupled plasma-optical emission spectroscopy (ICP-OES)
The heavy metal concentrations of the water are shown in Table 7. All concentrations were within the limits permitted by the WHO. The elements that most affect water quality and human health are lead, arsenic, cadmium, nickel, cobalt, copper, chromium and zinc. The average concentrations of lead, arsenic, cadmium and nickel were found to be less than 1 ppb, while the average concentrations of the other four elements ranged between 1 and 21 ppb. By comparing the average concentrations in 2015 and 2020, we concluded that the concentrations in 2020 were better than in 2015, which indicates that the water quality had improved. MEWA - Ministry of Environment, Water and Agriculture; WHO - World Health Organization, BDL – below detection limit. * The heavy metals values by ppb and the standard of WHO and MEWA by ppm.
Metals (ppb)
Years
S1
S2
S3
S4
S5
S6
S7
S8
S9
S10
S11
S12
S13
S14
S15
Average
WHO (ppm)
MEWA (ppm)
Cr
2015
0.2
2
0.04
2.85
BDL
0.004
0.5
11.7
36.6
BDL
0.599
0.2
2.7
0.65
1.6
4.588
0.05
0.05
2020
0.013
0.01
0.004
0.007
2.3
BDL
0.015
0.01
0.011
BDL
BDL
0.004
0.007
0.006
0.006
0.199
Co
2015
3.2
0.6
1.6
0.5
BDL
BDL
BDL
11.3
1.5
2.65
0.6
BDL
0.2
0.678
0.7
2.139
0.05
0.05
2020
BDL
BDL
BDL
BDL
0.617
BDL
BDL
BDL
BDL
BDL
BDL
BDL
BDL
BDL
BDL
0.617
Ba
2015
2.2
10.5
14.8
7.3
BDL
BDL
1.03
15.4
54.5
3.65
9.47
4.8
12.2
14
11
12.37
1.3
1.3
2020
0.008
0.012
0.001
0.006
6
BDL
0.014
0.007
0.006
BDL
BDL
BDL
0.01
0.004
0.005
0.552
Pb
2015
BDL
BDL
BDL
BDL
BDL
BDL
BDL
BDL
BDL
BDL
BDL
BDL
BDL
BDL
BDL
0
0.01
0.01
2020
BDL
BDL
BDL
BDL
BDL
BDL
BDL
BDL
BDL
BDL
BDL
BDL
BDL
BDL
BDL
0
As
2015
BDL
BDL
BDL
BDL
0.002
0.003
BDL
BDL
BDL
BDL
BDL
BDL
BDL
BDL
BDL
0.003
0.01
0.01
2020
0.019
0.015
0.004
0.013
BDL
0.003
0.017
0.015
0.014
0.008
0.005
0.003
0.023
0.012
0.012
0.012
Fe
2015
6.05
BDL
BDL
3.51
BDL
0.263
BDL
35.7
40.5
BDL
11.4
3.2
1.25
BDL
BDL
12.73
0.3
0.3
2020
1.066
0.841
0.326
1.199
BDL
BDL
1.017
1.27
0.859
BDL
BDL
0.264
1.409
0.992
1.036
0.934
Mo
2015
BDL
BDL
BDL
BDL
BDL
BDL
BDL
2.4
3.1
BDL
BDL
BDL
BDL
BDL
BDL
2.75
0.01
0.07
2020
0.003
0.002
BDL
0.001
BDL
BDL
0.003
0.002
0.002
BDL
BDL
BDL
0.001
0.001
0.001
0.002
Se
2015
BDL
7
BDL
2
BDL
0.001
BDL
BDL
11
0.3
BDL
BDL
8
BDL
5
4.757
0.04
0.04
2020
0.009
0.006
0.002
0.005
4.4
BDL
0.006
0.008
0.005
BDL
BDL
0.001
0.009
0.004
0.003
0.372
Cd
2015
2.1
BDL
BDL
0.2
BDL
BDL
1.5
BDL
0.5
BDL
BDL
BDL
BDL
BDL
BDL
1.075
0.003
0.003
2020
BDL
BDL
BDL
BDL
BDL
BDL
BDL
BDL
BDL
0.001
0.001
BDL
BDL
BDL
BDL
0.001
Ni
2015
BDL
BDL
2.6
BDL
BDL
0.001
BDL
3.2
2.2
2
BDL
BDL
BDL
BDL
BDL
2
0.07
0.07
2020
0.005
0.004
0.001
0.005
BDL
BDL
0.005
0.004
0.004
BDL
BDL
BDL
0.006
0.004
0.004
0.004
Zn
2015
19.8
20
57
6.2
BDL
0.009
24.1
18.9
53
11.79
11.9
11
8
69.5
8
22.8
3
3
2020
0.019
0.018
0.008
0.019
2
BDL
0.017
0.164
0.014
0.001
0.001
0.012
0.017
0.019
0.014
0.166
Mn
2015
BDL
BDL
3.6
0.3
0.001
0.001
BDL
1.3
1.3
BDL
2.6
0.7
BDL
0.09
BDL
1.099
0.08
0.4
2020
0.002
0.004
0.001
0.002
BDL
BDL
0.001
0.011
0.002
BDL
BDL
BDL
0.006
0.001
0.003
0.003
Be
2015
BDL
0.1
BDL
0.02
BDL
BDL
BDL
0.1
BDL
0.142
0.036
BDL
BDL
BDL
0.049
0.074
N/A
N/A
2020
BDL
BDL
BDL
BDL
0.089
BDL
BDL
BDL
BDL
BDL
BDL
BDL
BDL
BDL
BDL
0.089
Al
2015
53.7
73
123
81.95
BDL
0.009
40.6
102
66.1
47.05
86.55
42.6
83
75
67
67.25
0.2
0.2
2020
0.006
0.011
0.015
0.013
70.39
BDL
0.013
0.004
0.007
BDL
BDL
0.008
0.007
0.011
0.01
5.875
V
2015
0.66
BDL
BDL
0.35
0.003
0.01
1.9
3.3
2.5
BDL
BDL
BDL
BDL
BDL
BDL
1.246
N/A
N/A
2020
0.045
0.036
0.011
0.031
BDL
BDL
0.045
0.042
0.037
BDL
BDL
0.009
0.046
0.028
0.027
0.032
Cu
2015
BDL
BDL
BDL
BDL
BDL
BDL
BDL
BDL
BDL
BDL
BDL
BDL
21.3
1.77
0.79
7.953
2
2
2020
0.01
0.006
0.001
0.005
BDL
BDL
0.007
0.003
0.005
BDL
BDL
BDL
0.011
0.003
0.006
0.006
4 Conclusion
There is a severe scarcity of water in Saudi Arabia, which is a hot and arid region, and the water is provided by renewable and non-renewable sources. Desalinated water is the main source of drinking water, and chlorination is a typical treatment method to eliminate microorganisms. Unfortunately, when the water contains natural organic matter, the chlorination process may generate DBPs, especially THMs. These DBPs are hazardous to human health and are regulated in drinking water by the WHO. This study was conducted to assess the THM levels in the Riyadh city water network in two different years (2015 and 2020) and covered 48 sites in Riyadh city, distributed between the north, south, east, west and middle of the city. GC–MS was used to determine the level of THMs, and the results indicated that bromoform contributed the highest concentration of these compounds, with a level of 9.333 ppb in 2015 and 10.541 ppb in 2020. Chloroform was found in the lowest concentration, with values of 0.029 ppb in 2015 and 0.009 ppb in 2020. The factors affecting the formation of these compounds (free chlorine, bromide ions, pH and TOC) were also investigated. Free chlorine showed a positive correlation with THM compound formation, while the bromide ion concentration and pH showed a weak correlation with THM formation. The TOC concentration was in the range of 0.56 to 2.24 ppm in 2015 and in the range of 0.88 to 2.17 ppm in 2020. The quality of water was studied using IC and ICP-OES, which were used to determine the concentration of ions and heavy metals, respectively. According to the ICP-OES results, lead, arsenic, cadmium and nickel had average concentrations of less than 1 ppb, whereas the concentration of cobalt, copper, chromium and zinc ranged from 1 to 21 ppb. The concentration of heavy metals improved in 2020 compared with 2015, indicating a better water quality. Moreover, the IC results indicated that the water in this study is suitable for human consumption based on the WHO and Ministry of Environment, Water and Agriculture (MEWA) standards.
Declaration of competing interest
The authors declare that they have no known competing financial interests or personal relationships that could have appeared to influence the work reported in this paper.
References
- Self-organizing map approach in assessment spatiotemporal variations of trihalomethanes in desalinated drinking water in Kuwait. Desalination. 2010;252(1–3):97-105.
- [CrossRef] [Google Scholar]
- Seasonal variation and modeling of disinfection by-products (DBPs) in drinking water distribution systems of Wassit Province Southeast Iraq. J. Pharm. Sci. Res.. 2018;10(12):3393-3399.
- [Google Scholar]
- EHC 216: Disinfectants and Disinfectant by-Products. 2004;216
- The Management of Trihalomethanes in Water Supply Systems. 2009;August:404p.
- Measurement of pH definition, standards, and procedures. Handb. Biochem. Mol. Biol. Fourth Ed.. 2010;74(11):675-692.
- [CrossRef] [Google Scholar]
- Quantitative aspects of inductively coupled plasma mass spectrometry. Philos. Trans. R. Soc.: Math., Phys. Eng. Sci.. 2016;374(2079)
- [CrossRef] [Google Scholar]
- Effects of bromide on the formation of THMs and HAAs. Chemosphere. 2001;43(8):1029-1034.
- [CrossRef] [Google Scholar]
- Implications of climate change on water resources in Saudi Arabia. Arab. J. Sci. Eng.. 2013;38(8):1959-1971.
- [CrossRef] [Google Scholar]
- Factors affecting the formation of disinfection by-products during chlorination and chloramination of secondary effluent for the production of high quality recycled water. Water Res.. 2014;48(1):218-228.
- [CrossRef] [Google Scholar]
- Assessing groundwater geospatial variation using microgravity investigation in the Arid Riyadh Metropolitan Area, Saudi Arabia: a case study. Water Resour. Manag.. 2016;30(11):3845-3860.
- [CrossRef] [Google Scholar]
- Nomenclature for chromatography (iupac recommendations 1993) Pure Appl. Chem.. 1993;65(4):819-872.
- [CrossRef] [Google Scholar]
- Survey of Saudi Arabian drinking water for trihalomethanes. Bull. Environ. Contam. Toxicol.. 1991;46(2):305-312.
- [CrossRef] [Google Scholar]
- Distribution of bromine/chlorine-containing disinfection by-products in tap water from different water sources in the Hyogo Prefecture. J. Heal. Sci.. 2004;50(3):235-247.
- [CrossRef] [Google Scholar]
- Formation of biofilms in drinking water distribution networks, a case study in two cities in Finland and Latvia. J. Ind. Microbiol. Biotechnol.. 2004;31(11):489-494.
- [CrossRef] [Google Scholar]
- Trihalomethane evaluation in chlorinated treated drinking water sources in Saudi Arabia (Aseer region a case study) Alexandria Eng. J.. 2022;61(12):12699-12711.
- [CrossRef] [Google Scholar]
- Chlorination for low-cost household water disinfection – a critical review and status in three Latin American countries. Int. J. Hygiene Environ. Health. 2022;244:1438-4639.
- [CrossRef] [Google Scholar]
- Physico-chemical techniques for the removal of disinfection by-products precursors from water. In: Disinfection by-Products in Drinking Water: Detection and Treatment. Butterworth-Heinemann; 2020. p. :23-58.
- [Google Scholar]
- Effect of water quality and operational parameters on trihalomethanes formation potential in Dez River water, Iran. Water Resour. Ind.. 2015;11:1-12.
- [CrossRef] [Google Scholar]
- Formation potential of trihalomethanes (THMs) in blended water treated with chlorine. J. Water Reuse Desalin.. 2011;1(3):172-178.
- [CrossRef] [Google Scholar]
- Seasonal variations of trihalomethanes (THMs) in water distribution networks of Istanbul City. Desalination. 2005;176:127-141. 1–3 SPEC. ISS
- [CrossRef] [Google Scholar]
- Global assessment of chemical quality of drinking water: The case of trihalomethanes. Water Res.. 2022;230(September):2023.
- [CrossRef] [Google Scholar]
- W. and A. Ministry of Environment, “Statistical book 2021, Ministry of Environment, Water and Agriculture,” 2021.
- Factors influencing disinfection by-products formation in drinking water of six cities in China. J. Hazard. Mater.. 2009;171(1–3):147-152.
- [CrossRef] [Google Scholar]
- Decreased Efficiency of Free Naked DNA Transformation by Chlorine and UV Disinfection and Its Detection Limitations. Water (switzerland). 2023;15(6):1-12.
- [CrossRef] [Google Scholar]
- Derivates variation of phenylalanine as a model disinfection by-product precursor during long term chlorination and chloramination. Sci. Total Environ.. Jun. 2021;771
- [CrossRef] [Google Scholar]


