Translate this page into:
Evolution of pore structure and changes in oxidation characteristics of coal after heating freezing treatment
⁎Corresponding author. Dingdc123@163.com (Cong Ding)
-
Received: ,
Accepted: ,
This article was originally published by Elsevier and was migrated to Scientific Scholar after the change of Publisher.
Abstract
To study the spontaneous combustion characteristics of preheated coal treated by liquid nitrogen (LN2), surface structure test, thermal analysis experiment and chemical characteristic analysis experiment were used to study the change characteristics of surface structure, oxidation characteristic and chemical structure of coal under the action of LN2 quenching. The results showed that with the increase of preheating temperature, the fractal dimension, specific surface area, pore volume and average pore diameter of the LN2 treated coal (quenched-coal) increase. With the increase of preheating temperature, under the oxidation condition, the CO and CO2 produced at ST of 230 ℃ are 1.19 times and 1.21 times higher than those at ST of 70 ℃. The CO/CO2 emission of quenched-coal is significantly increased, and the secondary oxidation capacity is stronger. Due to the more developed pore cracks of coal under pyrolysis and quenching conditions, the natural characteristics of coal are stronger. The oxygen adsorption capacity and apparent activation energy of pyrolysis coal in the stageⅠ affected by LN2 are stronger. Oxidized coal shows stronger oxidation and heat release ability in the stageⅡ under the action of LN2, resulting in higher apparent activation energy in this endothermic stage. The addition of LN2 blocked the oxidation reaction of preheated coal and sealed the structure of -C = O, –COOH and –OH. The bridge bond –CH2- structure of pyrolysis coal is further destroyed, and the ratio of –CH2/–CH3 is reduced. The increase of alkyl free radicals in pyrolysis coal and alkyl oxygen free radicals in oxidation coal accelerates the spontaneous combustion oxidation of coal. The research results have important guiding significance for the occurrence and prevention of coal reignition disaster after LN2 fire quenching.
Keywords
Secondary oxidation characteristics
Pore structure
LN2-treated coal
Oxygen-containing functional groups
Free radical
1 Introduction
Coal mine fires are among the five major disasters faced by mining operations. Unlike other types of fires, coal mine fires exhibit characteristics such as spontaneous combustion, smoldering, and reignition (Deng et al., 2015; Zhang et al., 2023; Liu et al., 2022). Currently, liquid nitrogen (LN2) injection serves as a widely adopted fire prevention and extinguishing technology in mines. Its advantages include rapid fire suppression, user-friendly operation, remarkable effectiveness, and enhanced safety (Jiang et al., 2023; Huang et al., 2023; Zhang et al., 2023). In recent years, coal mining enterprises have increasingly embraced strategies such as stratified mining of thick coal seams, re-mining of floating coal in old goafs, and re-mining of previously closed fire areas to conserve coal resources. However, due to pre-oxidation, the coal in these regions has varying degrees of susceptibility. When the internal oxygen supply suddenly increases in the old goafs, unsealed fire areas, or other zones, the thermodynamic balance within the system is disrupted, leading to coal re-ignition.Investigating the re-ignition mechanism resulting from LN2 treatment on preheated coal is of paramount importance for scientifically and efficiently preventing and controlling coal re-ignition disasters(Sun et al., 2024; Ding et al., 2022; Wang et al., 2023). By understanding these processes, we can enhance safety measures and mitigate the impact of such incidents.
Coal, as a porous organic material, possesses a complex network of pores. The arrangement of these pores significantly influences gas adsorption, diffusion, heat transfer rates, and chemical reactions within coal (Du et al., 2023; Wang et al., 2023; Dong et al., 2022). Consequently, these pore characteristics play a crucial role in oxygen reactions and the occurrence of spontaneous combustion in coal.When liquid nitrogen (LN2) impacts coal, several factors come into play(Liu et al., 2023; Su et al., 2020; He et al., 2019). The rapid cooling caused by LN2 induces temperature stress, which directly affects the pore structure of the coal matrix. Notably, research by Qin et al. revealed that LN2 treatment leads to a significant increase in both the average pore diameter and total pore volume of frozen coal(Qin et al., 2023; Qin et al., 2023). Simultaneously, the fractal dimension of the coal pore volume decreases, as observed through nuclear magnetic resonance and other tests. Yan et al. (Yan et al., 2020) further explored the effects of LN2 leaching and melting. They discovered that as the prefabrication temperature increases, the coal’s characteristic fracture area also grows. Moreover, a higher increase in coal porosity corresponds to better development of microfractures and pores. Meanwhile, Liu et al. (Liu et al., 2021) quantitatively assessed the damage to pore structures in heated and frozen coal using low-temperature nitrogen adsorption experiments. Their findings indicated that LN2 freezing causes surface roughness in coal samples as the heat treatment temperature rises. Despite scholarly investigations into the pore structure characteristics of LN2-treated coal, our understanding of how LN2 impacts the microchemical structure changes in preheated coal remains incomplete.
At present, some scholars have studied the spontaneous combustion characteristics of LN2 cold impregnated coal. Ye (Ye, 2021) showed that coal oxidation could be inhibited to a certain extent after LN2 inerting through programmed temperature oxidation experiment. Liu et al. (Liu et al., 2021; Liu et al., 2022:) found that LN2 can induce crack propagation and extension of coal, thus accelerating temperature transfer. Xin et al. (Xin et al., 2023) obtained that after the coal was soaked in LN2, the pores and cracks of the coal increased with the increase of the total pore volume and specific surface area, and the oxygen absorption capacity increased. The spontaneous combustion and reignition tendency of coal increase with the increase of oxidation and combustion intensity. Liu et al. (Liu et al., xxxx) simulated the heating process of primary and secondary oxidation after LN2 injection through a programmed temperature experiment. The results showed that secondary spontaneous combustion is more likely to occur after LN2 treatment, and the oxidation combustion reaction process of coal is faster. The above studies mainly focus on the oxidation characteristics of LN2 to raw coal, but ignore the problem that coal has been oxidized/pyrolyzed before LN2 injection. Therefore, the effect of LN2 on the microstructure of preheated coal and the oxidation characteristics of cold-soaked coal need further systematic analysis.
To investigate the effect of liquid nitrogen (LN2) on the surface structure and spontaneous combustion characteristics of preheated coal, we examined the pore structure of preheated coal before and after cold immersion in LN2 using nitrogen adsorption and scanning electron microscopy (SEM). Additionally, we analyzed the physical and chemical properties of preheated coal before and after liquid nitrogen cold immersion using gas chromatography, differential scanning calorimetry (DSC), Fourier-transform infrared spectroscopy (FTIR), and electron spin resonance (ESR). This study holds significant reference value for understanding the reburning characteristics of coal seams after LN2 fire quenching and for coal reburning disaster prevention.
2 Materials and methods
2.1 Coal sample preparation
Long-flame coal was chosen as the experimental coal sample. Upon collection at the site, the coal sample is promptly sealed and dispatched to the laboratory. In the lab, the coal undergoes crushing and screening. Specifically, it is screened using a grinder and a vibrating screen to achieve a mesh size of 120–200 mesh (equivalent to 0.0075–0.125 mm). Subsequently, the coal is placed in a vacuum drying oven and allowed to dry at room temperature for 24 h. Table 1 shows the parameters of coal sample.
Industrial Analysis
Elemental analysis
Moisture
Ash
Volatile
Fixed carbon
C
H
O
N
S
7.22
28.20
14.31
50.27
69.22
3.87
24.67
1.06
1.18
2.2 Experimental device
2.2.1 Measurement of micropore morphology and pore structure
Scanning electron microscope (SEM) was used to observe the micromorphology of coal samples before and after LN2 treatment by using S-3400 N SEM, which was amplified by 10,000 times respectively.
The pore structure of coal samples was determined by Autosorb-IQ automatic gas adsorption analyzer.
2.2.2 Temperature program experiment
The temperature programmed experiment adopts the self-designed temperature programmed experiment system. The amount of coal in the coal sample reaction tank is 10 g. N2 and O2 are mixed in a ratio of 79:21, consistent with the ratio in the air. The experimental gas supply was 30 mL/min, the heating rate was 1℃/min, and the oxidation temperature of coal samples ranged from 40 ℃ to 200℃. Gas samples were collected every 20 ℃ and analyzed by gas chromatograph and computer.
2.2.3 Analysis of oxidation and spontaneous combustion characteristics of coal
The TG-DSC test instrument is STA449C comprehensive thermogravimetric analyzer produced by Netsch GMBH in Germany. The experimental conditions were set as follows: the heating rate was 10℃ /min, the sample mass was about 10 mg, and the reaction temperature was 25℃ ∼ 800℃.
2.2.4 Chemical structure analysis
The instrument used in the infrared experiment is the German TENSOR27 Fourier transform infrared spectrometer. The marked coal sample is ground with a mortar to less than 250 mesh, vacuum drying, fully mixed with KBr at the ratio of 1:180, grinding, tablet. Measuring range 400–4000 cm−1.
2.2.5 Free radical analysis
Bruker EMXnano electron paramagnetic resonance spectrometer (ESR) was used to determine the changes of active free radical during the low-temperature oxidation of coal under different oxidation conditions. The concentration of free radicals in coal samples to be measured was calibrated by Tempol standard sample with known concentration of free radicals. The spectra of standard samples were measured by Tempol under the same experimental conditions, and the concentration of free radicals in coal samples was measured indirectly by the spectrum area. The experimental parameters of ESR are shown in Table 2.
Central field
Scanning range
Microwave frequency
Modulation frequency
Amplitude
Time constant
Receiving gain
Scanning time
3420G
1000G
9.60 GHz
100 kHz
1G
1.28 ms
20 dB
50 s
2.3 Experimental process
The coal sample was subjected to oxidation and pyrolysis experiments through a programmed temperature device, and the preheating temperature (ST) was set at 70, 120, 170, 230℃. After reaching the target temperature, the temperature was constant for 1 h, and then the coal sample was taken out and put into a Dewar bottle, and liquid nitrogen was quickly added. After volatilization of LN2, the coal sample was taken out for experiment. Raw coal is labeled R, and raw coal plus LN2 is labeled LR. The labels of coal samples under other conditions are shown in Table 3.
Coal sample
Temperature
Laber
Preheated coal
Oxidation coal (O-R)
70
O-R70
120
O-R120
170
O-R170
230
O-R230
Pyrolysis coal (P-R)
70
P-R70
120
P-R120
170
P-R170
230
P-R230
Quenched-coal
Add LN2 after oxidation (O-L)
70
O-L70
120
O-L120
170
O-L170
230
O-L230
Add LN2 after pyrolysis (P-L)
70
P-L70
120
P-L120
170
P-L170
230
P-L230
3 Results and discussion
3.1 Influence of LN2 on pore structure of coal
In the process of inert gas inert coal spontaneous combustion, due to the low-temperature characteristics of LN2, it is necessary to analyze the pore and surface change characteristics of the quenched-coal.
3.2 SEM analysis
To obtain the influence of LN2 on the surface morphological characteristics of spontaneous combustion coal, SEM test was used to magnify the coal samples under different conditions by 10,000 times, as shown in Fig. 1. Due to space limitations, only test results at 70° C and 230° C are displayed.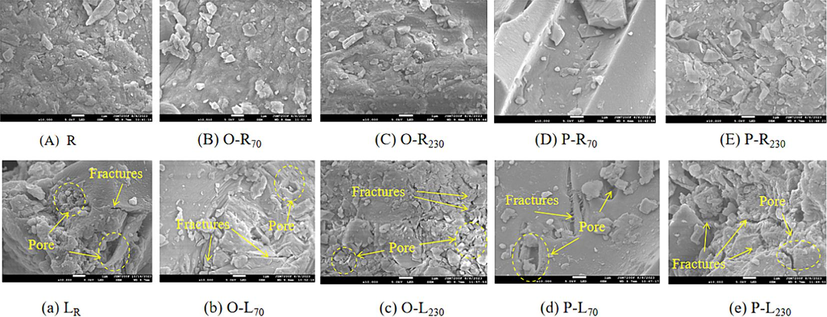
SEM images of coal samples under different conditions.
As can be seen from Fig. 1, with the increase of ST, the surface roughness of preheated coal is significantly higher than that of raw coal. Under oxidation and pyrolysis conditions, surface pores and cracks increase with the increase of temperature, but the pores of O-R coal are more than those of P-R coal. This is because the coal oxygen reaction increases the surface roughness of coal. After the treatment of LN2, the pore structure of coal surface is more developed. With the increase of temperature, the influence of LN2 on the surface roughness of pyrolysis coal is greater than that under oxidation condition.
The damage degree of LN2 to the quenched-coal surface structure increases with the increase of preheating temperature, which is because the coal body expands under heat, and the addition of LN2 makes the coal body shrink sharply, forming temperature stress and forming a certain stress field on the surface and interior of the coal pore. When the temperature stress reaches a certain level, it is damaged by the tensile stress, and the pore and fracture structure of coal develops (Liu et al., 2021). In order to further analyze the effect of LN2 on the pore structure distribution of quenched-coal, the fractal characteristics and pore parameters of coal are discussed by low temperature nitrogen adsorption method.
3.2.1 Fractal dimension analysis
The fractal characteristics of coal have previously been shown to follow the power function of the isothermal adsorption curve, as described by the Frenkel-Halsey-Hill (FHH) model (Li et al., 2019; Han et al., 2020; Mahamud and García, 2018). The equation for this relationship is as follows:
When solid–gas interactions dominate, equation (1) can be written as follows:
As the relative pressure of the adsorbed gas increases, subsequent multilayer molecular adsorption gradually begins until capillary condensation occurs (Han et al., 2020; Li et al., 2019). The following equation can be used:
According to P/P0, the fractal dimension of coal pores can be divided into two parts: the low pressure area (P/P0 < 0.5) and high pressure zone (P/P0 > 0.5), corresponding to fractal dimensions D1 and D2, respectively. D1 is the fractal feature of microhole, D2 is the fractal feature of transition hole, middle hole and large hole. The pores in the low pressure area are mainly adsorption pores, which mainly depend on van der Waals force. The pores in the high-pressure zone are mainly porous and mainly depend on capillary cohesion (Li et al., 2019).
Based on the nitrogen adsorption and desorption curves of each coal sample under LN2 suppression, the low pressure region and high pressure region were fitted respectively. lnV was taken as the ordinate, ln[ln(P0/P)] as the horizontal coordinate, and K as the slope, the fractal dimensions D1 and D2 of the two regions were calculated.
Fig. 2 shows the fractal dimension fitting curves of coal samples under different conditions obtained under the FHH model. The fractal dimension calculation results and pore parameters of the low-temperature nitrogen adsorption test are shown in Table 4. The fractal dimension is between 2 and 3, which conforms to the fractal theory. Fractal dimension D1 characterizes pore roughness in coal samples. The larger D1, the coarser the pore surface of the coal sample. The fractal dimension D2 characterizes the complexity and heterogeneity of pores in coal samples. The larger the D2, the higher the heterogeneity of the pores (Nie et al., 2015; Liu et al., 2022).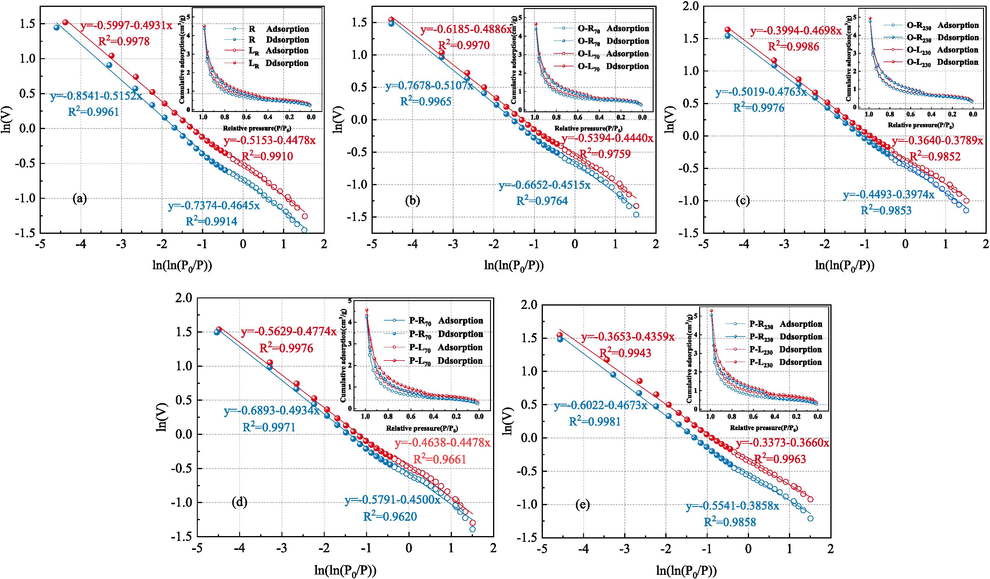
Fractal dimension fitting diagram of coal samples under different conditions.
Coal Sample
BET specific
surface area(m2 /g)BJH adsorption
internal surface area (m2 /g)BJH pore
Volume
(cm3 /g)Average
pore size
(nm)D1
D2
R
1.5479
1.1226
0.0060
13.7012
2.5355
2.4848
LR
1.5857
1.2882
0.0066
14.1072
2.5522
2.5069
O-R70
1.7208
1.3116
0.0067
14.7046
2.5485
2.4893
O-L70
1.7473
1.3321
0.0069
15.0680
2.5600
2.5114
O-R120
1.7915
1.4822
0.0068
14.8935
2.5502
2.5127
O-L120
1.8665
1.5681
0.0070
15.0361
2.5699
2.5230
O-R170
1.9334
1.5754
0.0068
15.4050
2.5705
2.5167
O-L170
1.9827
1.5896
0.0071
15.7988
2.5839
2.5276
O-R230
2.0044
1.7611
0.0073
15.7909
2.6026
2.5237
O-L230
2.0962
2.0259
0.0075
16.0349
2.6211
2.5302
P-R70
1.7391
1.3159
0.0066
14.6137
2.5500
2.5066
P-L70
1.8654
1.5004
0.0074
15.1460
2.5522
2.5226
P-R120
1.8715
1.7656
0.0070
15.3252
2.5654
2.5237
P-L120
1.9525
1.8112
0.0072
15.3600
2.5848
2.5302
P-R170
1.9900
1.8613
0.0078
15.4166
2.6059
2.5402
P-L170
2.2402
1.9595
0.0079
15.8156
2.6119
2.5513
P-R230
2.1693
1.8910
0.0078
16.5634
2.6142
2.5327
P-L230
2.2874
2.0650
0.0080
17.0172
2.6340
It can be seen from Table 4 that with the increase of ST, the fractal dimension D1 and D2 of quenched-coal both increase. Compared with raw coal, when ST is 230℃, O-L coal D1 and D2 increase by 3.37 % and 1.35 % respectively; P-L coal D1 and D2 increased by 3.88 % and 1.56 %, respectively. The results show that the pore surface roughness of coal treated with LN2 is greater than that of raw coal.The results of fractal dimension D1 and SEM experiments confirm each other, the higher the preheating temperature of coal, the more serious the damage of coal after adding LN2, and the more obvious the increase of surface pores and cracks. The increase of D2 indicates that LN2 makes the micropores in coal expand into mesoporous, which makes the pore structure of coal more complex. D1 is greater than D2, which indicates that the pore surface of coal micropores is more complex.
Compared with raw coal, the specific surface area, pore volume and average pore diameter of quenched-coal have increased in different degrees. Under oxidation conditions, when LN2 was added at ST 70, 120, 170 and 230℃, the specific surface area increased by 12.88 %, 20.58 %, 28.08 % and 35.42 % respectively; The pore volume increased by 15.55 %, 17.18 %, 17.71 % and 24.24 %, respectively; The average aperture increased by 9.97 %, 9.74 %, 15.30 % and 17.03 %, respectively. Under pyrolysis conditions, when LN2 is added to ST at 70, 120, 170 and 230℃, the specific surface area increases by 20.51 %, 26.13 %, 44.72 % and 47.77 % respectively; The pore volume increased by 23.09 %, 19.21 %, 31.95 % and 32.47 %, respectively; The average aperture increased by 10.54 %, 12.10 %, 15.43 % and 24.20 %, respectively. By analyzing the fractal dimension and pore parameters of the pores of quenched-coal treated with LN2, it can be concluded that pyrolysis coal is most affected by LN2 as the temperature increases.
3.3 Low-temperature oxidation results of coal samples treated with LN2
To obtain the spontaneous combustion characteristics of coal quenched by LN2 in goaf, the gas products of coal samples during low-temperature oxidation are compared and analyzed. Fig. 3 shows the changes of CO and CO2 concentrations produced by coal samples under different conditions.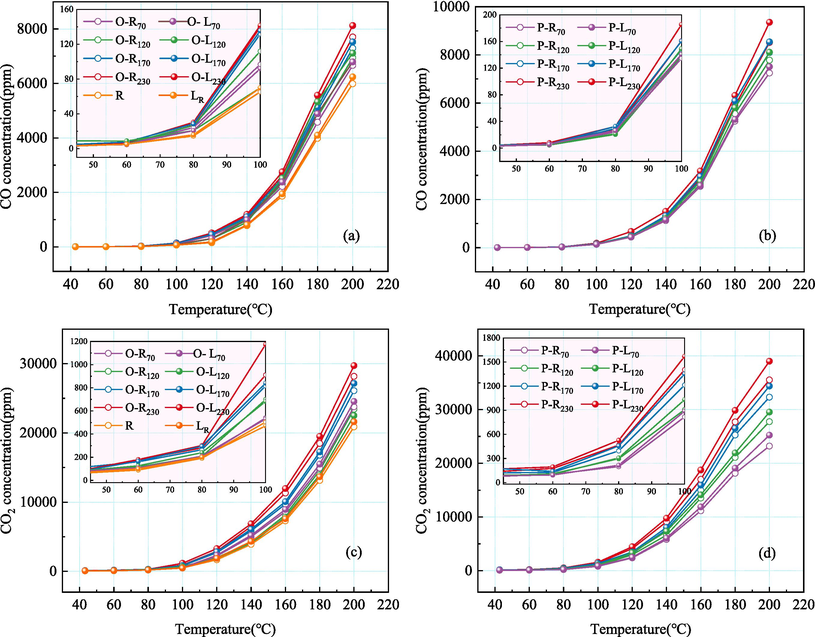
Changes of CO and CO2 concentrations of coal samples with temperature.
The experimental results clearly demonstrate that preheating temperature significantly influences the release of CO and CO2 during the coal oxidation process. As the temperature (ST) increases, the release of CO and CO2 gradually escalates during coal oxidation. Notably, this effect catalytically impacts the release of CO2 and CO at 60 °C and 80 °C, respectively. This is because with the increase of ST, the oxidation degree of O-R coal goes deeper, the number of active functional groups greatly increases, and P-R coal also increases with the desorption active site of gas, resulting in a stronger reaction rate of preheated coal than raw coal at the low-temperature stage.
After the addition of LN2, the quenched-coal shows a stronger reaction ability. At the initial stage of oxidation, the content of CO and CO2 released by the reaction of quenched-coal is not significantly different from that of the preheated coal, which is because the desorption of nitrogen does not completely affect the oxygen reaction of coal at low-temperature. As the oxidation temperature increases, quenched-coal exhibits a greater reaction rate. When ST is 70℃, when O-L coal and P-L coal react to 200℃, CO release increases by 124.44 ppm and 258.77 ppm compared with preheated coal. When ST is 230℃, when O-L coal and P-L coal react to 200℃, CO release increases by 419.35 ppm and 838.37 ppm compared with preheated coal. It shows that the higher the preheating temperature of quenched-coal in goaf, the stronger the secondary oxidation capacity. Comparing the gas release of coal under oxidation and pyrolysis conditions, the release of CO and CO2 at ST of 230℃ is 8123.65 ppm, 29717.03 ppm, 9353.76 ppm and 39006.79 ppm, respectively. P-L coal shows a stronger secondary oxidation reaction capacity, which is due to the more developed pore cracks in coal under pyrolysis conditions, providing more active sites for coal-oxygen reaction.
3.4 DSC analysis
Due to the fact that the continuous heat storage capacity of goaf coal is the most important indicator affecting coal spontaneous combustion, analyzing the influence of LN2 on the heat release characteristics of quenched-coal is of great significance. As shown in Fig. 4, there are significant differences in the heat flux curves (DSC) of coal samples under different conditions. In order to better reflect the heat release of quenched-coal at low-temperature, the maximum endothermic temperature (T1), initial exothermic temperature (T2) and their reaction process on the DSC curve of the oxidation process were selected for analysis. The three stages are: 27 ℃ - T1 for Stage I, T1-T2 for Stage II, and T2-250 ℃ for Stage III. The heat flow rate variation of DSC curve integration is shown in Table 5.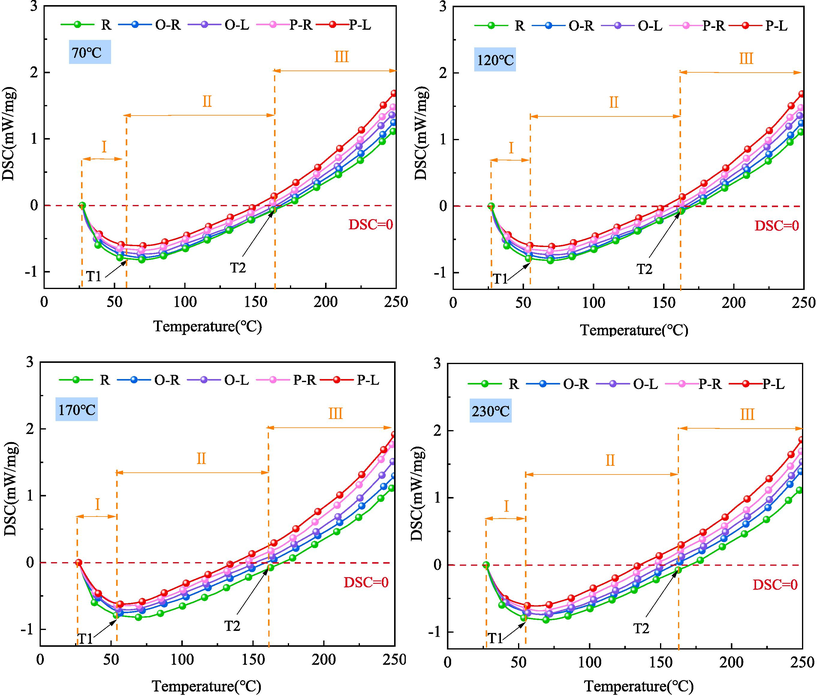
DSC curves of coal samples under different conditions.
Coal Sample
Characteristic temperature point (℃)
Heat (J/g)
T1
T2
Ⅰ
Ⅱ
Ⅲ
R
65.27
164.48
−30.83
−60.46
294.12
LR
61.71
163.75
−25.22
−58.12
297.05
O-R70
61.21
163.32
−27.95
−56.63
300.24
O-L70
59.53
158.31
−21.28
−49.16
303.98
O-R120
55.00
156.47
–23.51
−46.49
316.39
O-L120
55.75
152.37
−17.17
−41.05
327.39
O-R170
54.22
146.16
−21.54
−35.72
343.76
O-L170
52.20
145.16
−13.51
−28.17
348.02
O-R230
51.71
144.14
−14.74
–32.99
350.98
O-L230
51.27
143.49
−11.93
−25.54
358.43
P-R70
61.58
162.52
−25.32
−54.81
307.21
P-L70
55.72
158.06
−12.16
−52.87
334.78
P-R120
52.15
154.78
−18.72
−40.57
336.18
P-L120
52.64
148.59
−15.42
−35.51
340.24
P-R170
52.26
146.91
−15.73
−35.27
345.64
P-L170
51.86
143.92
−13.12
−26.03
360.71
P-R230
51.44
140.81
−11.98
–32.49
382.31
P-L230
50.11
134.49
−10.53
–22.22
425.48
It can be seen from Table 5 that the characteristic temperature of quenched-coal is lower than that of preheated coal. When ST is 70℃, the characteristic temperature points T1 and T2 of O-L coal and P-L coal decrease by 2.74 %, 3.06 % and 9.51 %, 2.74 %, respectively. When ST rises to 230℃, the characteristic temperature points T1 and T2 of O-L coal and P-L coal decrease by 0.85 %, 0.45 % and 2.58 % and 4.48 % respectively. Although the quenched-coal is affected by nitrogen desorption in the low temperature oxidation stage, the increase of specific surface area makes the coal adsorb more oxygen, resulting in the coal entering the exothermic stage in advance.
As can be seen from Table 5, the total heat of preheated coal shows an increasing trend with the increase of ST. The heat absorption of raw coal is 91.29 J/g. When ST is 70, 120, 170, 230, the total heat absorption of O-L coal and P-L coal is 70.44, 58.22, 41.61, 37.47 J/g and 65.03, 50.93, 39.13, 32.72 J/g, respectively. Since P-L coal will absorb more oxygen at low temperatures, the adsorption heat generated is much greater than O-L coal, so the total heat absorption of P-L coal is smaller.
The reaction mechanism function was determined by Coats-Redfern method and the actual apparent activation energy was calculated for further analysis. The Coats-Redfern method is calculated as follows (Zhang et al., 2024; Wang et al., 2023; Zhang et al., 2023):
The relationship between coal quality change and heat release change is as follows:
Changes of activation energy of coal samples under different conditions.
According to the above calculation, the stage I and II of the temperature rise process of coal belong to the endothermic process. The absorption of heat mainly comes from the desorption of gas in coal and the evaporation of water. With the increase of temperature, the heat released by oxidation adsorption and reaction of coal increases, resulting in the maximum heat absorption rate in coal (T1). As the temperature continues to rise, the heat transfer rate of the coal-oxygen reaction begins to be greater than the heat absorption rate, showing that the heat absorption decreases. Finally, when the heat discharge is greater than the heat absorption (T2), the coal begins to enter the heat release stage. Therefore, the reaction capacity of coal at Stage I and Stage II directly affects the heat release of coal-oxygen reaction.
The determination of apparent activation energy can provide insights into the challenges associated with spontaneous coal combustion. During the endothermic stage, higher activation energy corresponds to lower heat absorption, leading to increased oxygen adsorption and reaction rates for coal (Zhang et al., 2023). As can be seen from Fig. 5, the activation energy of coal under LN2 quenched-coal is higher than that of preheated coal at the same stage. In the stageⅠ, when ST is 70, 120, 170, 230℃, the activation energy of O-L coal and P-L coal increases by 6.00, 7.33, 8.81, 9.85 kJ/mol and 9.12, 10.34, 11.84, 15.96 kJ/mol, respectively, compared with that of preheated coal. In the stageⅡ, when ST is 70, 120, 170, 230℃, the activation energy of O-L coal and P-L coal increases by 3.73、4.98、7.24、10.50 kJ/mol and 1.44、2.10、5.62、6.85 kJ/mol, respectively. This is because LN2 increases the coal oxygen reaction rate in the low-temperature endothermic stage of preheated coal, and the oxidation energy barrier decreases, which is manifested as the apparent activation energy increases in the endothermic stage. With the increase of ST, liquid nitrogen has a greater influence on the activation energy of coal at low-temperature endothermic stage. Comparing the effect of liquid nitrogen on the activation energy of preheating coal at different stages, it is found that the activation energy of P-L coal increases more at Stage I. This is because the pyrolysis coal adsorbs a large amount of oxygen at the beginning of the coal-oxygen reaction and releases the adsorption heat. In Stage II, the increment of activation energy of O-L coal is greater than that of P-L coal, and more active groups undergo oxidation exothermic reaction, resulting in a higher apparent activation energy of endothermic reaction in this stage.
3.5 FTIR analysis
The types and contents of different functional groups in coal under different conditions were determined by FTIR method in order to analyze the reason why coal was prone to spontaneous combustion after LN2 injection. The FTIR spectra of coal samples under different conditions are shown in Fig. 6.
FTIR curves of coal samples under different conditions.
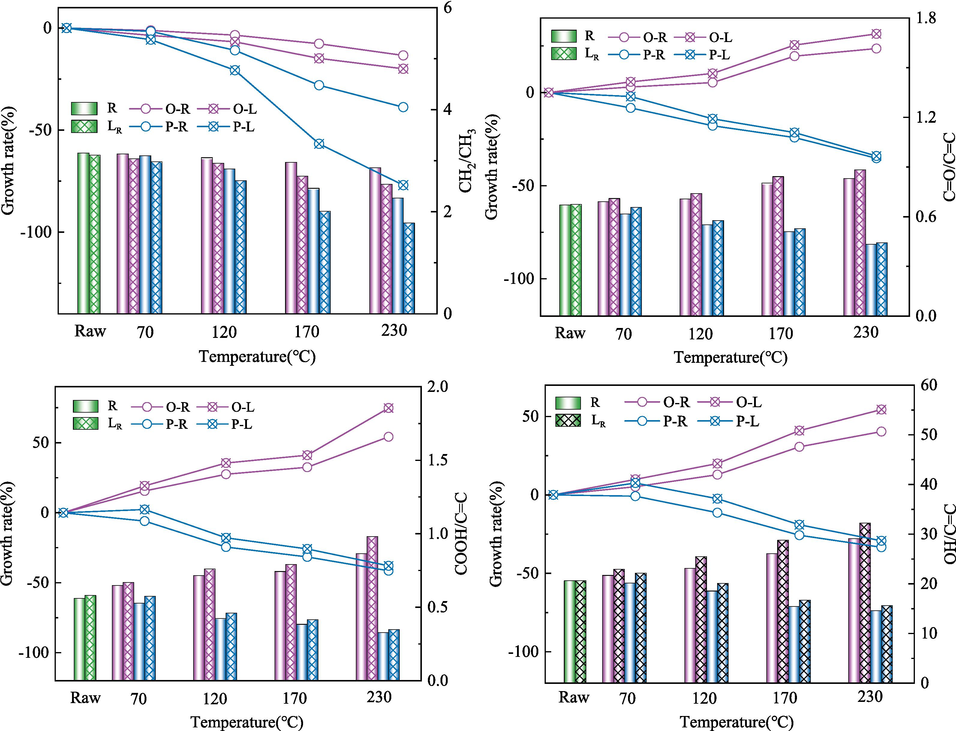
The infrared absorption peak intensity of coal samples at different wavelengths is different, and the vibration intervals with great differences are as follows (Deng et al., 2023; Zhang et al., 2019; Zheng et al., 2020): –OH absorption stretching vibration range (3000 ∼ 3600 cm−1), aliphatic –CH3 absorption stretching vibration range (2800 ∼ 3000 cm−1), aromatic -C = O compounds stretching vibration range (1500 ∼ 1800 cm−1) and alcohol, phenol and ether -C-O-C stretching vibration range (1000 ∼ 1300 cm−1). Peakfit was used to perform sub-peak fitting for 1500–1800 cm−1, 2800–3000 cm−1 and 3000–3600 cm−1, and the sub-peak fitting results were shown in Fig. 7. According to the peak fitting results, the changes of aliphatic hydrocarbon and oxygen-containing functional groups were analyzed semi-quantitatively. The main functional groups analyzed are as follows: –CH2/–CH3 (2922/2955 cm−1), -C = O/-C = C (1653/1610 cm−1), –COOH/-C = C (1702/1610 cm−1), –OH/-C = C (3423/1610 cm−1) (Lu et al., 2021; Li et al., 2019; Wang et al., 2022). The results of functional group semi-quantitative analysis of coal samples under different conditions are shown in Fig. 8.
Peak fitting curve of raw coal.
Changes in functional groups of coal samples under different conditions.
As can be seen from Fig. 8, with the increase of preheating temperature, the oxygen-containing functional groups of O-R coal show an increasing trend, while –CH2/–CH3 gradually decrease. The content of oxygen-containing functional groups of O-L coal is much higher than that of preheated coal. When ST is 70℃, the content of -C = O, –COOH and –OH in O-L coal increases by 2.69 %, 6.12 % and 5.74 % respectively. When ST rises to 230℃, the -C = O, –COOH and –OH in O-L coal increase by 6.35 %, 13.30 % and 10.95 % respectively, which is due to the continuous consumption of oxygen-containing functional groups in the cooling process of O-R coal. However, LN2 blocked the oxidation reaction of O-R coal, and a large number of oxygen-containing functional groups could not carry out further reaction. When in the spontaneous combustion process again, these active groups show a stronger reaction capacity than the raw coal. However, the aliphatic hydrocarbon ratio in quenched-coal continues to decrease with the increase of ST compared with that in preheated coal, mainly because LN2 aggravates the crushing of high-temperature coal, resulting in the aliphatic hydrocarbon bridge bond –CH2- fracture in coal.
With the increase of preheating temperature, a large number of active groups in P-R coal are released. The content of oxygen-containing functional groups and aliphatic hydrocarbons in coal decreased gradually compared with that of raw coal. The content of -C = O, –COOH and –OH decreased by 34.05 %, 37.93 % and 29.24 % respectively when ST was 230℃. The content of oxygen-containing functional groups in P-L coal is higher than that of P-R coal, which may be due to the continuous release of desorption gas during the cooling process of pyrolysis coal. The content of –CH2- also decreased with the continuous increase of pyrolysis temperature.
Comparing the effects of LN2 on the active groups of coal in the two reaction processes, it was found that LN2 had the greatest influence on the content of –COOH in oxidation coal, followed by –CH2-. This is due to the continuous release of CO2 during the cooling process of oxidation coal. The LN2 has the greatest influence on the content of –CH2- in pyrolysis coal. With the increase of ST, LN2 causes serious damage to the coal body, and the pore structure of the coal body is further developed, which aggravates the fracture of the bridge bond.
3.6 ESR analysis
Free radicals are generally considered as the active sites on the surface of coal, and the active sites can be converted into oxygen-containing functional groups under certain conditions (Guanhua et al., 2019; Li et al., 2019). g factor and free radical concentration (Ng) in coal under different conditions were determined by ESR. ESR spectra of coal samples under different conditions are shown in Fig. 9.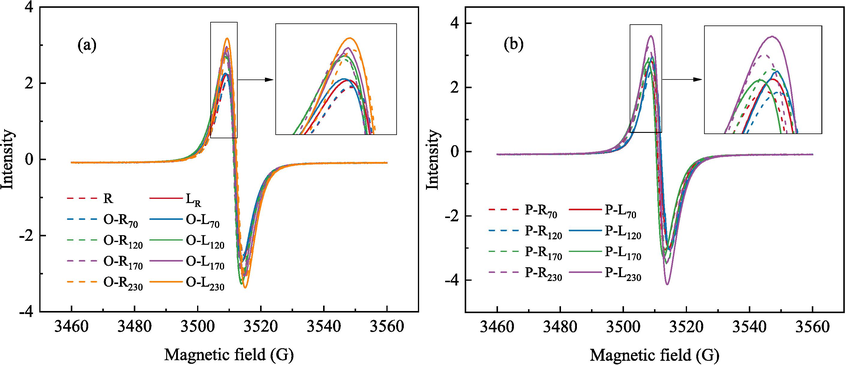
ESR curves of coal samples.
It is generally believed that the g factor of carbon atom center radical is close to that of free electron 2.0029, the g factor value of aromatic structure radical is 2.0032, the g factor of carbon atom center radical with oxygen atom nearby is 2.0034–2.004, and the g factor of oxygen atom center radical is greater than 2.004 (Duan et al., 2023; Li et al., 2019). It can be seen from Fig. 10 that with the increase of ST, the g factor and free radical concentration of O-R coal gradually increase, indicating that the proportion of alkoxy radicals in the total free radicals increases. When ST is 70 °C, 120 °C, 170 °C and 230 °C, the g-value of O-L coal increases by 4.28E-06, 9.24E-06, 1.45E-05 and 2.34E-05, respectively, compared with that of raw coal. The g-value of P-L coal decreased by 4.14E-06, 5.92E-06, 8.13E-06 and 1.12E-05, respectively, compared with that of raw coal, and the proportion of alkyl free radicals in total free radicals increased. This is due to the inerting of LN2 and the sealing of oxygen-containing functional groups in O-R coal. The temperature stress caused by the freezing of P-R coal by LN2 also causes the bridge bond to break, and more alkyl radicals are formed. It can be seen from the change of free radical concentration that the addition of LN2 increases the concentration of free radicals in coal, provides more active sites for coal-oxygen reaction under low-temperature conditions, and promotes coal spontaneous combustion.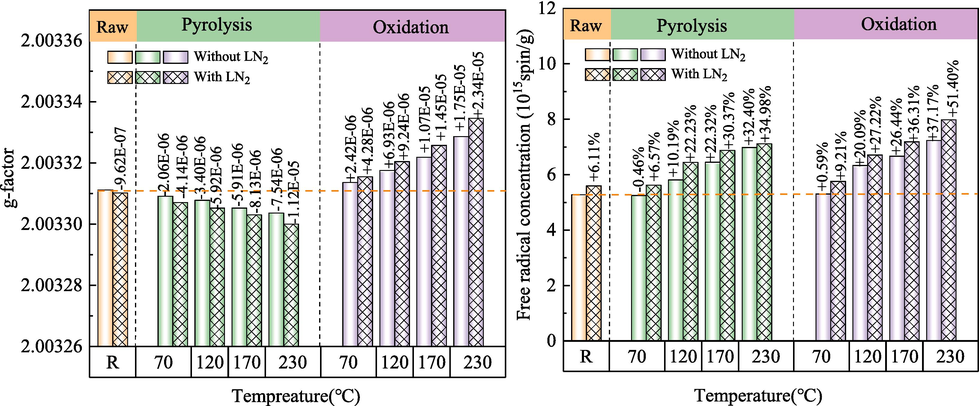
Changes in g-values and free radical concentrations of coal samples.
3.7 Mechanism
After injecting liquid nitrogen (LN2) to quench the fire in a spontaneous combustion coal seam, the primary coal undergoes damage during the initial oxidation and quenching process. This leads to secondary structural development within the coal, as depicted in Fig. 11. Compared with raw coal, the fissure of preheated coal increases and the active site increases. Oxygen-containing functional groups of O-R coal increase. Oxygen-containing functional groups of P-R coal decrease. Preheated coal has larger cracks and more active sites than raw coal. The oxygen-containing functional groups of O-R coal increase. The oxygen-containing functional groups of P-R coal are reduced. After adding LN2, the fracture of coal increases, the average pore diameter of coal is greatly increased by temperature stress, and the pore connectivity of coal is enhanced, which is beneficial to the adsorption of oxygen. In terms of chemical structure changes, after LN2 injection, the broken coal body leads to the fracture of aliphatic bridge bond –CH2- in coal, the increase of carbon free radical concentration and the increase of active sites. Oxygen-containing functional groups such as –COOH and –OH are sealed, which promotes the low-temperature oxidation activity of coal.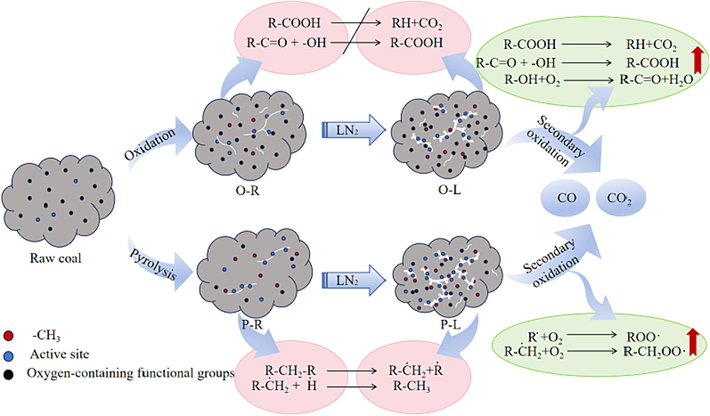
Mechanism diagram.
Therefore, after injecting LN2 into the goaf for fire prevention and quenching, it is essential to enhance vigilance regarding the reburning of the old goaf and the management of fire-prone areas. Implementing effective measures will help mitigate the risk of coal spontaneous combustion recurring.
4 Conclusion
To investigate the effect of LN2 on the spontaneous combustion characteristics of preheating coal, preheating treatment was carried out at 70 °C, 120 °C, 170 °C and 230 °C respectively under aerobic and anaerobic conditions, and then LN2 treatment was carried out. The variation characteristics of surface structure, oxidation characteristics and chemical structure of coal under the action of LN2 quenching were studied by surface structure test, thermal analysis experiment and chemical characteristics analysis. The main conclusions are as follows:
The pore structure test experiment shows that LN2 has a significant effect on the pore structure of preheated coal. With the increase of preheating temperature, the fractal dimension, specific surface area, pore volume and average pore size of the coal quenched by LN2 increase. Due to the thermal expansion of the coal body, the addition of LN2 makes the coal body form a temperature stress, which in turn makes the pore and fracture structure of the coal develop. Under the same conditions, LN2 has a greater degree of damage to the surface structure of pyrolysis coal.
The oxidation characteristics of preheated coal are enhanced under the quenching effect of LN2. With the increase of preheating temperature, under the oxidation condition, the CO and CO2 produced at ST of 230 °C are 1.19 times and 1.21 times higher than those at ST of 70 °C. Under pyrolysis conditions, the CO and CO2 produced when ST is 230 °C are 1.24 times and 1.54 times that when ST is 70 °C, indicating that the higher the preheating temperature of the quenched-coal in the goaf, the stronger the secondary oxidation ability. Due to the more developed pore fissures of P-L coal, the spontaneous combustion characteristics of coal are stronger.
By analyzing the heat flow rate curve, it is found that the characteristic temperature of coal after adding LN2 is lower than that of preheated coal. The kinetic calculation results show that the pyrolysis coal is affected by LN2. In the first stage of heat absorption, the coal oxygen adsorption capacity is stronger and the apparent activation energy is higher. Oxidation coal shows stronger oxidation exothermic ability in the stageⅡ under the action of LN2, resulting in higher apparent activation energy in this endothermic stage.
The addition of LN2 changed the content of active groups in preheated coal, blocked the oxidation reaction of O-R coal, and sealed the structure of -C = O, –COOH and –OH. The bridge bond –CH2- structure of pyrolysis coal was further destroyed, resulting in the decrease of –CH2/–CH3 ratio. The increase of alkyl radicals in pyrolysis coal and the increase of alkoxy radicals in oxidation coal accelerate the natural oxidation of coal.
CRediT authorship contribution statement
Cong Ding: Conceptualization, Data curation, Writing – original draft, Writing – review & editing. Zongxiang Li: Visualization, Investigation, Validation. Cheng Wang: Formal analysis, Methodology. Bing Lu: Supervision, Software.
Acknowledgments
The authors acknowledge the financial support from the National Natural Science Foundation of China (51774170).
Declaration of competing interest
The authors declare that they have no known competing financial interests or personal relationships that could have appeared to influence the work reported in this paper.
References
- Study on the effect of inorganic and organic sodium on coal spontaneous combustion. Fuel. 2023;353:129256
- [Google Scholar]
- Experimental studies of spontaneous combustion and anaerobic cooling of coal. Fuel. 2015;157:261-269.
- [Google Scholar]
- Experimental research on the spontaneous combustion of coal with different metamorphic degrees induced by pyrite and its oxidation products. Fuel. 2022;318:123642
- [Google Scholar]
- Study on the effect of coal microscopic pore structure to its spontaneous combustion tendency. J. Sustainable Min. 2022:21.
- [Google Scholar]
- analytical prediction of coal spontaneous combustion tendency: pore structure and air permeability. Sustainability. 2023;15(5):4332.
- [Google Scholar]
- Effect of molecular structure change on the properties of persistent free radicals during coal oxidation. Fuel. 2023;350:128861
- [Google Scholar]
- Effects of [Bmim][Cl] ionic liquid with different concentrations on the functional groups and wettability of coal. Adv. Powder Technol.. 2019;30(3):610-624.
- [Google Scholar]
- Experimental analysis of the pore structure and fractal characteristics of different metamorphic coal based on mercury intrusion-nitrogen adsorption porosimetry. Powder Technol.. 2020;362:386-398.
- [Google Scholar]
- The relevance between water release behavior and pore evolution of hard lignite during the thermal-drying process. J. Energy Inst.. 2019;92(6):1689-1696.
- [Google Scholar]
- A multi-channel reaction model study of key primary and secondary active groups in the low-temperature oxidation process of coal. Energy. 2023;129032
- [Google Scholar]
- The auto-oxidation characteristic of coal at different stages of the low-temperature oxidation process. Fuel. 2023;352:129130
- [Google Scholar]
- Room temperature oxidation of active sites in coal under multi-factor conditions and corresponding reaction mechanism. Fuel. 2019;256:115901
- [Google Scholar]
- Insight into the chemical reaction process of coal self-heating after N2 drying. Fuel. 2019;255:115780
- [Google Scholar]
- Examination of CO, CO2 and active sites formation during isothermal pyrolysis of coal at low temperatures. Energy. 2019;185:28-38.
- [Google Scholar]
- Adsorption pore structure and its fractal characteristics of coals by N2 adsorption/desorption and FESEM image analyses. Fuel. 2019;257:116031
- [Google Scholar]
- Liu N, Sun L, Wang H, et al. Effects of Liquid Nitrogen Freezing on Secondary Oxidation and Spontaneous Combustion of Coal[J]. Available at SSRN 4110682.
- Experimental study on temperature response of different ranks of coal to liquid nitrogen soaking. Nat. Resour. Res.. 2021;30:1467-1480.
- [Google Scholar]
- The temperature rise characteristics of coal during the spontaneous combustion latency. Fuel. 2022;326:125086
- [Google Scholar]
- Investigations on the mechanism of the microstructural evolution of different coal ranks under liquid nitrogen cold soaking. Energy Sources Part A 2022::1-17.
- [Google Scholar]
- Effects of liquid CO2 phase transition fracturing on mesopores and micropores in coal. Energy Fuel. 2022;36(17):10016-10025.
- [Google Scholar]
- Evolution of pore and fracture of coal under heating–freezing effects: an experimental study. Fuel. 2021;306:121618
- [Google Scholar]
- Experimental study of effect of liquid nitrogen cold soaking on coal pore structure and fractal characteristics. Energy. 2023;275:127470
- [Google Scholar]
- Oxidative kinetic characteristics of dried soaked coal and its related spontaneous combustion mechanism. Fuel. 2021;305:121626
- [Google Scholar]
- Textural characterization of chars using fractal analysis of N2 and CO2 adsorption. Fuel Process. Technol.. 2018;169:269-279.
- [Google Scholar]
- Pore structure characterization of different rank coals using gas adsorption and scanning electron microscopy. Fuel. 2015;158:908-917.
- [Google Scholar]
- Distribution of unfrozen water and heat transfer mechanism during thawing of liquid nitrogen immersed coal. Energy. 2023;263:125905
- [Google Scholar]
- Accurate characterization method of coal pore and pore throat structure of different coal ranks based on two-dimensional NMR liquid nitrogen fracturing cycles. Fuel. 2023;341:127729
- [Google Scholar]
- Experimental study on coal permeability and cracking characteristics under LN2 freeze-thaw cycles. J. Nat. Gas Sci. Eng.. 2020;83:103526
- [Google Scholar]
- Exploring the factors influencing the low temperature CO gas production characteristics of low-metamorphic coal. Fuel. 2024;359:130257
- [Google Scholar]
- Insight into the low-temperature oxidation behavior of coal undergone heating treatment in N2. Fuel. 2022;330:125628
- [Google Scholar]
- Multiscale thermal behavioral characterization of spontaneous combustion of pre-oxidized coal with different air exposure time. Energy. 2023;262:125397
- [Google Scholar]
- Effect of thermal damage on the pore–fracture system during coal spontaneous combustion. Fuel. 2023;339:127439
- [Google Scholar]
- Experimental investigation on using antioxidants to control spontaneous combustion of lignite coal. Fuel. 2023;334:126679
- [Google Scholar]
- Pore structure evolution and oxidation characteristic change of coal treated with liquid carbon dioxide and liquid nitrogen. Energy. 2023;268:126674
- [Google Scholar]
- Effect on liquid nitrogen impregnation of pore damage characteristics of coal at different temperatures. J. China Coal Soc.. 2020;45(8):2813-2823.
- [Google Scholar]
- Experimental analysis and research on fire-fighting characteristics of liquid nitrogen. Shandong Coal Science and Technology; 2021.
- Experimental and simulation study on hydroxyl group promoting low-temperature oxidation of active groups in coal. Fuel. 2023;340:127501
- [Google Scholar]
- Study on the kinetics of chemical structure reaction in coal catalyzed by OH free radicals. Energy. 2023;129553
- [Google Scholar]
- Stage changes in the oxidizing properties of long-term water-soaked coal and analysis of key reactive groups. Fuel. 2024;358:130186
- [Google Scholar]
- Experimental study and thermodynamic analysis of coal spontaneous combustion characteristics. Combust. Theor. Model.. 2023;27(1):118-137.
- [Google Scholar]
- Ultrasonic extraction and oxidation characteristics of functional groups during coal spontaneous combustion. Fuel. 2019;242:287-294.
- [Google Scholar]
- Real-time analysis of the changing trends of functional groups and corresponding gas generated law during coal spontaneous combustion. Fuel Process. Technol.. 2020;199:106237
- [Google Scholar]


