Experimental and mechanistic study of mudstone volumetric swelling at the bottom of salt cavern gas storage
⁎Corresponding author at: China University of Petroleum-Beijing, Beijing 102249, China zhoufj@cup.edu.cn (Fujian Zhou)
-
Received: ,
Accepted: ,
This article was originally published by Elsevier and was migrated to Scientific Scholar after the change of Publisher.
Peer review under responsibility of King Saud University.
Abstract
Salt cavern gas storage is one of the vital strategic natural gas reserves and emergency peak shaving facilities all over the world. However, rock salt in China is primarily bedded salt, usually composed of many thin salt layers and interlayers (e.g., anhydrite, mudstone, and glauberite). During the water solution mining process of the cavern, the insoluble mudstones fall to the bottom and account for 1/3 up to 2/3 of the storage capacity. The bulk volume of the insoluble mudstones is almost twice its in-suit volume. It is of great urgency to investigate the swelling mechanisms of the bottom insoluble mudstones. Given this, we first analyzed the mineral composition of salt rock and insoluble mudstones by using XRD and SEM methods. Then, experimental studies were carried out considering both clay swelling and physical packing. At last, the zeta potential tests were conducted to reveal the swelling mechanisms of the bottom mudstones. Results show that the volumetric expansion of mudstones is made up of three parts: clay swelling, particle surface bound water volume, and pore space free water volume increase. Because the content of expansive clay in the bottom mudstones is less than 2%, and the high salinity brine in the cavern has excellent clay stability performance, clay swelling is not the main contributor to the volumetric expansion of the bottom mudstones. Measurement results show that the surface of the mudstones is negatively charged after hydration. Electrostatic repulsion can increase the spacing between small rock particles and creates approximately 47.6% of the pore space, which is the main factor in the volumetric expansion of mudstones. This study provides a theoretical basis for the mining solution and capacity enlargement during the construction of bedded salt cavern gas storage in China.
Keywords
Salt cavern gas storage
Insoluble mudstones
Swelling mechanisms
Electrostatic repulsion
Pore space
1 Introduction
As clean energy, natural gas plays an increasingly important role in China's energy consumption (Zhao et al., 2021). With China already committing to peak carbon dioxide emissions before 2030 and achieving carbon neutrality before 2060, it called for accelerated efforts to transfer the energy structure and need to improve the proportion of clean and renewable energy in consumption (Chen and Lin, 2021; Wan et al., 2021; Song et al., 2022). As the cleanest and the most energy-efficient fossil fuel, natural gas gradually plays a central role in Chinese primary energy consumption (Furuoka, 2016; Mac Kinnon et al., 2018). Fig. 1 presents the consumption of natural gas in China (Liu et al., 2018). It is generally believed that natural gas will greatly contribute to energy consumption structure optimization (Mac Kinnon et al., 2018; Song et al., 2022).
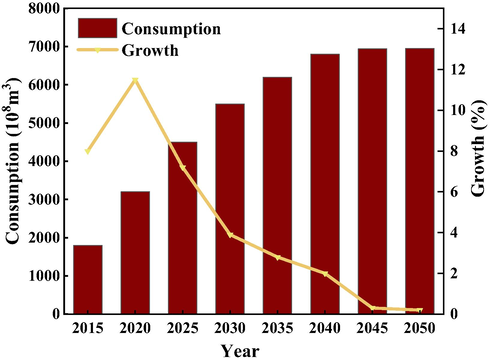
- The consumption of natural gas in China (Liu et al., 2018).
Although China has abundant natural gas resources, the contradiction between the supply and demand of China's natural gas market has become increasingly prominent as consumption increases (Liu et al., 2018; Zhang et al., 2020). Regional and seasonal consumption differences in the natural gas markets often lead to a “gas hunger” problem, reflecting that the quantity of reserved natural gas is not sufficient to serve for emergency and high-consumption periods (Su et al., 2015; Chen et al., 2018; Chen et al., 2020). Therefore, it is highly necessary to establish a gas storage system to maintain a stable natural gas supply. Because of the low permeability, high plasticity, and the good performance in isolation, salt cavern underground gas storage is considered the best space for natural gas storage (Chen et al., 2018; Firme et al., 2019; Jelušič et al., 2019). Compared with the other storage facilities, the salt cavern gas storage enjoys many outstanding advantages, including the large single-cavity storage capacity, fire and explosion-proof, pollution prevention, and lower operational costs, which is very suitable for China's strategic natural gas reserves and crucial emergency peak shaving facilities (Chen et al., 2018; Mac Kinnon et al., 2018; Zhang et al., 2020).
The extensively distributed rock salts in eastern China are all lacustrine thinly bedded types, characterized by thin thickness, a high proportion of impurities, and numerous intersecting non-salt interlayers (Liu et al., 2019; Chen et al., 2020). These interlayers have a wide range of thicknesses, and the content of insoluble mudstones is ranged from 15% to 35% (Fansheng, 2017). These insoluble mudstones generally occupy a large volume in the cavity after construction. For example, in the Jintan, the height of the insoluble sediments accounts for as much as 43% of the total cavern height (Li et al., 2016). In some cases, the insoluble mudstones in a single cavern can reach up to 40 m high, which seriously inhibits cavern growth and reduces the storage capacity of the cavern (Li et al., 2016). Moreover, bottom mudstones pose many challenges to the water-solution mining method in bedded rock salt formations, especially in the process of “gas-injection and brine-expelled”. They may cause tube blockages and flow restrictions unless controlled or removed (Warren, 2006). The high contents of insoluble mudstones have seriously hindered cavern development, which deserves more attention.
Most existing studies focused on solution mining technology, the influences of insoluble interlayers on cavern shape, stability, safety, and so on (Bauer et al., 1998; Wang et al., 2016; Wei et al., 2016; Wang et al., 2018; Liu et al., 2019). Charnavel and Lubin (Charnavel and Lubin, 2002) pointed out that the insoluble interlayers will fall at dawn, forming a raised bottom. Fan (Fansheng et al., 2006) studied the influence of insoluble substances content on the effective space in salt cavern gas storage by numerical simulation. Chen (Chen et al., 2013) carried out lab experiments and theoretical analysis to study the impact of shape, size, arrangement mode, and grain composition on the bulking-expansion coefficient of rock particles. Moreover, they point out that the volume occupied by the insoluble mudstones at the bottom is greater than the volume of the interlayer itself, mainly because the clay minerals undergo water absorption and swelling. Li et al. (Li et al., 2016) proposed a predictive mathematical model of the accumulation shape of insoluble sediments during the cavern leaching process. In terms of the research on the calculation model of accumulations’ porosity, Furnas et al. (Gandrud, 1928) firstly put forward the packing theory of discontinuous particles, which believes that the packing method of mixed particles is those small particles are filled in the voids of large particles. Suzuki and Oshima (Suzuki and Oshima, 1985) proposed a method for calculating the porosity of ternary mixed spherical particles using geometric statistics, which uses the particle size to calculate the bulk volume of the packed particles. Han (Han, 2015) applied the discrete element simulation method to investigate the pore volume of the accumulations, showing the calculation result of the Compressible Packing Model (CPM) method is 48.23%, which is slightly smaller than the fractal method. Because the construction method of gas storage is a water-solution mining method, it is difficult to obtain insoluble mudstones at the bottom of the cavern directly, and numerical computing methods are mainly used currently.
The background information shows that previous studies have little attention to the volumetric swelling of insoluble mudstones at the bottom of the salt cavern, especially in the swelling mechanisms. The main motivation of this paper is to clarify the potential reasons for its swelling. X-ray diffraction (XRD) and scanning electron microscope (SEM) tests were first carried out to obtain the mineral characteristics of salt rock and insoluble mudstone. Further, a series of lab experiments were conducted to quantitatively analyze the main controlling factors for the swelling of these mudstones. At last, the swelling mechanism was revealed by zeta potential tests and chemical shrinkage experiments. This study preliminarily explored the swelling mechanism of insoluble mudstones at the bottom of salt cavern gas storage in China and provides a theoretical and methodological basis for the capacity enlargement of salt cavern gas storage.
2 Materials and experimental methods
2.1 Materials
The salt rock samples used in this paper were drilled from well X, located in Chuzhou interrupted depression structure in the northern Jiangsu basin (Zhang et al., 2014), where the interlayer is widely developed and contains high mudstone insoluble. Fig. 2a shows the salt rock sample drilled from well X, and the black mudstone interlayer can be seen in the figure. Then, a series of treatment measures were carried out to prepare suitable rock samples for the subsequent experiments. The existing data show that the mudstone particles in different layers are quite different and the heterogeneity is strong, as shown in Table 1. Although the size distribution frequency of particles is different, but their expansion rate is quite similar. In order to explore the internal mechanism of insoluble mudstone particle swelling, 100–150 mesh particles with relatively high proportion were selected for expansion test. Limited by experimental equipment, rock salt samples are crushed and stirred evenly with the representative particle of 100–140 mesh. Then, dissolve the salt with distilled water to simulate the solution mining process. Previous experiments (Wang et al., 2022) indicated crystal water in rock powder could be removed at 220 °C. So, the insoluble sediments were put into an oven and dried at 220 °C for 12 h to remove the adsorbed crystal water. Finally, different meshes of the insoluble rock powder were used in the volumetric expansion experiments, especially 100–140 mesh (Fig. 2b).
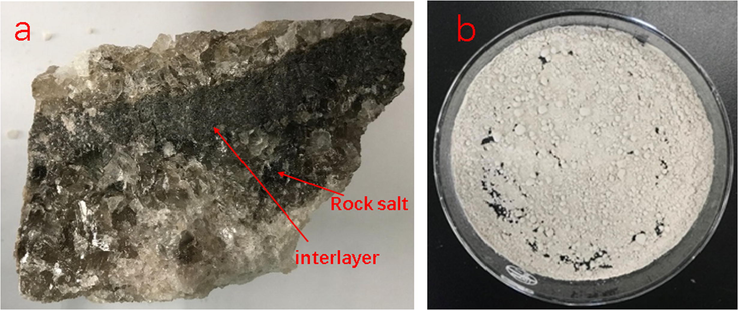
- a: Salt rock sample; b: the treated mudstone power100-140 mesh).
| Mesh | Mass percentage | Swelling rate |
|---|---|---|
| <10 | 35% | 62.50% |
| 10–50 | 11.50% | 65.80% |
| 50–100 | 15% | 68.70% |
| 100–150 | 26.50% | 74.60% |
| 150–200 | 8.50% | 73.40% |
| >200 | 3% | 77.20% |
2.2 XRD and SEM
A D8 ADVANCE XRD (Spectris Corporation, Shanghai, China) was used to analyze the overall mineral composition of salt rocks. The specific steps are summarized as follows: the first step is to crush the rock powder to 400 mesh; the second step is to load the sample into the chamber and depress the spring sheet; the third step is to switch on the instrument for testing and analysis. The minerals in the samples were quantitative analyses using the Rietveld method by least-square iteration. The diffraction pattern is simulated and the initial crystal phase is modified. Thus the best fit between observed and calculated data is produced (Calligaris et al., 2018). The results were normalized to 100% based on the assumption that the mineral contents of the samples were completely accounted for by the XRD patterns (Calligaris et al., 2018; Jin et al., 2021).
To fully understand the salt rock composition and surface microstructure, SEM technology was used to photograph the surface of rock blocks and perform elemental analysis. This method can not only verify the correctness of the XRD results but also provide a data basis for subsequent swelling and shrinkage experiments. The experimental steps are as follows: (1) Put the rock blocks into an electric thermostat and dry them at a constant temperature of 220 °C ± 5 °C for 12 h; (2) After drying, the rock blocks are glued to the metal sheet covered with conductive adhesive; (3) Put the metal sheet with rock blocks into the gold sprayer to spray gold and increase conductivity; (4) Put the gold-sprayed metal sheet into the instrument to detect EDS (single point mineral composition analysis) and MAPPING (element distribution scanning in a region).
2.3 Swelling rate tests
The swelling rate test is an evaluation method of clay stabilizer for fracturing, acidizing, and water injection in oil and gas fields. The procedures can be summarized as follows (Feng et al., 2019): (1) Dry the rock powder sieved 100–140 mesh in an oven at 220 °C for 12 h. (2) Weigh 0.5 g of rock powder into a centrifuge tube, add 10 mL of clay stabilizer solution and shake evenly. (3) After placing at room temperature for 2 h, the mixture was centrifuged at a speed of 1500 r/min for 15 min, and the volume of rock powder was recorded as V1. (4) Weigh 0.5g of rock powder again, repeat the above steps to obtain the volume of rock powder in kerosene, record as V0. Then, the swelling rate can be calculated according to the Equation (1):
2.4 Zeta potential
Zeta potential is a parameter representing the charged state of particles (Yukselen-Aksoy and Kaya, 2011). The absolute value of the zeta potential represents stability, and positive or negative represents the charge of the particles. In this study, zeta potential is mainly used to measure the potential on the surface of rock particles to analyze the swelling mechanism of insoluble mudstones at the bottom of the salt cavern gas storage. Firstly, 5 g of rock powder (mesh > 100) was poured into a beaker and 100 mL of distilled water was added, mixed uniformity, and centrifuged at 1500 r/min for 15mins. Then the supernatant of the centrifuge tube was taken out and detected in the NANOTRAC WAVE II zeta potential instrument.
3 Results and discussion
3.1 Mineral characteristics of salt cavern gas storage
3.1.1 Mineral composition of salt rock
Mineral analysis was performed on 4 samples from the same underground salt cavern, and the results are shown in Table 2. Water-soluble mineral halite (consists of NaCl) is the main component, with an average content of 66.0%. Glauberite (a mixture of sodium sulfate and calcium sulfate) is the second component, with an average content of 11.0%, which is a semi-water-soluble mineral, because sodium sulfate is soluble and calcium sulfate is slightly soluble. The average content of insoluble minerals, such as quartz (silica), albite (sodium silicoaluminate), muscovite, calcite, dolomite, and gypsum, totally account for 23.0%, which is similar to the values reported in the literature (Liu et al., 2009). The ratio of soluble salts (Halite) to insoluble matters is approximately 3:2 in bedded salt layers. During the solution mining of salt cavern, fresh water is injected to dissolve the salt rocks and the brine is expelled to the surface; the insoluble components are gradually released, sedimented, and accumulated at the bottom. According to the field sonar tests (Table 3), the bulk volume of these insoluble sediments accounted for 66.2% of the whole cavern volume. It indicated these insoluble mudstones had undergone volumetric expansion when exposed to water, and the swelling rate was more than twice.
| Sample | Halite | Albite | Quartz | Muscovite | Glauberite | Calcite | Dolomite | chlorite | Pyrite | Gypsum |
|---|---|---|---|---|---|---|---|---|---|---|
| 1# | 79% | – | 2% | 1% | 13% | 2% | – | – | 3% | – |
| 2# | 72% | – | 2% | – | 22% | – | 3% | – | – | 1% |
| 3# | 84% | 4% | 2% | 1% | 4% | 1% | 1% | 1% | 1% | 1% |
| 4# | 29% | 23% | 11% | 4% | 5% | 4% | 16% | 3% | 4% | 1% |
| Average | 66.0% | 6.75% | 4.25% | 1.50% | 11.0% | 1.75% | 5.0% | 1.0% | 2.0% | 0.75% |
| Region | Salt cavity category | Cavity height (m) |
Cavity bottom depth (m) |
The height of insoluble mudstone (m) |
Effective volume (m3) |
The volume of insoluble mudstone m3 |
The total volume (m3) |
The percentage of insoluble mudstone (%) |
|---|---|---|---|---|---|---|---|---|
| ChuZhou | 1# | 200 | 1621 | 120.7 | 244,429 | 479,318 | 723,746 | 66.2 |
| 2# | 200 | 2121 | 120.9 | 258,237 | 506,281 | 764,518 | 66.2 |
3.1.2 Mineral composition of insoluble mudstones
Considering the actual dissolution process, the insoluble mudstones were separated at the bottom of the cavern after the water injection and leaching process. Hence, it is necessary to dissolve and desalinate the rocks through soaking and drying methods to further confirm the mineral and clay composition of the insoluble mudstones. In order to simulate the condition of near-saturated brine during the cavern leaching process, the sample preparation procedure adopted in the experiment is as follows: (1) Add 10 g of water for every 3 g of salt rock powder, stir and dissolve them in a magnetic stirrer for 4 h; (2) Then, perform suction filtration and drying treatments. The mineral composition analysis results of insoluble mudstones are listed in Table 4. The main components of insoluble minerals are albite and quartz, with an average content of 56.25%. Other minerals such as muscovite and calcite account for 37.75%, and the total content of clay minerals is 6.0%. Further tests were conducted to obtain the detailed composition of the clay minerals, and the proportions of the various clays are shown in Fig. 3. Clay minerals are dominated by illite, accounting for 42.1% volume, followed by a mixed layer of chlorite and montmorillonite (C/M), accounting for 26.8%. The mixed layer of illite and montmorillonite (I/M) accounts for 18.6%, and the kaolinite content is only 2.3%. The illite is a potentially hydration component and the montmorillonite is a potentially swelling component (Schmid and Plank, 2021).
| Sample | Albite | Quartz | Muscovite | Calcite | Dolomite | Pyrite | Gypsum | TCCM* |
|---|---|---|---|---|---|---|---|---|
| 1# | 39% | 16% | 5% | 5% | 24% | 5% | 1% | 5% |
| 2# | 28% | 26% | 10% | 12% | 13% | 5% | – | 6% |
| 3# | 36% | 32% | 4% | 11% | 6% | 1% | 3% | 7% |
| 4# | 25% | 23% | 8% | 21% | 5% | 4% | 8% | 6% |
| Average | 32.0% | 24.25% | 6.75% | 12.25% | 12.0% | 3.75% | 3.0% | 6.0% |
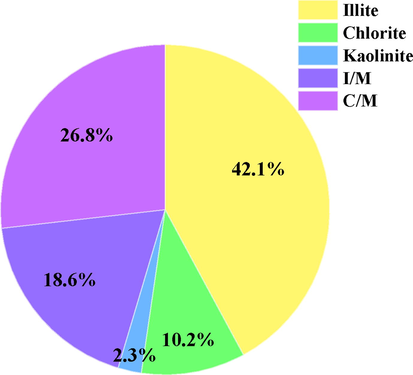
- Clay mineral content distribution.
3.1.3 The microstructure of salt rock surface
SEM observations were conducted on the #2 and #4 samples, with the highest contents of glauberite and albite, respectively. SEM was used to take high-precision photographs of the rock surface under different resolution rates, and EDS was used for elemental analysis. The collaborative application of SEM and EDS can verify not only the correctness of the XRD results but also provide a data basis for the subsequent swelling and shrinking experiments.
Fig. 4 shows the SEM results of sample #2, which contains the highest contents of glauberite of the four samples. According to the SEM test results, it was found in Fig. 4a that the minerals present an obvious irregular loose packing structure, which is a typical feature of halite minerals (Chander et al., 2020). The block structure in Fig. 4b is glauberite with characteristics of a smooth surface (Roberts et al., 2018). Moreover, there are obvious intergranular pores around the glauberite mineral. EDS elemental analysis results show that the block structure in the sample mainly contains elements such as sodium, oxygen, sulfur, calcium, which are consistent with the results of XRD analysis of glauberite mineral (a mixture of calcium sulfate and sodium sulfate). Therefore, the block structure in Fig. 4c is determined to be glauberite.
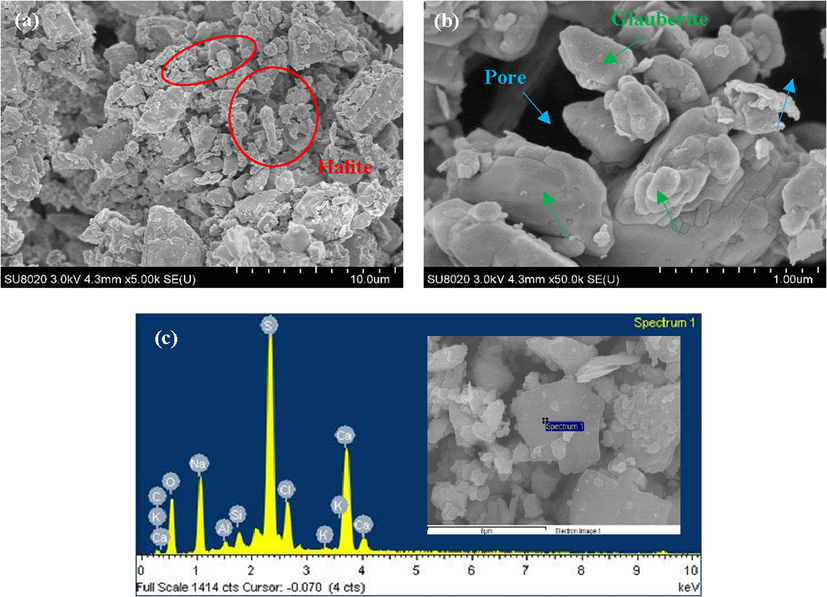
- SEM results of sample #2: (a) resolution rate ∼ 10 μm; (b) resolution rate ∼ 1 μm; (c) EDS elemental analysis.
Fig. 5 shows the SEM results of sample #4, which contains the highest contents of albite of the four samples. Similar to sample #2, the typical irregular loose packing structure of halite can be observed in Fig. 5a as well. At the same time, due to albite content in sample #4 reaching 23%, there are some albite minerals in the image. Fig. 5b shows the enlarged image of the albite mineral surface, the surface of the mineral is relatively flat while showing the characteristics of multilayer accumulation. EDS elemental analysis results show that the selected region in the sample mainly contains elements such as silicon, oxygen, sodium, magnesium, calcium, aluminum, etc. It corresponds to the abundant albite and dolomite minerals in the sample, which proves the accuracy of the XRD experiment results. Therefore, the mineral composition in the purple square area in Fig. 5c mainly includes halite and dolomite.
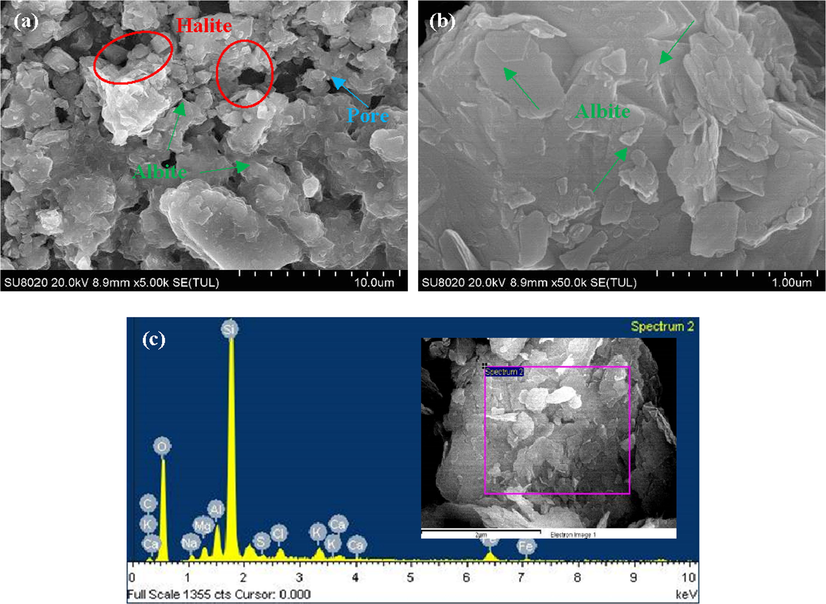
- SEM results of sample #4: (a) resolution rate ∼ 10 μm; (b) resolution rate ∼ 1 μm; (c) EDS elemental analysis.
3.2 Contribution of clay swelling to volumetric expansion
In general, there is a certain amount of expansive clay in the mudstone at the bottom of salt cavern gas storage. The clay minerals' interlayer cations (such as sodium ions, calcium ions, etc.) easily absorb crystal water molecules, resulting in volumetric expansion. This part of crystal water is unable to flow freely and is known as bound water (Zhang and Pei, 2021). Moreover, the surface of non-swelling minerals has a porous structure, which is usually exchanged with ions in the solution. The surface of minerals will be charged by adsorption or release of ions. Some rock particles, such as illite, tend to release soluble cations, making their surface negatively charged. Electrostatic repulsion between these negatively charged grains can lead to greater pore spacing and thus increase the volume of free water among the pore. Therefore, the total volume of the bottom insoluble residuals consists of three parts: insoluble mudstones, bound water, and free water (as shown in Fig. 6). Given the above cognition, two aspects of experimental research were conducted: (i) Determination of the swelling rate of the main swelling clay in different concentrations of brine to illustrate their volumetric expansion ability under actual salt cavern conditions; (ii) Measure the swelling volume of insoluble mudstones in distilled water and clay stabilizer solution respectively, and the contribution of clay swelling for volumetric expansion can be acquired.

- Schematic diagram of mudstone volumetric expansion at the bottom of the cavern.
3.2.1 The swelling rate of clay minerals in brine
Current literature has shown montmorillonite is the dominant swelling clay mineral (Pal et al., 2019; Yekeen et al., 2019). The main mechanism is that montmorillonite has a 2:1 lamellar structure. The interlayer cations can absorb crystalline water molecules and gradually hydrate. The thicker quasi-crystals are dispersed into thinner lamellae and fill the adjacent intergranular pores, resulting in particle swelling. Hence, montmorillonite can be used later as a typical material to study the effect of clay swelling in brine.
According to the above mineral analysis results, the average content of halite in the bedded salt rock formation is 66%, and the concentration of NaCl in the brine will continue to rise during the solution mining process. The average clay content in the bottom mudstones is 6.0%, of which 45.4% is the mixed layer containing montmorillonite, with a certain risk of swelling. Therefore, experiments are required to evaluate the swelling degree of montmorillonite under high salinity brine conditions. It is generally considered that temperature, pressure, and brine concentration are the main factors influencing the swelling of montmorillonite. Among them, brine concentration is the most critical factor. The formation temperature of bedded salt rock formation is approximately 45 °C. So, this study investigated the swelling rate of montmorillonite at different concentrations of salt solutions at room temperature and 45 °C, respectively.
The swelling effect of montmorillonite in distilled water is obvious, and its volume in distilled water is about 9 times as large as in kerosene (Zhou et al., 2019). The insoluble mudstones were mixed evenly with distilled water and kerosene, and their bulk volumes were measured. The swelling volume tested in these experiments is the apparent volume, in which pore volume is included. The volume in distilled water can be regarded as a maximum swelling volume. The volume in kerosene can be considered as un-swelling volume. The ratio of the difference between the two volumes is taken as the swelling rate. Fig. 7 show the variation curves of the swelling rate concerning different NaCl concentrations at room temperature and 45 °C, respectively. It can be seen from the figures that the swelling rate gradually decreases as the concentration of NaCl increases. At room temperature, when the concentration of NaCl is less than 0.5%, the sodium ions in brine had almost no inhibition capacity on the swelling of montmorillonite. However, as NaCl concentration increased, the swelling rate of montmorillonite began to drop sharply. Once the concentration increases to 10%, the swelling rate at room temperature is as low as 6.5%. As the temperature rises, the inhibition effect of the NaCl solution with the same concentration will be further strengthened, and the final swelling rate will close to zero. Experimental results indicate that high salinity brine can effectively inhibit montmorillonite swelling, especially in the leaching process of bedded salt layers with up to 66% halite content. According to the swelling rate, when the NaCl concentration exceeds 10%, the final swelling volume of montmorillonite does not exceed 1.09 times its original volume. The average content of insoluble mudstones in the salt rock is 23%, of which 6% is clay minerals and 45.4% of clay contains montmorillonite, the absolute volume of montmorillonite in mudstones is no more than: 23%*6%*45.4% =0.63%. It is an extremely little volume even though it swells 1.09 times in brine. It indicated that clay swelling is not the main contributor to the volumetric expansion of the bottom mudstones.
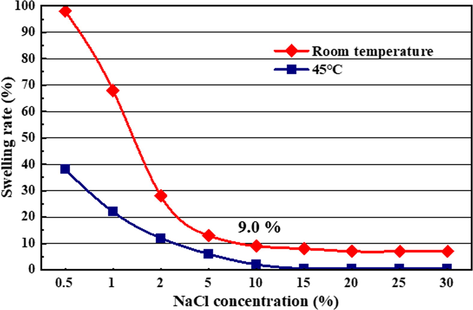
- Variation curve of clay swelling rate with different NaCl concentrations (Room temperature and 45 °C).
3.2.2 Swelling rate of insoluble underground mudstones
Table 5 lists the results from two parallel experiments. Results show that the average swelling rate of insoluble mudstones in distilled water is only 4.95%, which is consistent with the results in Section 3.2.1 (the absolute volume of montmorillonite in mudstones is no more than 0.63%, and its volume in distilled water is about 9 times as large as in kerosene, so the volume after swelling is around 0.63%*9 = 5.67%). It indicated the clay swelling indeed has little contribution to the volumetric expansion of bottom mudstones. Since the volume measured in the swelling rate experiment is the volume after a high-speed centrifuge, it mainly reflects the contribution of bound water to the swelling of mudstones. Therefore, the contribution of loosely packing to the volumetric expansion of mudstones is investigated in the next section.
| Entry | Swelling volume /mL | Swelling rate,% | Average swelling rate, % | |
|---|---|---|---|---|
| Distilled water | Kerosene | |||
| 1 | 7.49 | 7.17 | 4.46 | 4.95 |
| 2 | 7.56 | 7.17 | 5.43 | |
3.3 Contribution of free water in pores to mudstone volumetric expansion
The water solution mining method was used to dissolve the bedded salt layers in the target formation. The mudstones are naturally deposited at the bottom of the cavern, and gravity is the main force that compacts mudstones. Meanwhile, these insoluble mudstones also constantly undergo physicochemical reactions with the brine. On the one hand, the hydration of montmorillonite charges the surface of the particles. On the other hand, some other minerals (e.g., illite) undergo ion exchange or adsorb metal ions in solution, which makes the surface of rock particles charged (Schmid and Plank, 2021). The electrostatic repulsion between rock particles can impede the compaction of the mudstones, increasing the equilibrium distance between particles, thereby enlarging the proportion of pore space of mudstones. Therefore, it is necessary to conduct experiments to determine the compaction volume under gravity and physically compressible volume with manual intervention. So that the proportion of the free water volume can be calculated, and the volumetric expansion mechanism of bottom mudstones can be clarified.
3.3.1 Compaction volume under gravity
The salt rock was ground into 100–140 mesh rock powder. 15 g of rock powder was added to 35 mL NaCl solution with a concentration of 25%, fully shaken, and dissolved. The bulk volume of mudstones is recorded at regular intervals until the volume no longer changes. When the difference between the measurement results is less than 5%, the arithmetic average of the volume is taken as compaction volume under gravity. Fig. 8 compares the initial volume (left) and the final compaction volume (right) of the mudstones after 4 days of settling. Fig. 9 presents the volume of mudstones in brine varies with time under gravity. The volume of 15 g rock powder was 11.6 mL after two hours of free settling and gradually decreased as the settling time increased. The volume reached constant at around 4 days with a final stable volume of 10.3 mL. At this point, there is an equilibrium between gravity and other counterforces, such as the electrostatic force, in the rock particles. So, the volume of the rock powder no longer changes after some time. The experimental results show that gravity compaction works for about 4 days on our laboratory scale. Subsequent experiments will use this volume as a benchmark to determine the effectiveness of the swelling inhibitor by the shrinkage agent.
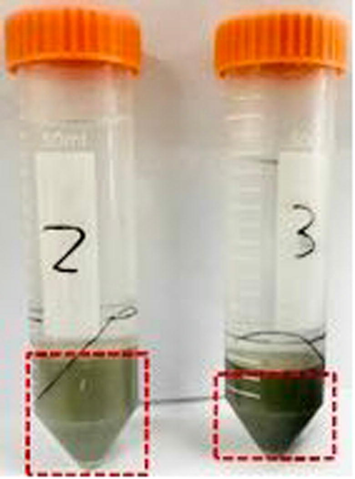
- Compacting process of mudstones under gravity (Left: initial state; Right: 4 days later).
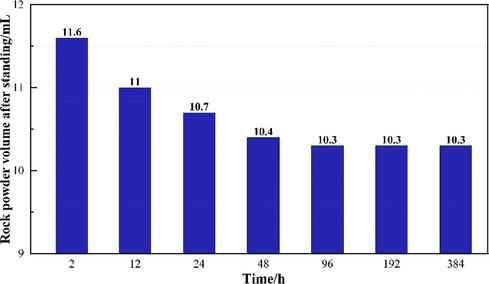
- Compaction volume of mudstones with respect to time under gravity.
3.3.2 Compaction volume after high-speed centrifugation
After 4 days of settlement as described above, the insoluble mudstones were centrifuged to dewater to determine the free water volume. The volume of mudstones was further compressed to 6.6 mL after centrifugation at 1500 rad/min for 15 min, and it continued decreasing to 5.4 mL after centrifugation at 4000 rad/min for 15 min. Once again, if the centrifugation time was prolonged to 30 min at 4000 rad/min, there was no longer change in volume. It indicated the minimum volume had reached under centrifugal conditions. Based on the above experimental results, it can be seen that the volume of 15 g of rock powder after 4 days’ gravity-free settling is 10.3 mL, while the ultimate compacted volume after centrifugation is 5.4 mL. After calculation, the free water content in the pore space after gravity was not less than 4.9 mL, accounting for 47.6% of the total bulk volume of mudstones. Furthermore, the mudstone powder after ultimate centrifugation was dried at 220 °C and subsequently placed in kerosene for second centrifugation. The final volume of insoluble mudstone obtained was 4.8 mL after dried, and the volume of intergranular water could be calculated to be 0.6 mL. Most of it was thought to be bound water, and it occupied 5.83% of the overall volume of mudstones in brine. Fig. 10 summarizes the volume data of rock powder under different treatment methods. The experimentally obtained bound water volume agrees with the average swelling rate of formation mudstones in distilled water (avg. 4.95%), as mentioned in Section 3.2.2. Based on the above experimental results, it can be concluded that the main reason for the volumetric expansion of mudstones at the bottom of the gas storage is the larger spacing between the mudstone particles. It thus increases the overall pore space, where the free water content reaches more than 47%. The experimentally acquired porosity data of this study are exactly consistent with the porosity simulated by Han (Han, 2015) using the discrete element method.
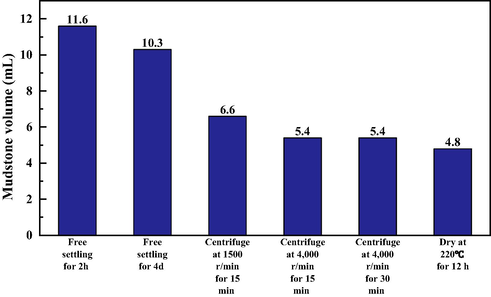
- Mudstone bulk volume in brine after different treatments.
3.4 Volumetric swelling mechanisms of mudstones in brine
The above experimental and theoretical analysis shows that larger pore space is the main reason for the volumetric swelling of the mudstones in the gas storage. Based on previous mass research (Xu et al., 2020; Dong et al., 2021; Fan et al., 2022; Wang et al., 2022; Zakirov and Khramchenkov, 2022; Zheng et al., 2022), electrostatic repulsion is considered to be the most likely factor to increase the pore space of mudstones in brine. The mudstone particles at the bottom of the gas storage are quite small, resulting in a more pronounced electrostatic repulsion effect. Fig. 11 shows the schematic diagram of the mudstone swelling mechanism. In the initial state, mudstone particles are aggregated together and the particle’s surface is not charged. During the solution mining process of the cavern, some mudstone particles are dispersed due to the injection of external water. Parts of clay minerals undergo hydration swelling, and their volume becomes larger. Meanwhile, due to the invasion of water, the surface of the clay minerals is negatively charged. Electrostatic repulsion further increases the distance between the particles, free water rapidly occupies the entire pore space, and the overall volume of the mudstones expands significantly. It is worth noting that the pore space of the mudstones at the bottom of the salt cavern gas storage must be filled with high-salinity brine, and a large number of sodium ions in the brine are adsorbed onto the surface of mineral particles, leading to a reduction in surface potential and weakening of electrostatic repulsion. Therefore, the swelling volume of the mudstones in high-salinity brine is slightly smaller than the swelling volume in distilled water. In this section, the surface zeta potential test of mudstones in different media will be carried out to confirm the proposed mechanism.
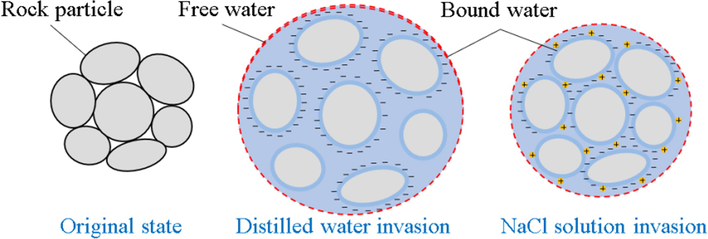
- Schematic diagram of volumetric expansion mechanism of mudstones in brine.
Fig. 12 shows the measured surface zeta potential of mudstone in different brine. The experimental results are consistent with the proposed mechanism. In distilled water, the average surface potential is −27.6 mV, which is strongly negative. As the concentration of NaCl increases, the absolute value of the average surface potential continues to decrease. It indicates that the sodium ions in the solution are constantly being adsorbed onto the surface of the rock particles and counteract some of the negative charges. When the NaCl concentration increases to 20%, the average surface Zeta potential drops to −11.9 mV, and the decrease rate reaches 56.9%. Based on the above mechanism, the authors assume that positively charged inorganic polymers can be used to reduce the mudstone’s volume by compressing the electric double layer, multi-point adsorption, and active film protection (Liang et al., 2019).
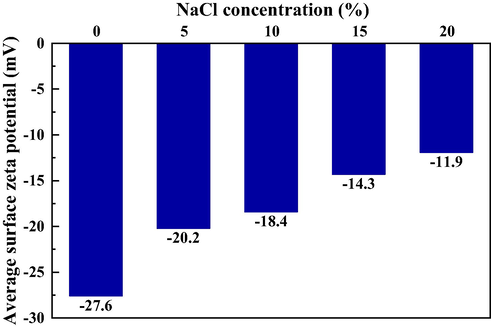
- Average surface Zeta potential in different brine.
Based on the results of the analyses, an inorganic polymer PAC-30 with a positive charge was used for the shrinkage experiments of mudstones in brine. The polymer was obtained by hydrolysis of aluminum trichloride with a chemical formula [Al2(OH)3Cl3]30. The shrinkage experimental steps are as follows: (1) Firstly, 15 g of rock powder was added to 35 mL of 25% NaCl brine, mixed well, and settled for 2 h. The volume of insoluble mudstone is 10.3 mL, which is consistent with the volume testing in Section 3.3.1. (2) Then, the supernatant was poured out for inductively coupled plasma (ICP) detection, and the main cations were Na+, K+, and Ca2+. (3) Add 35 mL mixed solution of 0.02% PAC-30 and 25% NaCl brine into the test tube for 48 h. The final results are shown in Fig. 13, which shows that the shrinking agent can reduce the volume of the mudstones by more than 30%. Experimental results suggest that the above swelling mechanism speculation is correct, and the main mechanism of mudstone volumetric expansion at the bottom of salt cavern gas storage is electrostatic interaction.
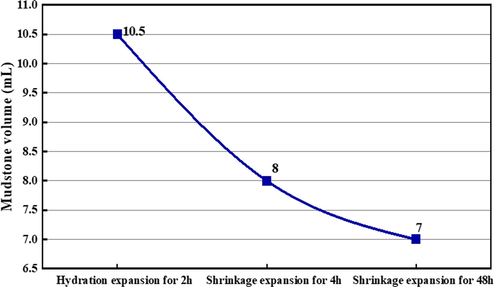
- The volume of mudstones in brine before and after 0.02% inorganic shrinking agent.
4 Conclusions
This paper investigates the main factors for the swelling of insoluble mudstones at the bottom of the salt cavern gas storage from three aspects: reservoir mineral characteristics, clay swelling effect, and free water content. Moreover, the zeta potential tests were conducted to confirm the mechanism of mudstone swelling. Based on the experimental results, the following conclusions can be drawn:
-
Mineral analysis shows that the ratio of soluble salts to insoluble mudstones is approximately 3:2 in salt rock, while the mudstones at the bottom account for 66.2% of the total gas storage volume, indicating these mudstones have undergone volumetric swelling when exposed to brine.
-
Plagioclase and quartz, which are non-swelling components, are the main minerals of the mudstones of the salt cavern. The average content of clay minerals is 6%, mainly non-swelling illite. The percentage content of the montmorillonite mixed layer is about 45.4%, and montmorillonite is the only expansive mineral.
-
The mudstones’ swelling volume comprises three components: clay swelling, particle surface bound water volume, and pore space free water volume increase. Due to the low content of montmorillonite in the mudstone and the high concentration of NaCl solution, clay swelling is not the main reason for the volumetric swelling of mudstones.
-
Electrostatic repulsion can increase the spacing between rock particles, creating approximately 47.6% of the pore space. Brine can occupy the entire pore space, which is the main reason for the volumetric expansion of mudstones.
-
As the concentration of NaCl increases, the sodium ions in the solution continue to adsorb onto the surface of the rock particles, resulting in a downward trend in surface zeta potential, which can reduce mudstone swelling to a certain degree.
-
Based on mechanism considerations, the inorganic polymer PAC-30 is carefully selected as a shrinking agent for the insoluble mudstone, and the maximum shrinking efficiency is up to 30%.
Acknowledgement
This research was financially supported by the National Natural Science Foundation of China (Grant Nos. 52004306 and 52174045), the Strategic Cooperation Technology Projects of CNPC and CUPB (Grant Nos. ZLZX2020-01 and ZLZX2020-02), and the National Science and Technology Major Projects of China (Grant Nos. 2016ZX05030005 and 2016ZX05051003).
Declaration of Competing Interest
The authors declare that they have no known competing financial interests or personal relationships that could have appeared to influence the work reported in this paper.
References
- Waste disposal in horizontal solution mined caverns, considerations of site location, cavern stability, and development considerations. Albuquerque (NM): Sandia National Laboratories, Underground Storage Technology, Department; 1998. p. :6113.
- On the quantitative phase analysis and amorphous content of triacylglycerols materials by X-ray Rietveld method. Chem. Phys. Lipids. 2018;212:51-60.
- [Google Scholar]
- Structural characterization of Himalayan black rock salt by SEM, XRD and in-vitro antioxidant activity. Sci. Total Environ.. 2020;748:141269
- [Google Scholar]
- Insoluble deposit in salt cavern-test case. In: Proc of Solution Mining Research Institute Fall Meeting. 2002.
- [Google Scholar]
- Towards carbon neutrality by implementing carbon emissions trading scheme: Policy evaluation in China. Energy Policy.. 2021;157:112510
- [Google Scholar]
- Stability study and optimization design of small-spacing two-well (SSTW) salt caverns for natural gas storages. J. Storage Mater.. 2020;27:101131
- [Google Scholar]
- Experimental investigation on bulking expansion coefficient of sediment of storage in bedded salt. Mining Res. Develop.. 2013;33:34-37.
- [Google Scholar]
- Investment strategy for underground gas storage facilities based on real option model considering gas market reform in China. Energy Econ.. 2018;70:132-142.
- [Google Scholar]
- Effect of polyvinyl alcohol/aluminum microcapsule expansion agent on porosity and strength of cement-based drilling sealing material. Energy.. 2021;224:119966
- [Google Scholar]
- Effect of hydration on Pore Structure and Physical Properties of Permian Basalt and tuff in Sichuan Basin during pressurized imbibition. J. Petrol. Sci. Eng.. 2022;213:110322
- [Google Scholar]
- Status and development trend of solution mining technologies used for salt-cavern gas storage. Oil Gas Storage Transport.. 2017;36:754-758.
- [Google Scholar]
- Rock Salt Grades Influences on Salt Cavity Gas Storage Built with Water Solution. Nat. Gas. Ind.. 2006;26:115.
- [Google Scholar]
- Preparation of a cationic hyperbranched polymer for inhibiting clay hydration swelling in the process of oilfield waterflooding. Energy Fuels. 2019;33:12202-12212.
- [Google Scholar]
- Salt caverns history and geomechanics towards future natural gas strategic storage in Brazil. J. Nat. Gas Sci. Eng.. 2019;72:103006.
- [Google Scholar]
- Natural gas consumption and economic development in China and Japan: An empirical examination of the Asian context. Renew. Sustain. Energy Rev.. 2016;56:100-115.
- [Google Scholar]
- Study on insoluble matter volume at bottom of salt cavern gas storage. Southwest Petroleum University; 2015.
- Optimal cost and design of an underground gas storage by ANFIS. J. Nat. Gas Sci. Eng.. 2019;61:142-157.
- [Google Scholar]
- XRD and TEM analyses of a simulated leached rare earth ore deposit: Implications for clay mineral contents and structural evolution. Ecotoxicol. Environ. Saf.. 2021;225:112728
- [Google Scholar]
- A prediction model of the accumulation shape of insoluble sediments during the leaching of salt cavern for gas storage. J. Nat. Gas Sci. Eng.. 2016;33:792-802.
- [Google Scholar]
- Formation, extracellular polymeric substances and microbial community of aerobic granules enhanced by microbial flocculant compared with poly-aluminum chloride. J. Cleaner Prod.. 2019;220:544-552.
- [Google Scholar]
- Natural gas consumption of urban households in China and corresponding influencing factors. Energy Policy.. 2018;122:17-26.
- [Google Scholar]
- Distribution and structural fabric features of mudstone interlayer of rock salt in underground gas storage. Chin J. Rock. Soil Mech.. 2009;30:3627-3632.
- [Google Scholar]
- Physical simulation of construction and control of two butted-well horizontal cavern energy storage using large molded rock salt specimens. Energy.. 2019;185:682-694.
- [Google Scholar]
- The role of natural gas and its infrastructure in mitigating greenhouse gas emissions, improving regional air quality, and renewable resource integration. Prog. Energy Combust. Sci.. 2018;64:62-92.
- [Google Scholar]
- Gemini surfactant/polymer/silica stabilized oil-in-water nanoemulsions: Design and physicochemical characterization for enhanced oil recovery. J. Petrol. Sci. Eng.. 2019;183:106464
- [Google Scholar]
- Engravings and rock coatings at Pudjinuk Rockshelter No. 2, South Australia. J. Archaeolog. Sci.: Rep.. 2018;18:272-284.
- [Google Scholar]
- Interaction of individual meta clays with polycarboxylate (PCE) superplasticizers in cement investigated via dispersion, zeta potential and sorption measurements. Appl. Clay Sci.. 2021;207:106092
- [Google Scholar]
- The transition pathway of energy supply systems towards carbon neutrality based on a multi-regional energy infrastructure planning approach: A case study of China. Energy.. 2022;238:122037
- [Google Scholar]
- Market analysis of natural gas for district heating in China. Energy Procedia. 2015;75:2713-2717.
- [Google Scholar]
- Verification of a model for estimating the void fraction in a three-component randomly packed bed. Powder Technol.. 1985;43:147-153.
- [Google Scholar]
- Green development growth momentum under carbon neutrality scenario. J. Cleaner Prod.. 2021;316:128327
- [Google Scholar]
- Change mechanism of pore structure and filling efficiency during injection production of sandstone underground gas storage. J. Nat. Gas Sci. Eng.. 2022;97:104366
- [Google Scholar]
- Safety evaluation of salt cavern gas storage close to an old cavern. Int. J. Rock Mech. Min. Sci.. 2016;83:95-106.
- [Google Scholar]
- Salt cavern gas storage in an ultra-deep formation in Hubei, China. Int. J. Rock Mech. Min. Sci.. 2018;102:57-70.
- [Google Scholar]
- Pressure-induced crystallization and densification of amorphized calcium carbonate hexahydrate controlled by interfacial water. J. Colloid Interface Sci.. 2022;611:346-355.
- [Google Scholar]
- Warren, J.K., 2006. Solution mining and cavern use. Evaporites: Sediments, Resources and Hydrocarbons. 893–943.
- Tightness and suitability evaluation of abandoned salt caverns served as hydrocarbon energies storage under adverse geological conditions (AGC) Appl. Energy. 2016;178:703-720.
- [Google Scholar]
- Effect of water intrusion on the characteristics of surface morphology and pore fracture spaces in argillaceous meagre coal. J. Nat. Gas Sci. Eng.. 2020;81:103404
- [Google Scholar]
- Synergistic effects of nanoparticles and surfactants on n-decane-water interfacial tension and bulk foam stability at high temperature. J. Petrol. Sci. Eng.. 2019;179:814-830.
- [Google Scholar]
- A study of factors affecting on the zeta potential of kaolinite and quartz powder. Environ. Earth Sci.. 2011;62:697-705.
- [Google Scholar]
- Effect of pore space heterogeneity on the adsorption dynamics in porous media at various convection-diffusion and reaction conditions: A lattice Boltzmann study. J. Petrol. Sci. Eng. 2022:110300.
- [Google Scholar]
- Stability and tightness evaluation of bedded rock salt formations for underground gas/oil storage. Acta Geotech.. 2014;9:161-179.
- [Google Scholar]
- Determining the bound water content of montmorillonite from molecular simulations. Eng. Geol.. 2021;294:106353
- [Google Scholar]
- Natural gas market and underground gas storage development in China. J. Storage Mater.. 2020;29:101338
- [Google Scholar]
- Feasibility analysis of salt cavern gas storage in extremely deep formation: A case study in China. J. Storage Mater. 2021:103649.
- [Google Scholar]
- Multi-scale pore structure, pore network and pore connectivity of tight shale oil reservoir from Triassic Yanchang Formation, Ordos Basin. J. Petrol. Sci. Eng.. 2022;212:110283
- [Google Scholar]
- Co-intercalation of organic cations/amide molecules into montmorillonite with tunable hydrophobicity and swellability. Appl. Clay Sci.. 2019;179:105157
- [Google Scholar]


